
Assessment of Carbon Density in Natural Mountain Forest Ecosystems at Northwest China


Abstract
1. Introduction
- (1)
- The biomass, carbon content ratio, carbon density and carbon storage in different parts of forest ecosystems, such as trunk, branch, leaf, herb, etc., have no obvious difference in age groups (H0), or they are highly related to age groups (H1) of the natural mountain forest inside study area.
- (2)
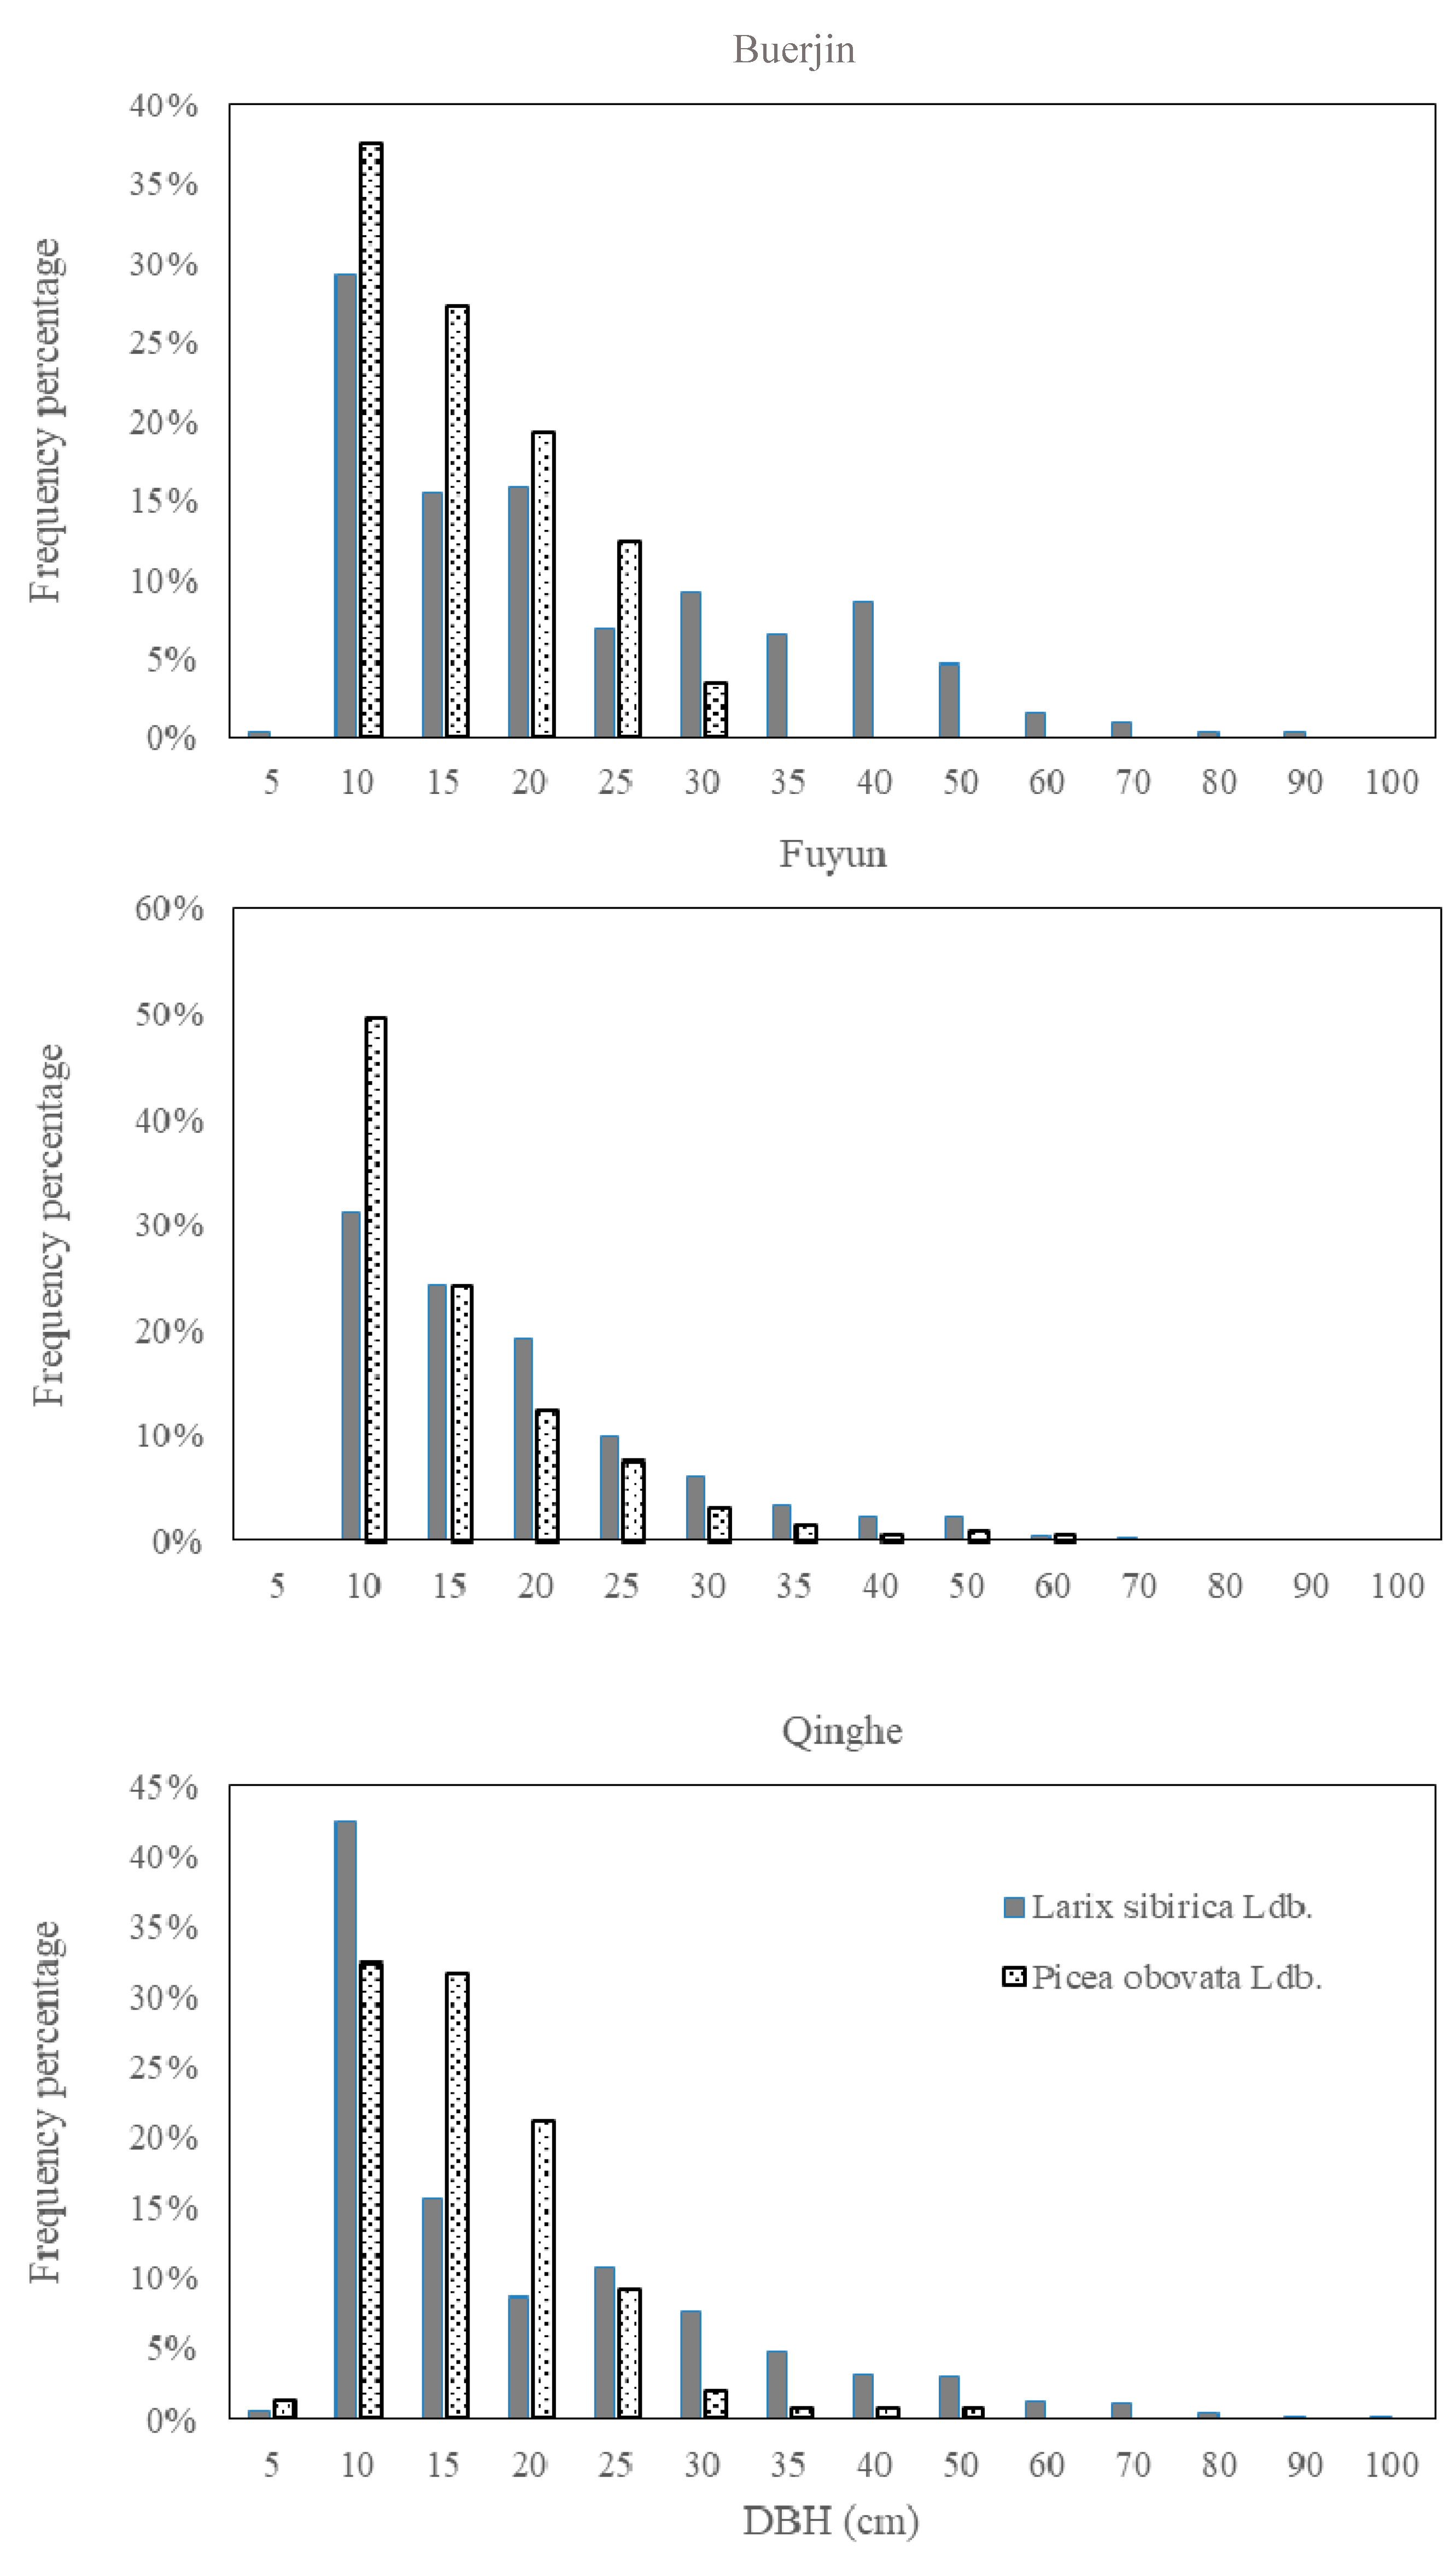
- The variation of tree species (composition and DBH pattern) is not related to forest age groups and soil carbon (H0), or there is a relation (H1) in the natural mountain forest of arid central Asia.
2. Materials and Methods
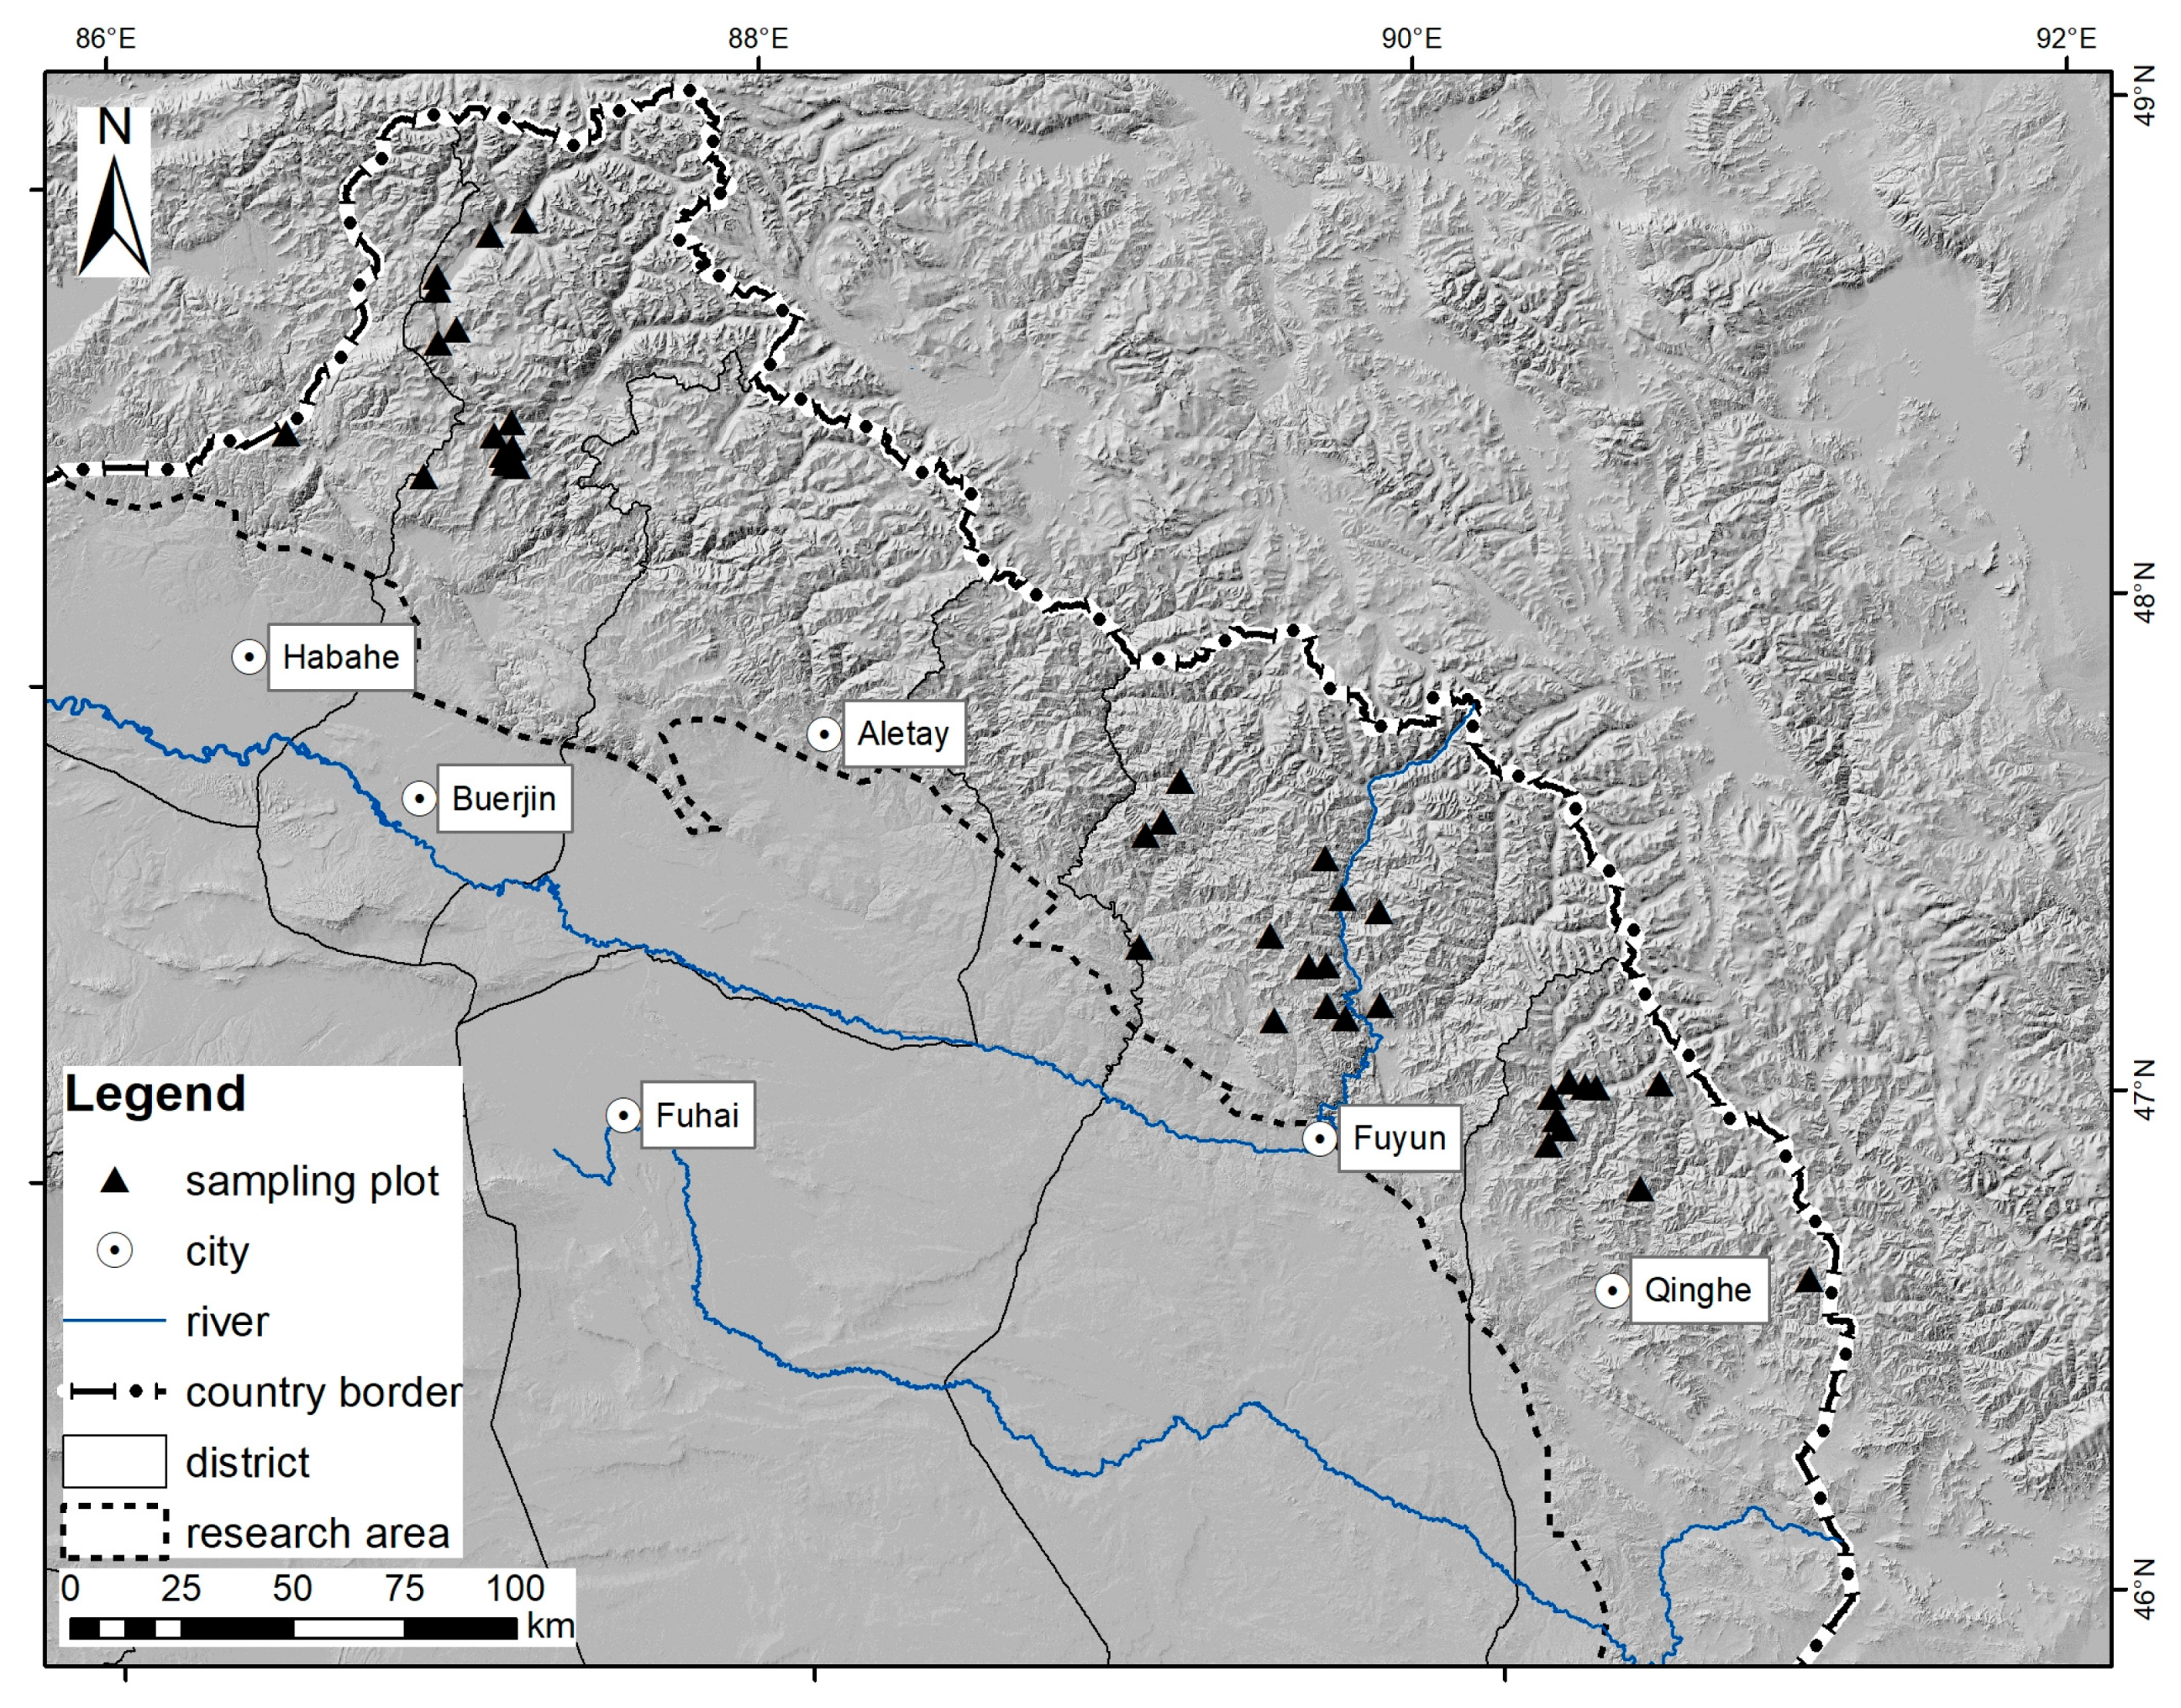
2.1. Study Area
2.2. Data Collection and Analysis
2.2.1. Field Sampling and Measurements
- Soil: one soil profiles were randomly selected in each sampling plot. At each profile, three soil samples were collected at each depth (0–10, 10–20, 20–30, 30–50 and 50–100 cm). If the soil depth of some locations was less than 100 cm, the soil samples were taken until the soil parent materials was reached. The soil samples were air-dried, crushed and passed through a sieve, and then the soil organic matter (OM) was determined by potassium dichromate external heating method.
- Trees: diameter at breast height (DBH) (at 1.3 m above ground) and tree height were measured for all the trees which DBH was larger than or equal to five centimeters (DBH ≥ 5 cm) [23]. Therefore, 2348 trees were measured in 35 sampling plots.
- Herb and litter layers: three small quadrats (1 m × 1 m) were randomly selected in each sampling plot (800 m2). Inside 105 quadrats, all the above-ground part and underground roots of grass, and all the litters were collected. The fresh weight was measured at field, and dry weight was measured in the lab.
2.2.2. Biomass Calculation
2.2.3. Forest Carbon Density and Carbon Storage
3. Results
3.1. Carbon Content Ratio and Biomass
3.2. Carbon Density and Carbon Storage
3.3. Spatial Distribution of Carbon Density
4. Discussion
4.1. The Factors Influencing Biomass and Carbon Density Estimations
4.2. The Causes of Forest Carbon Density Distribution
4.3. Forest Carbon Storage and Forest Structure
5. Conclusions
- (1)
- The average biomass of the Altai Mountains natural forest ecosystems is 126.67 t·hm−2. Trees have the highest biomass (120.84 t·hm−2), followed by herb (4.22 t·hm−2) and litter layer (1.61 t·hm−2). Among the tree parts, trunks, roots, leaves and branches accounted for 50%, 22%, 16% and 12% of the total tree biomass, respectively.
- (2)
- The average carbon content ratio is 0.49, the average carbon density is 205.72 t·hm−2, and the carbon storage is 131.35 Tg in Altai Mountains forest ecosystems. Soil and tree layers are the main local carbon pools.
- (3)
- Forest age has significant effect on biomass, carbon content ratio, carbon density and carbon storage. For parts of tree and forest ecosystems, forest age effect for carbon content ratio was the most obvious, while the biomass of trunk and carbon density of trunk and root were significantly correlated with forest age.
- (4)
- The change of dominant species coincides with the spatial pattern of vegetation carbon density inside study area, which implies a potential increase of local carbon storage in the future.
Supplementary Materials
Author Contributions
Funding
Institutional Review Board Statement
Informed Consent Statement
Conflicts of Interest
References
- Griggs, D.J.; Noguer, M. Climate change 2001: The scientific basis. Contribution of Working Group I to the Third Assessment Report of the Intergovernmental Panel on Climate Change. Weather 2002, 57, 267–269. [Google Scholar] [CrossRef]
- Guang, Q.; Qi, G.; Wang, Q.; Wang, X.; Yu, D.; Zhou, L.; Zhou, W.; Peng, S.; Dai, L. Soil organic carbon storage in different aged Larix gmelinii plantations in Great Xing’an Mountains of Northeast China. Chin. J. Appl. Ecol. 2013, 24, 10–16. [Google Scholar]
- Fang, J.; Chen, A.; Peng, C.; Zhao, S.; Ci, L. Changes in Forest Biomass Carbon Storage in China between 1949 and 1998. Science 2001, 292, 2320–2322. [Google Scholar] [CrossRef]
- Chen, Y.; Luo, G.; Ye, H.; Wang, Y.; Huang, X.; Zhang, Q.; Cai, P. Sources and Sinks of Carbon Caused by Forest Land Use Change from 1975 to 2005 in Central Asia. J. Nat. Resour. 2015, 30, 397–408. [Google Scholar]
- Nowak, D.; Crane, D. Carbon storage and sequestration by urban trees in the USA. Environ. Pollut. 2002, 116, 381–389. [Google Scholar] [CrossRef]
- McGarvey, J.C.; Thompson, J.R.; Epstein, H.; Shugart, H. Carbon storage in old-growth forests of the Mid-Atlantic: Toward better understanding the eastern forest carbon sink. Ecology 2015, 96, 311–317. [Google Scholar] [CrossRef]
- Wang, W.; He, H.; Thompson, F.; Fraser, J.; Dijak, W. Changes in forest biomass and tree species distribution under climate change in the northeastern United States. Landsc. Ecol. 2017, 32, 1399–1413. [Google Scholar] [CrossRef]
- Zhang, C.; Ju, W.; Chen, J.; Zan, M.; Li, D.; Zhou, Y.; Wang, X. China’s forest biomass carbon sink based on seven inventories from 1973 to 2008. Clim. Chang. 2013, 118, 933–948. [Google Scholar] [CrossRef]
- Fang, J.; Chen, A. Dynamic forest biomass carbon pools in China and their significance. Acta Bot. Sin. 2001, 43, 967–973. [Google Scholar]
- Liu, W.; Wang, X.; Lu, F.; Ouyang, Z. Regional and global estimates of carbon stocks and carbon sequestration capacity in forest ecosystems. Chin. J. Appl. Ecol. 2015, 26, 2881–2890. [Google Scholar]
- Lambert, M.-C.; Ung, C.; Raulier, F. Canadian national tree aboveground biomass equations. Can. J. For. Res. Rev. Can. De Rech. For. Can. J For. Res. 2005, 35, 1996–2018. [Google Scholar] [CrossRef]
- Cienciala, E.; Černý, M.; Tatarinov, F.; Apltauer, J.; Exnerová, Z. Biomass functions applicable to Scots pine. Trees 2006, 20, 483–495. [Google Scholar] [CrossRef]
- Zhao, B. Development status and strategies of forest ecosystem in Xinjiang. For. Xinjiang 2009, 3, 6–10. [Google Scholar]
- Liang, Y.; Liu, X.; Habai, Y.; Xu, G. The analysis of Forest combustible type in Altai. Forest Fire Prev. 2006, 4, 16–17. [Google Scholar]
- Ni, J. Forest productivity of the Altay and Tianshan Mountains in the dryland, northwestern China. For. Ecol. Manag. 2004, 202, 13–22. [Google Scholar] [CrossRef]
- Zhou, G.; Wang, Y.; Jiang, Y.; Yang, Z. Estimating biomass and net primary production from forest inventory data: A case study of China’s Larix forests. For. Ecol. Manag. 2002, 169, 149–157. [Google Scholar] [CrossRef]
- Zhang, R.; Shang, H.; Yuan, Y.; Wei, W.; Zhang, T.; Chen, F.; Yu, S.; Fan, Z.; Qin, L. Summer precipitation variation in the southern slope of the Altay Mountains recoreded by tree-ring δ13 C. J. Desert Res. 2015, 1, 106–112. [Google Scholar]
- Nuerlan, H. Hydrological features of rivers in Altai prefecture. Hydrology 2001, 21, 53–55. [Google Scholar]
- The Forest Department of Xinjiang Uygur Autonomous Region. Forest Soil of Xinjiang Mountain Region; Xinjiang Science Technology and Hygiene Publishing House: Urumqi, China, 1995. [Google Scholar]
- Chinese Ministry of Forestry. Forest Resource Report of China—The 7th National Forest Resources Inventory; China Forestry Publishing House: Beijing, China, 2009. [Google Scholar]
- IPCC. IPCC Guidelines for National Greenhouse Gas Inventories. 2006. Available online: http://www.Ipcc-nggip.iges.or.jp/public/2006gl/index.html (accessed on 15 July 2015).
- Xu, B.; Guo, Z.; Piao, S.; Fang, J. Biomass carbon stocks in China’s forests between 2000 and 2050: A prediction based on forest biomass-age relationships. Sci. China Life Sci. 2010, 53, 776–783. [Google Scholar] [CrossRef]
- Forest Resources Management Division of the State Forestry Bureau. Main Technical Requirements of the National Forest Resources Continuous Inventory; Forest Resources Management Division of the State Forestry Bureau: Beijing, China, 2013. [Google Scholar]
- Luo, Y.; Zhang, X.; Wang, X.; Zhu, J.; Hou, Z.; Zhang, Z. Forest Biomass Estimation Methods and Their Prospects. Sci. Silvae Sin. 2009, 45, 129–134. [Google Scholar]
- Office of Forest Carbon Fixation Project. Biomass Estimation Equation, 1st ed.; Strategic Pilot Projects of Chinese Academy of Sciences—The Projects about Authentication of Responses of Carbon Receipts and Expenditure on Climate Change and Related Issues—The Porjects on the Status, Rate, Mechanism and Potential of Carbon Equestration in Forest Ecosystem in China; Chinese Academy of Sciences: Beijing, China, 2014. [Google Scholar]
- Liang, Q.; Yu, X.; Pang, Z.; Wang, C.; Lv, X. Study on soil organic carbon density of different forest types. Ecol. Environ. Sci. 2010, 4, 889–893. [Google Scholar]
- Liu, S.; Zhou, T.; Shu, Y.; Dai, M.; Wei, L.; Zhang, X. The estimating of the spatial distribution of forest biomass in China based on remote sensing and downscaling techniques. Acta Ecol. Sin. 2012, 8, 2320–2330. [Google Scholar]
- Wang, X.; Chang, Y.; Chen, H.; Hu, Y.; Feng, Y.; WU, W.; Jiao, L. Biomass allocation characteristics of the main forest ecosystems in the Great Xing’an Mountains, Heilongjiang Province. Chin. J. Ecol. 2014, 33, 1437–1444. [Google Scholar]
- Taylor, A.; Wang, J. Carbon storage in a chronosequence of red spruce (Picea rubens) forests in central Nova Scotia, Canada. Can. J. For. Res. 2007, 37, 2260–2269. [Google Scholar] [CrossRef]
- Wang, X.; Feng, Z.; Ouyang, Z. Vegetation carbon storage and density of forest ecosystems in China. Chin. J. Appl. Ecol. 2001, 12, 13–16. [Google Scholar]
- Zhao, M.; Zhou, G. Carbon Storage of Forest Vegetation and its Relationship with Climatic Factors. Sci. Geogr. Sin. 2004, 24, 50–54. [Google Scholar] [CrossRef]
- Cheng, T.; Feng, J.; Ma, Q.; Wang, Y.; Kang, F.; Feng, Z.; Zhang, Y.; Deng, X. Carbon pool and allocation of forest vegetations in Xiaolong Mountains, Gansu Province. Acta Ecol. Sin. 2008, 1, 33–44. [Google Scholar]
- Zhou, Y.; Yu, Z.; Zhao, S. Carbon storage and budget of major Chinese forest types. Acta Phytoecol. Sin. 2000, 24, 518–522. [Google Scholar]
- Tang, X.; Zhao, X.; Bai, Y.; Tang, Z.; Wang, W.; Zhao, Y.; Wan, H.; Xie, Z.; Shi, X.; Wu, B.; et al. Carbon pools in China’s terrestrial ecosystems: New estimates based on an intensive field survey. Proc. Natl. Acad. Sci. USA 2018, 115, 4021–4026. [Google Scholar] [CrossRef]
- Usol’tsev, V.; Shobairi, S.O.R.; Chasovskikh, V. Geographic gradients of forest biomass of two needled pines on the territory of Eurasia. Ecol. Quest. 2018, 29, 9–17. [Google Scholar]
- Gu, F.; Pang, R.; Zhang, Y.; Huang, M.; Li, J.; Hao, W.; Mei, X. Temporal-spatial Variations of Soil Organic Carbon and Their Responses to Climate Change in Alpine Area of Southwest China during 1954–2010. J. Nat. Resour. 2014, 29, 1930–1943. [Google Scholar]
- Zhao, Y. Preliminary study on natural succession law of Larix sibirica forest. Xinjiang Agric. Sci. 1983, 30–32. [Google Scholar]
- Luyssaert, S.; Schulze, E.D.; Börner, A.; Knohl, A.; Hessenmöller, D.; Law, B.; Ciais, P.; Grace, J. Old-growth forests as global carbon sinks. Nature 2008, 455, 213–215. [Google Scholar] [CrossRef]
- Zhou, G.; Liu, S.; Li, Z.A.; Zhang, D.; Tang, X.; Zhou, C.; Yan, J.; Mo, J. Old-Growth Forests Can Accumulate Carbon in Soils. Science 2007, 314, 1417. [Google Scholar] [CrossRef]


| Age Group | Age (a) | No. of Tree Samples | Forest Area Statistics | DBH (cm) | Tree Height (m) | |||
|---|---|---|---|---|---|---|---|---|
| Area (×104 hm2) | Proportion (%) | Range | Mean | Range | Mean | |||
| Young forest | ≤40 | 144 | 1.42 | 2.27 | 9.20–12.50 | 10.85 | 8.10–9.10 | 8.6 |
| Middle-aged forest | 41–80 | 316 | 9.99 | 15.93 | 10.06–15.06 | 12.72 | 8.43–15.01 | 11.10 |
| Near-mature forest | 81–100 | 568 | 12.25 | 19.54 | 12.08–18.65 | 15.55 | 9.82–13.40 | 11.87 |
| Mature forest | 101–140 | 427 | 20.09 | 32.04 | 14.00–21.01 | 17.83 | 11.42–14.66 | 12.89 |
| Old-growth forest | >140 | 893 | 18.94 | 30.22 | 15.48–37.55 | 24.32 | 11.15–18.30 | 14.67 |
| Region | No. of Sampling Plot | Average Number of Trees in the Plots | Dominant Species | Mean of the DBH (cm) | Mean of the Tree Height (m) | Vegetation Carbon Density (t·hm−2) | |
|---|---|---|---|---|---|---|---|
| Type | Ratio to the Trees in Plots (%) | ||||||
| Habahe | 1 | 52 | Larix sibirica Ldb. | 9.6 | 50.9 | 23.5 | 76.86 |
| Picea obovata Ldb. | 88.5 | 11.3 | 11.1 | ||||
| Buerjin | 11 | 49 | Larix sibirica Ldb. | 56.0 | 20.5 | 14.3 | 66.03 |
| Picea obovata Ldb. | 16.1 | 13.1 | 10.4 | ||||
| Fuyun | 13 | 83 | Larix sibirica Ldb. | 68.5 | 16.1 | 12.6 | 66.11 |
| Picea obovata Ldb. | 19.7 | 12.5 | 10.1 | ||||
| Qinghe | 10 | 68 | Larix sibirica Ldb. | 79.3 | 17.2 | 12.7 | 78.76 |
| Picea obovata Ldb. | 20.7 | 13.5 | 10.1 | ||||
| mean | 63 | 19.4 | 13.1 | 71.94 | |||
| Dominant Species | Biomass Equation | R2 | DBH Range (cm) |
|---|---|---|---|
| Larix sibirica | WS = 0.099496(D2H)0.78653 | 0.990 | 1.2~37.0 |
| WB = 0.098620(D2H)0.598367 | 0.990 | ||
| WL = 0.294136(D2H)0.357506 | 0.990 | ||
| WR = 0.00698(D2H)0.9724 | 0.998 | ||
| Picea obovata Abies sibirca | WS = 0.1283(D2H)0.7534 | 0.913 | 4.3~128.4 |
| WB = 0.093(D2H)0.6732 | 0.913 | ||
| WL = 0.7753(D2H)0.5903 | 0.913 | ||
| WR = 0.1002(D2H)0.6674 | 0.913 | ||
| Betula pendula Populus tremula | WS = 0.6039(D2H)0.5325 | 0.959 | 1.5~69.2 |
| WB = 1.016(D2H)0.3922 | 0.957 | ||
| WL = 0.6989(D2H)0.2475 | 0.960 | ||
| WR = 0.8207(D2H)0.3878 | 0.956 |
| Age Group | Tree | Herb | Litter | |||
|---|---|---|---|---|---|---|
| Trunk | Branch | Leaf | Root | |||
| Young forest | 0.52 (0.02) A,B | 0.50 (0.02) B,C | 0.50 (0.02) A,B | 0.49 (0.02) B | 0.42 (0.04) a,b,c | 0.51 (0.01) A,B |
| Middle-aged forest | 0.51 (0.02) B | 0.49 (0.01) C | 0.50 (0.02) B,C | 0.48 (0.02) B | 0.39 (0.04) c | 0.50 (0.01) B |
| Near mature forest | 0.51 (0.01) B | 0.49 (0.01) C | 0.50 (0.02) B | 0.49 (0.02) B | 0.40 (0.03) c | 0.50 (0.01) B |
| Mature forest | 0.52 (0.00) A | 0.53 (0.01) A | 0.51 (0.01) A,C | 0.51 (0.01) A | 0.42 (0.01) b | 0.52 (0.01) A |
| Old-growth forest | 0.53 (0.00) A | 0.51 (0.03) A,B | 0.52 (0.01) A | 0.51 (0.01) A | 0.43 (0.01) a | 0.52 (0.01) A |
| Mean | 0.52 (0.01) | 0.50 (0.02) | 0.51 (0.02) | 0.50 (0.02) | 0.41 (0.03) | 0.51 (0.01) |
| F value | 4.03 ** | 7.71 ** | 4.12 ** | 12.37 ** | 3.44 * | 5.32 ** |
| Age Group | Tree | Herb | Litter | Total | |||
|---|---|---|---|---|---|---|---|
| Trunk | Branch | Leaf | Root | ||||
| Young forest | 31.92 (24.24) b | 8.78 (4.29) | 24.56 (10.68) | 14.45 (12.91) | 6.34 (5.15) | 1.33 (0.87) | 87.38 (55.49) |
| Middle-aged forest | 51.46 (17.03) a,b | 16.56 (8.50) | 23.57 (16.98) | 21.83 (9.72) | 3.00 (3.99) | 1.37 (1.55) | 117.79 (40.38) |
| Near mature forest | 62.25 (18.48) a,b | 14.46 (5.54) | 20.10 (15.85) | 24.84 (6.81) | 3.88 (4.93) | 1.76 (1.11) | 127.29 (32.05) |
| Mature forest | 80.86 (26.39) a | 15.07 (4.84) | 12.08 (10.47) | 32.94 (12.13) | 4.23 (3.88) | 1.77 (0.72) | 146.95 (44.78) |
| Old-growth forest | 78.19 (31.56) a | 14.93 (7.31) | 17.82 (20.43) | 37.47 (18.15) | 3.63 (2.52) | 1.85 (1.01) | 153.89 (66.34) |
| Mean | 60.94 (28.51) | 13.96 (5.93) | 19.63 (15.12) | 26.31 (14.19) | 4.22 (3.81) | 1.61 (0.93) | 126.67 (50.49) |
| F value | 2.98 * | 0.81 | 0.70 | 2.56 | 0.34 | 0.16 | |
| Age Group | Carbon Density (t·hm−2) | Carbon Stock (Tg) | ||||||
|---|---|---|---|---|---|---|---|---|
| Tree | Herb | Litter | Soil | |||||
| Trunk | Branch | Leaf | Root | |||||
| Young forest | 16.76 (12.98) b | 4.43 (2.29) | 12.42 (5.55) | 7.24 (6.60) c | 2.77 (2.28) | 0.67 (0.47) | 134.26 (12.98) | 2.55 (0.69) |
| Middle-aged forest | 26.16 (8.08) a,b | 8.04 (4.05) | 11.55 (8.13) | 10.45 (4.41) a,b,c | 1.28 (1.77) | 0.70 (0.81) | 171.72 (110.03) | 22.96 (6.18) |
| Near mature forest | 31.82 (9.26) a,b | 7.08 (2.77) | 10.08 (8.12) | 11.98 (3.17) b | 1.65 (2.17) | 0.89 (0.56) | 145.92 (53.55) | 25.65 (6.39) |
| Mature forest | 42.40 (13.88) a | 7.93 (2.56) | 6.17 (5.39) | 16.91 (6.19) a,b | 1.81 (1.65) | 0.92 (0.38) | 132.86 (56.92) | 41.99 (9.56) |
| Old-growth forest | 41.28 (16.53) a | 7.68 (3.84) | 9.29 (10.57) | 19.24 (9.36) a | 1.58 (1.11) | 0.96 (0.52) | 121.67 (35.85) | 38.21 (8.19) |
| Total | 131.35 (31.01) | |||||||
| Mean | 31.68 (15.00) | 7.03 (3.07) | 9.90 (7.72) | 13.16 (7.36) | 1.82 (1.66) | 0.82 (0.48) | 141.29 (53.90) | |
| F value | 3.19 * | 0.85 | 0.64 | 2.96 * | 0.35 | 0.18 | 0.68 | |
| Region | Lower Limit of Tree Line (m a.s.l.) | Upper Limit of Tree Line (m a.s.l.) | Carbon Density (t·hm−2) | ||
|---|---|---|---|---|---|
| Vegetation | Soil | Forest Ecosystem | |||
| Habahe-Buerjin | 1000 | 2200 | 66.93 (24.65) | 118.79 (33.27) | 185.72 (45.50) |
| Fuyun | 1300 | 2400 | 66.11 (23.94) | 127.87 (61.57) | 193.98 (66.16) |
| Qinghe | 1600 | 2500 | 78.76 (32.23) | 156.68 (60.32) | 235.44 (54.38) |
Publisher’s Note: MDPI stays neutral with regard to jurisdictional claims in published maps and institutional affiliations. |
© 2021 by the authors. Licensee MDPI, Basel, Switzerland. This article is an open access article distributed under the terms and conditions of the Creative Commons Attribution (CC BY) license (http://creativecommons.org/licenses/by/4.0/).
Share and Cite
Dai, L.; Zhang, Y.; Wang, L.; Zheng, S.; Xu, W. Assessment of Carbon Density in Natural Mountain Forest Ecosystems at Northwest China. Int. J. Environ. Res. Public Health 2021, 18, 2098. https://doi.org/10.3390/ijerph18042098
Dai L, Zhang Y, Wang L, Zheng S, Xu W. Assessment of Carbon Density in Natural Mountain Forest Ecosystems at Northwest China. International Journal of Environmental Research and Public Health. 2021; 18(4):2098. https://doi.org/10.3390/ijerph18042098
Chicago/Turabian StyleDai, Li, Yufang Zhang, Lei Wang, Shuanli Zheng, and Wenqiang Xu. 2021. "Assessment of Carbon Density in Natural Mountain Forest Ecosystems at Northwest China" International Journal of Environmental Research and Public Health 18, no. 4: 2098. https://doi.org/10.3390/ijerph18042098
APA StyleDai, L., Zhang, Y., Wang, L., Zheng, S., & Xu, W. (2021). Assessment of Carbon Density in Natural Mountain Forest Ecosystems at Northwest China. International Journal of Environmental Research and Public Health, 18(4), 2098. https://doi.org/10.3390/ijerph18042098