
Effect of Running Velocity Variation on the Aerobic Cost of Running


 ,
,
Abstract
1. Introduction
2. Materials and Methods
2.1. Participants
2.2. Experimental Design
2.3. Procedures
2.4. Data Analysis
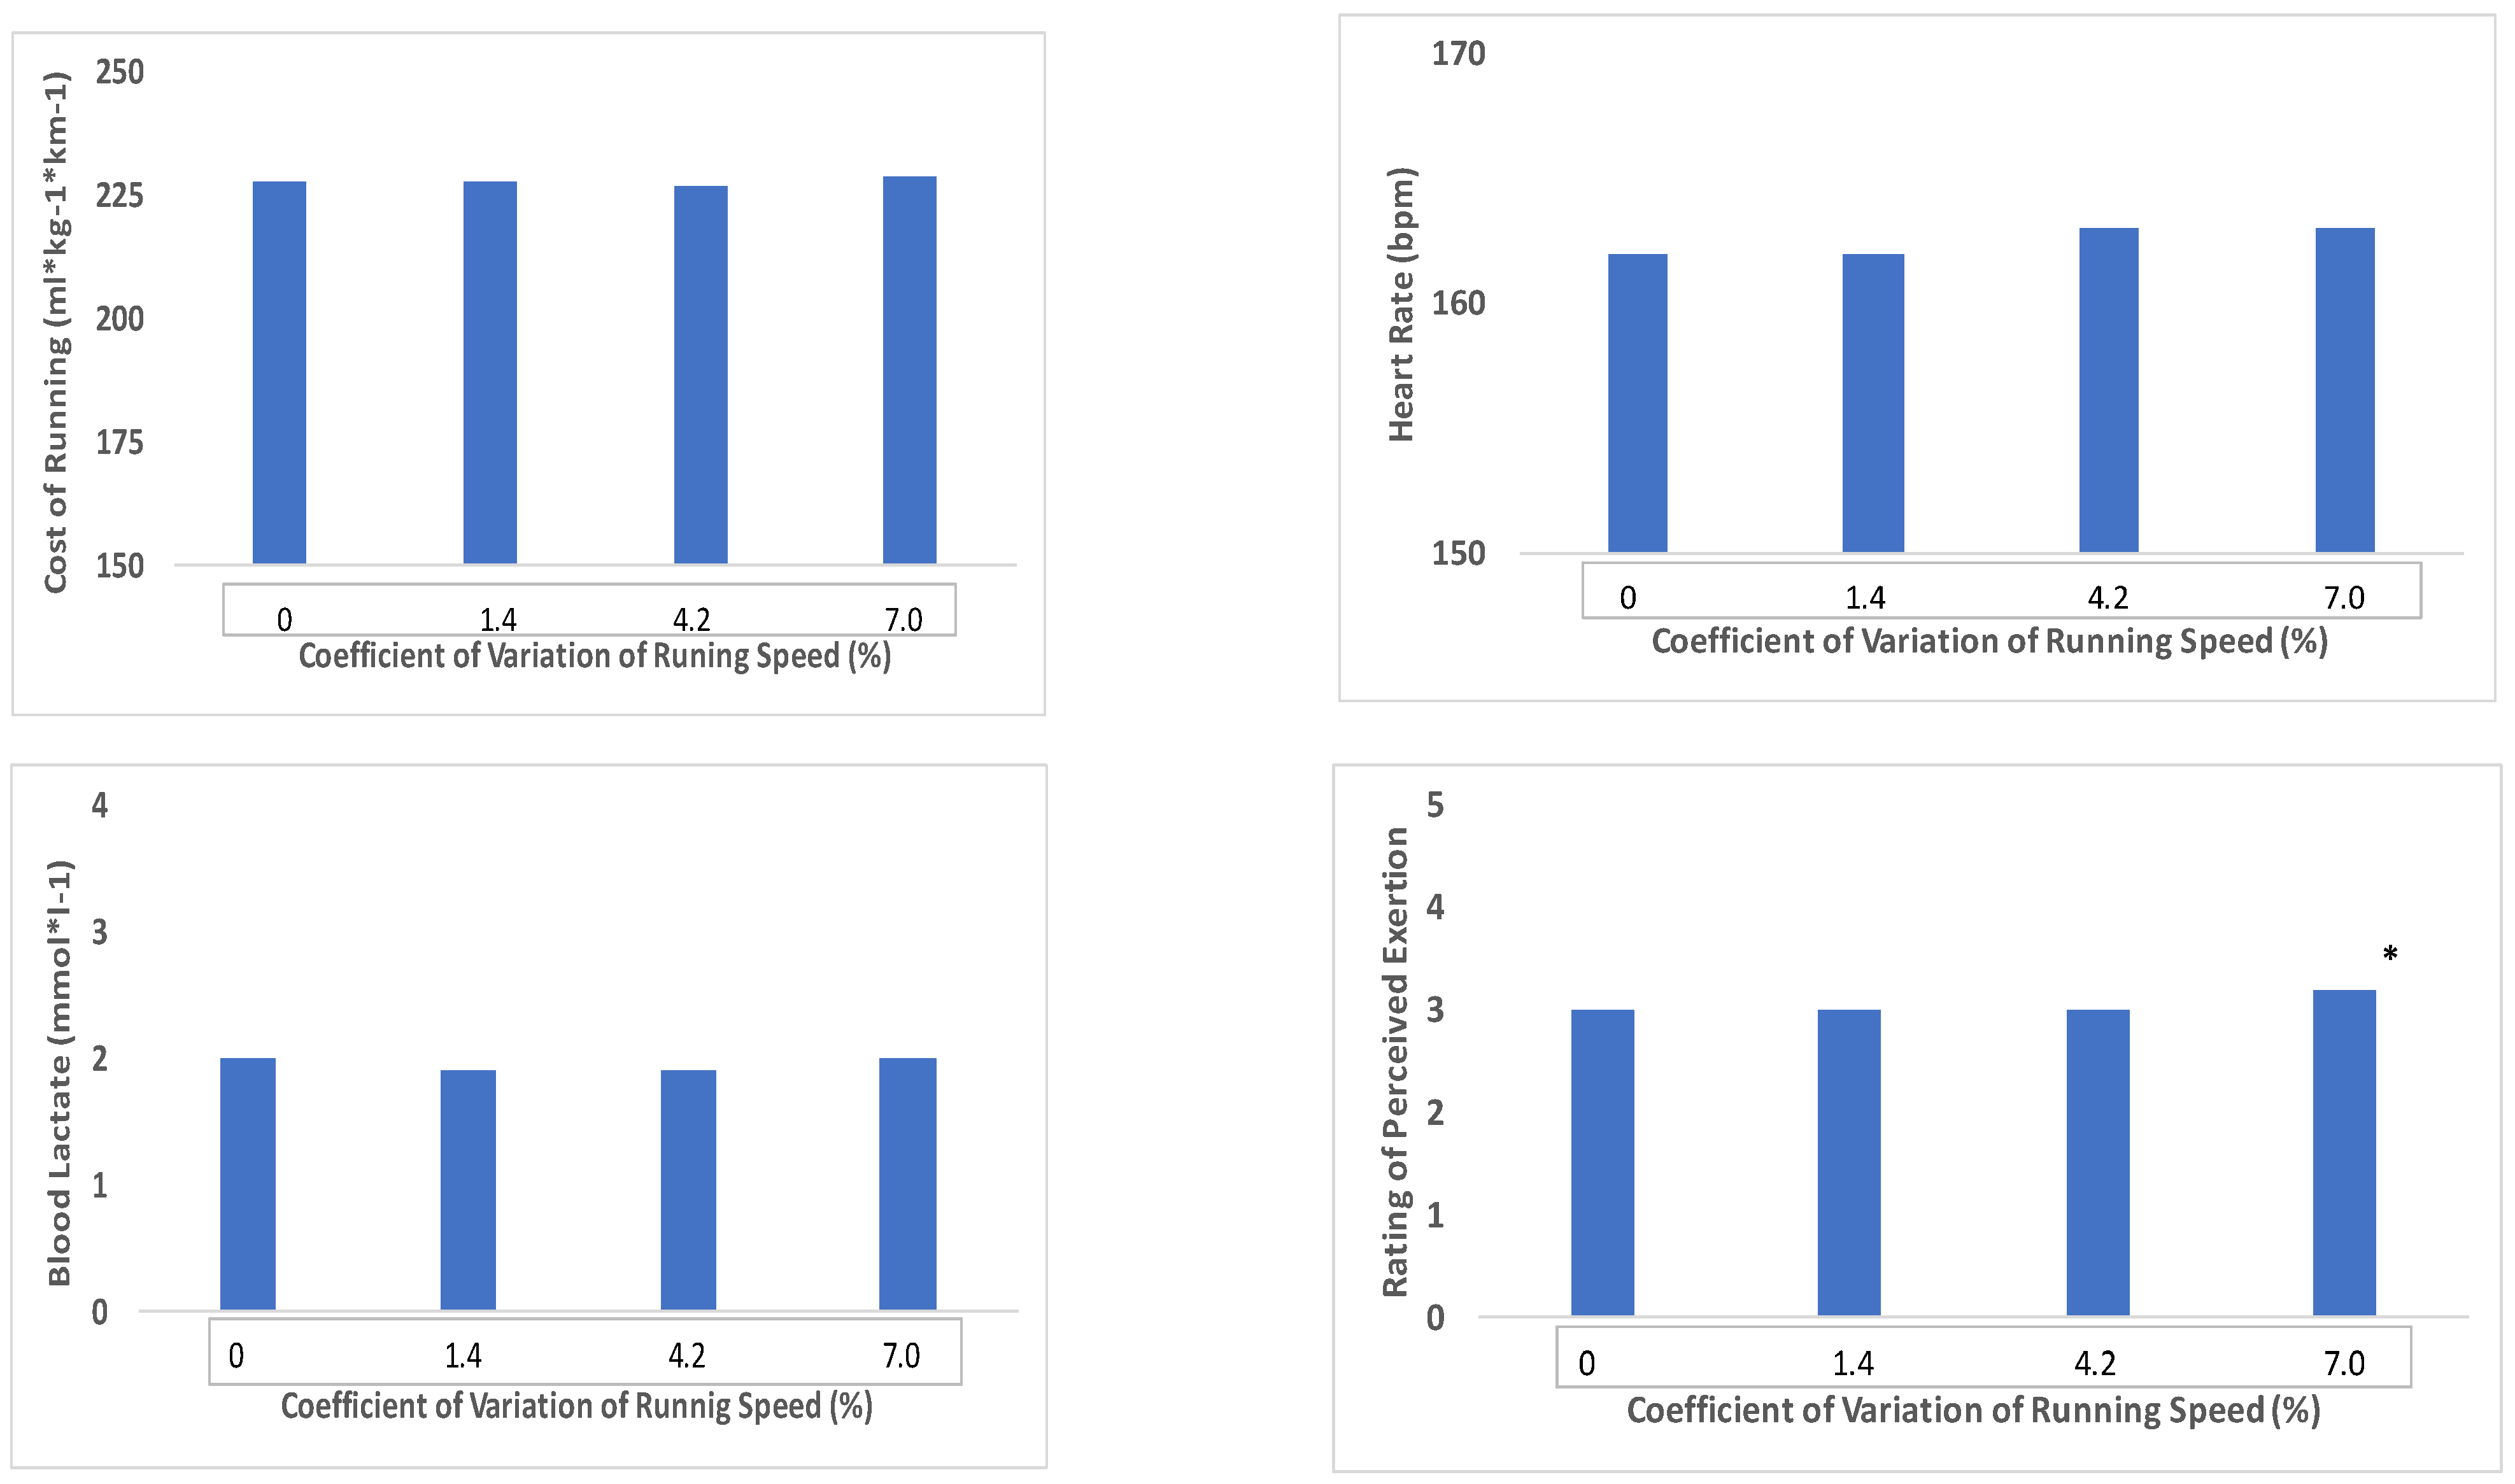
3. Results
Physiological Responses
4. Discussion
4.1. Overall Discussion
4.2. Practical Applications
5. Conclusions
Author Contributions
Funding
Institutional Review Board Statement
Informed Consent Statement
Acknowledgments
Conflicts of Interest
References
- Joyner, M.J.; Coyle, E.F. Endurance exercise performance: The physiology of champions. J. Physiol. 2008, 586, 35–44. [Google Scholar] [CrossRef] [PubMed]
- Tanaka, K.; Matsuura, Y.; Matsuzka, A.; Hirakoba, K.; Kamagai, S.; Su, S.O.; Asaua, K. A longitudinal assessment of anaerobic threshold and distance running performance. Med. Sci. Sports Exerc. 1984, 16, 278–282. [Google Scholar] [CrossRef]
- Foster, C.; de Koning, J.J.; Thiel, C. Evolutionary pattern of improved One-Mile performance. Int. J. Sports Physiol. Perf. 2014, 11, 715–719. [Google Scholar] [CrossRef]
- Foster, C.; de Koning, J.J.; Thiel, C.; Versteeg, B.; Boullosa, D.A.; Bok, D.; Porcari, J.P. Beating yourself: How do runners improve their records? Int. J. Sports Physiol. Perf. 2020, 15, 437–440. [Google Scholar] [CrossRef] [PubMed]
- Thiel, C.; Foster, C.; Banzer, W.; de Koning, J.J. Pacing in Olympic track races: Competitive tactics versus best performance strategy. J. Sport Sci. 2012, 30, 1107–1115. [Google Scholar] [CrossRef] [PubMed]
- Costill, D.L.; Thomason, H.; Roberts, E. Fractional utilization of the aerobic capacity during distance running. Med. Sci. Sports. 1973, 5, 248–252. [Google Scholar] [CrossRef] [PubMed]
- Costill, D.L.; Branham, G.; Eddy, D.; Sparks, K. Determinants of marathon running success. Int. Z. Angew. Physiol. 1971, 29, 249–254. [Google Scholar] [CrossRef] [PubMed]
- Jones, A.M.; Kirby, B.S.; Clark, I.E.; Rice, H.M.; Fulkerson, E.; Wylie, L.J.; Wilkerson, D.P.; Vanhatalo, A.; Wilkins, B.W. Physiological demands of running at 2-hour marathon race pace. J. Appl. Physiol. 2020, in press. [Google Scholar] [CrossRef]
- Foster, C.; Lucia, A.M. Running economy: The forgotten factor in elite performance. Sports Med. 2007, 37, 316–319. [Google Scholar] [CrossRef] [PubMed]
- Robinson, S.; Robinson, D.L.; Mountjoy, R.J.; Bullard, R.W. Influence of fatigue on the efficiency of men during exhausting runs. J. Appl. Physiol. 1958, 12, 197–201. [Google Scholar] [CrossRef] [PubMed]
- Skiba, P.; Chidnok, W.; Vanhatalo, A.; Jones, A.M. Modeling the expenditure and reconstitution of work capacity above critical power. Med. Sci. Sports Exerc. 2012, 44, 1526–1532. [Google Scholar] [CrossRef] [PubMed]
- Foster, C.; Gregorich, H.; Barroso, R.; Boullosa, D.; de Koning, J.J.; Hettinga, F.J.; Jones, A.M.; Pettit, R.; Porcari, J.P. Pacing strategy in 1-mile world records as a test of the critical speed/D’ hypothesis. Int. J. Sports Physiol. Perf. 2020, in press. [Google Scholar]
- Minetti, A.E.; Gaudino, P.; Seminai, E.; Cazzola, D. The cost of transport of human running is not affected, as in walking, by wide acceleration/deceleration cycles. J. Appl. Physiol. 2013, 114, 498–503. [Google Scholar] [CrossRef] [PubMed][Green Version]
- Noordhof, D.A.; de Koning, J.J.; van Erp, T.; van Keiuipema, B.; de Ridder, D.; Otter, R.; Foster, C. The between and within day variation in gross efficiency. Eur. J. Appl. Physiol. 2018, 109, 1209–1218. [Google Scholar] [CrossRef] [PubMed][Green Version]
- Jones, A.M.; Doust, J.H. A 1% treadmill grade most accurately the energetic cost of outdoor running. J. Sports Sci. 1996, 14, 321–327. [Google Scholar] [CrossRef] [PubMed]
- Borg, G. Borg’s Perceived Exertion and Pain Scales; Human Kinetics Press: Champaign, IL, USA, 1998. [Google Scholar]
- Foster, C.; Cotter, H. Blood lactate, respiratory and heart rate markers of the capacity for sustained exercise. In Physiological Assessment of Human Fitness, 2nd ed.; Maud, P.J., Foster, C., Eds.; Human Kinetics Press: Champaign, IL, USA, 2005; pp. 63–76. [Google Scholar]
- Foster, C.; Lucia, A.; de Koning, J.J.; Wright, G.A.; Porcari, J.P.; Battista, R.A.; Daniels, J.T.; Chelstrom, D.; Ferguston, B.; Hayes, C.; et al. Energetic cost of exercise. In Exercise Physiology: From a Cellular to an Integrative Approach; IOS Press: Amsterdam, The Netherlands, 2010. [Google Scholar]
- Veneman, T.; Schalig, W.; Eken, M.; Foster, C.; de Koining, J.J. The physiological and perceptual responses to constant- and variable-paced 10 km cycle time trials. Int. J. Sports Physiol. Perf. 2021, in press. [Google Scholar]


| Subjects | Men (n = 12) | Women (n = 8) | All (n = 20) |
|---|---|---|---|
| Age (years) | 20.8 ± 1.9 | 21.6 ± 1.3 | 21.2 ± 1.7 |
| Height (cm) | 178.8 ± 5.6 | 168.1 ± 6.2 | 174.5 ± 7.8 |
| Weight (kg) | 69.0 ± 7.1 | 55.6 ± 6.3 | 63.7 ± 9.4 |
| VO2max (mL/kg/min) | 72.8 ± 6.8 | 57.1 ± 6.0 | 66.5 ± 10.1 |
| VO2 @ VT (mL·kg−1·min−1) | 53.5 ± 6.4 | 45.8 ± 4.1 | 50.4 ± 6.7 |
| vVO2max (m·min−1) | 326.1 ± 27.0 | 268.0 ± 17.5 | 302.8 ± 37.3 |
| Velocity @ 90% VT (m·min−1) | 223.3 ± 23.1 | 196.3 ± 10.2 | 212.5 ± 23.1 |
| HRmax (bpm) | 187.7 ± 7.3 | 185.3 ± 10.5 | 186.7 ± 8.4 |
| Volume of Training (km·week−1) | 84 ± 31 | 49 ± 24 | 69 ± 33 |
| Average Pace (m·min−1) | 225.2 ± 13.7 | 202.4 ± 12.7 | 216.1 ± 17.3 |
| Interval Sessions·/week−1 | 0.8 ± 0.7 | 0.8 ± 0.9 | 0.8 ± 0.8 |
Publisher’s Note: MDPI stays neutral with regard to jurisdictional claims in published maps and institutional affiliations. |
© 2021 by the authors. Licensee MDPI, Basel, Switzerland. This article is an open access article distributed under the terms and conditions of the Creative Commons Attribution (CC BY) license (http://creativecommons.org/licenses/by/4.0/).
Share and Cite
Ranum, M.; Foster, C.; Camic, C.; Wright, G.; Guidotti, F.; de Koning, J.J.; Dodge, C.; Porcari, J.P. Effect of Running Velocity Variation on the Aerobic Cost of Running. Int. J. Environ. Res. Public Health 2021, 18, 2025. https://doi.org/10.3390/ijerph18042025
Ranum M, Foster C, Camic C, Wright G, Guidotti F, de Koning JJ, Dodge C, Porcari JP. Effect of Running Velocity Variation on the Aerobic Cost of Running. International Journal of Environmental Research and Public Health. 2021; 18(4):2025. https://doi.org/10.3390/ijerph18042025
Chicago/Turabian StyleRanum, Madeline, Carl Foster, Clayton Camic, Glenn Wright, Flavia Guidotti, Jos J de Koning, Christopher Dodge, and John P. Porcari. 2021. "Effect of Running Velocity Variation on the Aerobic Cost of Running" International Journal of Environmental Research and Public Health 18, no. 4: 2025. https://doi.org/10.3390/ijerph18042025
APA StyleRanum, M., Foster, C., Camic, C., Wright, G., Guidotti, F., de Koning, J. J., Dodge, C., & Porcari, J. P. (2021). Effect of Running Velocity Variation on the Aerobic Cost of Running. International Journal of Environmental Research and Public Health, 18(4), 2025. https://doi.org/10.3390/ijerph18042025