Article

Towards a Semi-Automatic Early Warning System for Vector-Borne Diseases

by
Panagiotis Pergantas
1,
Nikos E. Papanikolaou
2,3,*,
Chrisovalantis Malesios
4,
Andreas Tsatsaris
5,
Marios Kondakis
6,
Iokasti Perganta
1,
Yiannis Tselentis
7 and
Nikos Demiris
6
1
Bioapplications Ltd., 30 Ioannou Perganta Str., 32100 Levadia, Greece
2
Laboratory of Agricultural Zoology and Entomology, Department of Crop Science, Agricultural University of Athens, 75 Iera Odos Str., 11855 Athens, Greece
3
Directorate of Plant Produce Protection, Greek Ministry of Rural Development and Food, 150 Sygrou Ave., 17671 Athens, Greece
4
Department of Agricultural Economics and Rural Development, Agricultural University of Athens, 75 Iera Odos Str., 11855 Athens, Greece
5
Department of Surveying and Geoinformatics Engineering, University of West Attica, 28 Ag. Spiridonos Str., 12243 Egaleo, Athens, Greece
6
Department of Statistics, Athens University of Economics and Business, 76 Patision Str., 10434 Athens, Greece
7
Regional Public Health Laboratory, Faculty of Medicine, University of Crete, 13 Andrea Kalokerinou Str., 71500 Giofirakia, Greece
*
Author to whom correspondence should be addressed.
Int. J. Environ. Res. Public Health 2021, 18(4), 1823; https://doi.org/10.3390/ijerph18041823
Submission received: 6 December 2020 / Revised: 4 February 2021 / Accepted: 9 February 2021 / Published: 13 February 2021
(This article belongs to the Special Issue Public Health Resilience and Vector-Borne Diseases)

Abstract

:
The emergence and spread of vector-borne diseases (VBDs) is a function of biotic, abiotic and socio-economic drivers of disease while their economic and societal burden depends upon a number of time-varying factors. This work is concerned with the development of an early warning system that can act as a predictive tool for public health preparedness and response. We employ a host-vector model that combines entomological (mosquito data), social (immigration rate, demographic data), environmental (temperature) and geographical data (risk areas). The output consists of appropriate maps depicting suitable risk measures such as the basic reproduction number, R0, and the probability of getting infected by the disease. These tools consist of the backbone of a semi-automatic early warning system tool which can potentially aid the monitoring and control of VBDs in different settings. In addition, it can be used for optimizing the cost-effectiveness of distinct control measures and the integration of open geospatial and climatological data. The R code used to generate the risk indicators and the corresponding spatial maps along with the data is made available.

1. Introduction

Vector-borne diseases (VBDs) are caused by parasites, viruses or bacteria that are transmitted by a vector [1]. Mosquitoes, ticks, sandflies, triatomine bugs, tsetse flies, fleas, black flies, aquatic snails and lice are known to act as vectors of this kind of disease [2]. The emergence and spread of VBDs in Europe is a function of biotic, abiotic and socio-economic drivers of disease [3]. Public health decision-making generally requires early warning output from frameworks that are based on uncertain information [4,5]. Globalization and climate changes, along with certain socio-demographic determinants can be critical drivers of VBDs. Hence, observing changes in these drivers can help envision, or even predict, fluctuations in many infectious diseases [3,6].
Among all the hematophagous arthropod vectors, mosquitoes (Diptera: Culicidae) are the leading vector of several human diseases. Mosquito-borne diseases (MBDs) include malaria, West Nile virus, chikungunya and Zika virus [7,8]. Blood meals are necessary for mosquito females as the protein source to produce and mature their eggs [9]. Τhis activity allows mosquitoes to transmit several pathogens and parasites, becoming extremely important insects for human health [7]. Taking into account the invasive success of several mosquito species due to worldwide human mobility and trade [10], the development of early warning and control methods seems imperative [11].
Tropical VBDs such as malaria have attracted much attention due to their impact on human health [12,13]. Malaria is, perhaps, the most well-studied VBD in terms of its transmission dynamics and the potential for adaptation. It is known that five species of Plasmodium cause disease in humans [14]. According to the 2019 World malaria report, an estimated 228 million cases of malaria occurred worldwide [15]. Malaria is endemic in more than 100 countries around the world, mainly in sub-Saharan Africa and Asia, and is transmitted through the bite of the infected female Anopheles mosquito.
Considering the importance of vector-borne diseases in human health, it is imperative to work towards creating a suitable framework for an early warning system that would improve our understanding of the connectivity between existing and potential vector-borne risk areas. In this study, we focus upon malaria in Greece, a previously endemic disease that was eradicated in the 1950s by coordinated efforts of the WHO and the local authorities. Sporadic local P. vivax malaria outbreaks during the last decade indicate that targeted vector control remains imperative for preventing re-emergence. We firstly present a host-vector spatially explicit model which integrates entomological, geographical, social and environmental evidence from 12 municipalities of the prefecture of central Greece (see Table A1 in Appendix A for a description of the population and density information of the municipalities in the study), in order to guide the mosquito control efforts. To this end, we focused on the estimation of parameters related to the Anopheles’ population dynamics and the corresponding risk measures derived from them. In addition, we presented the basis for an appropriate (semi)-automated, open-source, early warning tool based upon the above estimates of suitable risk indicators. The ultimate goal of this paper in terms of public health would be to use the proposed model, as well as the corresponding spatial mapping of the derived estimates from this model, as an early warning system with meteorological inputs, thus facilitating improved decision making and disease prevention. The R code calculating the risk measures and depicting them on spatial maps of this risk is made freely available on GitHub.

2. Methods

2.1. Study Area and Data Collection

The study took place in 12 municipalities of the prefecture of central Greece (Figure 1). The study area was about 406.000 ha.
Considering mosquito data collection, we used CO2 traps. Therefore, our data consisted of mosquito female adults, which are the malaria vectors. The traps were set up in 10 areas, consisting of a total of 393 sample-collecting stations in the outskirts of towns and villages of the prefecture of central Greece (see Figure 1 for a visual inspection of all collection places). Breeding sites included canals, rice pads, tanks, etc., most of them previously checked for the presence of mosquitoes using drones. The traps were placed and checked every 10 to 15 days between 6 March 2018 and 29 August 2018. Genus identification was performed using the morphological examination of the mosquito samples. The species Anopheles sacharovi, An. maculipennis, An. superpictus, An. claviger and An. hyrcanus are the most important species in the study region, accounting for approximately 90% of all Anopheles species in the region [11]. We, therefore, suppose that all the positive samplings for Anopheles mosquitoes belong to species that are malaria vectors.
Temperature data were recorded from the meteorological stations of the National Observatory of Athens (NOA). There were 10 meteorological stations of the NOA recording temperature data at the study area. For our modeling, we utilized the average temperature values with a 30-day interval, starting from the first Saturday of each month, between the March and August of 2018. The inverse distance weighting (IDW) interpolation method [16] was additionally used to estimate the average temperatures at the locations where no measurements were available.

2.2. The Spatial Predictive Model

In this paper, we present a host-vector model that combines entomological, social, environmental and geographical data to provide estimates on the average infection number due to malaria in central Greece (Table A2). The model has been already presented [11] and here we provide a short summary. In addition to the standard entomological parameters which are used within the well-established Ross-–Macdonald mathematical model [17], our model takes into account the potential host population in the central Greece region, related to migrants from regions endemic to malaria [18]. Their prevalence in terms of the P. vivax is determined from the latest World Malaria Report of the WHO [19].
The transmission risk measures obtained by the model are the basic reproduction rate of the disease, namely R 0 , which represents a natural threshold parameter appropriate for disease control since an outbreak may occur only when R 0 > 1 . This is indicative of the potential for disease spread should one infective individual starts an outbreak. In addition, we estimate the probability of an individual getting infected, τ = Pr ( infection ) , and the number of expected infections, say E ( infections ) given by: E ( infections ) = Pr ( infection ) × ( #   of   susceptibles ) . Those two risk measures are conditional upon an outbreak taking off and are only meaningful in the event of introducing infected individuals in the area, as is R 0 .
We denote with R ^ 0 , τ ^ the corresponding model-based point (typically median) estimates of these measures and we calculate local R 0 estimates for each sample-collecting station using:
R ^ 0 i = V e c i b i c r i ,
where V e c is the vectorial capacity, that is, the expected number of infective mosquito bites that would eventually arise from all the mosquitoes that would bite a single fully infectious person on a single day [20] and is given by:
V e c i = m i α i 2 exp ( g i v i ) g i
In (1) and (2), m i denotes the numbers of mosquitoes in each station i ; α i the biting rate, that is, the percentage of mosquitoes that feed on humans each day; b i the probability a bite produces infection to a human; r i the average daily recovery rate per day; v i the mosquito latent period, that is, the number of days from infection to infectiousness; g i the mosquito mortality rate per day. Especially parameter g i has been shown in previous research [20] to be dependent on the temperature levels, hence we also utilize recorded and/or interpolated temperatures for our calculations. Finally, with c we denote the probability a bite turns a susceptible mosquito to infected, which for our analysis is set to the constant value of 0.5. The parameters α i , b i , r i and v i were sampled from suitable distributions according to the relevant literature [17,20,21], whereas g i changes with the temperature levels [20], which are currently represented by monthly means of temperature [11]. An analytical description of parameters and relevant distributions utilized for the calculations of risk measures is included in Table A3 in Appendix A.
In addition to the entomological part of the proposed model, estimation of the external host component due to the migration is embedded into the risk parameter calculations, by utilizing an exponential kernel function, W i k , (k = 1,2,3) of the form:
W i k = θ exp ( θ d i k )
W i k is used to model the spatial part of the potential hosts, with θ being a weight factor. In (3) d i k denotes the distances from larvae areas, measured during the three periods of potential hosts’ monitoring, k. Subsequently, the estimation of the external host component due to the migration is approximated by μ ^ 0 i = k = 1 3 μ 0 i k W i k . This estimated proportion of initially infected hosts, μ ^ 0 i , is then multiplied by a pre-specified incidence rate. A deterministic sensitivity analysis was conducted [11] and the overall qualitative picture remained unchanged although the quantitative scale varied somewhat.
Finally, estimation of τ ^ , should a local outbreak is initiated, is performed by solving the non-linear equation:
1 + μ ^ 0 i τ ^ i exp ( τ ^ i R ^ 0 i ) = 0
which only applies for R ^ 0 i 1 . We set τ ^ i = 0 when R ^ 0 i < 1 .

2.3. Towards a Semi-Automatic Early Warning System Tool
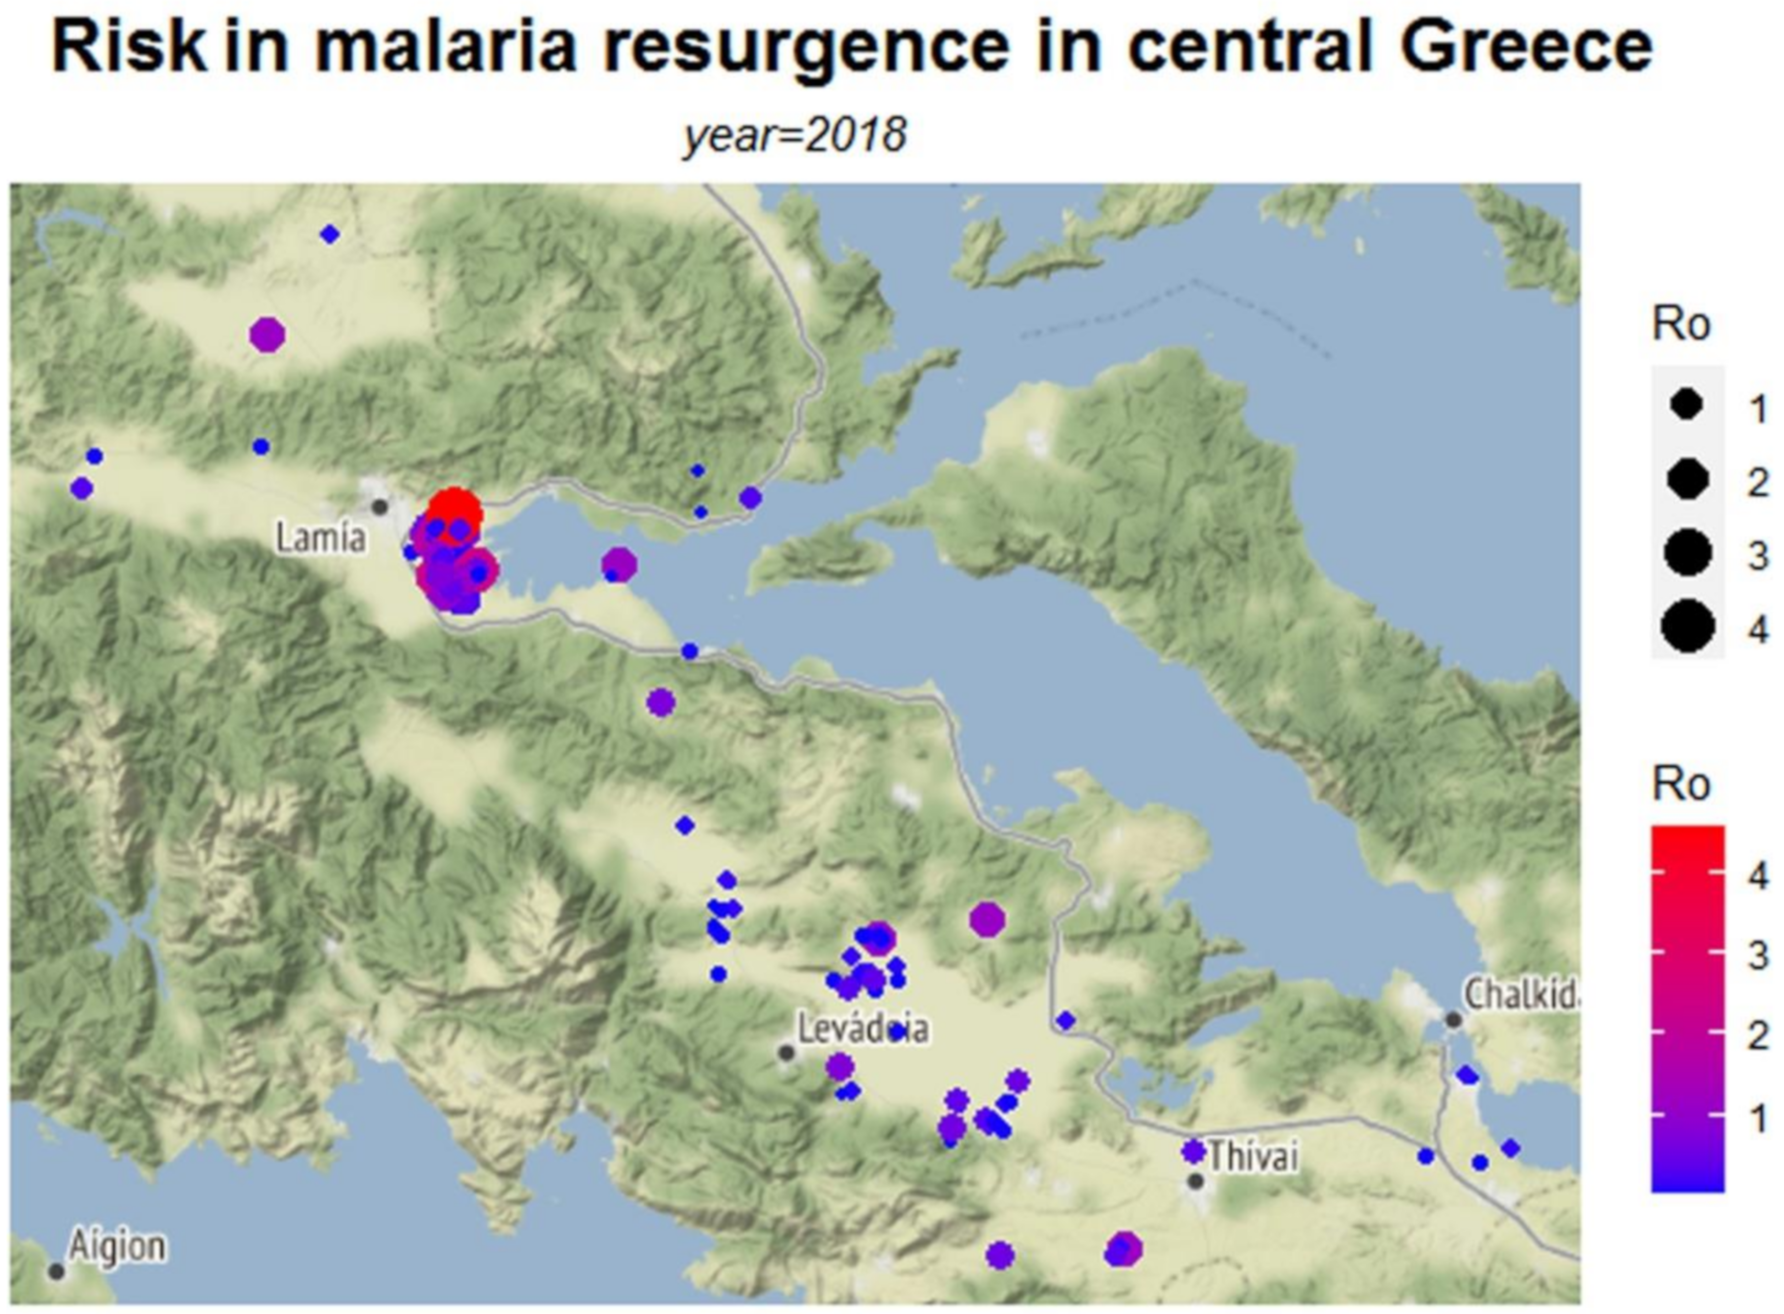
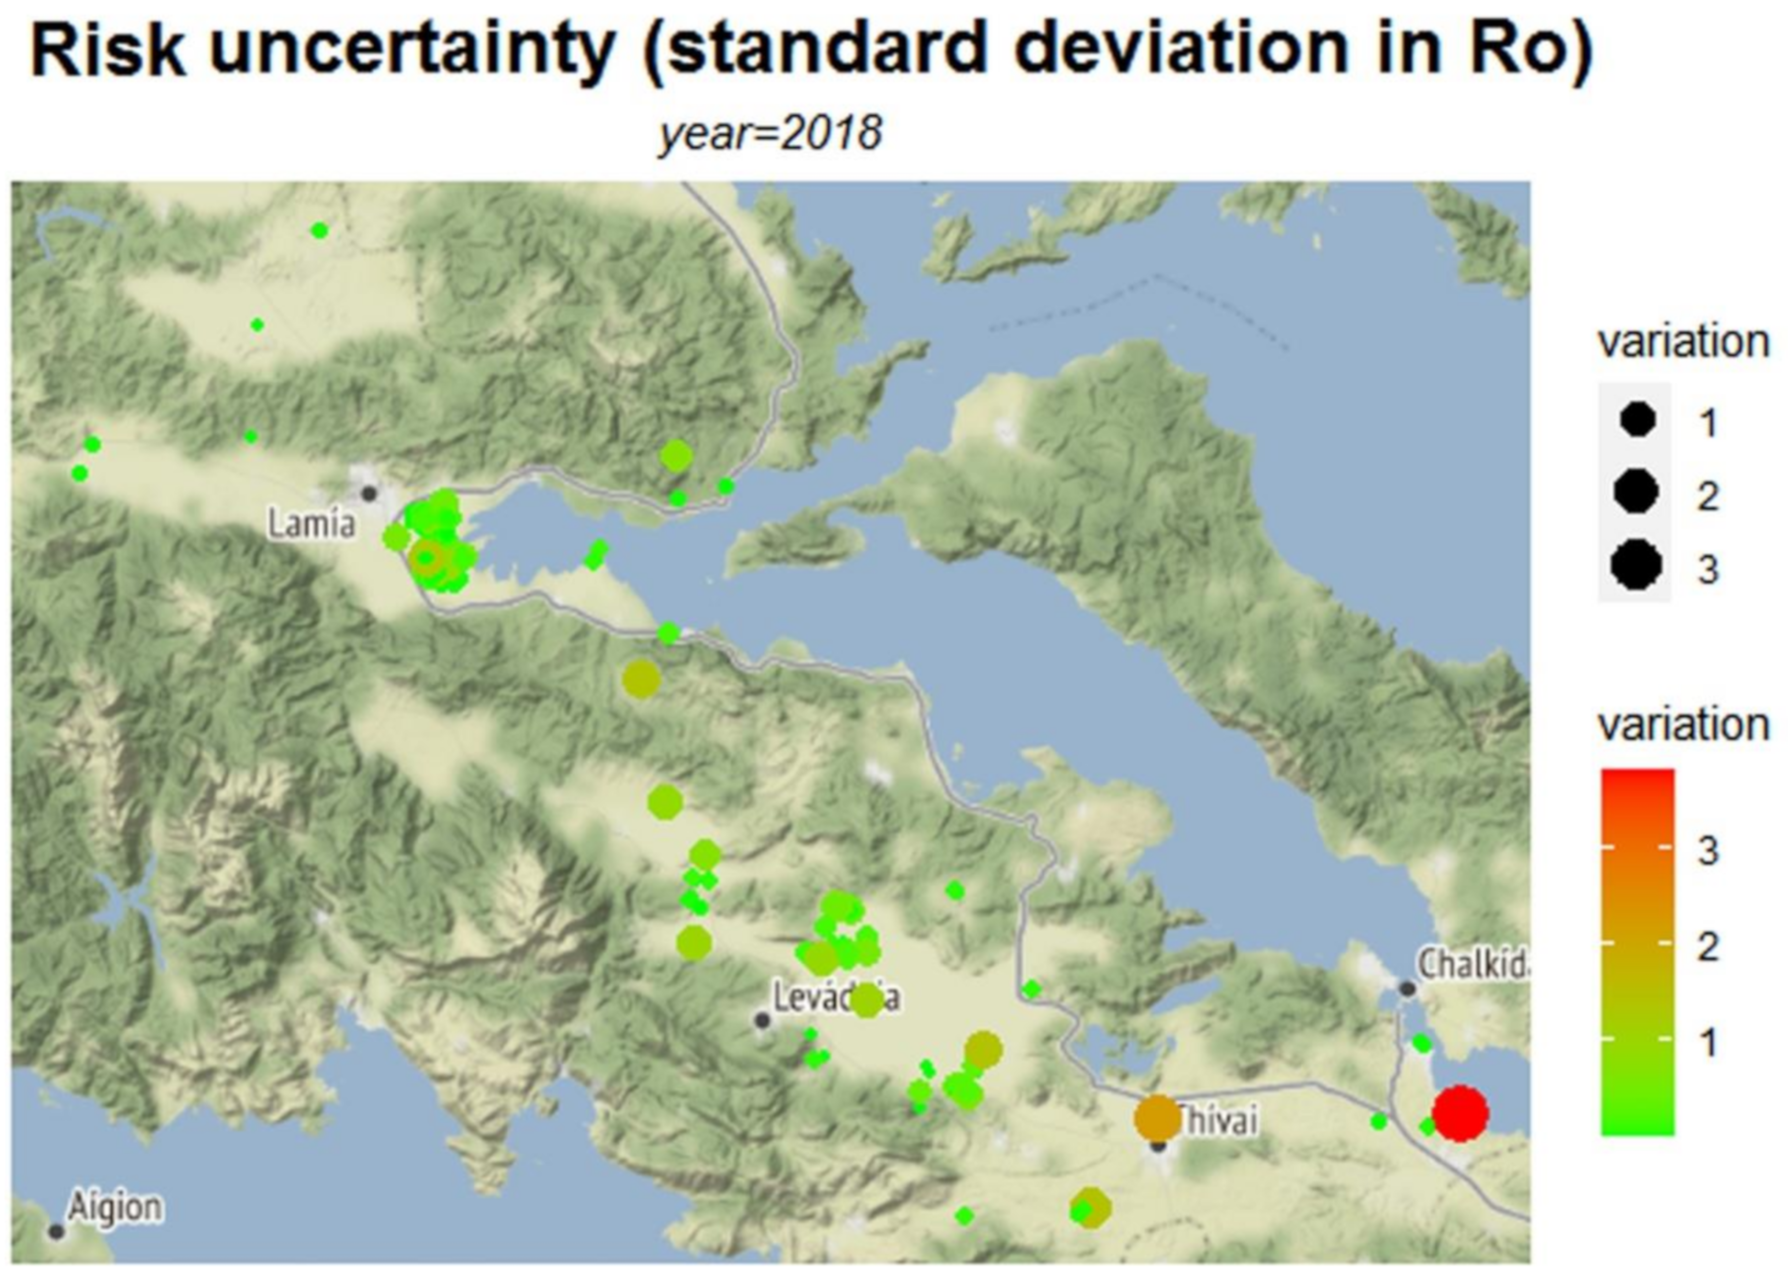
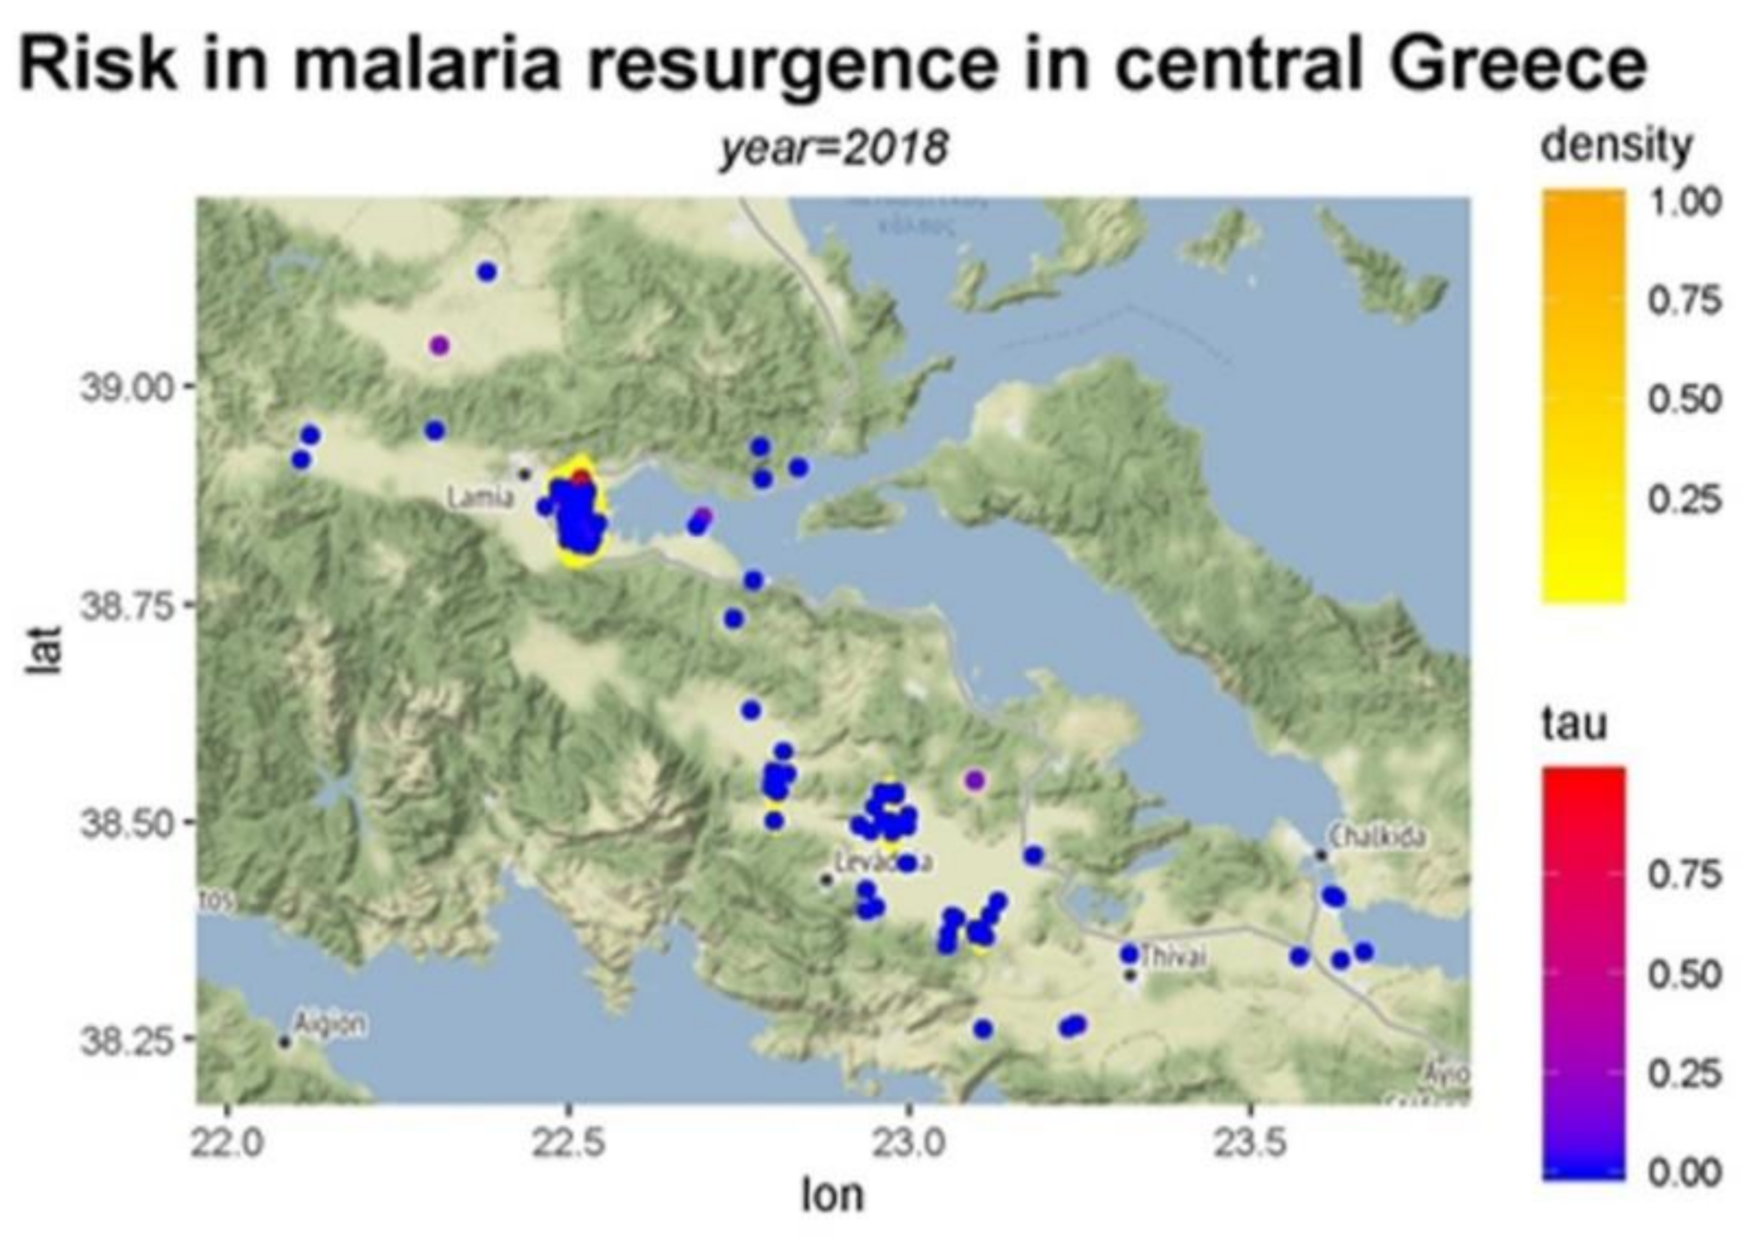
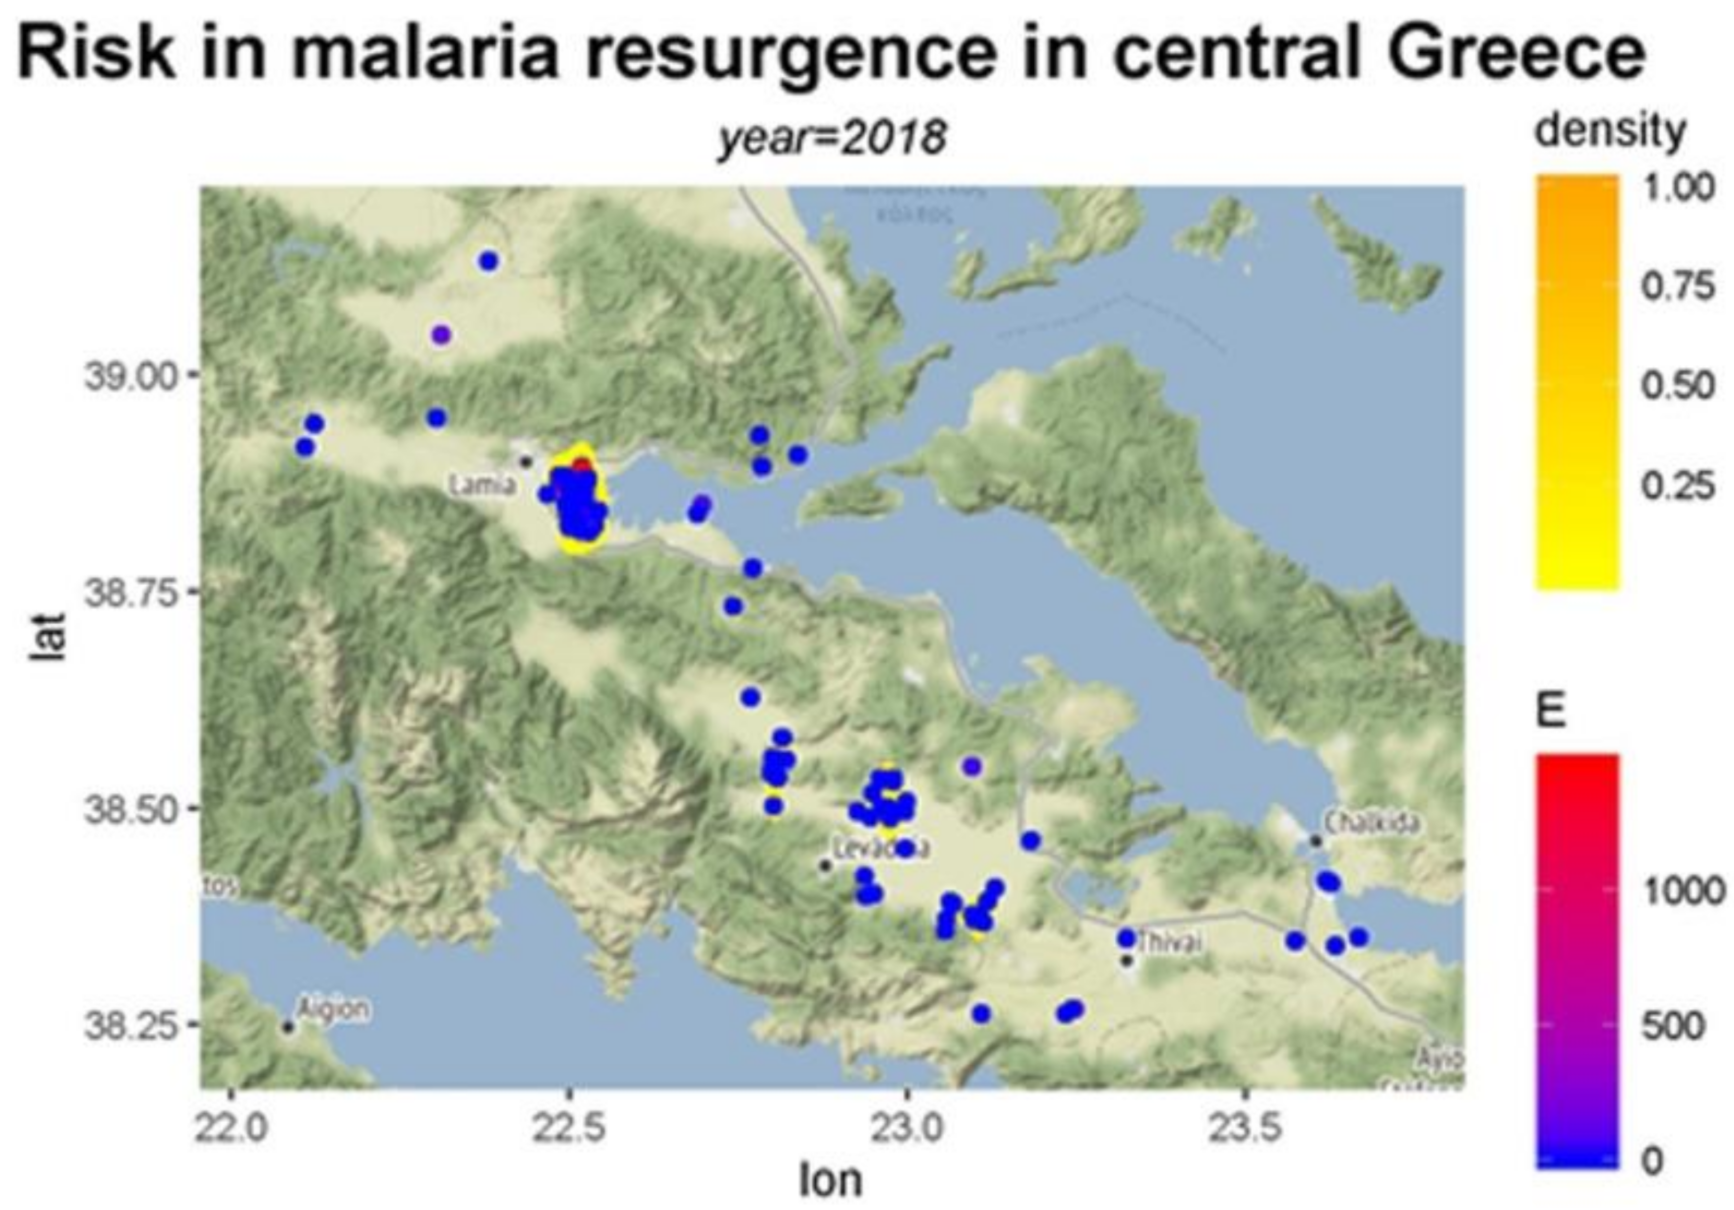
The semi-automatic early warning system tool was developed using the open-access R software environment [22], which is free and compatible with most common programming languages. In particular, R was used for all the steps of the process, including constructing R 0 and other risk measure maps. Similar maps, in the case of other infectious viruses, have been presented elsewhere [23]. A large collection of static maps from various online sources (e.g., Google Maps provided by Google LLC in California, USA and Stamen Maps provided by data visualization and cartography design studio in San Francisco, USA) can be used within R for the effective visualization of the parameters of interest.
The calculations were facilitated using a variety of software packages. Specifically, the dplyr package is used to make data frame manipulation in an efficient way and the ggmap package [24] provides the main methods for accessing and downloading Google and Stamen maps as well as for generating the data graphs of this work. Furthermore, the tools used to construct the graphs presented here can be separated into two main categories by graph form. The first category includes the qmplot function which makes a quick overview of maps along with data points. Herein, the data points are spatial points that reflect the measurements upon both terrain-background based maps (Figure 2, Figure 3 and Figure 4) and toner-background based maps (Figure A1, Figure A2 and Figure A3) and vary in size and in color according to the values of (Ro), (τ) and (E) respectively. The second category includes the stat_density2d function which performs a two-dimensional kernel density estimation with an axis-aligned bivariate normal kernel function (Figure A4, Figure A5 and Figure A6). This density function creates a continuous surface by measuring the contribution of each data point on a map area. This contribution is smoothed out from a single point into a region of space surrounding the point. The kernel density estimate evaluated on a grid is given by:
f ^ ( x , y ) = i ϕ ( x x i σ x ) ϕ ( y y i σ y ) n σ x σ y
where density φ is the standard normal distribution and diag ( σ x 2 , σ y 2 ) is the bandwidth diagonal matrix which controls the amount and orientation of smoothing induced. The bandwidth plays the role of the covariance matrix of the bivariate normal kernel [25]. The output surface shows where point features are concentrated, by measuring the accumulated intersections of the individual areas. The way of density calculation depends on the bandwidth that uses a default search radius. In addition, the bins parameter is a control parameter that defines the number of contour levels. We used 100 bins for the construction of Figure A4, Figure A5 and Figure A6. Code for implementing all the methods in the paper is provided at https://github.com/valadis/EWS_spatial_maps_R_code.git.

3. Results

In Figure 2, Figure 3 and Figure 4, the risk maps for the risk parameters of interest are depicted (Table A4 in Appendix A presents descriptive statistics of the estimated risk measures). These maps are based on the coordinates of the data points with the intensity of each risk measure varying with color.
The risk map in Figure 2 depicts the risk as expressed by the median basic reproduction number R0 for each area, whereas Figure 3 presents the estimated probability of getting infected, τ. Figure 4 shows the number of expected infections E, as estimated by the spatial predictive model.
These visualization maps were created using the ggmap function of ggmap package. Alternative presentations based on other functions such as the qmplot option are also available in the ggmap package. Appendix A includes alternative visualizations of our results, including maps of point estimates using alternative terrain representations (Figure A1, Figure A2 and Figure A3) or heat-maps (Figure A4, Figure A5 and Figure A6) and different options may suit different users based upon their needs.
Values of the R0 above 1 (Figure 2), indicate where the greatest potential for risk is located. The highest risk is primarily located in the area of Lamia, with R0 reaching values as high as 4. The probability of getting infected from low to high (zero to 0.75) was depicted in the map of Figure 3 and the Lamia region was found to have the highest risk. However, the map also suggests the non-negligible probability of infection (τ estimates between 0.25 and 0.5) in the largely dispersed rural areas of the prefecture. As these rural areas have low populations, the expected number of infections is relatively low as shown in Figure 4, revealing the complementary characteristics of the different risk measures. The highest number of potential infections is concentrated in the wider region of Lamia.
In addition to the risk maps based upon the estimated parameters such as the basic reproduction number R0, our approach enables the presentation of the corresponding uncertainty of the estimated parameters (or functions thereof) by way of depicting the associated variability, for example, via the variance or standard deviation. For example, the risk map of malaria transmission based on R0 (Figure 2) can naturally be combined with a variability map of the parameter (see Figure 5) in order to provide a more robust tool for the monitoring of transmission of VBDs. This type of combined reporting can be potentially applied to the other measures of risk assessment. Perhaps more importantly, it reveals knowledge gaps since high uncertainty suggests that further sampling is required in those areas in order to reduce this variability.

4. Discussion

Our study introduces a model-based framework that integrates entomological, geographical, social and environmental evidence in order to examine the potential for malaria resurgence in Greece. This results towards a semi-automatic open-source tool that can be used for the monitoring and early warning of mosquito-borne diseases, such as malaria and West Nile virus. The early warning system takes into account the spatial distribution of risk via suitable mathematical modeling to generate appropriate maps that can adequately describe the spatial variation in risk.
The results suggest that five to six distinct risk areas in the spatial maps with potential for malaria resurgence can be identified by inspecting the generated graphs. Specifically, the areas of higher risk are those close to the municipality of Lamia as expected due to the local rice fields and to a lesser extent in the lowlands around Levadia and Thivae municipalities wherever the obsolete irrigation system is responsible for a large number of Anopheles mosquito breeding sites. Generally, the risk of malaria resurgence is greatly facilitated by the coexisting of people from countries where malaria is endemic and who are engaged in agricultural work in areas where there are Anopheles mosquito breeding habitats such as areas with paddies (e.g., municipality of Lamia) and irrigation canals. These areas can serve as hot spots for the resurgence of malaria.
Considering VBDs as an emerging public health threat worldwide [6,14], we expect our methodology to have a bearing on the evaluation of the epidemic risks of such diseases in a given area. Recently, refugee populations are being hosted throughout Europe, including Greece [26], potentially increasing the risk of vector-borne disease transmission. In addition, several disease vectors in refugee camps in Greece have been recorded [27], indicating a possible risk factor for disease transmission. An early warning system for vector-borne diseases of the sort presented in this paper could be suitable for preventing disease spread.
Our approach could be also used as a tool for the efficient control of mosquito species, indicating time control periods, preventing their expansion and, therefore, the potential for disease transmission. Understanding the mosquito spatial distribution is of importance for public health and a cornerstone for studies aiming to understand their expansion [10,28,29,30,31]. Studies dealing with species distribution models may set aside important factors that drive these models such as the quality of the training data, as well as critical abiotic factors [10]. Our mosquito sampling method consisted of CO2 traps. Consequently, our data involved only female Anopheles individuals which serve as vectors of malaria, so that we overcame issues of sex-biased data that may arise by larvae sampling.
Our model accounts, in turn, for temperature fluctuations, which are particularly important in insect performance [32,33,34]. Temperature is the main abiotic factor that determines insect distribution, affecting critical aspects of their life history such as development, survival, reproduction and life span [35,36,37]. This results in a further effect on insect fitness, determining their population dynamics [38,39,40]. Therefore, via accounting for temperature fluctuations our model is tailored towards the precise estimation of mosquito population growth.
Our method has some limitations. It relies on detailed evidence of various types. Data of this kind may or may not be readily available and some sort of approximation is often used. However, such issues are reflected in the uncertainty of the risk measures and the corresponding maps are a natural by-product of the proposed tool. In fact, these maps offer an opportunity since they suggest where additional sampling should occur in order to reduce this uncertainty. In addition, most such data are observational data and do not form part of a randomized controlled experiment. This study represents a typical example, and appropriate counterfactual scenarios are common in the area, including what would have happened had no vector control method been applied. These scenarios are based on established theory though and including the corresponding uncertainty facilitates scientifically honest reporting and leads to additional data collection as described above.

5. Conclusions

The threat of a rapidly changing planet includes precarious spatial-temporal change dynamics associated with VBDs [41]. For example, disease transmission may vary strongly and unimodally with temperature [6]. This poses new conceptual and practical challenges in relation to sustainable health resilience, and therefore timely control of VBDs may act towards this direction. We expect that our attempt towards a semi-automatic early warning system tool we developed can potentially aid the monitoring and control of VBDs in different settings. In addition, it can be used for optimizing the cost-effectiveness of distinct control measures and the integration of open geospatial and climatological data. Perhaps more importantly, this system can enhance our ability to predict the risk of disease outbreaks in different climatic conditions. The developed methods can be adapted for usage in countries with similar vector-borne disease potential. To this end, the R code producing and depicting the risk indicators is provided in the supplement.

Author Contributions

P.P., N.E.P., C.M., Y.T. and N.D. conceived and designed the study. P.P., N.E.P., C.M. and I.P. collected the data. N.E.P., C.M., A.T., M.K. and N.D. analyzed the data. P.P., N.E.P., C.M. and N.D. wrote the manuscript. All authors have read and agreed to the published version of the manuscript.

Funding

This research received no external funding.

Informed Consent Statement

Not applicable.

Data Availability Statement

The data presented in this study are openly available in https://github.com/valadis/EWS_spatial_maps_R_code.git.

Conflicts of Interest

The authors declare no competing interests.

Appendix A

Alternative representations of risk through spatial maps in R.
Figure A1. Point estimate map of risk of malaria transmission (R0 estimates).
Ijerph 18 01823 g0a1
Figure A2. Point estimate map of risk of malaria transmission (τ estimates).
Ijerph 18 01823 g0a2
Figure A3. Point estimate map of risk of malaria transmission (E estimates).
Ijerph 18 01823 g0a3
Figure A4. Heat-map of risk of malaria transmission (R0 estimates).
Ijerph 18 01823 g0a4
Figure A5. Heat-map of risk of malaria transmission (τ estimates).
Ijerph 18 01823 g0a5
Figure A6. Heat-map of risk of malaria transmission (E estimates).
Ijerph 18 01823 g0a6
Table A1. Population and density data on the 12 municipalities involved in the current study.
MunicipalityAreaPopulationPopulation DensityUrban Area
Aliartos258,449,230.9611,64545.0610,329,054
Amfiklia-Elatia533,074,049.9111,90222.337,157,762
Domokos708,266,142.1715,22721.503,088,636
Thivae832,281,806.1134,40141.3316,878,756
Lamia946,708,662.2071,00675.0027,276,528
Levadia690,056,941.6033,42548.4411,000,844
Makrakomi837,249,336.2919,21122.956,073,913
Molos-St. Konstantinos339,219,708.5813,04838.468,691,250
Orchomenos418,237,273.0813,10731.3410,791,795
Stylida462,005,680.1413,85129.986,335,263
Tanagra460,288,037.4715,08632.7832,420,422
Chalkida425,298,043.4686,393203.1456,371,907
Table A2. Data used in the study.
Data TypeDetailSourceReferences
EntomologicalNumber of mosquitoesTrap surveyThis study
SocialNumber of immigrantsInformation collected by Bioapplications Ltd.https://www.bioapplications.gr/?lang=en (accessed on 6 December 2020)
EnvironmentalTemperatureMeteorological stations (National Observatory of Athens)https://www.meteo.gr/meteomaps/ (accessed on 6 December 2020)
GeographicalMapsNational Bank of Meteorological and Hydrographic Data
(Figure 1)
www.hydroscope.gr (accessed on 6 December 2020)
R Package: ggmap using Stamen open-source maps
(Figure 2, Figure 3, Figure 4 and Figure 5, Figure A1, Figure A2, Figure A3, Figure A4, Figure A5 and Figure A6)
maps.stamen.com (accessed on 6 December 2020)
Table A3. List of parameters utilized for the calculation of risk measures and their interpretations along with corresponding references.
Parameter or VariableInterpretationDistribution/ValueReference
α i % of mosquitoes that feed on humans/dayUniform (0.01, 0.5)[17,20,21],
b i Probability a bite produces infection to a humanUniform (0.2, 0.5)[17,20,21]
cProbability a bite turns a susceptible mosquito to infected0.5[17,20,21]
r i Average daily recovery rate/dayUniform (0.01, 0.5)[17,20,21]
v i # of days from infection to infectiousness in the mosquitoUniform (5, 15)[17,20,21]
m i The ratio of mosquitoes to humans in region iObserved data
g i Mosquito mortality rate/day g i = f ( T i ) [20]
T i Average temperaturesObserved data
θ Spatial parameter for modeling the spatial component of migrant transmissionObserved data
d i k Distances of migrant population from the larvae areasObserved data
Table A4. Descriptive statistics of the estimated risk measures, broken down by Municipality.
MunicipalityRoτEVariation of Ro
AliartosMean0.162000.125
Median0.048000
Std. Deviation0.190000.342
Minimum0.010000
Maximum0.563001
Amfiklia-ElatiaMean0.071001
Median0071001
Std. Deviation 00
Minimum0.071001
Maximum0.071001
ChalkidaMean0.004000
Median0.004000
Std. Deviation 000
Minimum0.004000
Maximum0.004000
DomokosMean0.6020.11069,4000
Median0.6020.11069,4000
Std. Deviation0.7410.15598,1460
Minimum0.078000
Maximum1.1260.220138,8000
LamiaMean0.2580.03349,3160.035
Median0.096000
Std. Deviation0.4740.148218,0710.185
Minimum0.003000
Maximum4.550.9891,458,6001
LevadiaMean0.111000.188
Median0.036000
Std. Deviation0.184000.403
Minimum0.007000
Maximum0.729001
MakrakomiMean0.161000
Median0.161000
Std. Deviation0.191000
Minimum0.026000
Maximum0.296000
Molos-St. KonstantinosMean0.3810.03713,9600.2
Median0.061000
Std. Deviation0.4920.08331,2160.447
Minimum0.011000
Maximum1.1050.18569,8001
OrchomenosMean0.1720.01991460.143
Median0.062000
Std. Deviation0.3030.07339,1380.356
Minimum0.005000
Maximum1.2280.353201,9001
StylidaMean0.098000.333
Median0.011000
Std. Deviation0.153000.577
Minimum0.009000
Maximum0.274001
TanagraMean0.054001.333
Median0.026000
Std. Deviation0.057002.309
Minimum0.016000
Maximum0.119004
ThivaeMean0.4920.04832,0400.6
Median0.385000
Std. Deviation0.3840.10771,6440.894
Minimum0.118000
Maximum1.1290.239160,2002
TotalMean0.2430.02940,4910.076
Median0.085000
Std. Deviation0.4430.134194,9460.326
Minimum0.003000
Maximum4.5500.9891,458,6004

References

  1. WHO (World Health Organization). Vector-Borne Diseases. 2020. Available online: https://www.who.int/news-room/fact-sheets/detail/vector-borne-diseases (accessed on 20 September 2019).
  2. Müller, R.; Reuss, F.; Kendrovski, V.; Montag, D. 2019 Vector-Borne Diseases in Biodiversity and Health in the Face of Climate Change; Marselle, M.R., Stadler, J., Korn, H., Irvine, K.N., Bonne, A., Eds.; Springer Nature: London, UK, 2019; pp. 67–90. [Google Scholar]
  3. Semenza, J.C. Prototype early warning systems for vector-borne diseases in Europe. Int. J. Environ. Res. Public Health 2015, 12, 6333–6351. [Google Scholar] [CrossRef] [Green Version]
  4. Degallier, N.; Favier, C.; Menkes, C.; Lengaigne, M.; Ramalho, W.M.; Souza, R.; Servain, J.; Boulanger, J.-P. Toward an early warning system for dengue prevention: Modeling climate impact on dengue transmission. Clim. Chang. 2010, 98, 581–592. [Google Scholar] [CrossRef]
  5. Kuhn, K.; Campbell-Lendrum, D.; Haines, A.; Cox, J. Using Climate to Predict Infectious Disease Epidemics; World Health Organization: Geneva, Switzerland, 2005. [Google Scholar]
  6. Mordecai, E.A.; Caldwell, J.M.; Grossman, M.K.; Lippi, C.A.; Johnson, L.R.; Neira, M.; Rohr, J.R.; Ryan, S.J.; Savage, V.; Shocket, M.S.; et al. Thermal biology of mosquito-borne disease. Ecol. Let. 2019, 22, 1690–1708. [Google Scholar] [CrossRef] [Green Version]
  7. Calzolari, M. Mosquito-borne diseases in Europe: An emerging public health threat. Rep. Parasitol. 2016, 5, 1–12. [Google Scholar] [CrossRef] [Green Version]
  8. Schaffner, F.; Medlock, J.M.; Van Bortel, W. Public health significance of invasive mosquitoes in Europe. Clin. Microbiol. Infec. 2013, 19, 685–692. [Google Scholar] [CrossRef] [Green Version]
  9. Marques, J.; Cardoso, J.R.; Felix, R.C.; Santana, R.A.G.; das Graças Barbosa Guerra, M.; Power, D.; Silveira, H. Fresh-blood-free diet for rearing malaria mosquito vectors. Sci. Rep. 2018, 8, 17807. [Google Scholar] [CrossRef]
  10. Kerkow, A.; Wieland, R.; Früh, L.; Hölker, F.; Jeschke, J.M.; Werner, D.; Kampen, H. Can data from native mosquitoes support determining invasive species habitats? Modelling the climatic niche of Aedes japonicus japonicus (Diptera, Culicidae) in Germany. Parasitol. Res. 2020, 119, 31–42. [Google Scholar] [CrossRef] [Green Version]
  11. Pergantas, P.; Tsatsaris, A.; Malesios, C.; Kriparakou, G.; Demiris, N.; Tselentis, Y. A spatial predictive model for malaria resurgence in central Greece integrating entomological, environmental and social data. PLoS ONE 2017, 12, e0178836. [Google Scholar]
  12. Gubler, D.J.; Reiter, P.; Ebi, K.L.; Yap, W.; Nasci, R.; Patz, J.A. Climate variability and change in the United States: Potential impacts on vector- and rodent-borne diseases. Environ. Health Perspect. 2001, 109 (Suppl. 2), 223–233. [Google Scholar]
  13. Zeller, H.; Marrama, L.; Sudre, B.; Van Bortel, W.; Warns-Petit, E. Mosquito-borne disease surveillance by the European Centre for Disease Prevention and Control. Clin. Microbiol. Infect. 2013, 19, 693–698. [Google Scholar] [CrossRef] [PubMed] [Green Version]
  14. HCDCP (Hellenic Center for Disease Control and Prevention). Department of Epidemiological Surveillance and Intervention. Epidemiological data for malaria in Greece. 2012. Available online: http://www.keelpno.gr/Portals/0/Files/English%20files/Malaria%20reports/Malaria%20Report_2012_FINAL_23-82013_EN.pdf (accessed on 10 March 2020).
  15. WHO. World Malaria Report; World Health Organization: Geneva, Switzerland, 2019. [Google Scholar]
  16. Łukaszyk, S. A new concept of probability metric and its applications in approximation of scattered data sets. Comput. Mech. 2004, 33, 299–304. [Google Scholar] [CrossRef]
  17. Macdonald, G. The analysis of equilibrium in malaria. Trop. Dis. Bull. 1952, 49, 813–829. [Google Scholar]
  18. Smith, D.L.; McKenzie, F.E. Statics and dynamics of malaria infection in Anopheles mosquitoes. Malar. J. 2004, 3, 13. [Google Scholar] [CrossRef] [PubMed] [Green Version]
  19. WHO. World Malaria Report and WHO Global Health Observatory data Repository. 2019. Available online: https://apps.who.int/gho/data/node.main.A1372?lang=en (accessed on 10 September 2019).
  20. Smith, D.L.; Dushoff, J.; McKenzie, F.E. The risk of a mosquito-borne infection in a heterogeneous environment. PLoS Biol. 2004, 2, 1957–1963. [Google Scholar] [CrossRef] [Green Version]
  21. Ruan, S.; Xiao, D.; Beier, J.C. On the Delayed Ross–Macdonald Model for Malaria Transmission. Bull. Math. Biol. 2008, 70, 1098–1114. [Google Scholar] [CrossRef] [PubMed] [Green Version]
  22. R Development Core Team. R: A Language and Environment for Statistical Computing; R Foundation for Statistical Computing: Vienna, Austria, 2008. [Google Scholar]
  23. Hartemink, N.A.; Purse, B.V.; Meiswinkel, R.; Brown, H.E.; de Koeijer, A.; Elbers, A.R.W.; Boender, G.-J.; Rogers, D.J.; Heesterbeek, J.A.P. Mapping the basic reproduction number (R0) for vector-borne diseases: A case study on bluetongue virus. Epidemics 2009, 1, 153–161. [Google Scholar] [CrossRef]
  24. Kahle, D.; Wickham, H. ggmap: Spatial Visualization with ggplot2. R J. 2013, 5, 144–161. [Google Scholar] [CrossRef] [Green Version]
  25. Ripley, B.D.; Venables, W.N. Modern Applied Statistics; Springer: Berlin/Heidelberg, Germany, 2002. [Google Scholar]
  26. Eurostat. Asylum applications (non-EU) in the EU-28 Member States, 2008–2018. Available online: https://ec.europa.eu/eurostat/statistics-explained/index.php/Asylum_statistics.Data (accessed on 16 March 2020).
  27. Fotakis, E.A.; Giantsis, I.A.; Sierra, J.C.; Tanti, F.; Balaska, S.; Mavridis, K.; Kourtidis, S.; Vontas, J.; Chaskopoulou, A. Population dynamics, pathogen detection and insecticide resistance of mosquito and sand fly in refugee camps, Greece. Infect. Dis. Poverty 2020, 9, 30. [Google Scholar] [CrossRef] [Green Version]
  28. Diuk-Wasser, M.A.; Brown, H.E.; Andreadis, T.G.; Fish, D. Modeling the Spatial Distribution of Mosquito Vectors for West Nile Virus in Connecticut, USA. Vector Borne Zoonotic Dis. 2006, 6, 283–295. [Google Scholar] [CrossRef] [Green Version]
  29. Ibañez-Justicia, A.; Cianci, D. Modelling the spatial distribution of the nuisance mosquito species Anopheles plumbeus (Diptera: Culicidae) in The Netherlands. Parasit. Vectors 2015, 8, 258. [Google Scholar] [CrossRef] [Green Version]
  30. Minakawa, N.; Mutero, C.M.; Githure, J.I.; Beier, J.C.; Yan, G. Spatial distribution and habitat characterization of Anopheline mosquito larvae in western Kenya. Am. J. Trop. Med. Hyg. 1999, 61, 1010–1016. [Google Scholar] [CrossRef] [Green Version]
  31. Yamasita, W.M.S.; Das, S.S.; Chapiro, G. Numerical modeling of mosquito population dynamics of Aedes aegypti. Parasit. Vectors 2018, 11, 245. [Google Scholar] [CrossRef] [Green Version]
  32. Huey, R.B.; Berrigan, D. Temperature, demography and ectotherm fitness. Am. Nat. 2001, 158, 204–210. [Google Scholar] [CrossRef]
  33. Huffaker, C.B.; Messenger, P.S.; DeBach, P. The natural enemy component in natural control and the theory of biological control. In Biological Control; Huffaker, C.B., Ed.; Springer: Boston, MA, USA, 1971. [Google Scholar]
  34. Messenger, P.S. Bioclimatic studies with insects. Annu. Rev. Entomol. 1959, 4, 183–206. [Google Scholar] [CrossRef]
  35. Kontodimas, D.C.; Eliopoulos, P.A.; Stathas, G.J.; Economou, L.P. Comparative temperature-dependent development of Nephus includens (Kirsch) and Nephus bisignatus (Boheman) (Coleoptera: Coccinellidae) preying on Planococcus citri (Risso) (Homoptera: Pseudococcidae): Evaluation of a linear and various nonlinear models using specific criteria. Environ. Entomol. 2004, 33, 1–11. [Google Scholar]
  36. Jalali, M.A.; Tirry, L.; Arbab, A.; De Clercq, P. Temperature-dependent development of the two-spotted ladybeetle, Adalia bipunctata, on the green peach aphid, Myzus persicae, and a factitious food under constant temperatures. J. Insect Sci. 2010, 10, 124. [Google Scholar] [CrossRef] [PubMed] [Green Version]
  37. Papanikolaou, N.E.; Milonas, P.G.; Kontodimas, D.C.; Demiris, N.; Matsinos, Y.G. Temperature-dependent development, survival, longevity and fecundity of Propylea quatuordecimpunctata (Coleoptera: Coccinellidae). Ann. Entomol. Soc. Am. 2013, 106, 228–234. [Google Scholar] [CrossRef] [Green Version]
  38. Kontodimas, D.C.; Milonas, P.G.; Stathas, G.J.; Economou, L.P.; Kavallieratos, N.G. Life table parameters of the pseudococcid predators Nephus includens and Nephus bisignatus (Coleoptera: Coccinelidae). Eur. J. Entomol. 2007, 104, 407–415. [Google Scholar] [CrossRef] [Green Version]
  39. Papanikolaou, N.E.; Milonas, P.G.; Kontodimas, D.C.; Demiris, N.; Matsinos, Y.G. Life table analysis of Propylea quatuordecimpunctata (Coleoptera: Coccinellidae) at constant temperatures. Ann. Entomol. Soc. Am. 2014, 107, 158–162. [Google Scholar] [CrossRef] [Green Version]
  40. Papanikolaou, N.E.; Kavallieratos, N.G.; Kondakis, N.; Boukouvala, M.C.; Nika, E.P.; Demiris, N. Elucidating fitness components of the invasive dermestid beetle Trogoderma granarium Everts (Coleoptera: Dermestidae) at constant temperatures, combining deterministic and stochastic demography. PLoS ONE 2019, 14, e0212182. [Google Scholar] [CrossRef] [Green Version]
  41. Bardosh, K.L.; Ryan, S.; Ebi, K.; Welburn, S.; Singer, B. Addressing vulnerability, building resilience: Community-based adaptation to vector-borne diseases in the context of global change. Infect. Dis. Poverty 2017, 6, 166. [Google Scholar] [CrossRef] [Green Version]
Figure 1. Map of study area.
Ijerph 18 01823 g001
Figure 2. Map depicting the risk of malaria transmission in the form of R0.
Ijerph 18 01823 g002
Figure 3. Map of risk of malaria transmission, computed by the EWS model (τ estimates).
Ijerph 18 01823 g003
Figure 4. Map of risk of malaria transmission, computed by the EWS model (Ε estimates).
Ijerph 18 01823 g004
Figure 5. Uncertainty in R0, in the form of the standard deviation of R0 (based on 1000 samples).
Ijerph 18 01823 g005
Publisher’s Note: MDPI stays neutral with regard to jurisdictional claims in published maps and institutional affiliations.

