
Educational Attainment and Prevalence of Cardiovascular Health (Life’s Simple 7) in Asian Americans


Abstract
1. Introduction
2. Methods
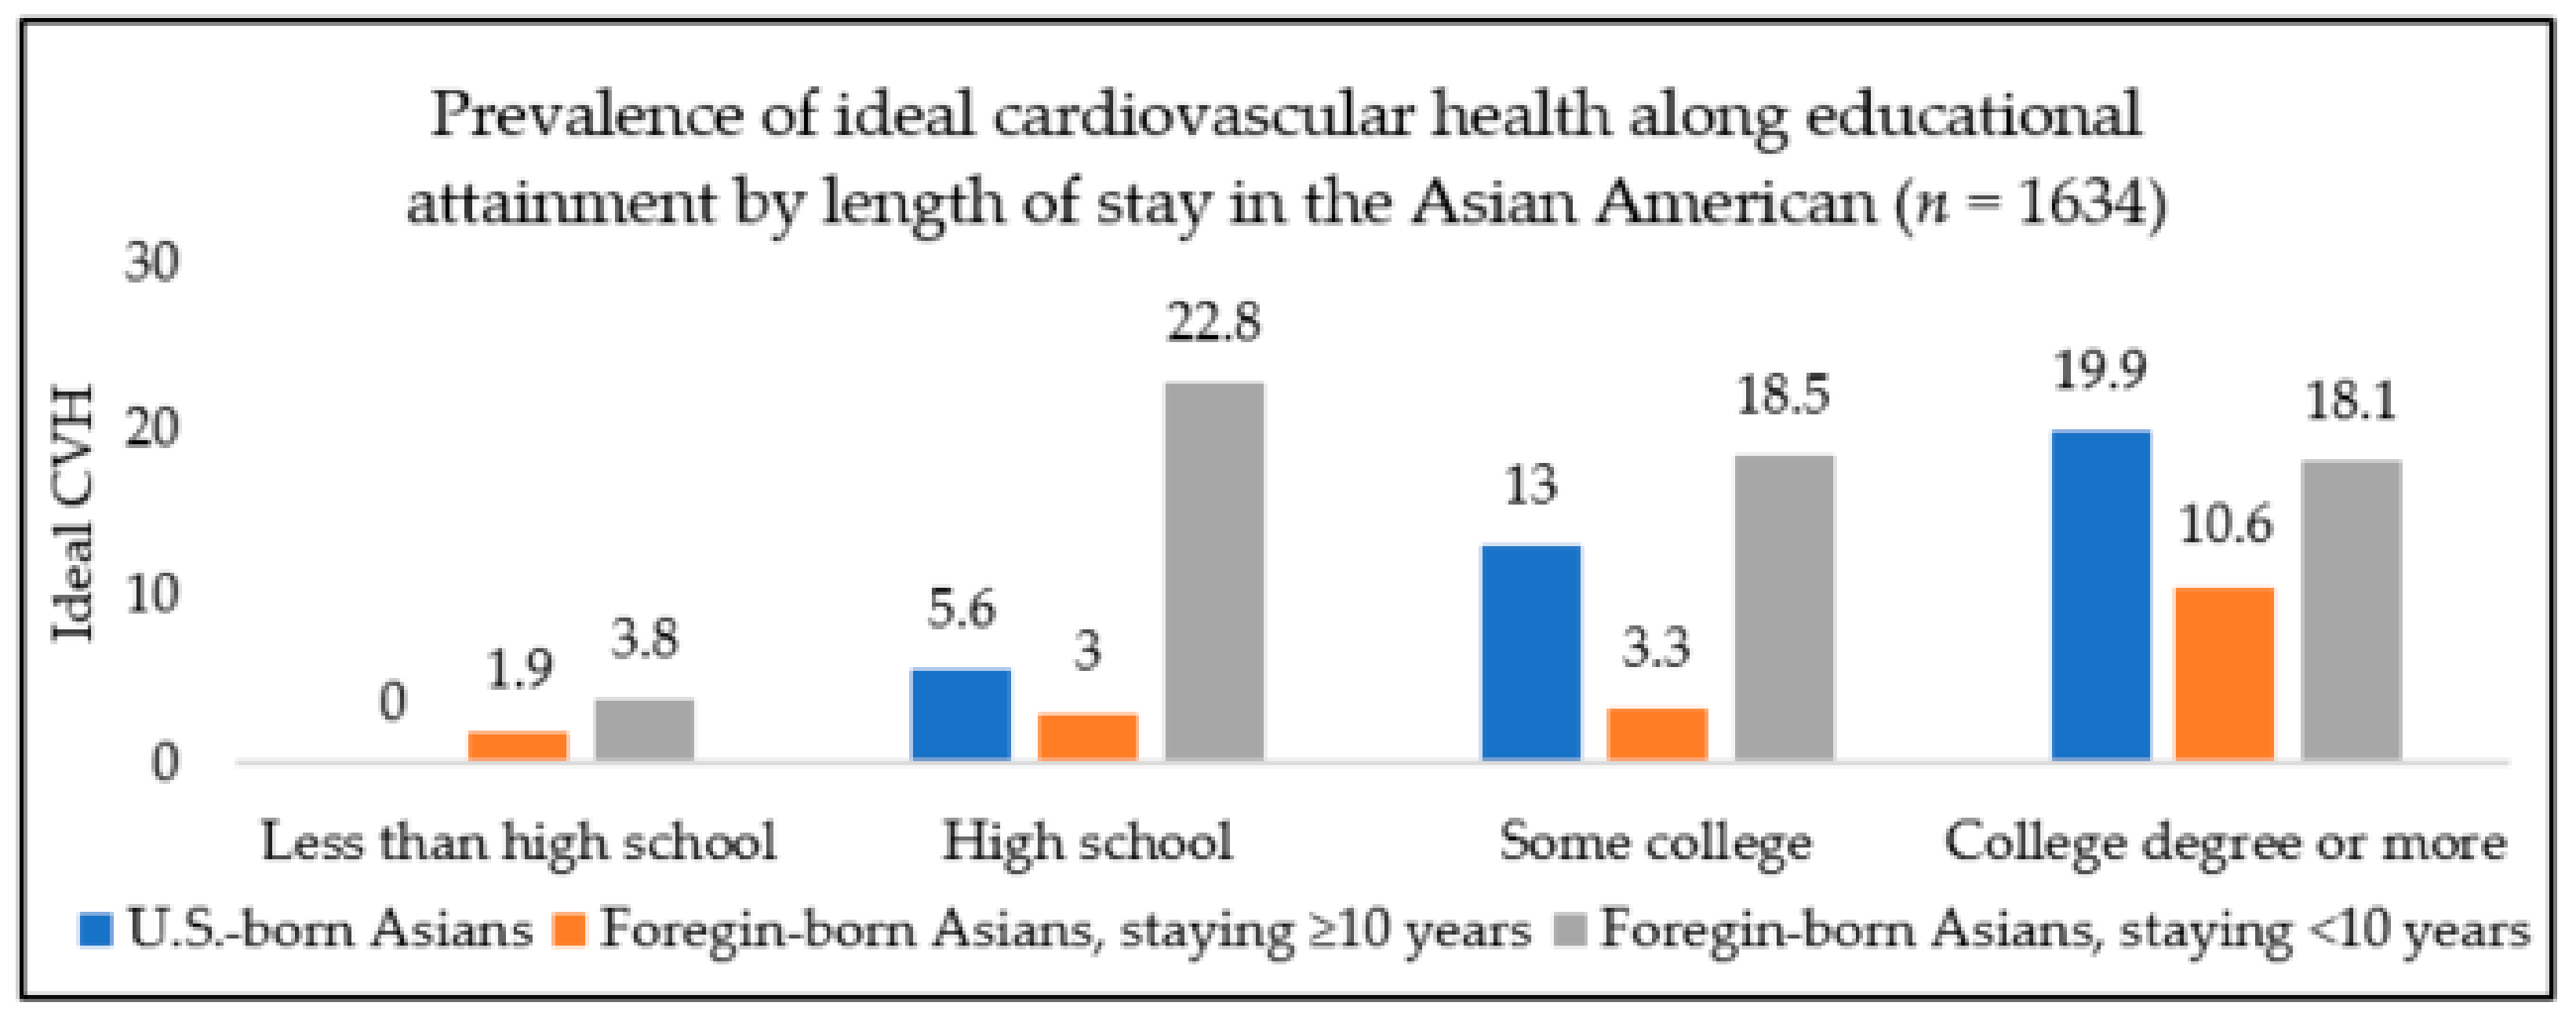
3. Results
4. Discussion
5. Limitation
6. Conclusions
Author Contributions
Funding
Institutional Review Board Statement
Informed Consent Statement
Data Availability Statement
Acknowledgments
Conflicts of Interest
References
- Benjamin Emelia, J.; Paul, M.; Alvaro, A.; Bittencourt Marcio, S.; Callaway Clifton, W.; Carson April, P.; Chamberlain Alanna, M.; Chang Alexander, R.; Susan, C.; Das Sandeep, R.; et al. Heart Disease and Stroke Statistics—2019 Update: A Report from the American Heart Association. Circulation 2019, 139, e56–e528. [Google Scholar] [CrossRef] [PubMed]
- CDC. CDC Heart Disease Facts|Cdc.Gov. Available online: https://www.cdc.gov/heartdisease/facts.htm (accessed on 16 January 2021).
- Virani Salim, S.; Alvaro, A.; Benjamin Emelia, J.; Bittencourt Marcio, S.; Callaway Clifton, W.; Carson April, P.; Chamberlain Alanna, M.; Chang Alexander, R.; Susan, C.; Delling Francesca, N.; et al. Heart Disease and Stroke Statistics—2020 Update: A Report from the American Heart Association. Circulation 2020, 141, e139–e596. [Google Scholar] [CrossRef] [PubMed]
- Fryar, C.D.; Chen, T.C.; Li, X. Prevalence of Uncontrolled Risk Factors for Cardiovascular Disease: United States, 1999–2010; NCHS Data Brief; US Department of Health and Human Services, Centers for Disease Control and Prevention, National Center for Health Statistics: Hyattsville, MD, USA, 2012. [Google Scholar]
- Jose, P.O.; Frank, A.T.; Kapphahn, K.I.; Goldstein, B.A.; Eggleston, K.; Hastings, K.G.; Cullen, M.R.; Palaniappan, L.P. Cardiovascular Disease Mortality in Asian Americans (2003–2010). J. Am. Coll. Cardiol. 2014, 64, 2486–2494. [Google Scholar] [CrossRef]
- Palaniappan, L.P.; Araneta, M.R.G.; Assimes, T.L.; Barrett-Connor, E.L.; Carnethon, M.R.; Criqui, M.H.; Fung, G.L.; Narayan, K.V.; Patel, H.; Taylor-Piliae, R.E.; et al. Call to Action: Cardiovascular Disease in Asian Americans. Circulation 2010, 122, 1242–1252. [Google Scholar] [CrossRef] [PubMed]
- Echeverria, S.E.; Mustafa, M.; Pentakota, S.R.; Kim, S.; Hastings, K.G.; Amadi, C.; Palaniappan, L. Social and Clinically-Relevant Cardiovascular Risk Factors in Asian Americans Adults: NHANES 2011–2014. Prev. Med. 2017, 99, 222–227. [Google Scholar] [CrossRef]
- Bureau, U.C. Asian-American and Pacific Islander Heritage Month: May 2019. Available online: https://www.census.gov/newsroom/facts-for-features/2019/asian-american-pacific-islander.html (accessed on 9 May 2020).
- Bureau, U.C. Demographic Turning Points for the United States. Available online: https://www.census.gov/library/publications/2020/demo/p25-1144.html (accessed on 9 May 2020).
- Djoussé, L.; Petrone, A.B.; Blackshear, C.; Griswold, M.; Harman, J.L.; Clark, C.R.; Talegawkar, S.; Hickson, D.A.; Gaziano, J.M.; Dubbert, P.M.; et al. Prevalence and Changes over Time of Ideal Cardiovascular Health Metrics among African–Americans: The Jackson Heart Study. Prev. Med. 2015, 74, 111–116. [Google Scholar] [CrossRef]
- González, H.M.; Tarraf, W.; Gouskova, N.; Rodríguez, C.J.; Rundek, T.; Grober, E.; Pirzada, A.; González, P.; Lutsey, P.L.; Camacho, A.; et al. Life’s Simple 7’s Cardiovascular Health Metrics Are Associated with Hispanic/Latino Neurocognitive Function: HCHS/SOL Results. J. Alzheimers Dis. JAD 2016, 53, 955–965. [Google Scholar] [CrossRef]
- Lloyd-Jones Donald, M.; Yuling, H.; Darwin, L.; Dariush, M.; Appel Lawrence, J.; Linda, V.H.; Kurt, G.; Stephen, D.; Graham, N.; Tomaselli Gordon, F.; et al. Defining and Setting National Goals for Cardiovascular Health Promotion and Disease Reduction. Circulation 2010, 121, 586–613. [Google Scholar] [CrossRef] [PubMed]
- Ren, J.; Guo, X.L.; Lu, Z.L.; Zhang, J.Y.; Tang, J.L.; Chen, X.; Gao, C.C.; Xu, C.X.; Xu, A.Q. Ideal Cardiovascular Health Status and Its Association with Socioeconomic Factors in Chinese Adults in Shandong, China. BMC Public Health 2016, 16. [Google Scholar] [CrossRef]
- Roger, V.L.; Stephen, S.; Fairchild, A.L.; Howard, V.J.; Labarthe, D.R.; Shay, C.M.; Tiner, A.C.; Whitsel, L.P.; Rosamond, W.D. Recommendations for Cardiovascular Health and Disease Surveillance for 2030 and Beyond: A Policy Statement from the American Heart Association. Circulation 2020, 141, e104–e119. [Google Scholar] [CrossRef] [PubMed]
- Two Feathers, J.; Kieffer, E.C.; Palmisano, G.; Anderson, M.; Sinco, B.; Janz, N.; Heisler, M.; Spencer, M.; Guzman, R.; Thompson, J.; et al. Racial and Ethnic Approaches to Community Health (REACH) Detroit Partnership: Improving Diabetes-Related Outcomes among African American and Latino Adults. Am. J. Public Health 2005, 95, 1552–1560. [Google Scholar] [CrossRef] [PubMed]
- Fang, J.; Zhang, Z.; Ayala, C.; Thompson-Paul, A.M.; Loustalot, F. Cardiovascular Health among Non-Hispanic Asian Americans: NHANES, 2011–2016. J. Am. Heart Assoc. 2019, 8. [Google Scholar] [CrossRef] [PubMed]
- Folsom, A.R.; Yatsuya, H.; Nettleton, J.A.; Lutsey, P.L.; Cushman, M.; Rosamond, W.D. Community Prevalence of Ideal Cardiovascular Health, by the AHA Definition, and Relation to Cardiovascular Disease Incidence. J. Am. Coll. Cardiol. 2011, 57, 1690–1696. [Google Scholar] [CrossRef] [PubMed]
- Mujahid, M.S.; Moore, L.V.; Petito, L.C.; Kershaw, K.N.; Watson, K.; Diez Roux, A.V. Neighborhoods and Racial/Ethnic Differences in Ideal Cardiovascular Health (the Multi-Ethnic Study of Atherosclerosis). Health Place 2017, 44, 61–69. [Google Scholar] [CrossRef]
- Shay, C.M.; Ning, H.; Allen, N.B.; Carnethon, M.R.; Chiuve, S.E.; Greenlund, K.J.; Daviglus, M.L.; Lloyd-Jones, D.M. Status of Cardiovascular Health in US Adults: Prevalence Estimates from the National Health and Nutrition Examination Surveys (NHANES) 2003–2008. Circulation 2012, 125, 45–56. [Google Scholar] [CrossRef]
- Vetrano, D.L.; Martone, A.M.; Mastropaolo, S.; Tosato, M.; Colloca, G.; Marzetti, E.; Onder, G.; Bernabei, R.; Landi, F. Prevalence of the Seven Cardiovascular Health Metrics in a Mediterranean Country: Results from a Cross-Sectional Study. Eur. J. Public Health 2013, 23, 858–862. [Google Scholar] [CrossRef]
- Yang, Q.; Cogswell, M.E.; Flanders, W.D.; Hong, Y.; Zhang, Z.; Loustalot, F.; Gillespie, C.; Merritt, R.; Hu, F.B. Trends in Cardiovascular Health Metrics and Associations with All-Cause and CVD Mortality among US Adults. JAMA 2012, 307, 1273–1283. [Google Scholar] [CrossRef] [PubMed]
- Gee, G.C.; Ro, A.; Shariff-Marco, S.; Chae, D. Racial Discrimination and Health among Asian Americans: Evidence, Assessment, and Directions for Future Research. Epidemiol. Rev. 2009, 31, 130–151. [Google Scholar] [CrossRef]
- Sánchez-Vaznaugh, E.V.; Kawachi, I.; Subramanian, S.V.; Sánchez, B.N.; Acevedo-Garcia, D. Do Socioeconomic Gradients in Body Mass Index Vary by Race/Ethnicity, Gender, and Birthplace? Am. J. Epidemiol. 2009, 169, 1102–1112. [Google Scholar] [CrossRef]
- Bates, L.M.; Acevedo-Garcia, D.; Alegría, M.; Krieger, N. Immigration and Generational Trends in Body Mass Index and Obesity in the United States: Results of the National Latino and Asian American Survey, 2002–2003. Am. J. Public Health 2008, 98, 70–77. [Google Scholar] [CrossRef]
- Fang, J.; Yang, Q.; Hong, Y.; Loustalot, F. Status of Cardiovascular Health among Adult Americans in the 50 States and the District of Columbia, 2009. J. Am. Heart Assoc. 2012, 1. [Google Scholar] [CrossRef] [PubMed]
- Gee, G.C.; de Castro, A.B.; Crespi, C.; Wang, M.; Hing, A.; Bacong, A.; Llave, K. Pre-Acculturation as a Risk Factor for Obesity: Findings from the Health of Philippine Emigrants Study (HoPES). SSM Popul. Health 2019, 9. [Google Scholar] [CrossRef] [PubMed]
- Kumanyika Shiriki, K.; Eva, O.; Nicolas, S.; Ronny, B.; Field Alison, E.; Fortmann Stephen, P.; Franklin Barry, A.; Gillman Matthew, W.; Lewis Cora, E.; Carlos, P.W.; et al. Population-Based Prevention of Obesity. Circulation 2008, 118, 428–464. [Google Scholar] [CrossRef] [PubMed]
- Ro, A. The Longer You Stay, the Worse Your Health? A Critical Review of the Negative Acculturation Theory among Asian Immigrants. Int. J. Environ. Res. Public. Health 2014, 11, 8038–8057. [Google Scholar] [CrossRef]
- CDC/NCHS. NHANES-About the National Health and Nutrition Examination Survey. Available online: https://www.cdc.gov/nchs/nhanes/about_nhanes.htm (accessed on 19 January 2021).
- Davy, B.M.; Estabrooks, P.A. The Validity of Self-Reported Dietary Intake Data: Focus on the “What We Eat In America” Component of the National Health and Nutrition Examination Survey Research Initiative. Mayo Clin. Proc. 2015, 90, 845–847. [Google Scholar] [CrossRef]
- Kirkpatrick, S.I.; Reedy, J.; Krebs-Smith, S.M.; Pannucci, T.E.; Subar, A.F.; Wilson, M.M.; Lerman, J.L.; Tooze, J.A. Applications of the Healthy Eating Index for Surveillance, Epidemiology, and Intervention Research: Considerations and Caveats. J. Acad. Nutr. Diet. 2018, 118, 1603–1621. [Google Scholar] [CrossRef] [PubMed]
- USDA/FPED. FPED Overview: USDA ARS. Available online: https://www.ars.usda.gov/northeast-area/beltsville-md-bhnrc/beltsville-human-nutrition-research-center/food-surveys-research-group/docs/fped-overview/ (accessed on 17 January 2021).
- CDC/OMB. Office of Management and Budget Directive 15: Race and Ethnic Standards for Federal Statistics and Administration Reporting. Available online: https://wonder.cdc.gov/wonder/help/populations/bridged-race/Directive15.html (accessed on 19 January 2021).
- Paulose-Ram, R.; Burt, V.; Broitman, L.; Ahluwalia, N. Overview of Asian American Data Collection, Release, and Analysis: National Health and Nutrition Examination Survey 2011–2018. Am. J. Public Health 2017, 107, 916–921. [Google Scholar] [CrossRef]
- Consultation, E. Appropriate Body-Mass Index for Asian Populations and Its Implications for Policy and Intervention Strategies. Lancet 2004, 363, 157–163. [Google Scholar] [CrossRef]
- Hsu, W.C.; Araneta, M.R.G.; Kanaya, A.M.; Chiang, J.L.; Fujimoto, W. BMI Cut Points to Identify At-Risk Asian Americans for Type 2 Diabetes Screening. Diabetes Care 2015, 38, 150–158. [Google Scholar] [CrossRef]
- Yoon, K.-H.; Lee, J.-H.; Kim, J.-W.; Cho, J.H.; Choi, Y.-H.; Ko, S.-H.; Zimmet, P.; Son, H.-Y. Epidemic Obesity and Type 2 Diabetes in Asia. Lancet 2006, 368, 1681–1688. [Google Scholar] [CrossRef]
- Ramachandran, A.; Wan Ma, R.C.; Snehalatha, C. Diabetes in Asia. Lancet 2010, 375, 408–418. [Google Scholar] [CrossRef]
- Hsu, W.C.; Boyko, E.J.; Fujimoto, W.Y.; Kanaya, A.; Karmally, W.; Karter, A.; King, G.L.; Look, M.; Maskarinec, G.; Misra, R.; et al. Pathophysiologic Differences among Asians, Native Hawaiians, and Other Pacific Islanders and Treatment Implications. Diabetes Care 2012, 35, 1189–1198. [Google Scholar] [CrossRef]
- Misra, A.; Dhurandhar, N.V. Current Formula for Calculating Body Mass Index Is Applicable to Asian Populations. Nutr. Diabetes 2019, 9, 3. [Google Scholar] [CrossRef]
- CDC/NCHS. NHANES 2015-2016 Laboratory Data Overview. Available online: https://wwwn.cdc.gov/nchs/nhanes/continuousnhanes/overviewlab.aspx?BeginYear=2015 (accessed on 20 January 2021).
- Rodriguez, F.; Echeverría, S.E.; Pentakota, S.R.; Amadi, C.; Hastings, K.G.; Palaniappan, L.P. Comparison of Ideal Cardiovascular Health Attainment and Acculturation among Asian Americans and Latinos. Ethn. Dis. 2019, 29, 287–296. [Google Scholar] [CrossRef]
- NHANES 2015–2016: Blood Pressure Data Documentation, Codebook, and Frequencies. Available online: https://wwwn.cdc.gov/Nchs/Nhanes/2015-2016/BPX_I.htm (accessed on 20 January 2021).
- Whelton, P.K.; Carey, R.M.; Aronow, W.S.; Casey, D.E.; Collins, K.J.; Dennison Himmelfarb, C.; DePalma, S.M.; Gidding, S.; Jamerson, K.A.; Jones, D.W.; et al. 2017 ACC/AHA/AAPA/ABC/ACPM/AGS/APhA/ASH/ASPC/NMA/PCNA Guideline for the Prevention, Detection, Evaluation, and Management of High Blood Pressure in Adults: A Report of the American College of Cardiology/American Heart Association Task Force on Clinical Practice Guidelines. Hypertension 2018, 71. [Google Scholar] [CrossRef]
- Jamal, A. Current Cigarette Smoking among Adults—United States, 2005–2015. MMWR Morb. Mortal. Wkly. Rep. 2016, 65. [Google Scholar] [CrossRef] [PubMed]
- Craig, C.L.; Marshall, A.L.; Sjöström, M.; Bauman, A.E.; Booth, M.L.; Ainsworth, B.E.; Pratt, M.; Ekelund, U.; Yngve, A.; Sallis, J.F.; et al. International Physical Activity Questionnaire: 12-Country Reliability and Validity. Med. Sci. Sports Exerc. 2003, 35, 1381–1395. [Google Scholar] [CrossRef]
- Kim, J.I.; Sillah, A.; Boucher, J.L.; Sidebottom, A.C.; Knickelbine, T. Prevalence of the American Heart Association’s “Ideal Cardiovascular Health” Metrics in a Rural, Cross-sectional, Community-Based Study: The Heart of New Ulm Project. J. Am. Heart Assoc. 2013, 2. [Google Scholar] [CrossRef] [PubMed]
- Piercy, K.L.; Troiano, R.P.; Ballard, R.M.; Carlson, S.A.; Fulton, J.E.; Galuska, D.A.; George, S.M.; Olson, R.D. The Physical Activity Guidelines for Americans. JAMA 2018, 320, 2020–2028. [Google Scholar] [CrossRef]
- Krebs-Smith, S.M.; Pannucci, T.E.; Subar, A.F.; Kirkpatrick, S.I.; Lerman, J.L.; Tooze, J.A.; Wilson, M.M.; Reedy, J. Update of the Healthy Eating Index: HEI-2015. J. Acad. Nutr. Diet. 2018, 118, 1591–1602. [Google Scholar] [CrossRef]
- Abraído-Lanza, A.F.; Echeverría, S.E.; Flórez, K.R. Latino Immigrants, Acculturation, and Health: Promising New Directions in Research. Annu. Rev. Public Health 2016, 37, 219–236. [Google Scholar] [CrossRef] [PubMed]
- Gaye, B.; Tajeu, G.S.; Offredo, L.; Vignac, M.; Johnson, S.; Thomas, F.; Jouven, X. Temporal Trends of Cardiovascular Health Factors among 366,270 French Adults. Eur. Heart J. Qual. Care Clin. Outcomes 2019. [Google Scholar] [CrossRef]
- Chen, M.S.; Hawks, B.L. A Debunking of the Myth of Healthy Asian Americans and Pacific Islanders. Am. J. Health Promot. 1995, 9, 261–268. [Google Scholar] [CrossRef] [PubMed]
- Yi, S.; Kwon, S.; Sacks, R.; Trinh-Shevrin, C. Commentary: Persistence and Health-Related Consequences of the Model Minority Stereotype for Asian Americans. Ethn. Dis. 2016, 26 1, 133–138. [Google Scholar] [CrossRef]
- Cheng, A.W.; Chang, J.; O’Brien, J.; Budgazad, M.S.; Tsai, J. Model Minority Stereotype: Influence on Perceived Mental Health Needs of Asian Americans. J. Immigr. Minor. Health 2017, 19, 572–581. [Google Scholar] [CrossRef] [PubMed]
- Museus, S.D.; Kiang, P.N. Deconstructing the Model Minority Myth and How It Contributes to the Invisible Minority Reality in Higher Education Research. New Dir. Inst. Res. 2009, 2009, 5–15. [Google Scholar] [CrossRef]
- Contreras, C.A. Addressing Cardiovascular Health in Asian Americans and Pacific Islanders: A Background Report. Asian Am. Pac. Isl. J. Health 1999, 7, 95–145. [Google Scholar] [PubMed]
- Tu, J.V.; Chu, A.; Rezai, M.R.; Guo, H.; Maclagan, L.C.; Austin, P.C.; Booth, G.L.; Manuel, D.G.; Chiu, M.; Ko, D.T.; et al. Incidence of Major Cardiovascular Events in Immigrants to Ontario, Canada: The CANHEART Immigrant Study. Circulation 2015, 132, 1549–1559. [Google Scholar] [CrossRef] [PubMed]
- Fang, J.; Yuan, K.; Gindi, R.M.; Ward, B.W.; Ayala, C.; Loustalot, F. Association of Birthplace and Coronary Heart Disease and Stroke among US Adults: National Health Interview Survey, 2006 to 2014. J. Am. Heart Assoc. 2018, 7. [Google Scholar] [CrossRef] [PubMed]
- Taylor, V.; Yasui, Y.; Tu, S.-P.; Neuhouser, M.; Li, L.; Woodall, E.; Acorda, E.; Cripe, S.M.; Hislop, T. Heart Disease Prevention among Chinese Immigrants. J. Community Health 2007, 32, 299–310. [Google Scholar] [CrossRef]
- Lee, J.W.R.; Brancati, F.L.; Yeh, H.-C. Trends in the Prevalence of Type 2 Diabetes in Asians versus Whites: Results from the United States National Health Interview Survey, 1997–2008. Diabetes Care 2011, 34, 353–357. [Google Scholar] [CrossRef] [PubMed]
- Ye, J.; Rust, G.; Baltrus, P.; Daniels, E. Cardiovascular Risk Factors among Asian Americans: Results from a National Health Survey. Ann. Epidemiol. 2009, 19, 718–723. [Google Scholar] [CrossRef] [PubMed]


| Characteristics | Asians, U.S.-Born (n = 226) | Asians, Foreign-Born, ≥10 Years (n = 993) | Asians, Foreign-Born, <10 Years (n = 404) | p-Value * |
|---|---|---|---|---|
| % (Weighted Frequency), n | ||||
| Age mean (SE) | 36.2 (1.46) | 49.8 (0.78) | 35.8 (1.00) | <0.0001 |
| Age category (years) | <0.0001 | |||
| 20–39 | 69.7 (152) | 25.6 (236) | 72.3 (277) | |
| 40–64 | 20.1 (48) | 56.3 (572) | 22.5 (102) | |
| 65+ | 10.4 (26) | 18.2 (185) | 5.2 (25) | |
| Sex at birth | 0.123 | |||
| Male | 50.7 (121) | 45.9 (481) | 51.3 (216) | |
| Female | 49.3 (105) | 54.1 (512) | 48.7 (188) | |
| Educational level | <0.0001 | |||
| Less than high school | 1.7 (5) | 13.2 (141) | 13.0 (57) | |
| High school | 10.2 (22) | 13.1 (137) | 11.7 (51) | |
| Some college education | 31.5 (70) | 19.5 (194) | 14.1 (61) | |
| College graduate or more | 56.6 (129) | 54.2 (521) | 61.2 (235) | |
| Income level | <0.0001 | |||
| $0–$24,999 | 10.1 (24) | 13.3 (134) | 14.6 (57) | |
| $25,000–$74,999 | 37.7 (78) | 37.8 (353) | 44.4 (172) | |
| $75,000+ | 53.2 (113) | 49.9 (443) | 41.0 (145) | |
| HbA1c (%) | <0.0001 | |||
| HbA1c less than 6.5% | 80.0 (174) | 54.1 (499) | 80.3 (298) | |
| HbA1c more than 6.5% | 20.0 (46) | 45.9 (450) | 19.8 (88) | |
| BMI (kg/m2) (Asian cut off) | <0.0001 | |||
| Non obese (18.5 to <25) | 54.5 (126) | 58.1 (566) | 62.5 (253) | |
| Obese (≥25) | 45.5 (99) | 41.9 (418) | 37.5 (150) | |
| Diet score | <0.0001 | |||
| Ideal (≥81) | 4.3 (10) | 4.6 (45) | 3.2 (13) | |
| Poor (0–80) | 95.7 (215) | 95.4 (932) | 96.8 (388) | |
| Blood pressure (mm of Hg) | <0.0001 | |||
| Ideal (systolic <120, diastolic <80) | 54.0 (120) | 43.2 (405) | 68.4 (257) | |
| Poor or elevated (systolic >120, diastolic >80) | 46.0 (104) | 56.8 (554) | 31.6 (133) | |
| Smoking | <0.0001 | |||
| Ideal (never smoked or quit >1 year) | 84.0 (191) | 90.1 (890) | 89.6 (360) | |
| Poor (current smoker or quit <1 year) | 16.0 (35) | 9.9 (103) | 10.4 (44) | |
| Total Cholesterol (mg/dl) | <0.0001 | |||
| Ideal (<200) | 62.0 (134) | 42.3 (377) | 62.7 (235) | |
| Poor (>200) | 38.0 (85) | 57.7 (556) | 37.4 (147) | |
| Physical activity (PA) | <0.05 | |||
| Ideal (≥75 min vig. or ≥150 min mod PA/wk) | 55.1 (125) | 39.9 (390) | 41.4 (161) | |
| Poor (<75 min vig. or <150 min mod PA/wk) | 44.9 (101) | 60.2 (603) | 58.6 (243) | |
| CVH metrics ** | <0.0001 | |||
| Ideal (6 or more metrics) | 15.9 (35) | 7.1 (54) | 17.1 (56) | |
| Non-ideal (0–5 metrics) | 84.1 (180) | 92.9 (828) | 82.9 (310) | |
| Educational Level | N | Model 1 (Crude) OR (95% CI) b | Model 2 OR (95% CI) b | Model 3 OR (95% CI) b |
|---|---|---|---|---|
| Less than high school | 203 | 0.15 (0.05, 0.46) | 0.27 (0.08, 0.85) | 0.34 (0.10, 1.13) |
| High school | 210 | 0.55 (0.31, 0.98) | 0.64 (0.36, 1.16) | 0.78 (0.41, 1.48) |
| Some college | 325 | 0.55 (0.35, 0.86) | 0.52 (0.34, 0.79) | 0.52 (0.34, 0.80) |
| College degree or more | 885 | 1.00 | 1.00 | 1.00 |
| Educational Level | Length of Stay in U.S. Less than 10 Years (n = 404) | Length of Stay in U.S. 10 Years or More (n = 993) | ||||||
|---|---|---|---|---|---|---|---|---|
| n | Model 1 (Crude) OR (95% CI) b | Model 2 OR, (95% CI) b | Model 3 OR, (95% CI) b | n | Model 1 (Crude) OR (95% CI) b | Model 2 OR, (95% CI) b | Model 3 OR, (95% CI) b | |
| Less than high school | 57 | 0.18 (0.04, 0.85) | 0.34 (0.06, 1.92) | 0.45 (0.09, 2.35) | 141 | 0.16 (0.03, 0.77) | 0.24 (0.05, 1.18) | 0.36 (0.06, 1.94) |
| High school | 51 | 1.33 (0.53, 3.36) | 1.50 (0.57, 3.94) | 2.09 (0.72, 6.04) | 137 | 0.26 (0.08, 0.88) | 0.30 (0.09, 1.04) | 0.41 (0.12, 1.43) |
| Some college | 61 | 1.02 (0.52, 2.02) | 1.08 (0.55, 2.12) | 1.14 (0.55, 2.39) | 194 | 0.28 (0.11, 0.77) | 0.23 (0.10, 0.55) | 0.23 (0.11, 0.51) |
| College degree or more | 235 | 1.00 | 1.00 | 1.00 | 521 | 1.00 | 1.00 | 1.00 |
Publisher’s Note: MDPI stays neutral with regard to jurisdictional claims in published maps and institutional affiliations. |
© 2021 by the authors. Licensee MDPI, Basel, Switzerland. This article is an open access article distributed under the terms and conditions of the Creative Commons Attribution (CC BY) license (http://creativecommons.org/licenses/by/4.0/).
Share and Cite
Alam, M.T.; Echeverria, S.E.; DuPont-Reyes, M.J.; Vasquez, E.; Murillo, R.; Gonzalez, T.; Rodriguez, F. Educational Attainment and Prevalence of Cardiovascular Health (Life’s Simple 7) in Asian Americans. Int. J. Environ. Res. Public Health 2021, 18, 1480. https://doi.org/10.3390/ijerph18041480
Alam MT, Echeverria SE, DuPont-Reyes MJ, Vasquez E, Murillo R, Gonzalez T, Rodriguez F. Educational Attainment and Prevalence of Cardiovascular Health (Life’s Simple 7) in Asian Americans. International Journal of Environmental Research and Public Health. 2021; 18(4):1480. https://doi.org/10.3390/ijerph18041480
Chicago/Turabian StyleAlam, Md Towfiqul, Sandra E. Echeverria, Melissa J. DuPont-Reyes, Elizabeth Vasquez, Rosenda Murillo, Tailisha Gonzalez, and Fatima Rodriguez. 2021. "Educational Attainment and Prevalence of Cardiovascular Health (Life’s Simple 7) in Asian Americans" International Journal of Environmental Research and Public Health 18, no. 4: 1480. https://doi.org/10.3390/ijerph18041480
APA StyleAlam, M. T., Echeverria, S. E., DuPont-Reyes, M. J., Vasquez, E., Murillo, R., Gonzalez, T., & Rodriguez, F. (2021). Educational Attainment and Prevalence of Cardiovascular Health (Life’s Simple 7) in Asian Americans. International Journal of Environmental Research and Public Health, 18(4), 1480. https://doi.org/10.3390/ijerph18041480