
A Systematic Review of Economic Evaluations of Health-Promoting Food Retail-Based Interventions


Abstract
1. Introduction
2. Methods
2.1. Search Strategy
2.2. Article Selection
2.3. Data Extraction and Synthesis
2.4. Quality Assessments
3. Results
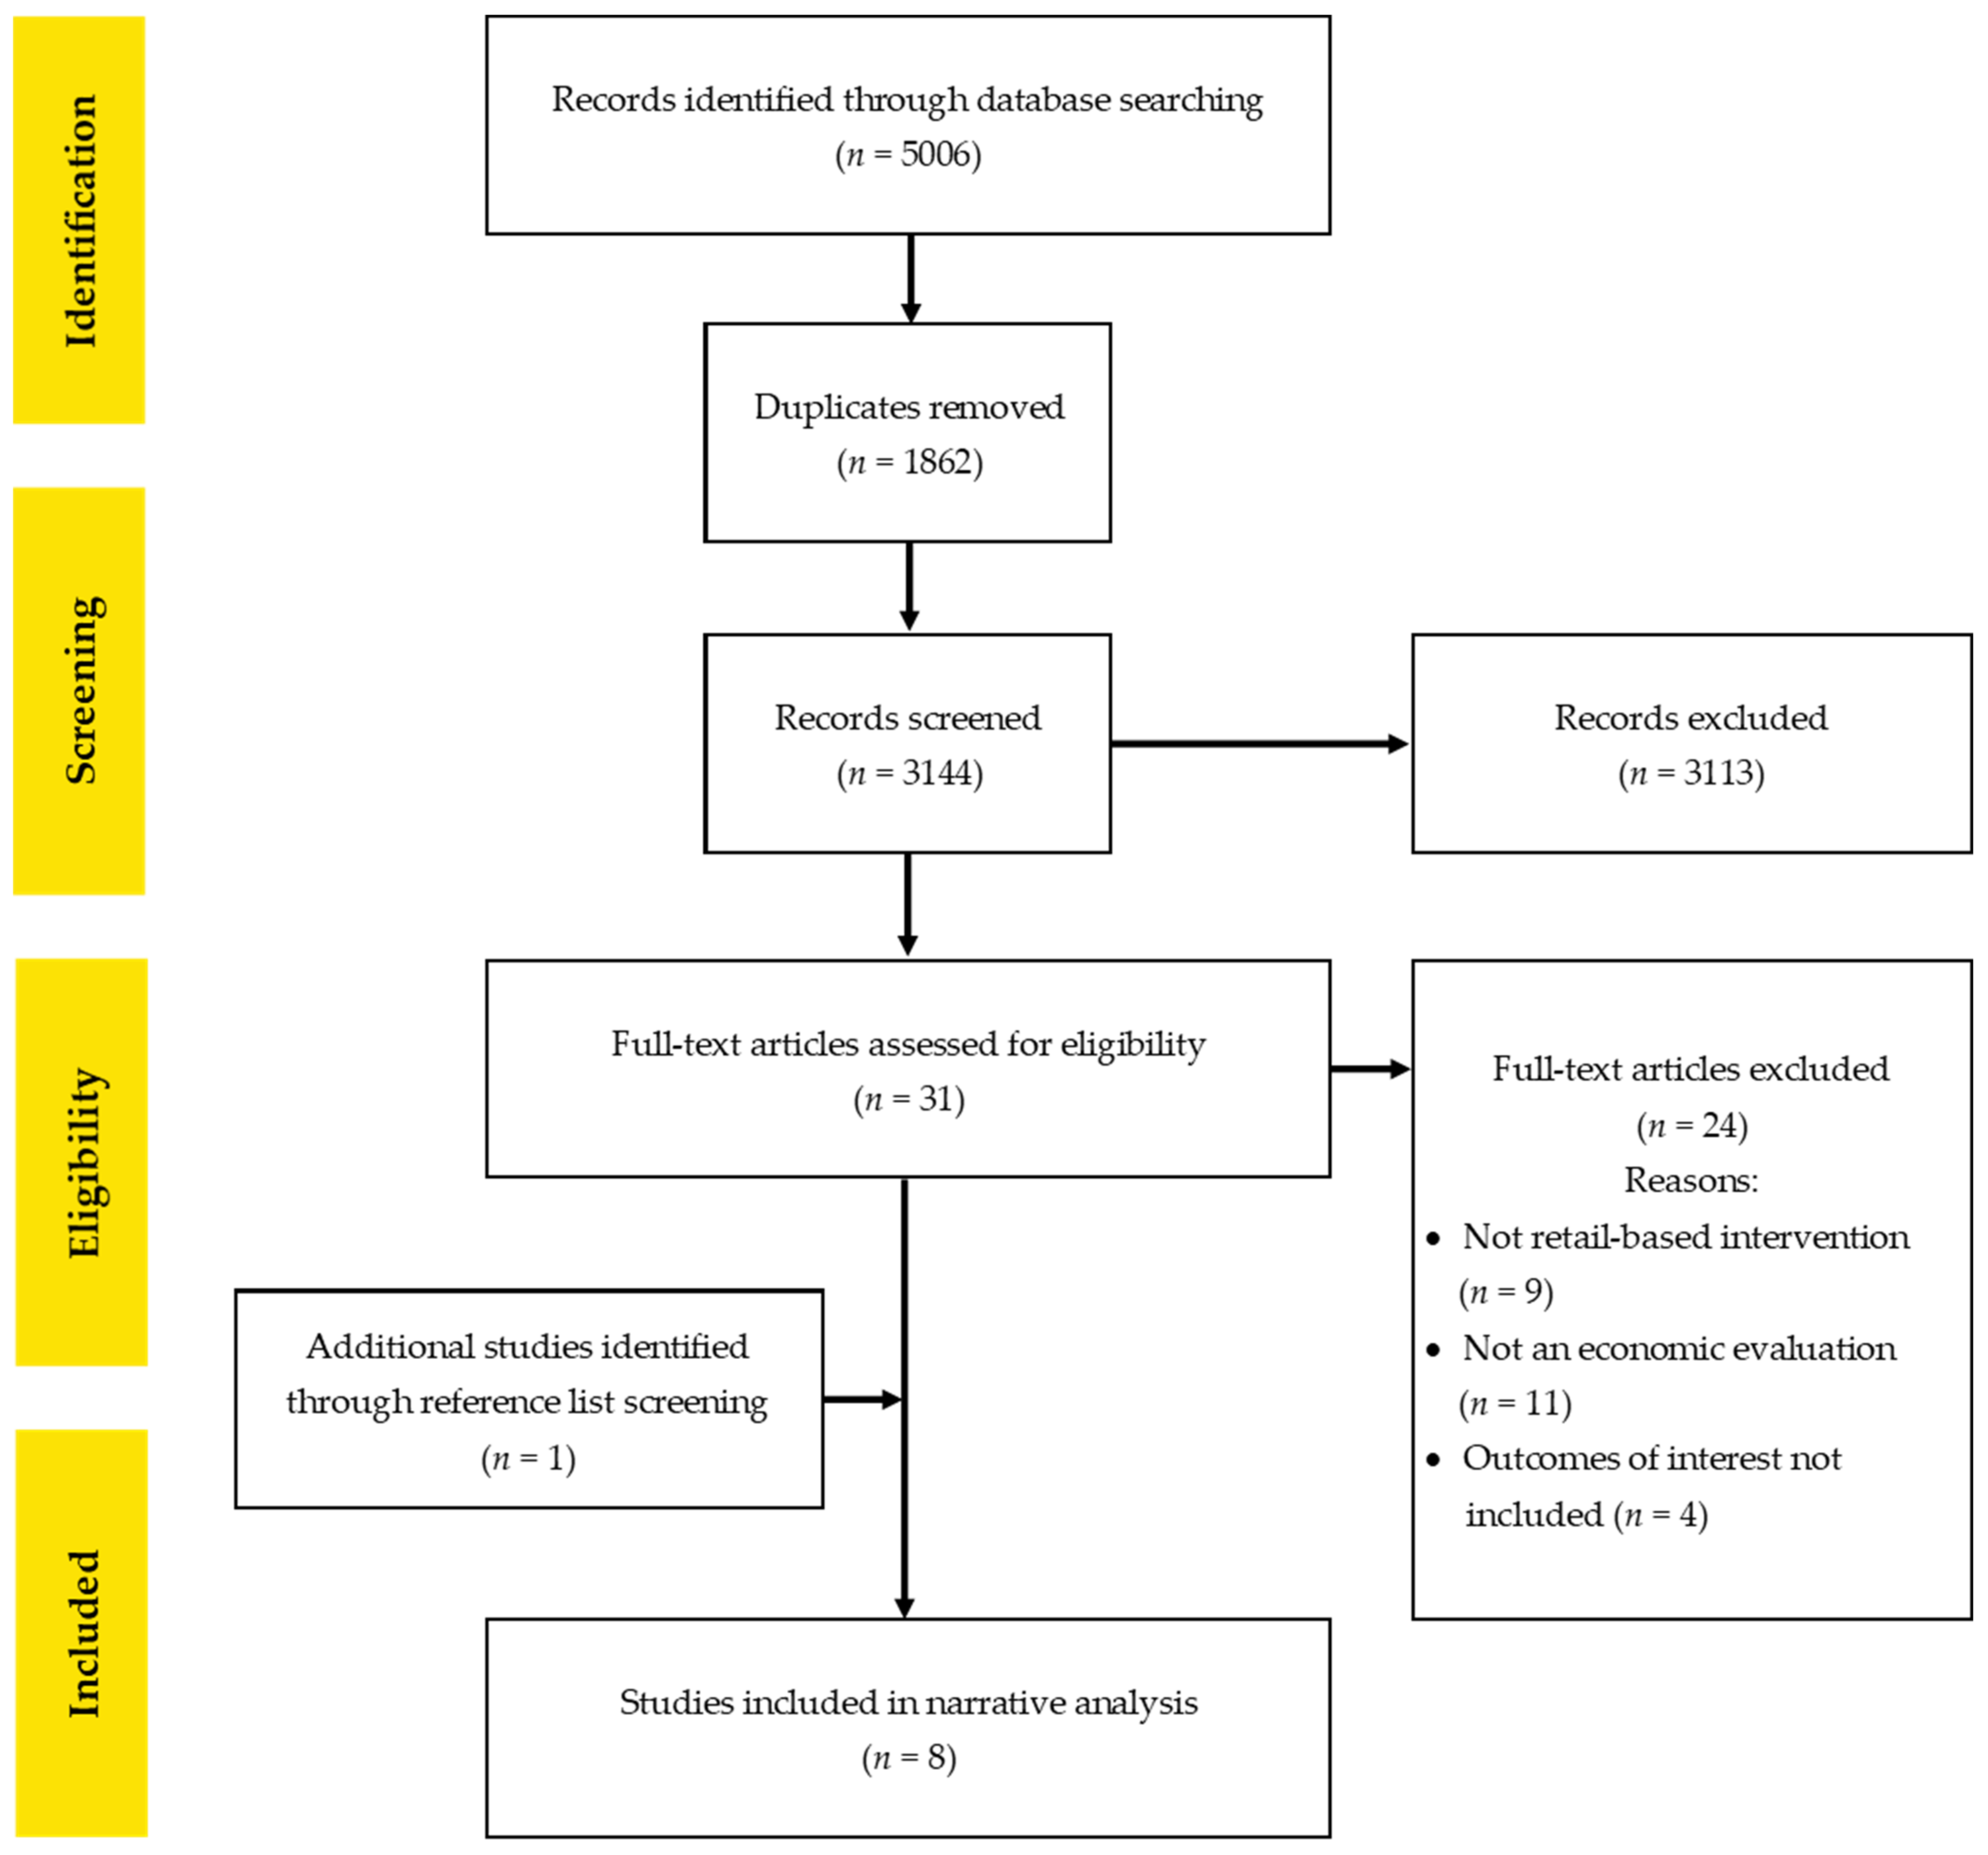
3.1. Search Results
3.2. Quality of Included Studies
3.3. Intervention Characteristics
3.4. Economic Evaluation Study Characteristics by Retail Setting
3.4.1. Supermarkets
3.4.2. Remote Community Store Settings
3.4.3. Restaurants and Fast Food Settings
3.4.4. Cafeteria Settings and Vending Machines
School Cafeterias
Worksite Cafeterias and Vending Machines
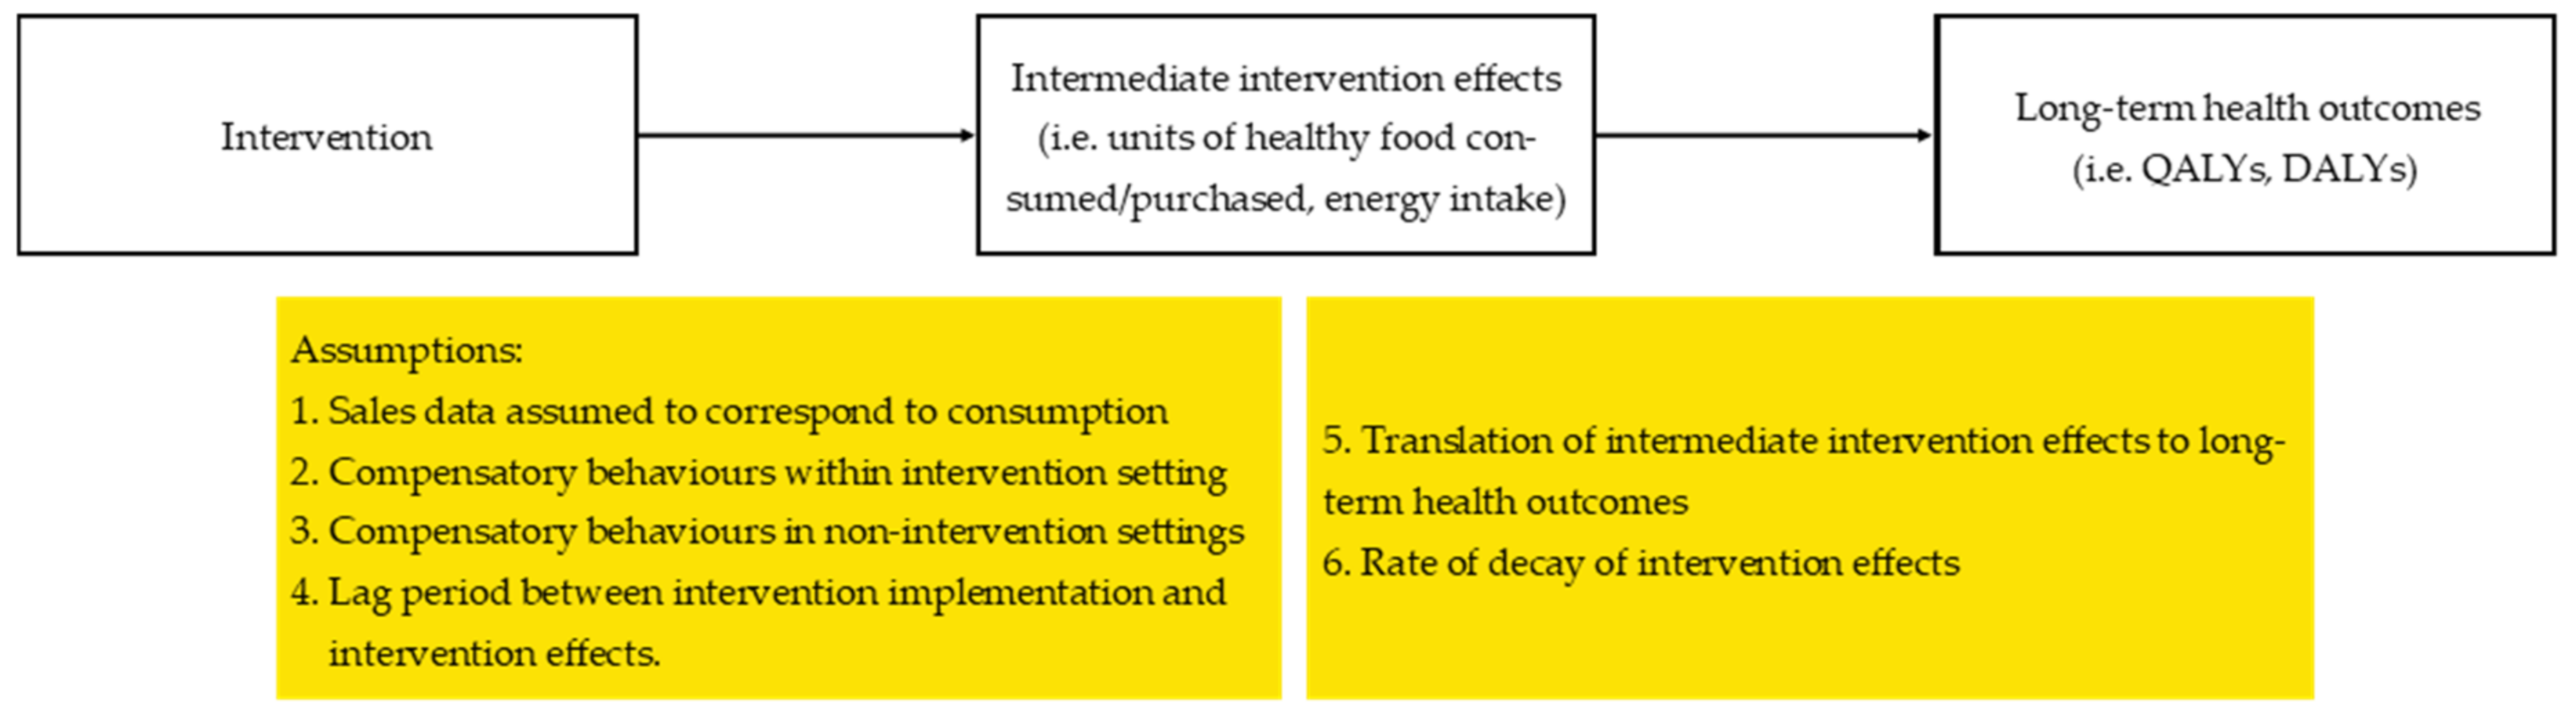
3.5. Key Assumptions Used in the Economic Evaluations
3.5.1. Sales Data Assumed to Correspond to Consumption
3.5.2. Compensatory Behaviours Within Intervention Settings and in Non-Intervention Settings
3.5.3. Lag Period Between Intervention Implementation and Intervention Effects
3.5.4. Translation of Intermediate Intervention Effects to Long-Term Health Outcomes
3.5.5. Rate of Decay of Intervention Effects
4. Discussion
5. Conclusions
Supplementary Materials
Author Contributions
Funding
Institutional Review Board Statement
Informed Consent Statement
Data Availability Statement
Conflicts of Interest
References
- Afshin, A.; Sur, P.J.; Fay, K.A.; Cornaby, L.; Ferrara, G.; Salama, J.S.; Mullany, E.C.; Abate, K.H.; Abbafati, C.; Abebe, Z.; et al. Health effects of dietary risks in 195 countries, 1990–2017: A systematic analysis for the Global Burden of Disease Study 2017. Lancet 2019, 393, 1958–1972. [Google Scholar] [CrossRef]
- World Health Organization. Noncommunicable Diseases Geneva, Switzerland: World Health Organization, Regional Office for the Eastern Mediterranean. Available online: http://www.emro.who.int/noncommunicable-diseases/causes/unhealthy-diets.html (accessed on 18 September 2020).
- World Health Organization. Global Health Observatory (GHO) Data Geneva, Switzerland: World Health Organization. Available online: https://www.who.int/gho/ncd/risk_factors/unhealthy_diet_text/en/ (accessed on 18 September 2020).
- Norat, T.; Chan, D.; Lau, R.; Aune, D.; Vieira, R.; Corpet, D. The associations between food, nutrition and physical activity and the risk of colorectal cancer. In WCRF/AICR Systematic Literature Review Continuous Update Project Report; World Cancer Research Fund; American Institute for Cancer Research: London, UK, 2010. [Google Scholar]
- World Health Organization. Diet, Nutrition, and the Prevention of Chronic Diseases: Report of a Joint WHO/FAO Expert Consultation; World Health Organization: Geneva, Switzerland, 2003. [Google Scholar]
- Swinburn, B.A.; Sacks, G.; Hall, K.D.; McPherson, K.; Finegood, D.T.; Moodie, M.L.; Gortmaker, S.L. The global obesity pandemic: Shaped by global drivers and local environments. Lancet 2011, 378, 804–814. [Google Scholar] [CrossRef]
- Needham, C.; Orellana, L.; Allender, S.; Sacks, G.; Blake, M.R.; Strugnell, C. Food retail environments in Greater Melbourne 2008–2016: Longitudinal analysis of intra-city variation in density and healthiness of food outlets. Int. J. Environ. Res. Public Health 2020, 17, 1321. [Google Scholar] [CrossRef] [PubMed]
- Moayyed, H.; Kelly, B.; Feng, X.; Flood, V. Is living near healthier food stores associated with better food intake in regional Australia? Int. J. Environ. Res. Public Health 2017, 14, 884. [Google Scholar] [CrossRef] [PubMed]
- Miller, L.J.; Joyce, S.; Carter, S.; Yun, G. Associations between childhood obesity and the availability of food outlets in the local environment: A retrospective cross-sectional study. Am. J. Health Promot. 2014, 28, e137–e145. [Google Scholar] [CrossRef]
- Paquet, C.; Coffee, N.T.; Haren, M.T.; Howard, N.J.; Adams, R.J.; Taylor, A.W.; Daniel, M. Food environment, walkability, and public open spaces are associated with incident development of cardio-metabolic risk factors in a biomedical cohort. Health Place 2014, 28, 173–176. [Google Scholar] [CrossRef]
- Adam, A.; Jensen, J.D. What is the effectiveness of obesity related interventions at retail grocery stores and supermarkets?—A systematic review. BMC Public Health 2016, 16, 1247. [Google Scholar] [CrossRef]
- The World Bank. High Income. Available online: https://data.worldbank.org/country/XD (accessed on 4 December 2020).
- Cameron, A.J.; Charlton, E.; Ngan, W.W.; Sacks, G. A systematic review of the effectiveness of supermarket-based interventions involving product, promotion, or place on the healthiness of consumer purchases. Curr. Nutr. Rep. 2016, 5, 129–138. [Google Scholar] [CrossRef]
- Hartmann-Boyce, J.; Bianchi, F.; Piernas, C.; Riches, S.P.; Frie, K.; Nourse, R.; Jebb, S.A. Grocery store interventions to change food purchasing behaviors: A systematic review of randomized controlled trials. Am. J. Clin. Nutr. 2018, 107, 1004–1016. [Google Scholar] [CrossRef]
- Mah, C.L.; Luongo, G.; Hasdell, R.; Taylor, N.G.A.; Lo, B.K. A Systematic Review of the Effect of Retail Food Environment Interventions on Diet and Health with a Focus on the Enabling Role of Public Policies. Curr. Nutr. Rep. 2019, 8, 411–428. [Google Scholar] [CrossRef]
- Karpyn, A.; McCallops, K.; Wolgast, H.; Glanz, K. Improving consumption and purchases of healthier foods in retail environments: A systematic review. Int. J. Environ. Res. Public Health 2020, 17, 7524. [Google Scholar] [CrossRef] [PubMed]
- Ananthapavan, J.; Sacks, G.; Moodie, M.; Carter, R. Economics of obesity—Learning from the past to contribute to a better future. Int. J. Environ. Res. Public Health 2014, 11, 4007–4025. [Google Scholar] [CrossRef] [PubMed]
- Moher, D.; Liberati, A.; Tetzlaff, J.; Altman, D.G. Preferred reporting items for systematic reviews and meta-analyses: The PRISMA statement. Int. J. Surg. 2010, 8, 336–341. [Google Scholar] [CrossRef] [PubMed]
- Hupe, M. EndNote X9. J. Electron. Resour. Med. Libr. 2019, 16, 117–119. [Google Scholar] [CrossRef]
- Veritas Health Innovation. Covidence systematic review software Melbourne, Australia: Veritas Health Innovation. 2020. Available online: www.covidence.org (accessed on 15 December 2020).
- Husereau, D.; Drummond, M.; Petrou, S.; Carswell, C.; Moher, D.; Greenberg, D.; Augustovski, F.; Briggs, A.H.; Mauskopf, J.; Loder, E. Consolidated health economic evaluation reporting standards (CHEERS) statement. Int. J. Technol. Assess. Health Care 2013, 29, 117–122. [Google Scholar] [CrossRef] [PubMed]
- OECD. Purchasing power parities (PPP): OECD. 2017. Available online: https://www.oecdilibrary.org/content/data/1290ee5a-en (accessed on 15 December 2020).
- Australian Institute of Health Welfare. Health Expenditure Australia 2017–18; AIHW: Canberra, Australia, 2019. [Google Scholar]
- Australian Institute of Health Welfare. Health Expenditure Australia 2007–08; AIHW: Canberra, Australia, 2009. [Google Scholar]
- Ball, K.; McNaughton, S.A.; Le, H.N.D.; Abbott, G.; Stephens, L.D.; Crawford, D.A. ShopSmart 4 Health: Results of a randomized controlled trial of a behavioral intervention promoting fruit and vegetable consumption among socioeconomically disadvantaged women. Am. J. Clin. Nutr. 2016, 104, 436–445. [Google Scholar] [CrossRef] [PubMed]
- Le, H.N.D.; Gold, L.; Abbott, G.; Crawford, D.; McNaughton, S.A.; Mhurchu, C.N.; Pollard, C.; Ball, K. Economic evaluation of price discounts and skill-building strategies on purchase and consumption of healthy food and beverages: The SHELf randomized controlled trial. Social Sci. Med. 2016, 159, 83–91. [Google Scholar] [CrossRef]
- Magnus, A.; Cobiac, L.; Brimblecombe, J.; Chatfield, M.; Gunther, A.; Ferguson, M.; Moodie, M. The cost-effectiveness of a 20% price discount on fruit, vegetables, diet drinks and water, trialled in remote Australia to improve Indigenous health. PLoS ONE 2018, 13, e0204005. [Google Scholar] [CrossRef]
- Magnus, A.; Moodie, M.L.; Ferguson, M.; Cobiac, L.J.; Liberato, S.C.; Brimblecombe, J. The economic feasibility of price discounts to improve diet in Australian Aboriginal remote communities. Aust. N. Z. J. Public Health 2016, 40, S36–S41. [Google Scholar] [CrossRef]
- Ladapo, J.A.; Bogart, L.M.; Klein, D.J.; Cowgill, B.O.; Uyeda, K.; Binkle, D.G.; Stevens, E.R.; Schuster, M.A. Cost and Cost-Effectiveness of Students for Nutrition and eXercise (SNaX). Acad. Pediatr. 2016, 16, 247–253. [Google Scholar] [CrossRef]
- Allen, K.; Pearson-Stuttard, J.; Hooton, W.; Diggle, P.; Capewell, S.; O’Flaherty, M. Potential of trans fats policies to reduce socioeconomic inequalities in mortality from coronary heart disease in England: Cost effectiveness modelling study. BMJ Br. Med. J. 2015, 351, h4583. [Google Scholar] [CrossRef] [PubMed]
- Gortmaker, S.L.; Wang, Y.C.; Long, M.W.; Giles, C.M.; Ward, Z.J.; Barrett, J.L.; Kenney, E.L.; Sonneville, K.R.; Sadaf Afzal, A.; Resch, S.C.; et al. Three Interventions That Reduce Childhood Obesity Are Projected To Save More Than They Cost To Implement. Health Aff. 2015, 34, 1932–1939. [Google Scholar] [CrossRef] [PubMed]
- Cobiac, L.J.; Vos, T.; Veerman, J.L. Cost-effectiveness of interventions to promote fruit and vegetable consumption. PLoS ONE 2010, 5, e14148. [Google Scholar] [CrossRef] [PubMed]
- Brimblecombe, J.; Ferguson, M.; Chatfield, M.D.; Liberato, S.C.; Gunther, A.; Ball, K.; Moodie, M.; Miles, E.; Magnus, A.; Mhurchu, C.N.; et al. Effect of a price discount and consumer education strategy on food and beverage purchases in remote Indigenous Australia: A stepped-wedge randomised controlled trial. Lancet Public Health 2017, 2, e82–e95. [Google Scholar] [CrossRef]
- Byker, C.J.; Farris, A.R.; Marcenelle, M.; Davis, G.C.; Serrano, E.L. Food waste in a school nutrition program after implementation of new lunch program guidelines. J. Nutr. Educ. Behav. 2014, 46, 406–411. [Google Scholar] [CrossRef]
- Gase, L.N.; McCarthy, W.J.; Robles, B.; Kuo, T. Student receptivity to new school meal offerings: Assessing fruit and vegetable waste among middle school students in the Los Angeles Unified School District. Prev. Med. 2014, 67, S28–S33. [Google Scholar] [CrossRef]
- Blake, M.R.; Backholer, K.; Lancsar, E.; Boelsen-Robinson, T.; Mah, C.; Brimblecombe, J.; Zorbas, C.; Billich, N.; Peeters, A. Investigating business outcomes of healthy food retail strategies: A systematic scoping review. Obes. Rev. 2019, 20, 1384–1399. [Google Scholar] [CrossRef]
- McClung, H.L.; Ptomey, L.T.; Shook, R.P.; Aggarwal, A.; Gorczyca, A.M.; Sazonov, E.S.; Becofsky, K.; Weiss, R.; Das, S.K. Dietary intake and physical activity assessment: Current tools, techniques, and technologies for use in adult populations. Am. J. Prev. Med. 2018, 55, e93–e104. [Google Scholar] [CrossRef]
- Taillie, L.S.; Grummon, A.H.; Fleischhacker, S.; Grigsby-Toussaint, D.S.; Leone, L.; Caspi, C.E. Best practices for using natural experiments to evaluate retail food and beverage policies and interventions. Nutr. Rev. 2017, 75, 971–989. [Google Scholar] [CrossRef]
- Odoms-Young, A.; Singleton, C.R.; Springfield, S.; McNabb, L.; Thompson, T. Retail environments as a venue for obesity prevention. Curr. Obes. Rep. 2016, 5, 184–191. [Google Scholar] [CrossRef]
- Rose, D.; Hutchinson, P.L.; Bodor, J.N.; Swalm, C.M.; Farley, T.A.; Cohen, D.A.; Rice, J.C. Neighborhood food environments and body mass index: The importance of in-store contents. Am. J. Prev. Med. 2009, 37, 214–219. [Google Scholar] [CrossRef] [PubMed]
- Ghosh-Dastidar, B.; Cohen, D.; Hunter, G.; Zenk, S.N.; Huang, C.; Beckman, R.; Dubowitz, T. Distance to store, food prices, and obesity in urban food deserts. Am. J. Prev. Med. 2014, 47, 587–595. [Google Scholar] [CrossRef] [PubMed]
- Tin, S.T.; Mhurchu, C.N.; Bullen, C. Supermarket sales data: Feasibility and applicability in population food and nutrition monitoring. Nutr. Rev. 2007, 65, 20–30. [Google Scholar] [CrossRef] [PubMed]
- Bandy, L.; Adhikari, V.; Jebb, S.; Rayner, M. The use of commercial food purchase data for public health nutrition research: A systematic review. PLoS ONE 2019, 14, e0210192. [Google Scholar] [CrossRef] [PubMed]
- Timmins, K.A.; Green, M.A.; Radley, D.; Morris, M.A.; Pearce, J. How has big data contributed to obesity research? A review of the literature. Int. J. Obes. 2018, 42, 1951–1962. [Google Scholar] [CrossRef]
- Evans, D. Beyond the throwaway society: Ordinary domestic practice and a sociological approach to household food waste. Sociology 2012, 46, 41–56. [Google Scholar] [CrossRef]
- Schanes, K.; Dobernig, K.; Gözet, B. Food waste matters—A systematic review of household food waste practices and their policy implications. J. Clean. Prod. 2018, 182, 978–991. [Google Scholar] [CrossRef]
- Graham-Rowe, E.; Jessop, D.C.; Sparks, P. Identifying motivations and barriers to minimising household food waste. Resour. Conserv. Recycl. 2014, 84, 15–23. [Google Scholar] [CrossRef]
- Garrone, P.; Melacini, M.; Perego, A. Opening the black box of food waste reduction. Food Policy 2014, 46, 129–139. [Google Scholar] [CrossRef]
- Quested, T.E.; Parry, A.; Easteal, S.; Swannell, R. Food and drink waste from households in the UK. Nutr. Bull. 2011, 36, 460–467. [Google Scholar] [CrossRef]
- Williams, M.B.; Wang, W.; Taniguchi, T.; Salvatore, A.L.; Groover, W.K.; Wetherill, M.; Love, C.; Cannady, T.; Grammar, M.; Standridge, J. Impact of a Healthy Retail Intervention on Fruits and Vegetables and Total Sales in Tribally Owned Convenience Stores: Findings From the THRIVE Study. Health Promot. Pract. 2020. [Google Scholar] [CrossRef] [PubMed]
- Gemming, L.; Jiang, Y.; Swinburn, B.; Utter, J.; Mhurchu, C.N. Under-reporting remains a key limitation of self-reported dietary intake: An analysis of the 2008/09 New Zealand Adult Nutrition Survey. Eur. J. Clin. Nutr. 2014, 68, 259–264. [Google Scholar] [CrossRef] [PubMed]
- McMahon, E.; Wycherley, T.; O’Dea, K.; Brimblecombe, J. A comparison of dietary estimates from the National Aboriginal and Torres Strait Islander Health Survey to food and beverage purchase data. Aust. N. Z. J. Public Health 2017, 41, 598–603. [Google Scholar] [CrossRef] [PubMed]
- Drummond, M.F.; Jefferson, T. Guidelines for authors and peer reviewers of economic submissions to the BMJ. BMJ 1996, 313, 275–283. [Google Scholar] [CrossRef] [PubMed]
- Evers, S.; elle Goossens, M.; De Vet, H.; Van Tulder, M.; Banta, D.; Buxton, M.; Coyle, D.; Donaldson, C.; Drummond, M.; Elixhauser, A. Criteria list for assessment of methodological quality of economic evaluations: Consensus on Health Economic Criteria The authors thank the following persons for their participation in the Delphi panel. Int. J. Technol. Assess. Health Care 2016, 21, 240–245. [Google Scholar] [CrossRef]
- Philips, Z.; Bojke, L.; Sculpher, M.; Claxton, K.; Golder, S. Good practice guidelines for decision-analytic modelling in health technology assessment. Pharmacoeconomics 2006, 24, 355–371. [Google Scholar] [CrossRef] [PubMed]
- Watts, R.D.; Li, I.W. Use of Checklists in Reviews of Health Economic Evaluations, 2010 to 2018. Value Health 2019, 22, 377–382. [Google Scholar] [CrossRef] [PubMed]


| Author | Country, Target Population | Evaluation Type, Study Design, Perspective, Time Horizon | Reference Year, Discount Rate, Currency | Intervention and Comparator |
|---|---|---|---|---|
| Supermarkets | ||||
| Ball et al. 2016 [25] | Australia, socio-economically disadvantaged female shoppers | CEA, within-trial evaluation, societal perspective, 6 month intervention, 12 month follow up (6 months post intervention) | 2012, NA, A$ | I: Behaviour change intervention (education and skill-building materials) C: Status quo |
| Le et al. 2016 [26] | Australia, female shoppers | CEA, within-trial evaluation, societal perspective, 3 months | 2012, NA, A$ | I1: Skill-building (non-retail setting) I2: 20% price reduction on F&V, water and diet or low-calorie beverages at checkouts; and in-store promotion I3: I1 and I2 C: Status quo |
| Cobiac et al. [32] | Australia, supermarket shoppers | CUA, modelled, health sector perspective, lifetime | 2003, 3%, A$ | I1: A$0.77 coupon to redeem on F&V, and in-store promotion C: Status quo |
| Remote Community Stores | ||||
| Magnus et al. 2016 [28] | Australia, 2011 Australian Indigenous population | CUA, modelled, societal perspective, life-time | 2011, 3%, A$ | 20% price reductions for: I1: All fruit I2: Fresh vegetables only I3: All vegetables I4: All F&V I5: Diet drinks and water I6: All F&V, diet drinks and water In-store nutrition education and 20% price reductions for: I7: All fruit I8: Fresh vegetables only I9: All vegetables I10: All F&V I11: Diet drinks and water I12: All F&V, diet drinks and water C: Status quo |
| Magnus et al. 2018 [27] | Australia, population living in remote Indigenous communities in Northern Australia | CUA, modelled from trial data, partial societal perspective (including health and retail sector impacts), life-time | 2011, 3%, A$ | I1: 20% price reduction for F&V, diet drink and water for 24 weeks I2: I1 in combination with in-store nutrition education for 24 weeks C: Status quo |
| Restaurants and Fast Food Stores | ||||
| Gortmaker et al. 2015 [31] | USA, general population | CEA, modelled, societal perspective, 10 years | 2014, 3%, USD | I1: Menu calorie labelling in restaurants C: Status quo |
| Allen et al. 2015 [30] | England, adults >25 years | CEA, modelled, societal perspective, 5 years | 2015, 3.5%, GBP | I1: Ban on trans fatty acids in restaurants I2: Ban on trans fatty acids in fast food outlets C: Status quo |
| CUA, modelled, societal perspective, 5 years | ||||
| School Cafeterias | ||||
| Gortmaker et al. 2015 [31] | USA, school children from kindergarten to grade 12 | CEA, modelled, societal perspective, 10 years | 2014, 3%, USD | I2: Nutrition standards for school meals I3: Nutrition standards for all foods and beverages sold in schools C: Status quo |
| Ladapo et al. 2016 [29] | USA, low-income grade 6–8 students | CEA, within-trial evaluation, school perspective, 5 weeks | 2014, NA, USD | I1: School-wide environmental changes to promote water and healthy foods consumption; and physical activity (retail intervention included preparation of healthier food taste tests in cafeterias, other interventions included a peer leader club and school-wide multimedia marketing) C: Status quo |
| Worksite Cafeterias and Vending Machines | ||||
| Cobiac et al. 2010 [32] | Australia, worksite employees, cafeterias | CUA, modelled, health sector perspective, lifetime | 2003, 3%, A$ | I2-5: Each modelled intervention was based on a single published study. Each intervention included some or all of the following components: menu labelling, in-store nutrition education, changes to catering food policies and food labelling in cafeterias and vending machines I6: Food demonstration in cafeterias, food labelling, special events (e.g., vegetable soup day), and provision of skill building materials (e.g., pamphlets and brochures) I7: Display of information sheets near food products (e.g., caloric value of food translated to number of minutes to perform occupational activity) in cafeterias and vending machines C: Status quo |
| Author | Intervention Cost(s) | Intermediate Intervention Effects(s) | Outcome(s) of Interest | Incremental Cost-Effectiveness Ratio (A$2020) |
|---|---|---|---|---|
| Supermarkets | ||||
| Ball et al. 2016 [25] | Intervention materials Staff time including overheads Participant time Purchase of intervention food products Participant travel expenses | NA |
| No effect on fruit intake $3.39 (95%CI: NR) per increased serve of vegetables consumed per participant per day |
| Le et al. 2016 [26] | I2 and I3: Staff time including overhead Participant time Purchase of intervention food products Participant travel expenses Intervention materials | NA |
| I1: No difference in all primary outcomes compared to comparator I2: $2.52 (95%CI: NR) per increased serve of vegetables purchased per week $3.29 (95%CI: NR) per increased serve of fruit purchased per week No difference in beverage purchases and intake. No difference in vegetable intake. I3: $12.70 (95%CI: NR) per increased serve of fruit purchased per week. No difference in vegetable and beverage purchases No difference in fruit, vegetable, and beverage intake |
| Cobiac et al. 2010 [32] | I1: Intervention materials Monetary incentives | Modelled F&V intake | Modelled DALYs averted | I1: $3,863,748 (95%CI: NR) per DALY averted The intervention resulted in 0.030 (95%CI: −0.34; 0.40) increase in serves of F&V per day (not statistically significant) |
| Remote community stores | ||||
| Magnus et al. 2016 [28] | I1–6: Price discount Staff time Intervention materials I7–12: Price discount Staff time Intervention materials Participant time Participant travel expenses | Modelled sodium intake, total energy intake and BMI | Modelled DALYs averted | I1: $30,110 (95%CI: $18,958; $44,607) per DALY averted I2: $37,916 (95%CI: $22,304; $56,874) per DALY averted I3: $76,947 (95%CI: $55,759; $101,481) per DALY averted I4: $49,067 (95%CI: $36,801; $64,680) per DALY averted I5: $23,418 (95%CI: dominated *; $535,285) per DALY averted I6: $40,146 (95%CI: dominated *; $356,857 per DALY averted I7: $53,529 (95%CI: $40,146; $70,256) per DALY averted I8: $68,026 (95%CI: $50,183; $88,099) per DALY averted I9: $105,942 (95%CI: $82,523; $133,821) per DALY averted I10: $56,874 (95%CI: $44,607; $72,487) per DALY averted I11: $37,916 (95%CI: dominated *; $791,776) per DALY averted I12: $42,377 (95%CI: dominated *; $390,312) per DALY averted |
| Magnus et al. 2018 [27] | I1: Price discount Staff time Staff travel expenses Intervention materials I2: Price discount Staff time Staff travel expenses Intervention materials Participant time |
| Modelled DALYs averted | I1 and 2: Increased purchase of F&V and other non-discounted foods resulting in modelled increase in BMI of 2.38 (95%CI: 0.81; 4.62) (I1) or 2.37 (95%CI: 0.78; 4.75) (I2). During the discount period, the negative impact on DALYs averted was from −21 (95%CI: −28; −15) to −36 (95%CI: −47; −25). At follow−up, the negative impact on DALY averted was from −48 (95%CI: −60; −36) to −45 (95%CI: −58; −34). Incremental intervention costs: I1: $239,672 (95%CI: NR) I2: $433,368 (95%CI: NR) Interventions were not cost-effective |
| Restaurants and fast food stores | ||||
| Gortmaker et al. 2015 [31] | I1: Staff time Nutrition database accessing fee Compliance monitoring | Modelled calorie intake | Modelled BMI | I1: $20.55 (95%CI: −$192.52; $242.47) per BMI unit reduced |
| Allen et al. 2015 [30] | Legislation Compliance monitoring Product reformulation Industry loss profitability | Modelled trans fatty acid intake | Modelled deaths from coronary heart disease prevented or postponed | I1: 1800 (95%CI: 700; 3400) deaths from coronary heart disease averted or 0.7% reduction. Total annual costs: $185.44M (95%CI: NR) Net costs saving (excluding reformulation cost): $109.87M (95%CI: $215.57M; $6.03M) Net costs saving (including reformulation cost): $0.00M (95%CI: $105.47M; −$103.85M) I2: 2600 (95%CI: 1200; 4600) deaths from coronary heart disease averted or 1.0% reduction Total annual costs: $220.67M (95%CI: NR) Net costs saving (excluding reformulation cost): $174.08M (95%CI: $316.41M; $34.31M) Net costs saving (including reformulation cost): $28.98M (95%CI: $171.30M; −$110.80M) |
| Modelled QALYs gained | I1: Dominant # QALY gained: 2100 (95%CI: 700; 3900) Healthcare cost savings: $26.19M (95%CI: $11.59M; $41.26M) Averted productivity loss: $36.62M (95%CI: $15.99M; $57.49M) Informal care savings: $122.62M (95%CI: $54.01M; $192.39M) I2: Dominant # QALY gained: 3000 (95%CI: 1100; 5200) Healthcare cost savings: $35.23M (95%CI: $15.53M; $55.17M) Averted productivity loss: $50.53M (95%CI: $22.25M; $79.28M) Informal care savings: $164.11M (95%CI: $72.09M; $257.53M) | |||
| School cafeterias | ||||
| Gortmaker et al. 2015 [31] | I2: State and local government: Reimbursements for meals Kitchen equipment for schools Compliance monitoring School costs: Meal Staff time I3: School costs: Staff time to keep records of compliance Training | Modelled calorie intake | Modelled BMI | I2: $83.22 (95%CI: −$209.49; $292.06) per BMI unit reduced I3: $9.58 (95%CI: $3.67; $12.22) per BMI unit reduced |
| Ladapo et al. 2016 [29] | Peer leader activities School-wide multimedia marketing School food environment changes |
|
| (1) No intervention effect on portions of vegetables served $1.88 (95%CI: NR) per additional portion of fruit served during meals (2) $2.65 (95%CI: NR) per reduced unit of snacks sold |
| Worksite cafeterias and vending machines | ||||
| Cobiac et al. 2010 [32] | I2: Workshop Nutrition displays Cafeteria promotion Advisory board Time I3–5: Workshop Nutrition displays Cafeteria promotion Advisory board Time Non-tailored documents I6: Workshop Nutrition displays Cafeteria promotion Advisory board Time Family involvement I7: Nutrition displays Cafeteria promotion Non-tailored documents | Modelled F&V intake | DALYs averted | I2: $11,436,695 (95%CI: NR) per DALY averted I3: $1,220,945 (95%CI: NR) per DALY averted I4: $494,560 (95%CI: NR) per DALY averted I5: $1,854,599 (95%CI: NR) per DALY averted I6: $664,565 (95%CI: NR) per DALY averted I7: $72,639 (95%CI: NR) per DALY averted (50% probability of being cost-effective) |
| Studies | Trial-Based Evaluations | Model-Based Evaluations | ||||||
|---|---|---|---|---|---|---|---|---|
| CEA | CEA & CUA | CUA | ||||||
| Assumption | Ball et al. [25] | Ladapo et al. [29] | Le et al. [26] | Gormaker et al. [31] | Allen et al. [30] | Cobiac et al. [32] | Magnus et al. 2016 [28] | Magnus et al. 2018 [27] |
| Sales data assumed to correspond to consumption | NA | No | NA | Yes | No | No | No | No |
| Compensatory behaviours within intervention setting | No | No | YE | Yes | No | No | Yes | YE |
| Compensatory behaviours in non-intervention settings | No | No | No | Yes | No | No | YE | YE |
| Lag period between intervention implementation and intervention effects | NA | NA | NA | YE | No | No | No | No |
| Translation of intermediate intervention effects to long-term health outcomes | NA | NA | NA | No | YE | YE | YE | YE |
| Rate of decay of intervention effects | NA | NA | NA | YE | No | YE | Yes | YE |
Publisher’s Note: MDPI stays neutral with regard to jurisdictional claims in published maps and institutional affiliations. |
© 2021 by the authors. Licensee MDPI, Basel, Switzerland. This article is an open access article distributed under the terms and conditions of the Creative Commons Attribution (CC BY) license (http://creativecommons.org/licenses/by/4.0/).
Share and Cite
Tran, H.N.Q.; McMahon, E.; Moodie, M.; Ananthapavan, J. A Systematic Review of Economic Evaluations of Health-Promoting Food Retail-Based Interventions. Int. J. Environ. Res. Public Health 2021, 18, 1356. https://doi.org/10.3390/ijerph18031356
Tran HNQ, McMahon E, Moodie M, Ananthapavan J. A Systematic Review of Economic Evaluations of Health-Promoting Food Retail-Based Interventions. International Journal of Environmental Research and Public Health. 2021; 18(3):1356. https://doi.org/10.3390/ijerph18031356
Chicago/Turabian StyleTran, Huong Ngoc Quynh, Emma McMahon, Marj Moodie, and Jaithri Ananthapavan. 2021. "A Systematic Review of Economic Evaluations of Health-Promoting Food Retail-Based Interventions" International Journal of Environmental Research and Public Health 18, no. 3: 1356. https://doi.org/10.3390/ijerph18031356
APA StyleTran, H. N. Q., McMahon, E., Moodie, M., & Ananthapavan, J. (2021). A Systematic Review of Economic Evaluations of Health-Promoting Food Retail-Based Interventions. International Journal of Environmental Research and Public Health, 18(3), 1356. https://doi.org/10.3390/ijerph18031356