The Neonatal Environment and Health Outcomes (NEHO) Birth Cohort Study: Behavioral and Socioeconomic Characteristics and Drop-Out Rate from a Longitudinal Birth Cohort in Three Industrially Contaminated Sites in Southern Italy


Abstract
1. Introduction
2. Materials and Methods
2.1. Study Population
2.2. The Analyzed Questions
2.3. Statistics
2.4. Ethics
3. Results
3.1. Socioeconomic and Behavioral Variables
3.2. General Health Status and Pregnancy
3.3. Attrition Rate
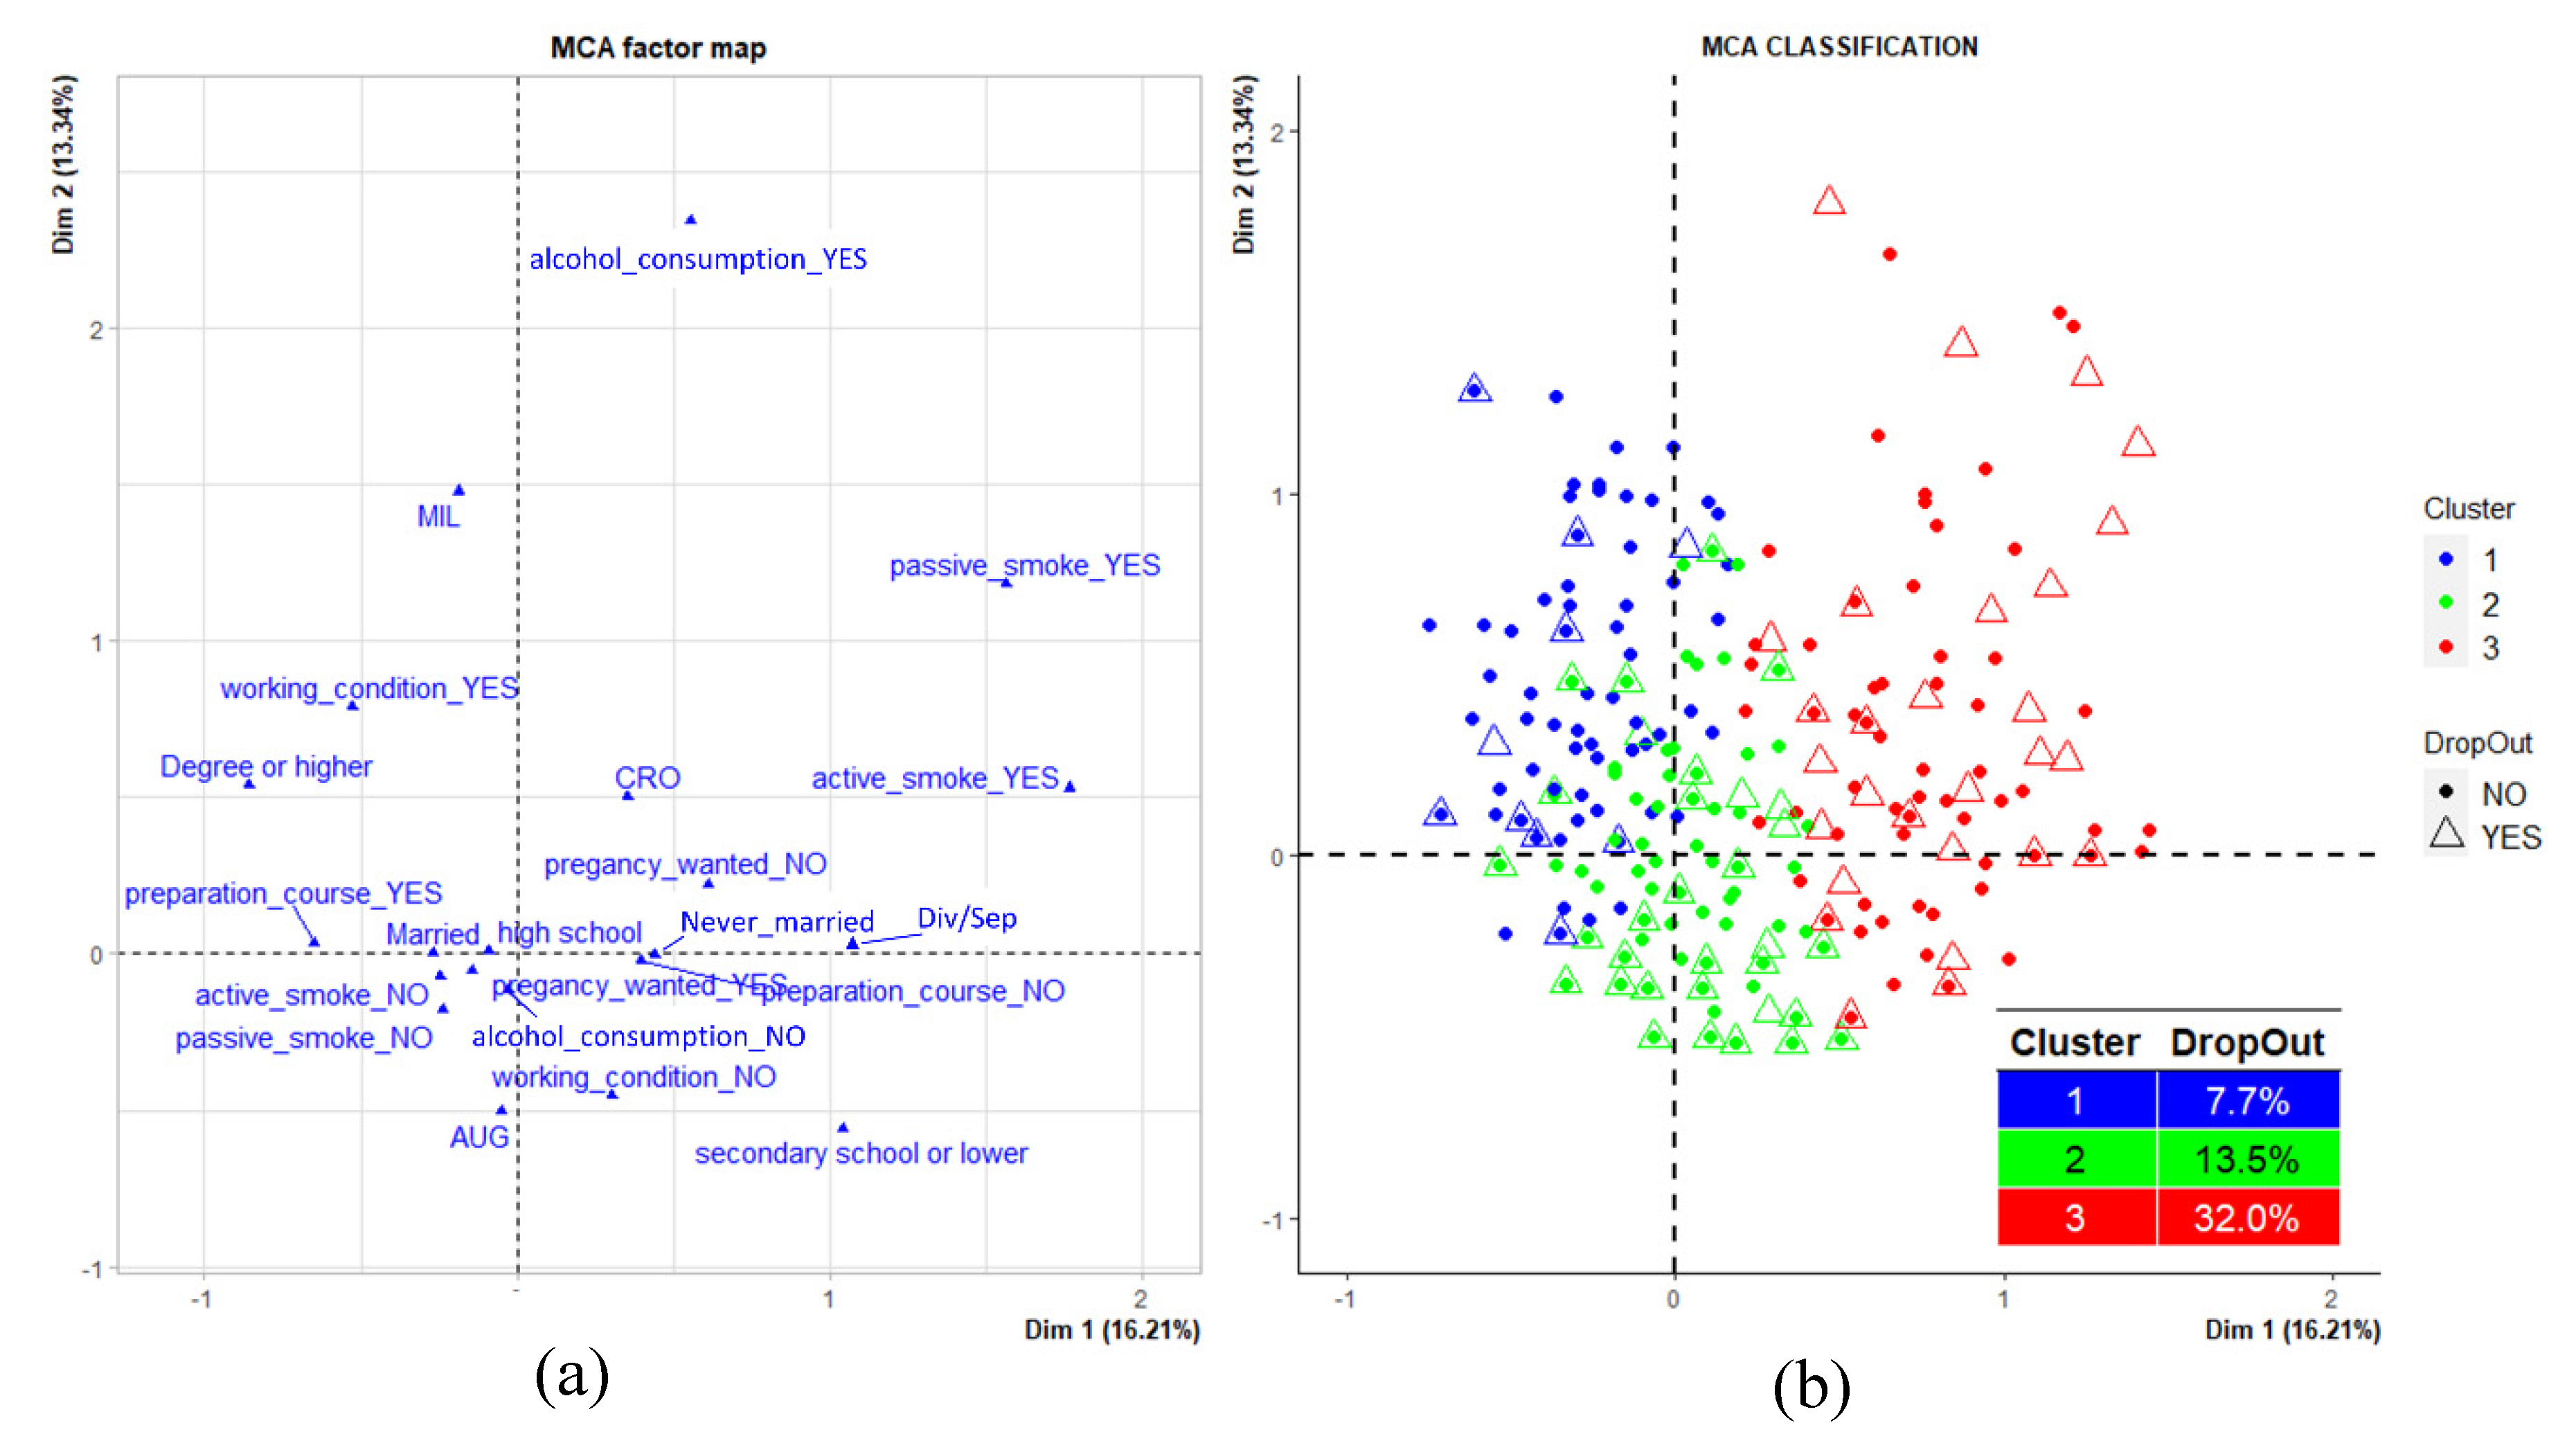
- Cluster 1, composed of 181 mothers (25.6%) and characterized by high percentages of women residing in Milazzo, married, with the highest educational qualification; by high frequencies of working women with alcohol consumption habits and not exposed to both active and passive smoke, as well as by a high percentage of women who attended pre-birth courses (blue dots).
- Cluster 2, composed of 401 mothers (56.7%) and characterized by a high percentage of women living in Augusta-Priolo, non-working with a middle educational level, looking for a pregnancy and not attending pre-birth courses. The cluster is also composed of high percentages of women not exposed to active and passive smoke and not consuming alcohol (green dots).
- Cluster 3, composed of 125 mothers (17.7%) and characterized by a high percentage of women living in Crotone, never married, with the lowest educational qualification; by high frequencies of non-working women who did not seek a pregnancy and who did not attend pre-birth courses. The cluster also presented a high percentage of women exposed to active and passive smoke, with alcohol consumption habits (red dots).
4. Discussion
Strengths and Limitations
5. Conclusions
Supplementary Materials
Author Contributions
Funding
Institutional Review Board Statement
Informed Consent Statement
Data Availability Statement
Acknowledgments
Conflicts of Interest
References
- World Health Organization. Contaminated Sites and Health; Report of two WHO workshops; World Health Organization: Syracuse, Italy, 2011; World Health Organization: Catania, Italy, 2012; WHO Regional Office for Europe: Copenhagen, Denmark, 2013. [Google Scholar]
- Baldacci, S.; Gorini, F.; Santoro, M.; Pierini, A.; Minichilli, F.; Bianchi, F. Environmental and individual exposure and the risk of congenital anomalies: A review of recent epidemiological evidence. Esposizione ambientale e individuale e rischio di anomalie congenite: Una rassegna delle evidenze epidemiologiche recenti. Epidemiol. Prev. 2018, 42, 1–34. [Google Scholar] [CrossRef] [PubMed]
- Barker, D.J. The origins of the developmental origins theory. J. Intern. Med. 2007, 261, 412–417. [Google Scholar] [CrossRef] [PubMed]
- Fleming, T.P.; Watkins, A.J.; Velazquez, M.A.; Mathers, J.C.; Prentice, A.M.; Stephenson, J.; Barker, M.; Saffery, R.; Yajnik, C.S.; Eckert, J.J.; et al. Origins of lifetime health around the time of conception: Causes and consequences. Lancet 2018, 391, 1842–1852. [Google Scholar] [CrossRef]
- European Environment Agency. The European Environment State and Outlook 2020-Knowledge for Transition to A Sustainable Europe; Publications Office of the European Union: Luxembourg, 2019. [Google Scholar]
- De Sario, M.; Pasetto, R.; Vecchi, S.; Zeka, A.; Hoek, G.; Michelozzi, P.; Iavarone, I.; Fletcher, T.; Bauleo, L.; Ancona, C. A scoping review of the epidemiological methods used to investigate the health effects of industrially contaminated sites. Epidemiol. Prev. 2018, 42, 59–68. [Google Scholar] [CrossRef]
- Gorini, F.; Bustaffa, E.; Bolignano, D.; Cori, L.; Faita, F.; Gastaldelli, A.; Interdonato, M.; Minichilli, F.; Quattrone, G.; Squadrito, F.; et al. Biomarkers of exposure and early effect in three contaminated sites of southern Italy: Protocols for etiological epidemiological studies. BMJ Open 2020, 10, e036160. [Google Scholar] [CrossRef]
- Montalbano, A.M.; Albano, G.D.; Anzalone, G.; Moscato, M.; Gagliardo, R.; Di Sano, C.; Bonanno, A.; Ruggieri, S.; Cibella, F.; Profita, M. Cytotoxic and genotoxic effects of the flame retardants (PBDE-47, PBDE-99 and PBDE-209) in human bronchial epithelial cells. Chemosphere 2020, 245, 125600. [Google Scholar] [CrossRef]
- Albano, G.D.; Moscato, M.; Montalbano, A.M.; Anzalone, G.; Gagliardo, R.; Bonanno, A.; Giacomazza, D.; Barone, R.; Drago, G.; Cibella, F.; et al. Can PBDEs affect the pathophysiologic complex of epithelium in lung diseases? Chemosphere 2020, 241, 125087. [Google Scholar] [CrossRef]
- Longo, V.; Longo, A.; Di Sano, C.; Cigna, D.; Cibella, F.; Di Felice, G.; Colombo, P. In vitro exposure to 2,2’,4,4’-tetrabromodiphenyl ether (PBDE-47) impairs innate inflammatory response. Chemosphere 2019, 219, 845–854. [Google Scholar] [CrossRef]
- Di Bella, C.; Traina, A.; Giosuè, C.; Carpintieri, D.; Lo Dico, G.M.; Bellante, A.; Del Core, M.; Falco, F.; Gherardi, S.; Uccello, M.M.; et al. Heavy Metals and PAHs in Meat, Milk, and Seafood from Augusta Area (Southern Italy): Contamination Levels, Dietary Intake, and Human exposure Assessment. Front. Public Health 2020, 8, 273. [Google Scholar] [CrossRef]
- Ruggieri, S.; Drago, G.; Colombo, P.; Alesci, A.; Augello, P.; Bisbano, A.; Bucolo, A.; Dattoli, P.; De Sole, R.; La Runa, V.; et al. Three contaminated sites in southern Italy. The Neonatal Environment and Health Outcomes cohort: Protocol for a longitudinal birth cohort study. BMJ Open 2019, 9, e029471. [Google Scholar] [CrossRef]
- Cao, J.; Xu, X.; Hylkema, M.N.; Zeng, E.Y.; Sly, P.D.; Suk, W.A.; Bergman, Å.; Huo, X. Early-life Exposure to Widespread Environmental Toxicants and Health Risk: A Focus on the Immune and Respiratory Systems. Ann. Glob. Health. 2016, 82, 119–131. [Google Scholar] [CrossRef] [PubMed]
- Heindel, J.J.; Skalla, L.A.; Joubert, B.R.; Dilworth, C.H.; Gray, K.A. Review of developmental origins of health and disease publications in environmental epidemiology. Reprod. Toxicol. 2017, 68, 34–48. [Google Scholar] [CrossRef] [PubMed]
- Klepac, P.; Locatelli, I.; Korošec, S.; Künzli, N.; Kukec, A. Ambient air pollution and pregnancy outcomes: A comprehensive review and identification of environmental public health challenges. Environ. Res. 2018, 167, 144–159. [Google Scholar] [CrossRef] [PubMed]
- Swanson, J.M.; Entringer, S.; Buss, C.; Wadhwa, P.D. Developmental origins of health and disease: Environmental exposures. Semin. Reprod. Med. 2009, 27, 391–402. [Google Scholar] [CrossRef] [PubMed]
- Zheng, T.; Zhang, J.; Sommer, K.; Bassig, B.A.; Zhang, X.; Braun, J.; Xu, S.; Boyle, P.; Zhang, B.; Shi, K.; et al. Effects of Environmental Exposures on Fetal and Childhood Growth Trajectories. Ann. Glob. Health. 2016, 82, 41–99. [Google Scholar] [CrossRef] [PubMed]
- Sun, C.; Velazquez, M.A.; Fleming, T.P. DOHaD and the Periconceptional Period, a Critical Window in Time. In The Epigenome and Developmental Origins of Health and Disease; Academic Press: Cambridge, MA, USA, 2016; pp. 33–47. [Google Scholar]
- Gernand, A.D.; Schulze, K.J.; Stewart, C.P.; West, K.P., Jr.; Christian, P. Micronutrient deficiencies in pregnancy worldwide: Health effects and prevention. Nat. Rev. Endocrinol. 2016, 12, 274–289. [Google Scholar] [CrossRef] [PubMed]
- Kadawathagedara, M.; De Lauzon-Guillain, B.; Botton, J. Environmental contaminants and child’s growth. J. Dev. Orig. Health Dis. 2018, 9, 632–641. [Google Scholar] [CrossRef]
- Dai, Y.; Huo, X.; Cheng, Z.; Faas, M.M.; Xu, X. Early-life exposure to widespread environmental toxicants and maternal-fetal health risk: A focus on metabolomic biomarkers. Sci. Total. Environ. 2020, 739, 139626. [Google Scholar] [CrossRef]
- Luyten, L.J.; Saenen, N.D.; Janssen, B.G.; Vrijens, K.; Plusquin, M.; Roels, H.A.; Debacq-Chainiaux, F.; Nawrot, T.S. Air pollution and the fetal origin of disease: A systematic review of the molecular signatures of air pollution exposure in human placenta. Environ. Res. 2018, 166, 310–323. [Google Scholar] [CrossRef]
- Vrijheid, M.; Casas, M.; Gascon, M.; Valvi, D.; Nieuwenhuijsen, M. Environmental pollutants and child health—A review of recent concerns. Int. J. Hyg. Environ. Health. 2016, 219, 331–342. [Google Scholar] [CrossRef]
- Wang, B.; Duan, X.; Feng, W.; He, J.; Cao, S.; Liu, S.; Shi, D.; Wang, H.; Wu, F. Health risks to metals in multimedia via ingestion pathway for children in a typical urban area of China. Chemosphere 2019, 226, 381–387. [Google Scholar] [CrossRef] [PubMed]
- Drago, G.; Ruggieri, S.; Bianchi, F.; Sampino, S.; Cibella, F. Birth Cohorts in Highly Contaminated Sites: A Tool for Monitoring the Relationships Between Environmental Pollutants and Children’s Health. Front. Public Health. 2020, 8, 125. [Google Scholar] [CrossRef] [PubMed]
- Evans, G.W.; Kim, P. Multiple risk exposure as a potential explanatory mechanism for the socioeconomic status-health gradient. Ann. N. Y. Acad. Sci. 2010, 1186, 174–189. [Google Scholar] [CrossRef] [PubMed]
- Brender, J.D.; Maantay, J.A.; Chakraborty, J. Residential proximity to environmental hazards and adverse health outcomes. Am. J. Public. Health. 2011, 101, S37–S52. [Google Scholar] [CrossRef] [PubMed]
- Vos, A.A.; Posthumus, A.G.; Bonsel, G.J.; Steegers, E.A.; Denktaş, S. Deprived neighborhoods and adverse perinatal outcome: A systematic review and meta-analysis. Acta. Obstet. Gynecol. Scand. 2014, 93, 727–740. [Google Scholar] [CrossRef]
- Institute of Medicine and National Research Council. Weight Gain During Pregnancy: Reexamining the Guidelines; The National Academies Press: Washington, DC, USA, 2009.
- R Core Team. R: A Language and Environment for Statistical Computing; R Foundation for Statistical Computing: Vienna, Austria, 2020; Available online: http://www.R-project.org (accessed on 10 December 2020).
- Wigle, D.T.; Arbuckle, T.E.; Walker, M.; Wade, M.G.; Liu, S.; Krewski, D. Environmental hazards: Evidence for effects on child health. J. Toxicol. Environ. Health, B. Crit. Rev. 2007, 10, 3–39. [Google Scholar] [CrossRef]
- Vrijheid, M.; Casas, M.; Bergstrom, A.; Carmichael, A.; Cordier, S.; Eggesbo, M.; Eller, E.; Fantini, M.P.; Fernández, M.F.; Fernández-Somoano, A.; et al. European birth cohorts for environmental health research. Environ. Health Perspect. 2012, 120, 29–37. [Google Scholar] [CrossRef]
- Bousquet, J.; Gern, J.E.; Martinez, F.D.; Anto, J.M.; Johnson, C.C.; Holt, P.G.; Lemanske, R.F., Jr.; Le Souëf, P.N.; Teppe, R.S.; von Mutius, E.R.M.; et al. Birth cohorts in asthma and allergic diseases: Report of a NIAID/NHLBI/MeDALL joint workshop. J. Allergy Clin. Immunol. 2014, 133, 1535–1546. [Google Scholar] [CrossRef]
- Centers for Disease; Smoking Office. How Tobacco Smoke Causes Disease: The Biology and Behavioral Basis for Smoking-Attributable Disease: A Report of the Surgeon General; Centers for Disease Control and Prevention (US): Atlanta, GA, USA, 2010. [Google Scholar]
- Cnattingius, S. The epidemiology of smoking during pregnancy: Smoking prevalence, maternal characteristics, and pregnancy outcomes. Nicotine Tob. Res. 2004, 6, S125–S140. [Google Scholar] [CrossRef]
- Skagerstrom, J.; Chang, G.; Nilsen, P. Predictors of drinking during pregnancy: A systematic review. J. Womens Health 2011, 20, 901–913. [Google Scholar] [CrossRef]
- Nykjaer, C.; A Alwan, N.; Greenwood, D.C.; Simpson, N.A.B.; Hay, A.W.M.; White, K.L.M.; E Cade, J. Maternal alcohol intake prior to and during pregnancy and risk of adverse birth outcomes: Evidence from a British cohort. J. Epidemiol. Community Health 2014, 68, 542–549. [Google Scholar] [CrossRef] [PubMed]
- Elliott, L.; Coleman, K.; Suebwongpat, A.; Norris, S. Fetal Alcohol Spectrum Disorders (FASD): Systematic reviews of Prevention, Diagnosis and Management. Christchurch: Health Services Assessment Collaboration (HSAC) 2008, HSAC Report 1, 9. [Google Scholar]
- Amasha, H.A.; Jaradeh, S.M. Effect of Active and Passive smoking during pregnancy on its outcomes. Health Sci. J. 2012, 6, 335. [Google Scholar]
- Huang, S.H.; Weng, K.P.; Huang, S.M.; Liou, H.H.; Wang, C.C.; Ou, S.F.; Lin, C.C.; Chien, K.J.; Lin, C.C.; Wu, M.T. The effects of maternal smoking exposure during pregnancy on postnatal outcomes: A cross sectional study. J. Chin. Med. Assoc. 2017, 80, 796–802. [Google Scholar] [CrossRef] [PubMed]
- Heslehurst, N.; Hayes, L.; Jones, D.; Newham, J.; Olajide, J.; McLeman, L.; McParlin, C.; de Brun, C.; Azevedo, L. The effectiveness of smoking cessation, alcohol reduction, diet and physical activity interventions in changing behaviours during pregnancy: A systematic review of systematic reviews. PLoS ONE 2020, 29, e0232774. [Google Scholar] [CrossRef] [PubMed]
- Cori, L.; Bianchi, F.; Sprovieri, M.; Cuttitta, A.; Ruggieri, S.; Alessi, A.L.; Biondo, G.; Gorini, F. Communication and Community Involvement to Support Risk Governance. Int. J. Environ. Res. Public. Health 2019, 8, 4356. [Google Scholar] [CrossRef] [PubMed]
- Cameron, C.M.; Osborne, J.M.; Spinks, A.B.; Davey, T.M.; Sipe, N.; McClure, R.J. Impact of participant attrition on child injury outcome estimates: A longitudinal birth cohort study in Australia. BMJ Open 2017, 7, e015584. [Google Scholar] [CrossRef]
- Howe, L.D.; Tilling, K.; Galobardes, B.; Lawlor, D.A. Loss to follow-up in cohort studies: Bias in estimates of socioeconomic inequalities. Epidemiology 2013, 24, 1–9. [Google Scholar] [CrossRef]
- Data on Italian Unemployment. Available online: https://www.istat.it/it/archivio/disoccupati (accessed on 22 January 2021).
- Farchi, S.; Forastiere, F.; Brumatti, L.V.; Alviti, S.; Arnofi, A.; Bernardini, T.; Bin, M.; Brescianini, S.; Colelli, V.; Cotichini, R.; et al. Piccolipiù, a multicenter birth cohort in Italy: Protocol of the study. BMC Pediatr. 2014, 14, 36. [Google Scholar] [CrossRef]
- Firestone, R.; Cheng, S.; Pearce, N.; Douwes, J.; Merletti, F.; Pizzi, C.; Pivetta, E.; Rusconi, F.; Richiardi, L. Internet-Based Birth-Cohort Studies: Is This the Future for Epidemiology? JMIR Res. Protoc. 2015, 12, e71. [Google Scholar] [CrossRef]


| Characteristics | Augusta-Priolo | Crotone | Milazzo | p-Value † | Total Sample (n = 845) | ||||
|---|---|---|---|---|---|---|---|---|---|
| Mean | SD | Mean | SD | Mean | SD | Mean | SD | ||
| Age (years) | 30.9 | 5.2 | 31.0 | 5.6 | 32.0 | 4.6 | 0.13 * | 31.1 | 5.2 |
| Marital Status | No. (559) | % | No. (167) | % | No. (117) | % | 0.13 ** | No. (843) | % |
| Never married | 208 | 37.2 | 48 | 28.7 | 38 | 32.5 | 294 | 34.9 | |
| Married | 341 | 61.0 | 117 | 70.1 | 76 | 65.0 | 534 | 63.4 | |
| Divorced | 3 | 0.5 | 2 | 1.2 | 2 | 1.7 | 7 | 0.8 | |
| Separated | 7 | 1.3 | 0 | 0.00 | 1 | 0.8 | 8 | 0.9 | |
| Educational Level | No. (559) | % | No. (165) | % | No. (117) | % | <0.001 ** | No. (841) | % |
| Secondary school or lower qualification | 158 | 28.3 | 40 | 24.2 | 12 | 10.3 | 210 | 25.0 | |
| High school | 277 | 49.5 | 83 | 50.4 | 62 | 53.0 | 422 | 50.2 | |
| Degree or higher qualification | 124 | 22.2 | 42 | 25.4 | 43 | 36.7 | 209 | 24.8 | |
| Working Condition | No. (556) | % | No. (165) | % | No. (117) | % | <0.0001 ** | No. (838) | % |
| YES | 157 | 28.2 | 64 | 38.8 | 76 | 65.0 | 297 | 35.4 | |
| NO | 399 | 71.8 | 101 | 61.2 | 41 | 35.0 | 541 | 64.6 | |
| Average week of gestation in which they stopped working | Mean | SD | Mean | SD | Mean | SD | Mean | SD | |
| 27.8 | 9.7 | 24.2 | 11.7 | 27.6 | 9.9 | 0.05 * | 27 | 10.3 | |
| Reasons# | No. (148) | % | No. (61) | % | No. (76) | % | No. (285) | % | |
| Reached the legal deadline for maternity | 75 | 50.7 | 22 | 36.1 | 8 | 10.5 | 105 | 36.8 | |
| Disease/tiredness | 11 | 7.4 | 9 | 14.7 | 6 | 7.9 | 26 | 9.1 | |
| Personal choice | 53 | 35.8 | 27 | 44.3 | 65 | 85.5 | 145 | 50.9 | |
| Dismissal | 3 | 2.0 | 1 | 1.6 | 0 | 0.00 | 4 | 1.4 | |
| Other | 5 | 3.4 | 1 | 1.6 | 1 | 1.3 | 7 | 2.5 | |
| Active Smoking | No. (559) | % | No. (166) | % | No. (117) | % | 0.64 ** | No. (842) | % |
| YES | 63 | 11.3 | 20 | 12.1 | 10 | 8.6 | 93 | 11.1 | |
| NO | 496 | 88.7 | 146 | 87.9 | 107 | 91.4 | 749 | 88.9 | |
| Mean | SD | Mean | SD | Mean | SD | Mean | SD | ||
| Average number of cigarettes per day in pregnancy | 5.6 | 4.8 | 3.3 | 2.9 | 4.3 | 2.9 | 0.10* | 5.0 | 4.4 |
| Average number of cigarettes per day in first trimester | 5.8 | 4.9 | 3.4 | 2.8 | 4.5 | 3.2 | 0.11* | 5.1 | 4.4 |
| Average number of cigarettes per day in second trimester | 5.3 | 4.6 | 2.6 | 2.9 | 3.6 | 2.4 | 0.06 * | 4.6 | 4.3 |
| Average number of cigarettes per day in third trimester | 5.1 | 4.3 | 2.8 | 2.9 | 3.6 | 2.3 | 0.12* | 4.5 | 3.9 |
| Passive Smoking | No. (561) | % | No. (167) | % | No. (117) | % | <0.0001 ** | No. (845) | % |
| YES | 48 | 8.6 | 35 | 20.9 | 34 | 29.1 | 117 | 13.9 | |
| NO | 513 | 91.4 | 132 | 79.1 | 83 | 70.9 | 728 | 86.1 | |
| Consumption of Alcohol | No. (560) | % | No. (160) | % | No. (117) | % | <0.0001 ** | No. (837) | % |
| YES | 7 | 1.2 | 16 | 10.0 | 16 | 13.7 | 39 | 4.7 | |
| NO | 553 | 98.8 | 144 | 90.0 | 101 | 86.3 | 798 | 95.3 | |
| Mean | SD | Mean | SD | Mean | SD | MEAN | SD | ||
| BMI (kg/m2) | 23.6 | 4.8 | 23.4 | 4.1 | 22.9 | 3.7 | 0.32 * | 23.4 | 4.6 |
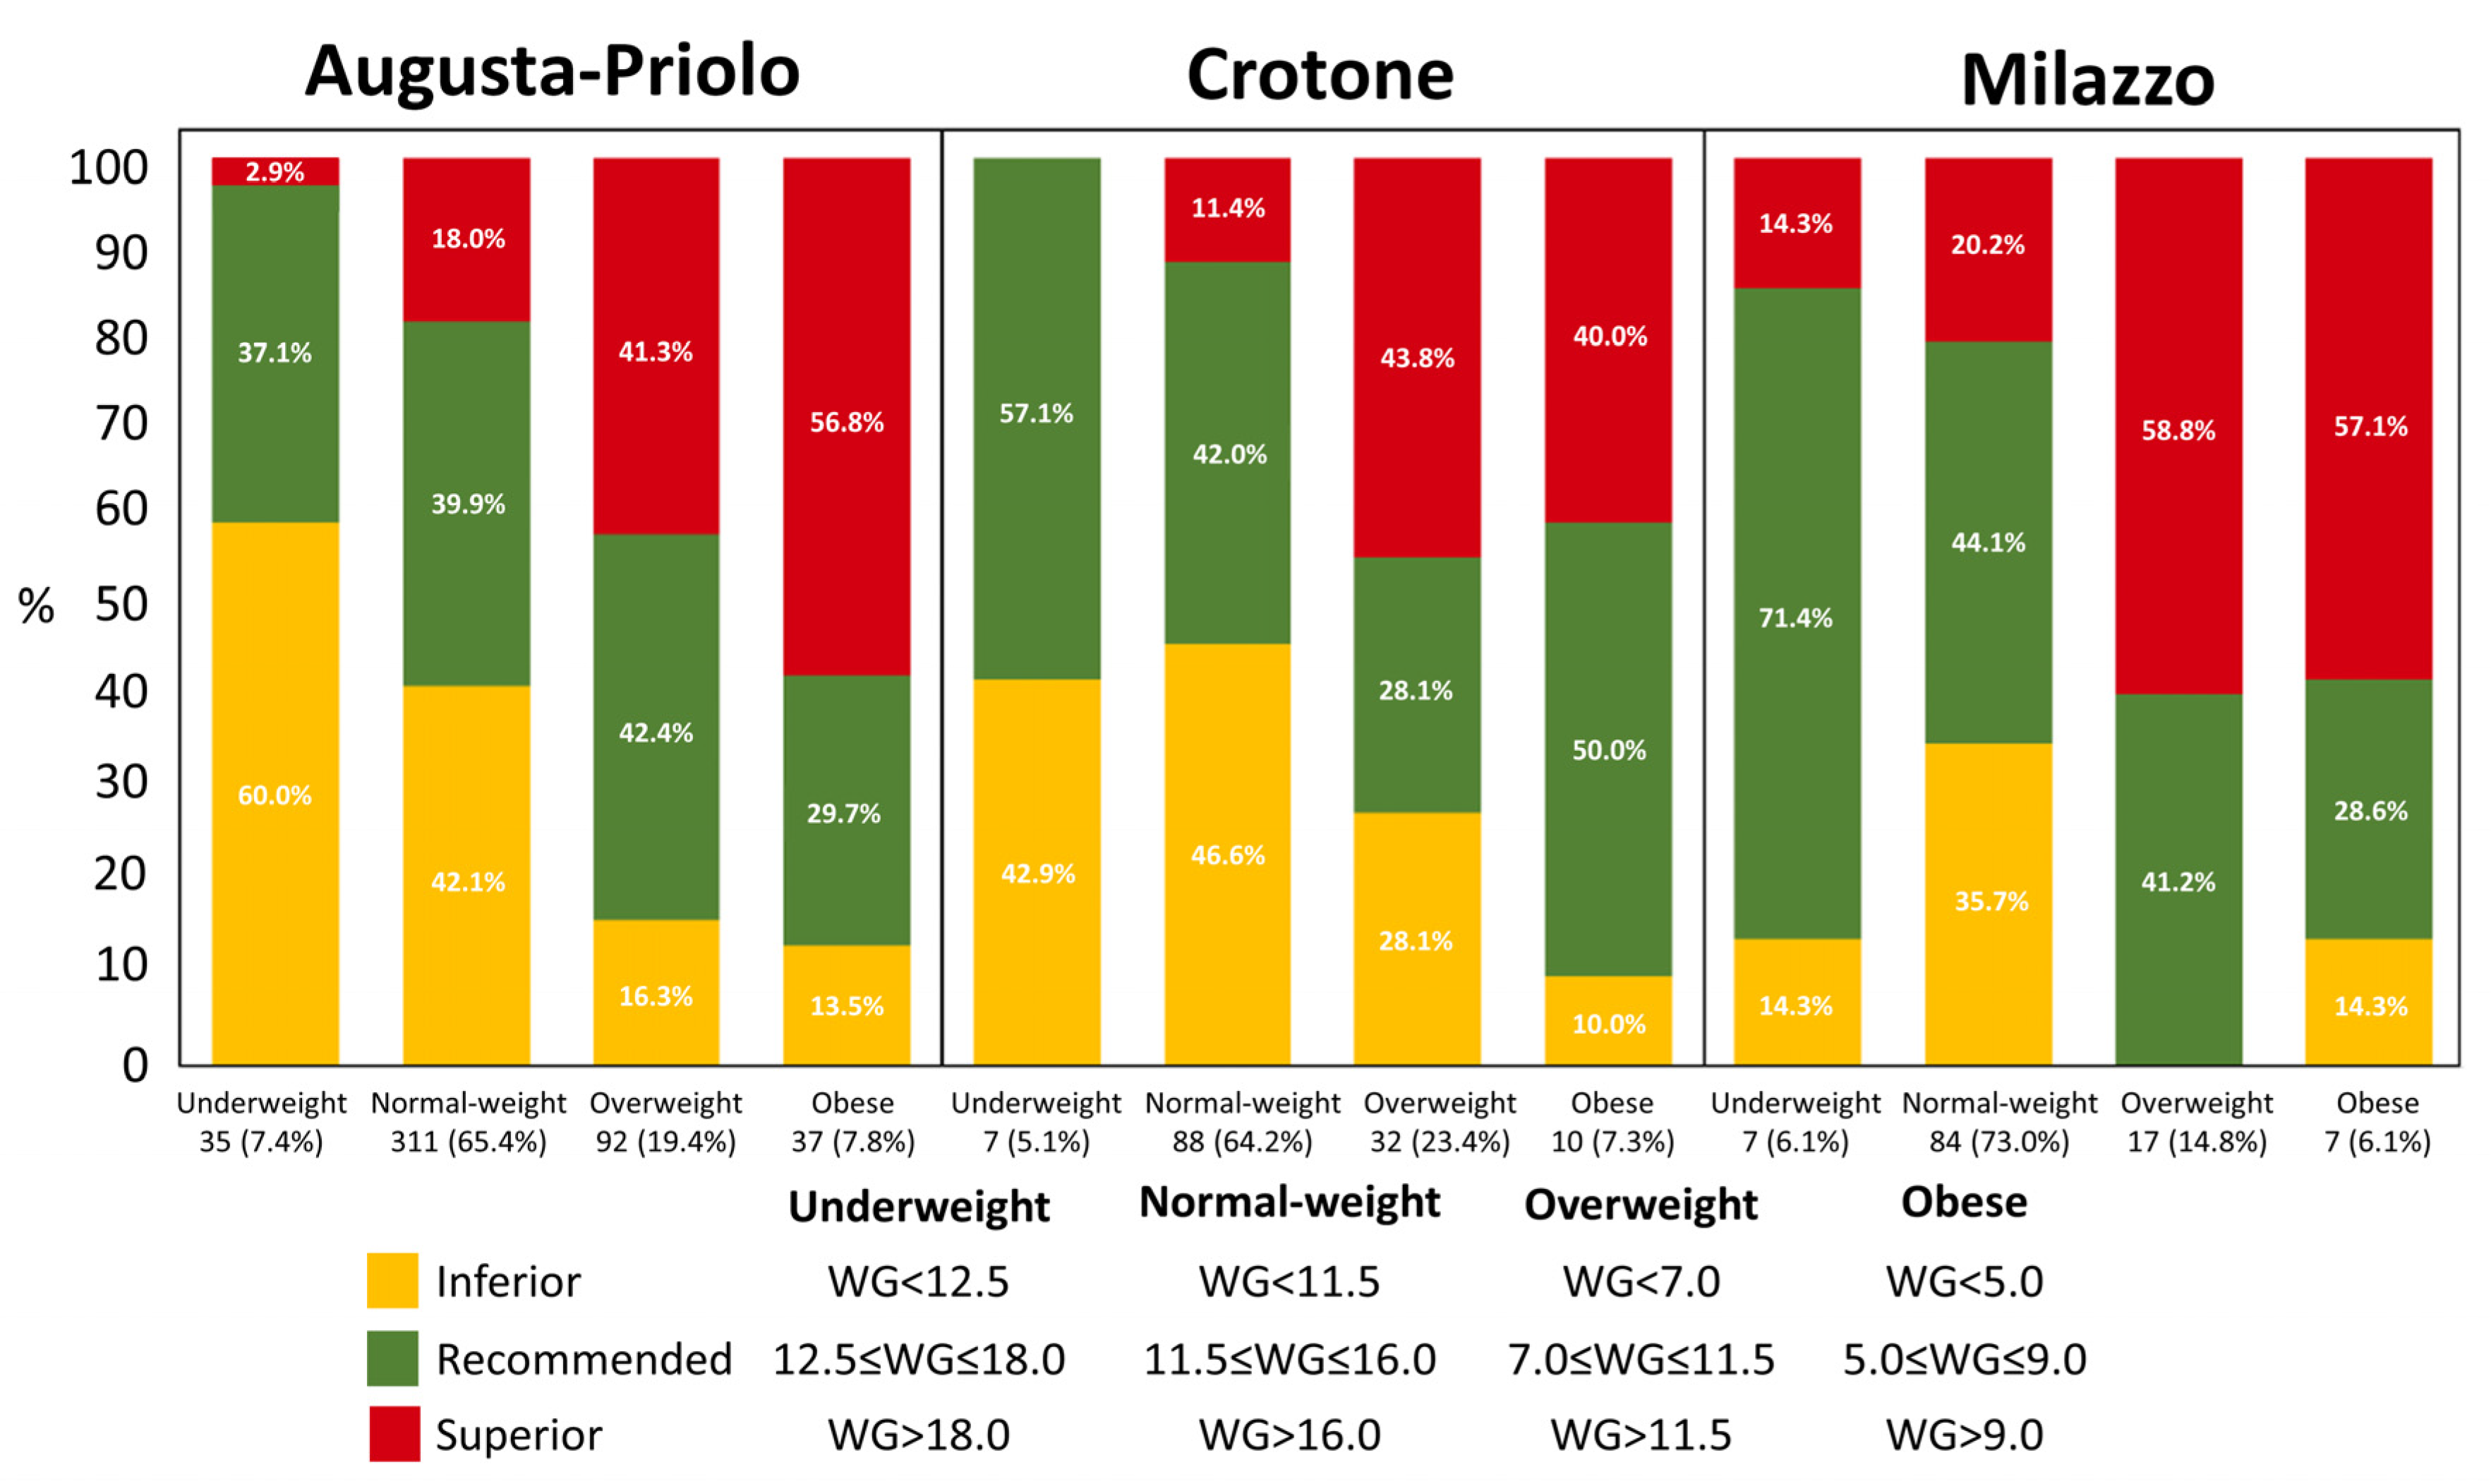
| Weight gain (kg) | 12.1 | 4.0 | 11.3 | 4.4 | 12.9 | 3.9 | 0.009 * | 12.1 | 4.1 |
| Intended Pregnancy | No. (561) | % | No. (165) | % | No. (117) | % | <0.0001 ** | No. (843) | % |
| YES | 464 | 82.7 | 101 | 61.2 | 97 | 82.9 | 662 | 78.5 | |
| NO | 97 | 17.3 | 64 | 38.8 | 20 | 17.1 | 181 | 21.5 | |
| Time to Pregnancy | No. (464) | % | No. (98) | % | No. (97) | % | 0.16 ** | No. (659) | % |
| Less than one year | 414 | 89.2 | 93 | 94.9 | 90 | 92.8 | 597 | 90.6 | |
| More than one year | 50 | 10.8 | 5 | 5.1 | 7 | 7.2 | 62 | 9.4 | |
| First Ultrasound | Mean | SD | Mean | SD | Mean | SD | <0.001 * | MEAN | SD |
| Week of gestation | 8.1 | 2.6 | 7.2 | 2.1 | 7.6 | 2.1 | 7.8 | 2.4 | |
| Preparation Course | No. (560) | % | No. (165) | % | No. (117) | % | 0.001 ** | No. (842) | % |
| YES | 248 | 44.3 | 50 | 30.3 | 38 | 32.5 | 336 | 39.9 | |
| NO | 312 | 55.7 | 115 | 69.7 | 79 | 67.5 | 506 | 60.1 | |
| Birth Type | No. (561) | % | No. (167) | % | No. (117) | % | <0.0001 ** | No. (845) | % |
| Vaginal | 316 | 56.3 | 138 | 82.6 | 78 | 66.7 | 532 | 63.0 | |
| Caesarean section | 245 | 43.7 | 29 | 17.4 | 39 | 33.3 | 313 | 37.0 | |
| Mean | SD | Mean | SD | Mean | SD | <0.0001 * | MEAN | SD | |
| Week of gestation | 39.4 | 1.2 | 39.6 | 1.1 | 39.9 | 1.0 | 39.5 | 1.1 | |
| Characteristics | Augusta-Priolo | Crotone | Milazzo | p-Value | Total Sample (n = 845) | ||||
|---|---|---|---|---|---|---|---|---|---|
| Mean | SD | Mean | SD | Mean | SD | Mean | SD | ||
| Age (years) | 34.6 | 6.3 | 33.5 | 6.6 | 35.6 | 5.6 | 0.02 * | 34.6 | 6.3 |
| Marital Status | No. (453) | % | No. (166) | % | No. (116) | % | 0.28 ** | No. (735) | % |
| Never married | 166 | 36.6 | 47 | 28.3 | 38 | 32.8 | 251 | 34.1 | |
| Married | 281 | 62.1 | 117 | 70.5 | 75 | 64.7 | 473 | 64.4 | |
| Divorced | 2 | 0.4 | 1 | 0.6 | 2 | 1.7 | 5 | 0.7 | |
| Separated | 4 | 0.9 | 1 | 0.6 | 1 | 0.8 | 6 | 0.8 | |
| Educational Level | No. (556) | % | No. (164) | % | No. (117) | % | 0.008 ** | No. (837) | % |
| Secondary school or lower qualification | 191 | 34.4 | 52 | 31.7 | 22 | 18.8 | 265 | 31.7 | |
| High school | 293 | 52.7 | 87 | 53.1 | 70 | 59.8 | 450 | 53.8 | |
| Degree or higher qualification | 72 | 12.9 | 25 | 15.2 | 25 | 21.4 | 122 | 14.5 | |
| BMI (kg/m2) | Mean | SD | Mean | SD | Mean | SD | Mean | SD | |
| 26.0 | 3.9 | 25.9 | 3.7 | 25.3 | 2.6 | 0.15 * | 25.9 | 3.7 | |
| Characteristics | Augusta-Priolo | Crotone | Milazzo | p-Value | Total Sample (n = 845) | ||||
|---|---|---|---|---|---|---|---|---|---|
| Newborn Gender | No. (561) | % | No. (167) | % | No. (117) | % | 0.42 ** | No. (845) | % |
| Male | 302 | 53.8 | 98 | 58.7 | 60 | 51.3 | 460 | 54.4 | |
| Female | 259 | 46.2 | 69 | 41.3 | 57 | 48.7 | 385 | 45.6 | |
| Mean | SD | Mean | SD | Mean | SD | Mean | SD | ||
| Weight | 3288.7 | 407.2 | 3335.6 | 389.6 | 3347.9 | 364.6 | 0.19 * | 3306 | 398.5 |
| Length | 49.8 | 1.4 | 50.9 | 1.8 | 50.7 | 1.6 | <0.0001 * | 50.1 | 1.6 |
| Head Circumference | 34.8 | 1.0 | 33.8 | 1.2 | 34.6 | 1.6 | <0.0001 * | 34.6 | 1.2 |
| Characteristics | Augusta-Priolo | Crotone | Milazzo | p-Value | Sub-Sample (n = 130) | ||||
|---|---|---|---|---|---|---|---|---|---|
| Mean | SD | Mean | SD | Mean | SD | Mean | SD | ||
| Age (years) | 29.6 | 6.1 | 30.3 | 7.3 | 30.7 | 4.6 | 0.70 * | 30 | 6.2 |
| Marital Status | No. (72) | % | No. (33) | % | No. (25) | % | 0.06 ** | No. (130) | % |
| Never married | 29 | 40.3 | 7 | 21.2 | 12 | 48.0 | 48 | 37.0 | |
| Married | 41 | 56.9 | 26 | 78.8 | 11 | 44.0 | 78 | 60.0 | |
| Divorced | 1 | 1.4 | 0 | 0.00 | 1 | 4.0 | 2 | 1.5 | |
| Separated | 1 | 1.4 | 0 | 0.00 | 1 | 4.0 | 2 | 1.5 | |
| Educational Level | No. (72) | % | No. (33) | % | No. (25) | % | 0.009 ** | No. (130) | % |
| Secondary school or lower qualification | 42 | 58.3 | 18 | 54.6 | 5 | 20.0 | 65 | 50.0 | |
| High school | 20 | 27.8 | 12 | 36.4 | 16 | 64.0 | 48 | 36.9 | |
| Degree or higher qualification | 10 | 13.9 | 3 | 9.0 | 4 | 16.0 | 17 | 13.1 | |
| Working Condition | No. (72) | % | No. (33) | % | No. (25) | % | <0.001 ** | No. (130) | % |
| YES | 12 | 16.7 | 4 | 12.1 | 13 | 52.0 | 29 | 22.3 | |
| NO | 60 | 83.3 | 29 | 87.9 | 12 | 48.0 | 101 | 77.7 | |
| Average gestation week in which they stopped | 15.3 ± 9.3 | 32.0 ± 1.6 | 31.4 ± 8.2 | <0.001 * | 25.1 ± 11.3 | ||||
| Reasons | No. (11) | % | No. (4) | % | No. (13) | % | No. (28) | % | |
| Reached the legal deadline for maternity | 1 | 9.1 | 2 | 50.0 | 0 | 0.00 | 3 | 10.7 | |
| Disease/tiredness | 2 | 18.2 | 1 | 25.0 | 0 | 0.00 | 3 | 10.7 | |
| Personal choice | 4 | 36.4 | 1 | 25.0 | 13 | 100.0 | 18 | 64.3 | |
| Dismissal | 0 | 0.00 | 0 | 0.00 | 0 | 0.00 | 0 | 0.00 | |
| Other | 4 | 36.4 | 0 | 0.00 | 0 | 0.00 | 4 | 14.3 | |
| Active Smoking | No. (72) | % | No. (33) | % | No. (25) | % | 0.51 ** | No. (130) | % |
| YES | 13 | 18.1 | 9 | 27.3 | 4 | 16.0 | 26 | 20.0 | |
| NO | 59 | 81.9 | 24 | 72.7 | 21 | 84.0 | 104 | 80.0 | |
| MEAN | SD | Mean | SD | Mean | SD | Mean | SD | ||
| Average number of cigarettes per day in pregnancy | 6.3 | 4.0 | 3.4 | 3.0 | 4.6 | 2.5 | 0.18 * | 5.1 | 3.6 |
| Average number of cigarettes per day in first trimester | 6.6 | 4.3 | 3.5 | 3.1 | 4.00 | 2.7 | 0.17 * | 5.7 | 3.9 |
| Average number of cigarettes per day in second trimester | 6.0 | 4.2 | 3.1 | 3.4 | 4.8 | 2.6 | 0.26 * | 4.8 | 3.8 |
| Average number of cigarettes per day in third trimester | 6.0 | 3.8 | 3.5 | 3.3 | 4.4 | 2.3 | 0.30 | 4.8 | 3.5 |
| Passive Smoking | No. (72) | % | No. (33) | % | No. (25) | % | 0.0001 ** | No. (130) | % |
| YES | 9 | 12.5 | 14 | 42.4 | 12 | 48.0 | 35 | 26.9 | |
| NO | 63 | 87.5 | 19 | 57.6 | 13 | 52.0 | 95 | 73.1 | |
| Consumption of Alcohol | No. (72) | % | No. (32) | % | No. (25) | % | 0.02 ** | No. (129) | % |
| YES | 2 | 2.8 | 5 | 15.6 | 4 | 16.0 | 11 | 8.5 | |
| NO | 70 | 97.2 | 27 | 84.4 | 21 | 84.0 | 118 | 91.5 | |
| MEAN | SD | MEAN | SD | MEAN | SD | MEAN | SD | ||
| BMI (kg/m2) | 23.2 | 4.6 | 23.9 | 4.8 | 23.9 | 3.2 | 0.67 * | 23.5 | 4.4 |
| Weight Gain (kg) | 12.3 | 4.1 | 12.1 | 4.6 | 12.2 | 3.4 | 0.99 * | 12.2 | 4.1 |
| Intended Pregnancy | No. (72) | % | No. (33) | % | No. (25) | % | 0.67 ** | No. (130) | % |
| YES | 51 | 70.8 | 23 | 69.7 | 20 | 80.0 | 94 | 72.3 | |
| NO | 21 | 29.2 | 10 | 30.3 | 5 | 20.0 | 36 | 27.7 | |
| Time to Pregnancy | No. (51) | % | No. (23) | % | No. (20) | % | 0.82 ** | No. (94) | % |
| Less than one year | 46 | 90.2 | 21 | 91.3 | 17 | 85.0 | 84 | 89.4 | |
| More than one year | 5 | 9.8 | 2 | 8.7 | 3 | 15.0 | 10 | 10.6 | |
| First Ultrasound | MEAN | SD | MEAN | SD | MEAN | SD | 0.51 * | MEAN | SD |
| Gestation week | 8.1 | 2.7 | 7.6 | 2.5 | 8.2 | 2.5 | 8.0 | 2.6 | |
| Preparation Course | No. (72) | % | No. (33) | % | No. (25) | % | 0.70 ** | No. (130) | % |
| Yes | 23 | 31.9 | 8 | 24.2 | 6 | 24.0 | 37 | 28.5 | |
| No | 49 | 68.1 | 25 | 75.8 | 19 | 76.0 | 93 | 71.5 | |
| Birth Type | No. (72) | % | No. (33) | % | No. (25) | % | 0.29 ** | No. (130) | % |
| Vaginal | 41 | 56.9 | 23 | 69.7 | 18 | 72.0 | 82 | 63.1 | |
| Caesarean section | 31 | 43.1 | 10 | 30.3 | 7 | 28.0 | 48 | 36.9 | |
| MEAN | SD | MEAN | SD | MEAN | SD | 0.42 * | MEAN | SD | |
| Week of gestation | 39.3 | 1.2 | 39.4 | 1.2 | 39.7 | 0.9 | 39.4 | 1.1 | |
| Characteristics | Augusta-Priolo | Crotone | Milazzo | p-Value | Sub-Sample (n = 130) | ||||
|---|---|---|---|---|---|---|---|---|---|
| Mean | SD | Mean | SD | Mean | SD | Mean | SD | ||
| Age (years) | 33.8 | 7.0 | 32.7 | 5.7 | 33.2 | 5.6 | 0.72 * | 33.4 | 6.4 |
| Marital Status | No. (56) | % | No. (23) | % | No. (55) | % | 0.03 ** | No. (114) | % |
| Never married | 21 | 37.5 | 7 | 21.2 | 13 | 52.0 | 41 | 35.9 | |
| Married | 33 | 58.9 | 26 | 78.8 | 11 | 44.0 | 70 | 61.4 | |
| Divorced | 0 | 0.00 | 0 | 0.00 | 1 | 4.00 | 1 | 0.9 | |
| Separated | 2 | 3.6 | 0 | 0.00 | 0 | 0.00 | 2 | 1.8 | |
| Educational Level | No. (69) | % | No. (33) | % | No. (25) | % | 0.51 ** | No. (127) | % |
| Secondary school or lower qualification | 34 | 49.3 | 17 | 51.5 | 8 | 32.0 | 59 | 46.5 | |
| High school | 32 | 46.4 | 14 | 42.4 | 15 | 60.0 | 61 | 48.0 | |
| Degree or higher qualification | 3 | 4.3 | 2 | 6.1 | 2 | 8.00 | 7 | 5.5 | |
| BMI (kg/m2) | Mean | SD | Mean | SD | Mean | SD | Mean | SD | |
| 26.3 | 3.3 | 26.2 | 3.7 | 25.9 | 3.0 | 0.87 * | 26.2 | 3.3 | |
| Characteristics | Augusta-Priolo | Crotone | Milazzo | p-Value | Sub-Sample (n = 130) | ||||
|---|---|---|---|---|---|---|---|---|---|
| Newborn Gender | No. (72) | % | No. (33) | % | No. (25) | % | 0.57 ** | No. (130) | % |
| Male | 38 | 52.8 | 21 | 63.6 | 13 | 52.0 | 72 | 55.4 | |
| Female | 34 | 47.2 | 12 | 36.4 | 12 | 48.0 | 58 | 44.6 | |
| Mean | SD | Mean | SD | Mean | SD | Mean | SD | ||
| Weight | 3286.5 | 409.2 | 3311.8 | 397.6 | 3410.7 | 313.9 | 0.39 * | 3317 | 389.8 |
| Length | 49.6 | 1.5 | 51.0 | 1.8 | 50.8 | 1.6 | <0.0001 * | 50.2 | 1.7 |
| Head Circumference | 34.7 | 1.0 | 33.7 | 1.2 | 34.5 | 1.5 | <0.001 * | 34.4 | 1.2 |
Publisher’s Note: MDPI stays neutral with regard to jurisdictional claims in published maps and institutional affiliations. |
© 2021 by the authors. Licensee MDPI, Basel, Switzerland. This article is an open access article distributed under the terms and conditions of the Creative Commons Attribution (CC BY) license (http://creativecommons.org/licenses/by/4.0/).
Share and Cite
Ruggieri, S.; Maltese, S.; Drago, G.; Cibella, F.; Panunzi, S. The Neonatal Environment and Health Outcomes (NEHO) Birth Cohort Study: Behavioral and Socioeconomic Characteristics and Drop-Out Rate from a Longitudinal Birth Cohort in Three Industrially Contaminated Sites in Southern Italy. Int. J. Environ. Res. Public Health 2021, 18, 1252. https://doi.org/10.3390/ijerph18031252
Ruggieri S, Maltese S, Drago G, Cibella F, Panunzi S. The Neonatal Environment and Health Outcomes (NEHO) Birth Cohort Study: Behavioral and Socioeconomic Characteristics and Drop-Out Rate from a Longitudinal Birth Cohort in Three Industrially Contaminated Sites in Southern Italy. International Journal of Environmental Research and Public Health. 2021; 18(3):1252. https://doi.org/10.3390/ijerph18031252
Chicago/Turabian StyleRuggieri, Silvia, Sabina Maltese, Gaspare Drago, Fabio Cibella, and Simona Panunzi. 2021. "The Neonatal Environment and Health Outcomes (NEHO) Birth Cohort Study: Behavioral and Socioeconomic Characteristics and Drop-Out Rate from a Longitudinal Birth Cohort in Three Industrially Contaminated Sites in Southern Italy" International Journal of Environmental Research and Public Health 18, no. 3: 1252. https://doi.org/10.3390/ijerph18031252
APA StyleRuggieri, S., Maltese, S., Drago, G., Cibella, F., & Panunzi, S. (2021). The Neonatal Environment and Health Outcomes (NEHO) Birth Cohort Study: Behavioral and Socioeconomic Characteristics and Drop-Out Rate from a Longitudinal Birth Cohort in Three Industrially Contaminated Sites in Southern Italy. International Journal of Environmental Research and Public Health, 18(3), 1252. https://doi.org/10.3390/ijerph18031252