
Regulating and Cultural Ecosystem Services of Urban Green Infrastructure in the Nordic Countries: A Systematic Review

 , and
, and
Abstract
1. Introduction
- (1)
- In addition to flood regulation, have other ES of UGI emerged in the research panorama across the Nordic countries?
- (2)
- Is there a solid scientific evidence of the (regulating/cultural) benefits commonly attributed to UGI?
- (3)
- Is there an equivalent understanding of the potential co-benefits and disservices?
- (4)
- Are there scientific gaps that may hinder the implementation of UGI solutions in this region?
2. Methods
3. Results
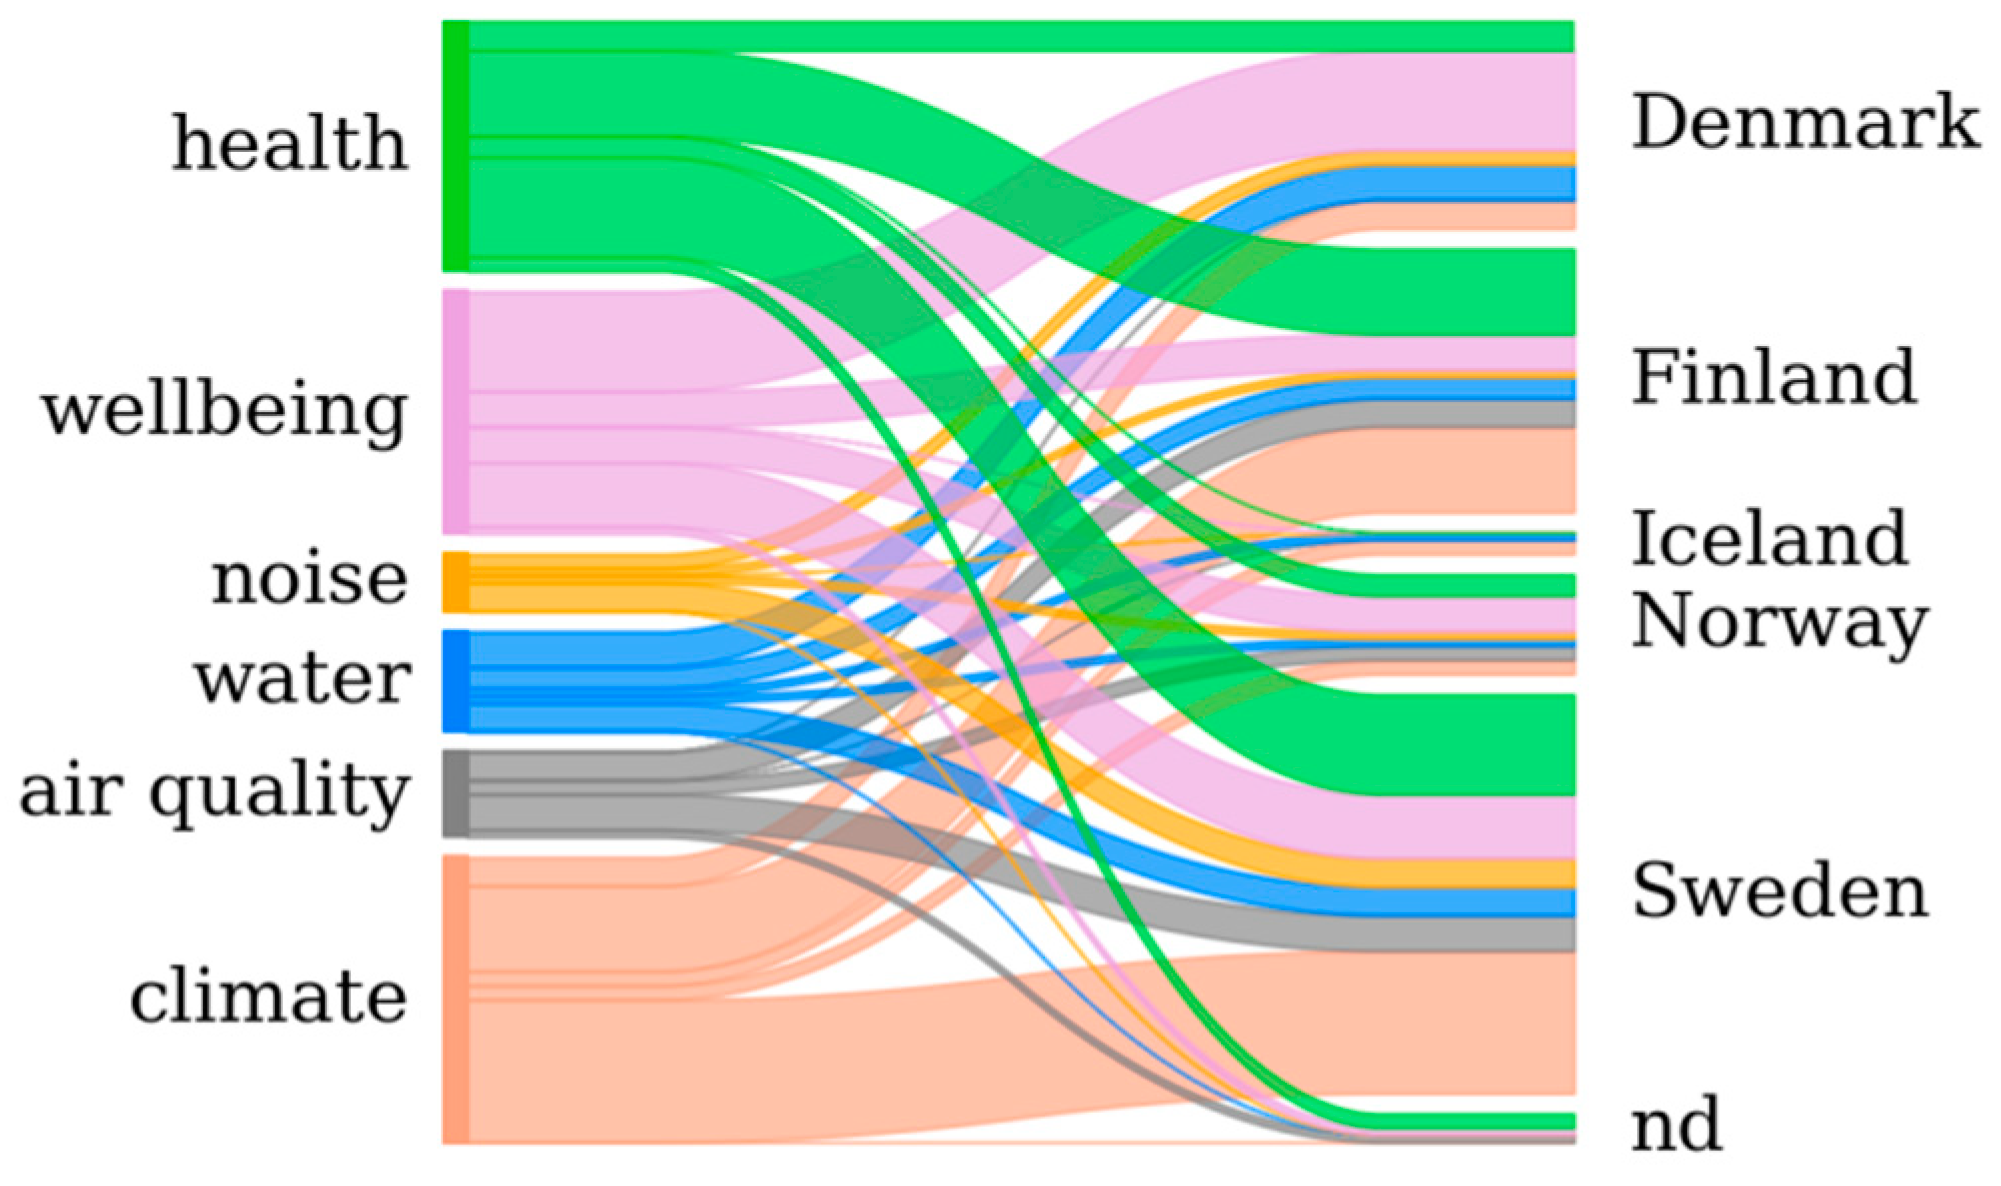
3.1. Metadata
3.1.1. Research Topic
3.1.2. UGI Type and Research Method
3.1.3. Spatiotemporal Scales of the Analysis
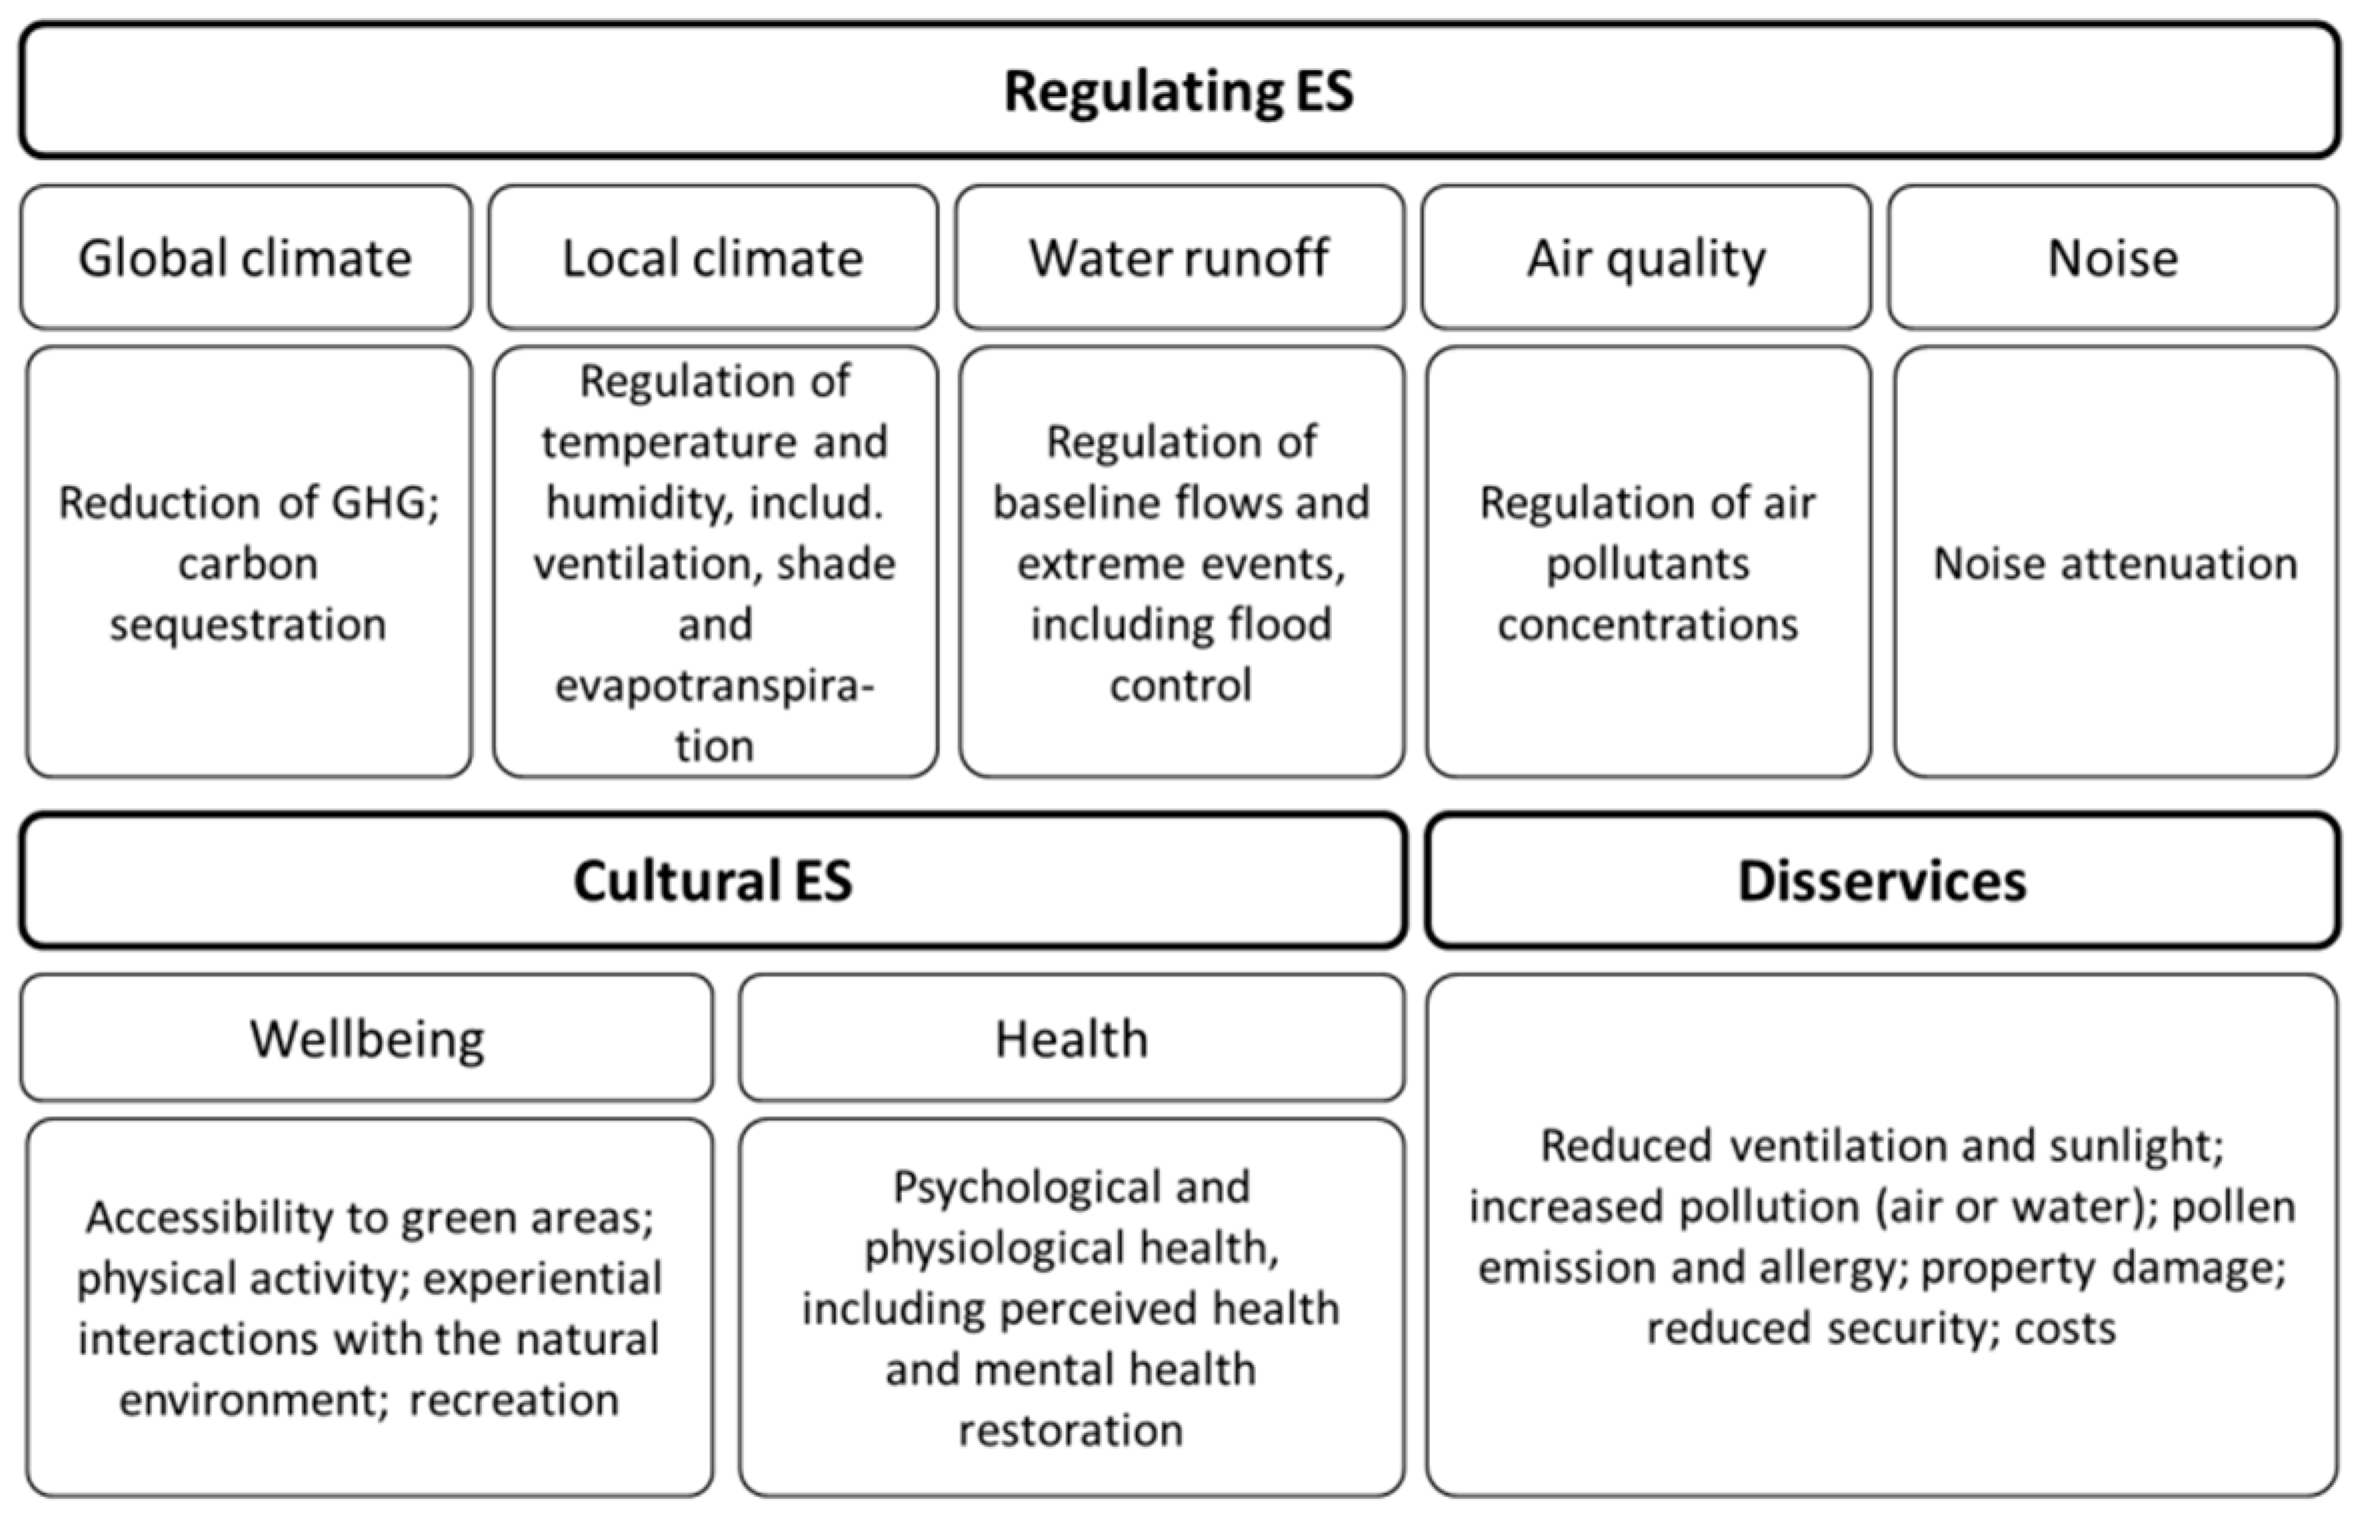
3.2. Ecosystem Services Provision
3.2.1. Climate Regulation
3.2.2. Water Runoff Regulation
3.2.3. Air Quality Regulation
3.2.4. Noise Regulation
3.2.5. Promotion of Well-Being and Health
3.3. Disservices
4. Discussion on Knowledge Gaps
5. Conclusions
Author Contributions
Funding
Institutional Review Board Statement
Informed Consent Statement
Data Availability Statement
Conflicts of Interest
Appendix A

| A | nord*, ”Northern Europe”, Scandinavia*, Swed*, Denmark, Danish, Finland, Finnish, Iceland*, Norw*, Stockholm, Gothenburg, Malmö, Copenhagen, Oslo, Helsinki, Helsingfors, Reykjavik |
| B | city, cities, *urb*, metropolitan, hous*, building, town, street, wall, façade, roof, surface, catchment |
| C | vegetati*, plant, green*, “green infrastructure”, UGI, “green urban infrastructure”, “nature-based solutions”, NbS, “ecosystem services”, “ecosystem-based adaptation”, EbA, “urban forest”, “urban woodland”, park, garden, tree, courtyard, farm, lawn, leaf, leaves, foliage, canopy, Betula, Birch, Tilia, Linden, Lime, Acer, Maple, Platanus, Plane, Quercus, Oak, Aesculus, “Horse chestnut”, Fraxinus, Ash, Pinus, Pine, Prunus, Cherry, Populus, Poplar, Ulmus, Elm, grass, Sedum |
| D | health, wellbeing, well-being, comfort, climate, adapt*, heat, UHI, temperature, thermal, shad*, cool, PCI, evaporation, *transpiration, wind, ventilation, turbulen*, noise, flux, mixing, *water, flood*, rain*, precipitation, cloudburst, runoff, drain*, detain, percolation, infiltration, “air quality”, “air pollution”, particle, “particulate matter”, PM, PM10, PM2.5, BPM, “organic compound”, *VOC, isoprene, monoterpene, “carbon dioxide”, CO2, “carbon monoxide”, ozone, O3, “nitrogen oxides”, NOx, “nitrogen monoxide”, “nitric oxide”, “nitrogen dioxide”, NO2, “nitrous oxide”, N2O, “sulfur dioxide”, SO2, methane, CH4, aerosol, carbon, pollen, allergen* |
| Fields | Options |
|---|---|
| Country | Nd (e.g., Northern Europe or Scandinavia); Denmark; Finland; Iceland; Norway; Sweden |
| City or region | (text entry) |
| Geographical scale | Nd; building; neighborhood; city; region; country |
| Spatial resolution (applies essentially to modelling) | Nd; <1 m; 1–10 m; 11–100 m; 101–1000 m; 1–10 km; >10 km |
| Timescale | Nd; <24 h (very short term); 1–6 days (short term); 1–3 weeks; 1–3 months; 4–6 months (seasonal); 7–12 months; >1 year (long term); >10 years (decadal) |
| UGI type | Nd; street trees; urban park or forest; garden; courtyard; square; lawn; green-roof; green-wall; urban farm; other |
| Topic | Nd; local climate (including heat); global climate; air quality; water runoff (including flooding); noise; health; well-being; pollen; other |
| Quantitative method | None; field campaign; existing observation network; satellite; wind tunnel; other experimental; local scale model; mesoscale model; statistical model or analysis; other |
| Qualitative method | None; survey/questionnaire/interview; any other form of meeting; other |
| Identified limitations or obstacles | (text entry) |
| Identified knowledge gaps | (text entry) |
| Identified future projections | None; climate projections; emissions projections; urban planning scenarios; other |
| Effect/impact quantification | (text entry) |
| Identified disservices | (text entry) |
| Identified climate adaptation solutions | (text entry) |
| End users or stakeholders involved/addressed | (text entry) |
| Identified planning recommendations | (text entry) |
| Local Climate | Global Climate | Air Quality | Water Runoff | Noise | Well-Being | Psychol. Health | Physiol. Health | Pollen | |
| [28,29,31,32,33,34,35,36,114] | |||||||||
| [23,24,27,89,106,107] | |||||||||
| [46,47,48,49,51,52,53] | |||||||||
| [37,38,39,40,41,42,44,45,104,105] | |||||||||
| [60] | |||||||||
| [61,63,64,65,66,68,70,73,77,78,81,84,87,93,116] | |||||||||
| [83,85,90,94,95,96,118,119] | |||||||||
| [99,100,101] | |||||||||
| [22,25] | |||||||||
| [26] | |||||||||
| [21] | |||||||||
| [43] | |||||||||
| [117,120] | |||||||||
| [67] | |||||||||
| [115] | |||||||||
| [88] | |||||||||
| [50] | |||||||||
| [59] | |||||||||
| [58,62] | |||||||||
| [54,57] | |||||||||
| [55] | |||||||||
| [56,71,72,74,79,80,82,86,91] | |||||||||
| [98] | |||||||||
| [92,97] | |||||||||
| [102,103] |
References
- Janhäll, S. Review on urban vegetation and particle air pollution—Deposition and dispersion. Atmos. Environ. 2015, 105, 130–137. [Google Scholar] [CrossRef]
- Sinnett, D.; Smith, N.; Burgess, S. Handbook on Green Infrastructure; Edward Elgar Publishing: Cheltenham, UK, 2015. [Google Scholar]
- Grote, R.; Samson, R.; Alonso, R.; Amorim, J.H.; Cariñanos, P.; Churkina, G.; Fares, S.; Le Thiec, D.; Niinemets, Ü.; Mikkelsen, T.N.; et al. Functional traits of urban trees: Air pollution mitigation potential. Front. Ecol. Environ. 2016, 14, 543–550. [Google Scholar] [CrossRef]
- Abhijith, K.; Kumar, P.; Gallagher, J.; McNabola, A.; Baldauf, R.; Pilla, F.; Broderick, B.; Di Sabatino, S.; Pulvirenti, B. Air pollution abatement performances of green infrastructure in open road and built-up street canyon environments—A review. Atmos. Environ. 2017, 162, 71–86. [Google Scholar] [CrossRef]
- Saaroni, H.; Amorim, J.; Hiemstra, J.; Pearlmutter, D. Urban Green Infrastructure as a tool for urban heat mitigation: Survey of research methodologies and findings across different climatic regions. Urban Clim. 2018, 24, 94–110. [Google Scholar] [CrossRef]
- Roeland, S.; Moretti, M.; Amorim, J.H.; Branquinho, C.; Fares, S.; Morelli, F.; Niinemets, Ü.; Paoletti, E.; Pinho, P.; Sgrigna, G.; et al. Towards an integrative approach to evaluate the environmental ecosystem services provided by urban forest. J. For. Res. 2019, 30, 1981–1996. [Google Scholar] [CrossRef]
- Hewitt, N.; Ashworth, K.; MacKenzie, A.R. Using green infrastructure to improve urban air quality (GI4AQ). Ambio 2020, 49, 62–73. [Google Scholar] [CrossRef]
- Brink, E.; Aalders, J.T.; Ádám, D.; Feller, R.; Henselek, Y.; Hoffmann, A.; Ibe, K.; Matthey-Doret, A.; Meyer, M.; Negrut, N.L.; et al. Cascades of green: A review of ecosystem-based adaptation in urban areas. Glob. Environ. Chang. 2016, 36, 111–123. [Google Scholar] [CrossRef]
- The Economics of Ecosystems and Biodiversity (TEEB), TEEB Manual for Cities: Ecosystem Ser-vices in Urban Management—TEEB. 2011. Available online: http://www.teebweb.org/publication/teeb-manual-for-cities-ecosystem-services-in-urban-management/ (accessed on 25 May 2020).
- Gómez-Baggethun, E.; Barton, D.N. Classifying and valuing ecosystem services for urban planning. Ecol. Econ. 2013, 86, 235–245. [Google Scholar] [CrossRef]
- Millennium Ecosystem Assessment. Ecosystems and Human Well-Being: Synthesis; Island Press: Washington, DC, USA, 2005. [Google Scholar]
- TEEB. The Economics of Ecosystems and Biodiversity Ecological and Economic Foundations; Kumar, P., Ed.; Earthscan: London, UK; Washington, DC, USA, 2010. [Google Scholar]
- Maes, J.; Liquete, C.; Teller, A.; Erhard, M.; Paracchini, M.L.; Barredo, J.I.; Grizzetti, B.; Cardoso, A.; Somma, F.; Petersen, J.-E.; et al. An indicator framework for assessing ecosystem services in support of the EU Biodiversity Strategy to 2020. Ecosyst. Serv. 2016, 17, 14–23. [Google Scholar] [CrossRef]
- Haines-Young, R.; Potschin, M. Common International Classification of Ecosystem Services (CICES) V5.1 Guidance on the Application of the Revised Structure. 2018. Available online: www.cices.eu (accessed on 25 May 2020).
- Persson, G.; Wikberger, C.; Amorim, J.H. Klimatanpassa Nordiska Städer Med Grön Infrastruktur. 2018. Available online: http://smhi.diva-portal.org/smash/get/diva2:1272429/FULLTEXT01.pdf (accessed on 25 May 2020).
- Hoegh-Guldberg, O.; Jacob, D.; Taylor, M.; Bindi, M.; Brown, S.; Camilloni, I.; Diedhiou, A.; Djalante, R.; Ebi, K.; Engelbrecht, F.; et al. Impacts of 1.5 °C Global Warming on Natural and Human Systems. In Global Warming of 1.5 °C. An IPCC Special Report on the Impacts of Global Warming of 1.5°C above Pre-Industrial Levels and Related Global Greenhouse Gas Emission Pathways, in the Context of Strengthening the Global Response to the Threat of Climate Change, Sustainable Development, and Efforts to Eradicate Poverty; 2018; pp. 175–311. Available online: https://www.ipcc.ch/site/assets/uploads/sites/2/2019/06/SR15_Chapter3_Low_Res.pdf (accessed on 25 May 2020).
- Li, D.; Bou-Zeid, E. Synergistic Interactions between Urban Heat Islands and Heat Waves: The Impact in Cities Is Larger than the Sum of Its Parts. J. Appl. Meteorol. Clim. 2013, 52, 2051–2064. [Google Scholar] [CrossRef]
- Oke, T.; Mills, G.; Christen, A.; Voogt, J. Urban Climates; Cambridge University Press: Cambridge, UK, 2017. [Google Scholar]
- Moore, M.; Gould, P.; Keary, B.S. Global urbanization and impact on health. Int. J. Hyg. Environ. Health 2003, 206, 269–278. [Google Scholar] [CrossRef] [PubMed]
- Amorim, J.; Rodrigues, V.; Tavares, R.; Valente, J.; Borrego, C. CFD modelling of the aerodynamic effect of trees on urban air pollution dispersion. Sci. Total Environ. 2013, 461–462, 541–551. [Google Scholar] [CrossRef] [PubMed]
- Andersson-Sköld, Y.; Klingberg, J.; Gunnarsson, B.; Cullinane, K.; Gustafsson, I.; Hedblom, M.; Knez, I.; Lindberg, F.; Sang, Å.O.; Pleijel, H.; et al. A framework for assessing urban greenery’s effects and valuing its ecosystem services. J. Environ. Manag. 2018, 205, 274–285. [Google Scholar] [CrossRef] [PubMed]
- Vesala, T.; Järvi, L.; Launiainen, S.; Sogachev, A.; Rannik, Ü.; Mammarella, I.; Ivola, E.S.; Keronen, P.; Rinne, J.; Riikonen, A.; et al. Surface–atmosphere interactions over complex urban terrain in Helsinki, Finland. Tellus B Chem. Phys. Meteorol. 2008, 60, 188–199. [Google Scholar] [CrossRef]
- Järvi, L.; Nordbo, A.; Junninen, H.; Riikonen, A.; Moilanen, J.; Nikinmaa, E.; Vesala, T. Seasonal and annual variation of carbon dioxide surface fluxes in Helsinki, Finland, in 2006–2010. Atmos. Chem. Phys. Discuss. 2012, 12, 8475–8489. [Google Scholar] [CrossRef]
- Nordbo, A.; Järvi, L.; Haapanala, S.; Wood, C.R.; Vesala, T. Fraction of natural area as main predictor of net CO2 emissions from cities. Geophys. Res. Lett. 2012, 39. [Google Scholar] [CrossRef]
- Larondelle, N.; Haase, D.; Kabisch, N. Mapping the diversity of regulating ecosystem services in European cities. Glob. Environ. Chang. 2014, 26, 119–129. [Google Scholar] [CrossRef]
- Baró, F.; Haase, D.; Gomez-Baggethun, E.; Frantzeskaki, N. Mismatches between ecosystem services supply and demand in urban areas: A quantitative assessment in five European cities. Ecol. Indic. 2015, 55, 146–158. [Google Scholar] [CrossRef]
- Kuittinen, M.; Moinel, C.; Adalgeirsdottir, K. Carbon sequestration through urban ecosystem services. Sci. Total Environ. 2016, 623–632. [Google Scholar] [CrossRef]
- Konarska, J.; Uddling, J.; Holmer, B.; Lutz, M.; Lindberg, F.; Pleijel, H.; Thorsson, S. Transpiration of urban trees and its cooling effect in a high latitude city. Int. J. Biometeorol. 2016, 60, 159–172. [Google Scholar] [CrossRef]
- Konarska, J.; Holmer, B.; Lindberg, F.; Thorsson, S. Influence of vegetation and building geometry on the spatial variations of air temperature and cooling rates in a high-latitude city. Int. J. Climatol. 2015, 36, 2379–2395. [Google Scholar] [CrossRef]
- Bowler, D.E.; Buyung-Ali, L.; Knight, T.M.; Pullin, A.S. Urban greening to cool towns and cities: A systematic review of the empirical evidence. Landsc. Urban Plan. 2010, 97, 147–155. [Google Scholar] [CrossRef]
- Konarska, J.; Lindberg, F.; Larsson, A.; Thorsson, S.; Holmer, B. Transmissivity of solar radiation through crowns of single urban trees—application for outdoor thermal comfort modelling. Theor. Appl. Climatol. 2014, 117, 363–376. [Google Scholar] [CrossRef]
- Lindberg, F.; Grimmond, S. The influence of vegetation and building morphology on shadow patterns and mean radiant temperatures in urban areas: Model development and evaluation. Theor. Appl. Climatol. 2011, 105, 311–323. [Google Scholar] [CrossRef]
- Lindberg, F.; Holmer, B.; Thorsson, S.; Rayner, D. Characteristics of the mean radiant temperature in high latitude cities—implications for sensitive climate planning applications. Int. J. Biometeorol. 2014, 58, 613–627. [Google Scholar] [CrossRef] [PubMed]
- Lindberg, F.; Thorsson, S.; Rayner, D.; Lau, K. The impact of urban planning strategies on heat stress in a climate-change perspective. Sustain. Cities Soc. 2016, 25, 1–12. [Google Scholar] [CrossRef]
- Lindberg, F.; Onomura, S.; Grimmond, C.S.B. Influence of ground surface characteristics on the mean radiant temperature in urban areas. Int. J. Biometeorol. 2016, 60, 1439–1452. [Google Scholar] [CrossRef]
- Thorsson, S.; Rayner, D.; Lindberg, F.; Monteiro, A.; Katzschner, L.; Lau, K.K.-L.; Campe, S.; Katzschner, A.; Konarska, J.; Onomura, S.; et al. Present and projected future mean radiant temperature for three European cities. Int. J. Biometeorol. 2017, 61, 1531–1543. [Google Scholar] [CrossRef]
- Hvilshoj, S.; Lund, A.A.; Goring, N.H.M.; Lv, C. Copenhagen cloudburst concretization plan, Den-mark. Landsc. Archit. Front. 2016, 4, 54–67. Available online: http://journal.hep.com.cn/laf/EN/abstract/abstract18403.shtml (accessed on 26 May 2020).
- Zhou, Q.; Panduro, T.E.; Thorsen, B.J.; Arnbjerg-Nielsen, K. Adaption to Extreme Rainfall with Open Urban Drainage System: An Integrated Hydrological Cost-Benefit Analysis. Environ. Manag. 2013, 51, 586–601. [Google Scholar] [CrossRef]
- Silvennoinen, S.; Taka, M.; Yli-Pelkonen, V.; Koivusalo, H.; Ollikainen, M.; Setälä, H. Monetary value of urban green space as an ecosystem service provider: A case study of urban runoff management in Finland. Ecosyst. Serv. 2017, 28, 17–27. [Google Scholar] [CrossRef]
- Haghighatafshar, S.; Nordlöf, B.; Roldin, M.; Gustafsson, L.-G.; Jansen, J.L.C.; Jönsson, K. Efficiency of blue-green stormwater retrofits for flood mitigation—Conclusions drawn from a case study in Malmö, Sweden. J. Environ. Manag. 2018, 207, 60–69. [Google Scholar] [CrossRef] [PubMed]
- Fryd, O.; Backhaus, A.; Birch, H.; Fratini, C.F.; Ingvertsen, S.T.; Jeppesen, J.; Panduro, T.E.; Roldin, M.; Jensen, M.B. Water sensitive urban design retrofits in Copenhagen—40% to the sewer, 60% to the city. Water Sci. Technol. 2013, 67, 1945–1952. [Google Scholar] [CrossRef] [PubMed]
- Liu, L.; Jensen, M.B. Climate resilience strategies of Beijing and Copenhagen and their links to sustainability. Hydrol. Res. 2017, 19, 997–1013. [Google Scholar] [CrossRef]
- Riikonen, A.; Järvi, L.; Nikinmaa, E. Environmental and crown related factors affecting street tree transpiration in Helsinki, Finland. Urban Ecosyst. 2016, 19, 1693–1715. [Google Scholar] [CrossRef]
- Locatelli, L.; Mark, O.; Mikkelsen, P.S.; Arnbjerg-Nielsen, K.; Jensen, M.B.; Binning, P.J. Modelling of green roof hydrological performance for urban drainage applications. J. Hydrol. 2014, 519, 3237–3248. [Google Scholar] [CrossRef]
- Johannessen, B.G.; Hanslin, H.M.; Muthanna, T.M. Green roof performance potential in cold and wet regions. Ecol. Eng. 2017, 106, 436–447. [Google Scholar] [CrossRef]
- Setälä, H.; Viippola, V.; Rantalainen, A.-L.; Pennanen, A.; Yli-Pelkonen, V. Does urban vegetation mitigate air pollution in northern conditions? Environ. Pollut. 2013, 183, 104–112. [Google Scholar] [CrossRef]
- Viippola, V.; Rantalainen, A.-L.; Yli-Pelkonen, V.; Tervo, P.; Setälä, H. Gaseous polycyclic aromatic hydrocarbon concentrations are higher in urban forests than adjacent open areas during summer but not in winter—Exploratory study. Environ. Pollut. 2016, 208, 233–240. [Google Scholar] [CrossRef]
- Yli-Pelkonen, V.; Setälä, H.; Viippola, V. Urban forests near roads do not reduce gaseous air pollutant concentrations but have an impact on particles levels. Landsc. Urban Plan. 2017, 158, 39–47. [Google Scholar] [CrossRef]
- Yli-Pelkonen, V.; Viippola, V.; Kotze, D.J.; Setälä, H. Greenbelts do not reduce NO 2 concentrations in near-road environments. Urban Clim. 2017, 21, 306–317. [Google Scholar] [CrossRef]
- Klingberg, J.; Broberg, M.; Strandberg, B.; Thorsson, P.; Pleijel, H. Influence of urban vegetation on air pollution and noise exposure—A case study in Gothenburg, Sweden. Sci. Total Environ. 2017, 1728–1739. [Google Scholar] [CrossRef] [PubMed]
- Grundström, M.; Pleijel, H. Limited effect of urban tree vegetation on NO2 and O3 concentrations near a traffic route. Environ. Pollut. 2014, 189, 73–76. [Google Scholar] [CrossRef] [PubMed]
- Sæbø, A.; Popek, R.; Nawrot, B.; Hanslin, H.; Gawronska, H.; Gawronski, S. Plant species differences in particulate matter accumulation on leaf surfaces. Sci. Total Environ. 2012, 427, 347–354. [Google Scholar] [CrossRef]
- Mori, J.; Hanslin, H.M.; Burchi, G.; Przybysz, A. Particulate matter and element accumulation on coniferous trees at different distances from a highway. Urban For. Urban Green. 2015, 14, 170–177. [Google Scholar] [CrossRef]
- Bodin, T.; Björk, J.; Ardö, J.; Albin, M. Annoyance, Sleep and Concentration Problems due to Combined Traffic Noise and the Benefit of Quiet Side. Int. J. Environ. Res. Public Health 2015, 12, 1612–1628. [Google Scholar] [CrossRef]
- Lanki, T.; Siponen, T.; Ojala, A.; Korpela, K.; Pennanen, A.; Tiittanen, P.; Tsunetsugu, Y.; Kagawa, T.; Tyrväinen, L. Acute effects of visits to urban green environments on cardiovascular physiology in women: A field experiment. Environ. Res. 2017, 159, 176–185. [Google Scholar] [CrossRef]
- Sang, Å.O.; Knez, I.; Gunnarsson, B.; Hedblom, M. The effects of naturalness, gender, and age on how urban green space is perceived and used. Urban For. Urban Green. 2016, 18, 268–276. [Google Scholar] [CrossRef]
- Bosch, M.A.V.D.; Östergren, P.-O.; Grahn, P.; Skärbäck, E.; Währborg, P. Moving to Serene Nature May Prevent Poor Mental Health—Results from a Swedish Longitudinal Cohort Study. Int. J. Environ. Res. Public Health 2015, 12, 7974–7989. [Google Scholar] [CrossRef]
- Caspersen, O.H.; Olafsson, A.S. Recreational mapping and planning for enlargement of the green structure in greater Copenhagen. Urban For. Urban Green. 2010, 9, 101–112. [Google Scholar] [CrossRef]
- Wahlgren, L.; Schantz, P. Exploring bikeability in a metropolitan setting: Stimulating and hindering factors in commuting route environments. BMC Public Health 2012, 12, 168. [Google Scholar] [CrossRef] [PubMed]
- Evensen, K.H.; Raanaas, R.K.; Fyhri, A. Soundscape and perceived suitability for recreation in an urban designated quiet zone. Urban For. Urban Green. 2016, 20, 243–248. [Google Scholar] [CrossRef]
- Nordh, H.; Østby, K. Pocket parks for people—A study of park design and use. Urban For. Urban Green. 2013, 12, 12–17. [Google Scholar] [CrossRef]
- Peschardt, K.K.; Stigsdotter, U.K.; Schipperijn, J. Identifying Features of Pocket Parks that May Be Related to Health Promoting Use. Landsc. Res. 2016, 41, 79–94. [Google Scholar] [CrossRef]
- Schipperijn, J.; Cerin, E.; Adams, M.A.; Reis, R.; Smith, G.; Cain, K.; Christiansen, L.B.; Van Dyck, D.; Gidlow, C.; Frank, L.D.; et al. Access to parks and physical activity: An eight country comparison. Urban For. Urban Green. 2017, 27, 253–263. [Google Scholar] [CrossRef]
- Schipperijn, J.; Ekholm, O.; Stigsdotter, U.K.; Toftager, M.; Bentsen, P.; Kamper-Jørgensen, F.; Randrup, T.B. Factors influencing the use of green space: Results from a Danish national representative survey. Landsc. Urban Plan. 2010, 95, 130–137. [Google Scholar] [CrossRef]
- Schipperijn, J.; Stigsdotter, U.K.; Randrup, T.B.; Troelsen, J. Influences on the use of urban green space—A case study in Odense, Denmark. Urban For. Urban Green. 2010, 9, 25–32. [Google Scholar] [CrossRef]
- Bijker, R.A.; Sijtsma, F.J. A portfolio of natural places: Using a participatory GIS tool to compare the appreciation and use of green spaces inside and outside urban areas by urban residents. Landsc. Urban Plan. 2017, 158, 155–165. [Google Scholar] [CrossRef]
- Samuelsson, K.; Giusti, M.; Peterson, G.D.; Legeby, A.; Brandt, S.A.; Barthel, S. Impact of environment on people’s everyday experiences in Stockholm. Landsc. Urban Plan. 2018, 171, 7–17. [Google Scholar] [CrossRef]
- Bosch, M.A.V.D.; Mudu, P.; Uscila, V.; Barrdahl, M.; Kulinkina, A.; Staatsen, B.; Swart, W.; Kruize, H.; Zurlyte, I.; Egorov, A.I. Development of an urban green space indicator and the public health rationale. Scand. J. Public Health 2015, 44, 159–167. [Google Scholar] [CrossRef]
- Ekkel, E.D.; De Vries, S. Nearby green space and human health: Evaluating accessibility metrics. Landsc. Urban Plan. 2017, 157, 214–220. [Google Scholar] [CrossRef]
- Schipperijn, J.; Bentsen, P.; Troelsen, J.; Toftager, M.; Stigsdotter, U.K. Associations between physical activity and characteristics of urban green space. Urban For. Urban Green. 2013, 12, 109–116. [Google Scholar] [CrossRef]
- Nordh, H.; Hartig, T.; Hagerhall, C.; Fry, G. Components of small urban parks that predict the possibility for restoration. Urban For. Urban Green. 2009, 8, 225–235. [Google Scholar] [CrossRef]
- Nordh, H.; Alalouch, C.; Hartig, T. Assessing restorative components of small urban parks using conjoint methodology. Urban For. Urban Green. 2011, 10, 95–103. [Google Scholar] [CrossRef]
- Peschardt, K.K.; Schipperijn, J.; Stigsdotter, U.K. Use of Small Public Urban Green Spaces (SPUGS). Urban For. Urban Green. 2012, 11, 235–244. [Google Scholar] [CrossRef]
- Mesimäki, M.; Hauru, K.; Kotze, D.J.; Lehvävirta, S. Neo-spaces for urban livability? Urbanites’ versatile mental images of green roofs in the Helsinki metropolitan area, Finland. Land Use Policy 2017, 61, 587–600. [Google Scholar] [CrossRef]
- Benedict, M.A.; MacMahon, E.T. Green infrastructure: Smart conservation for the 21st century. Renew. Resour. J. 2002, 20, 12–17. [Google Scholar]
- Niemelä, J.; Saarela, S.-R.; Söderman, T.; Kopperoinen, L.; Yli-Pelkonen, V.; Väre, S.; Kotze, D.J. Using the ecosystem services approach for better planning and conservation of urban green spaces: A Finland case study. Biodivers. Conserv. 2010, 19, 3225–3243. [Google Scholar] [CrossRef]
- Beery, T.H.; Raymond, C.M.; Kyttä, M.; Olafsson, A.S.; Plieninger, T.; Sandberg, M.; Stenseke, M.; Tengö, M.; Ingemar, J.K. Fostering incidental experiences of nature through green infrastructure planning. Ambio 2017, 46, 717–730. [Google Scholar] [CrossRef]
- Adams, M.A.; Frank, L.D.; Schipperijn, J.; Smith, G.R.; Chapman, J.E.; Christiansen, L.B.; Coffee, N.T.; Salvo, D.; Du Toit, L.; Dygrýn, J.; et al. International variation in neighborhood walkability, transit, and recreation environments using geographic information systems: The IPEN adult study. Int. J. Health Geogr. 2014, 13, 43. [Google Scholar] [CrossRef] [PubMed]
- Kyttä, M.; Kahila, M.; Broberg, A. Perceived environmental quality as an input to urban infill policy-making. Urban Des. Int. 2010, 16, 19–35. [Google Scholar] [CrossRef]
- Snizek, B.; Nielsen, T.A.S.; Skov-Petersen, H. Mapping bicyclists’ experiences in Copenhagen. J. Transp. Geogr. 2013, 30, 227–233. [Google Scholar] [CrossRef]
- Daams, M.N.; Veneri, P. Living Near to Attractive Nature? A Well-Being Indicator for Ranking Dutch, Danish, and German Functional Urban Areas. Soc. Indic. Res. 2017, 133, 501–526. [Google Scholar] [CrossRef]
- Calogiuri, G. Natural Environments and Childhood Experiences Promoting Physical Activity, Examining the Mediational Effects of Feelings about Nature and Social Networks. Int. J. Environ. Res. Public Health 2016, 13, 439. [Google Scholar] [CrossRef] [PubMed]
- Thomas, F. The role of natural environments within women’s everyday health and wellbeing in Copenhagen, Denmark. Health Place 2015, 35, 187–195. [Google Scholar] [CrossRef]
- Mäki-Opas, T.; Borodulin, K.; Valkeinen, H.; Stenholm, S.; Kunst, A.E.; Abel, T.; Härkänen, T.; Kopperoinen, L.; Itkonen, P.; Prättälä, R.; et al. The contribution of travel-related urban zones, cycling and pedestrian networks and green space to commuting physical activity among adults—A cross-sectional population-based study using geographical information systems. BMC Public Health 2016, 16, 760. [Google Scholar] [CrossRef]
- Grahn, P.; Stigsdotter, U.K. The relation between perceived sensory dimensions of urban green space and stress restoration. Landsc. Urban Plan. 2010, 94, 264–275. [Google Scholar] [CrossRef]
- Cerwén, G.; Pedersen, E.; Pálsdóttir, A.M. The Role of Soundscape in Nature-Based Rehabilitation: A Patient Perspective. Int. J. Environ. Res. Public Health 2016, 13, 1229. [Google Scholar] [CrossRef]
- Gunnarsson, B.; Knez, I.; Hedblom, M.; Sang, Å.O. Effects of biodiversity and environment-related attitude on perception of urban green space. Urban Ecosyst. 2017, 20, 37–49. [Google Scholar] [CrossRef]
- Tammi, I.; Mustajärvi, K.; Rasinmäki, J. Integrating spatial valuation of ecosystem services into regional planning and development. Ecosyst. Serv. 2017, 26, 329–344. [Google Scholar] [CrossRef]
- Nikodinoska, N.; Paletto, A.; Pastorella, F.; Granvik, M.; Franzese, P.P. Assessing, valuing and mapping ecosystem services at city level: The case of Uppsala (Sweden). Ecol. Model. 2018, 368, 411–424. [Google Scholar] [CrossRef]
- Hedblom, M.; Knez, I.; Sang, Å.O.; Gunnarsson, B. Evaluation of natural sounds in urban greenery: Potential impact for urban nature preservation. R. Soc. Open Sci. 2017, 4, 170037. [Google Scholar] [CrossRef] [PubMed]
- Pasanen, T.P.; Tyrväinen, L.; Korpela, K.M. The Relationship between Perceived Health and Physical Activity Indoors, Outdoors in Built Environments, and Outdoors in Nature. Appl. Psychol. Health Well-Being 2014, 6, 324–346. [Google Scholar] [CrossRef] [PubMed]
- Adevi, A.A.; Mårtensson, F. Stress rehabilitation through garden therapy: The garden as a place in the recovery from stress. Urban For. Urban Green. 2013, 12, 230–237. [Google Scholar] [CrossRef]
- Artmann, M.; Chen, X.; Iojă, C.; Hof, A.; Onose, D.; Poniży, L.; Lamovšek, A.Z.; Breuste, J. The role of urban green spaces in care facilities for elderly people across European cities. Urban For. Urban Green. 2017, 27, 203–213. [Google Scholar] [CrossRef]
- Lindal, P.J.; Hartig, T. Effects of urban street vegetation on judgments of restoration likelihood. Urban For. Urban Green. 2015, 14, 200–209. [Google Scholar] [CrossRef]
- Staats, H.; Jahncke, H.; Herzog, T.R.; Hartig, T. Urban Options for Psychological Restoration: Common Strategies in Everyday Situations. PLoS ONE 2016, 11, e0146213. [Google Scholar] [CrossRef]
- Korpela, K.; Ylén, M.; Tyrväinen, L.; Silvennoinen, H. Favorite green, waterside and urban environments, restorative experiences and perceived health in Finland. Health Promot. Int. 2010, 25, 200–209. [Google Scholar] [CrossRef]
- Tyrväinen, L.; Ojala, A.; Korpela, K.; Lanki, T.; Tsunetsugu, Y.; Kagawa, T. The influence of urban green environments on stress relief measures: A field experiment. J. Environ. Psychol. 2014, 38, 1–9. [Google Scholar] [CrossRef]
- Halonen, J.I.; Kivimäki, M.; Pentti, J.; Stenholm, S.; Kawachi, I.; Subramanian, S.; Vahtera, J. Green and blue areas as predictors of overweight and obesity in an 8-year follow-up study. Obesity 2014, 22, 1910–1917. [Google Scholar] [CrossRef]
- Skjøth, C.; Sommer, J.; Brandt, J.; Hvidberg, M.; Geels, C.; Hansen, K.M.; Hertel, O.; Frohn, L.M.; Christensen, J.H. Copenhagen—a significant source of birch (Betula) pollen? Int. J. Biometeorol. 2008, 52, 453–462. [Google Scholar] [CrossRef]
- Skjøth, C.; Ørby, P.V.; Becker, T.; Geels, C.; Schlünssen, V.; Sigsgaard, T.; Bønløkke, J.H.; Sommer, J.; Søgaard, P.; Hertel, O. Identifying urban sources as cause of elevated grass pollen concentrations using GIS and remote sensing. Biogeosciences 2013, 10, 541–554. [Google Scholar] [CrossRef]
- Hjort, J.; Hugg, T.T.; Antikainen, H.; Rusanen, J.; Sofiev, M.; Kukkonen, J.; Jaakkola, J.J.; Jaakkola, J.J. Fine-Scale Exposure to Allergenic Pollen in the Urban Environment: Evaluation of Land Use Regression Approach. Environ. Health Perspect. 2016, 124, 619–626. [Google Scholar] [CrossRef]
- Fuertes, E.; Markevych, I.; Bowatte, G.; Gruzieva, O.; Gehring, U.; Becker, A.; Berdel, D.; Von Berg, A.; Bergström, A.; Brauer, M.; et al. Residential greenness is differentially associated with childhood allergic rhinitis and aeroallergen sensitization in seven birth cohorts. Allergy 2016, 71, 1461–1471. [Google Scholar] [CrossRef]
- Ruokolainen, L.; Von Hertzen, L.C.; Fyhrquist, N.; Laatikainen, T.J.; Lehtomäki, J.; Auvinen, P.; Karvonen, A.M.; Hyvärinen, A.M.; Tillmann, V.; Niemelä, O.; et al. Green areas around homes reduce atopic sensitization in children. Allergy 2015, 70, 195–202. [Google Scholar] [CrossRef]
- Berndtsson, J.C.; Bengtsson, L.; Jinno, K. Runoff water quality from intensive and extensive vegetated roofs. Ecol. Eng. 2009, 35, 369–380. [Google Scholar] [CrossRef]
- Kuoppamäki, K.; Lehvävirta, S. Mitigating nutrient leaching from green roofs with biochar. Landsc. Urban Plan. 2016, 152, 39–48. [Google Scholar] [CrossRef]
- Riikonen, A.; Pumpanen, J.; Mäki, M.; Nikinmaa, E. High carbon losses from established growing sites delay the carbon sequestration benefits of street tree plantings—A case study in Helsinki, Finland. Urban For. Urban Green. 2017, 26, 85–94. [Google Scholar] [CrossRef]
- Järvi, L.; Nordbo, A.; Rannik, Ü.; Haapanala, S.; Mammarella, I.; Pihlatie, M.; Vesala, T.; Riikonen, A. Urban nitrous-oxide fluxes measured using the eddy-covariance technique in Helsinki, Finland. Boreal Environ. Res. 2014, 19, 108–121. [Google Scholar]
- Hallquist, M.; Wenger, J.C.; Baltensperger, U.; Rudich, Y.; Simpson, D.; Claeys, M.; Dommen, J.; Donahue, N.M.; George, C.; Goldstein, A.H.; et al. The formation, properties and impact of secondary organic aerosol: Current and emerging issues. Atmos. Chem. Phys. 2009, 9, 5155–5236. [Google Scholar] [CrossRef]
- Viippola, V.; Whitlow, T.H.; Zhao, W.; Yli-Pelkonen, V.; Mikola, J.; Pouyat, R.; Setälä, H. The effects of trees on air pollutant levels in peri-urban near-road environments. Urban For. Urban Green. 2018, 30, 62–71. [Google Scholar] [CrossRef]
- Netatmo Weathermap. Available online: https://weathermap.netatmo.com/ (accessed on 8 July 2020).
- WeatherObservationsWebsite (WOW). Available online: https://wow.metoffice.gov.uk/ (accessed on 8 July 2020).
- Temperatur.nu. Available online: https://temperatur.nu (accessed on 7 August 2020).
- Hjort, J.; Suomi, J.; Käyhkö, J. Spatial prediction of urban–rural temperatures using statistical methods. Theor. Appl. Clim. 2011, 106, 139–152. [Google Scholar] [CrossRef]
- Karsisto, P.; Fortelius, C.; Demuzere, M.; Grimmond, C.S.B.; Oleson, K.W.; Kouznetsov, R.; Masson, V.; Järvi, L. Seasonal surface urban energy balance and wintertime stability simulated using three land-surface models in the high-latitude city Helsinki. Q. J. R. Meteorol. Soc. 2015, 142, 401–417. [Google Scholar] [CrossRef]
- Knez, I.; Thorsson, S. Thermal, emotional and perceptual evaluations of a park: Cross-cultural and environmental attitude comparisons. Build. Environ. 2008, 43, 1483–1490. [Google Scholar] [CrossRef]
- Koppen, G.; Sang, Å.O.; Tveit, M.S. Managing the potential for outdoor recreation: Adequate mapping and measuring of accessibility to urban recreational landscapes. Urban For. Urban Green. 2014, 13, 71–83. [Google Scholar] [CrossRef]
- Kain, J.-H.; Larondelle, N.; Haase, D.; Kaczorowska, A. Exploring local consequences of two land-use alternatives for the supply of urban ecosystem services in Stockholm year 2050. Ecol. Indic. 2016, 70, 615–629. [Google Scholar] [CrossRef]
- Peschardt, K.K.; Stigsdotter, U.K. Associations between park characteristics and perceived restorativeness of small public urban green spaces. Landsc. Urban Plan. 2013, 112, 26–39. [Google Scholar] [CrossRef]
- Hauru, K.; Lehvävirta, S.; Korpela, K.; Kotze, D.J. Closure of view to the urban matrix has positive effects on perceived restorativeness in urban forests in Helsinki, Finland. Landsc. Urban Plan. 2012, 107, 361–369. [Google Scholar] [CrossRef]
- Szumacher, I.; Pabjanek, P. Temporal Changes in Ecosystem Services in European Cities in the Continental Biogeographical Region in the Period from 1990–2012. Sustainable 2017, 9, 665. [Google Scholar] [CrossRef]


Publisher’s Note: MDPI stays neutral with regard to jurisdictional claims in published maps and institutional affiliations. |
© 2021 by the authors. Licensee MDPI, Basel, Switzerland. This article is an open access article distributed under the terms and conditions of the Creative Commons Attribution (CC BY) license (http://creativecommons.org/licenses/by/4.0/).
Share and Cite
Amorim, J.H.; Engardt, M.; Johansson, C.; Ribeiro, I.; Sannebro, M. Regulating and Cultural Ecosystem Services of Urban Green Infrastructure in the Nordic Countries: A Systematic Review. Int. J. Environ. Res. Public Health 2021, 18, 1219. https://doi.org/10.3390/ijerph18031219
Amorim JH, Engardt M, Johansson C, Ribeiro I, Sannebro M. Regulating and Cultural Ecosystem Services of Urban Green Infrastructure in the Nordic Countries: A Systematic Review. International Journal of Environmental Research and Public Health. 2021; 18(3):1219. https://doi.org/10.3390/ijerph18031219
Chicago/Turabian StyleAmorim, Jorge H., Magnuz Engardt, Christer Johansson, Isabel Ribeiro, and Magnus Sannebro. 2021. "Regulating and Cultural Ecosystem Services of Urban Green Infrastructure in the Nordic Countries: A Systematic Review" International Journal of Environmental Research and Public Health 18, no. 3: 1219. https://doi.org/10.3390/ijerph18031219
APA StyleAmorim, J. H., Engardt, M., Johansson, C., Ribeiro, I., & Sannebro, M. (2021). Regulating and Cultural Ecosystem Services of Urban Green Infrastructure in the Nordic Countries: A Systematic Review. International Journal of Environmental Research and Public Health, 18(3), 1219. https://doi.org/10.3390/ijerph18031219