Research on Spatiotemporal Differentiation and Influence Mechanism of Urban Resilience in China Based on MGWR Model
Abstract
1. Introduction
1.1. Literature Review
1.1.1. Origin and Evolution of Concepts
1.1.2. Evaluation Method and System
1.1.3. Development Strategy and Path
1.1.4. Summarize
2. Materials and Methods
2.1. Research Methods
2.1.1. Entropy Method
2.1.2. Exploratory Spatial Data Analysis (ESDA)
Global Spatial Autocorrelation Analysis
Local Spatial Autocorrelation Analysis
2.1.3. Multi-Scale Geographically Weighted Regression (MGWR)
2.2. Variable Selection
2.3. Data Sources
3. Results
3.1. Spatiotemporal Differentiation of China’s Urban Resilience
3.2. Temporal Differentiation
3.2.1. Overall Evaluation, Comprehensive Score and Subsystem Score
3.2.2. Convergence Analysis
3.2.3. Global Moran’s I
3.3. Spatial Differentiation
3.3.1. Overall Spatial Pattern
3.3.2. Hierarchical Structure Analysis
3.3.3. Local Moran’s I
3.4. Spatial Scale and Spatial Differentiation of Influencing Factors
Index Construction
3.5. Comparison of Models
3.6. Scale Analysis
3.7. Analysis of Coefficient Spatial Pattern
4. Discussion
4.1. Conclusions
- (1)
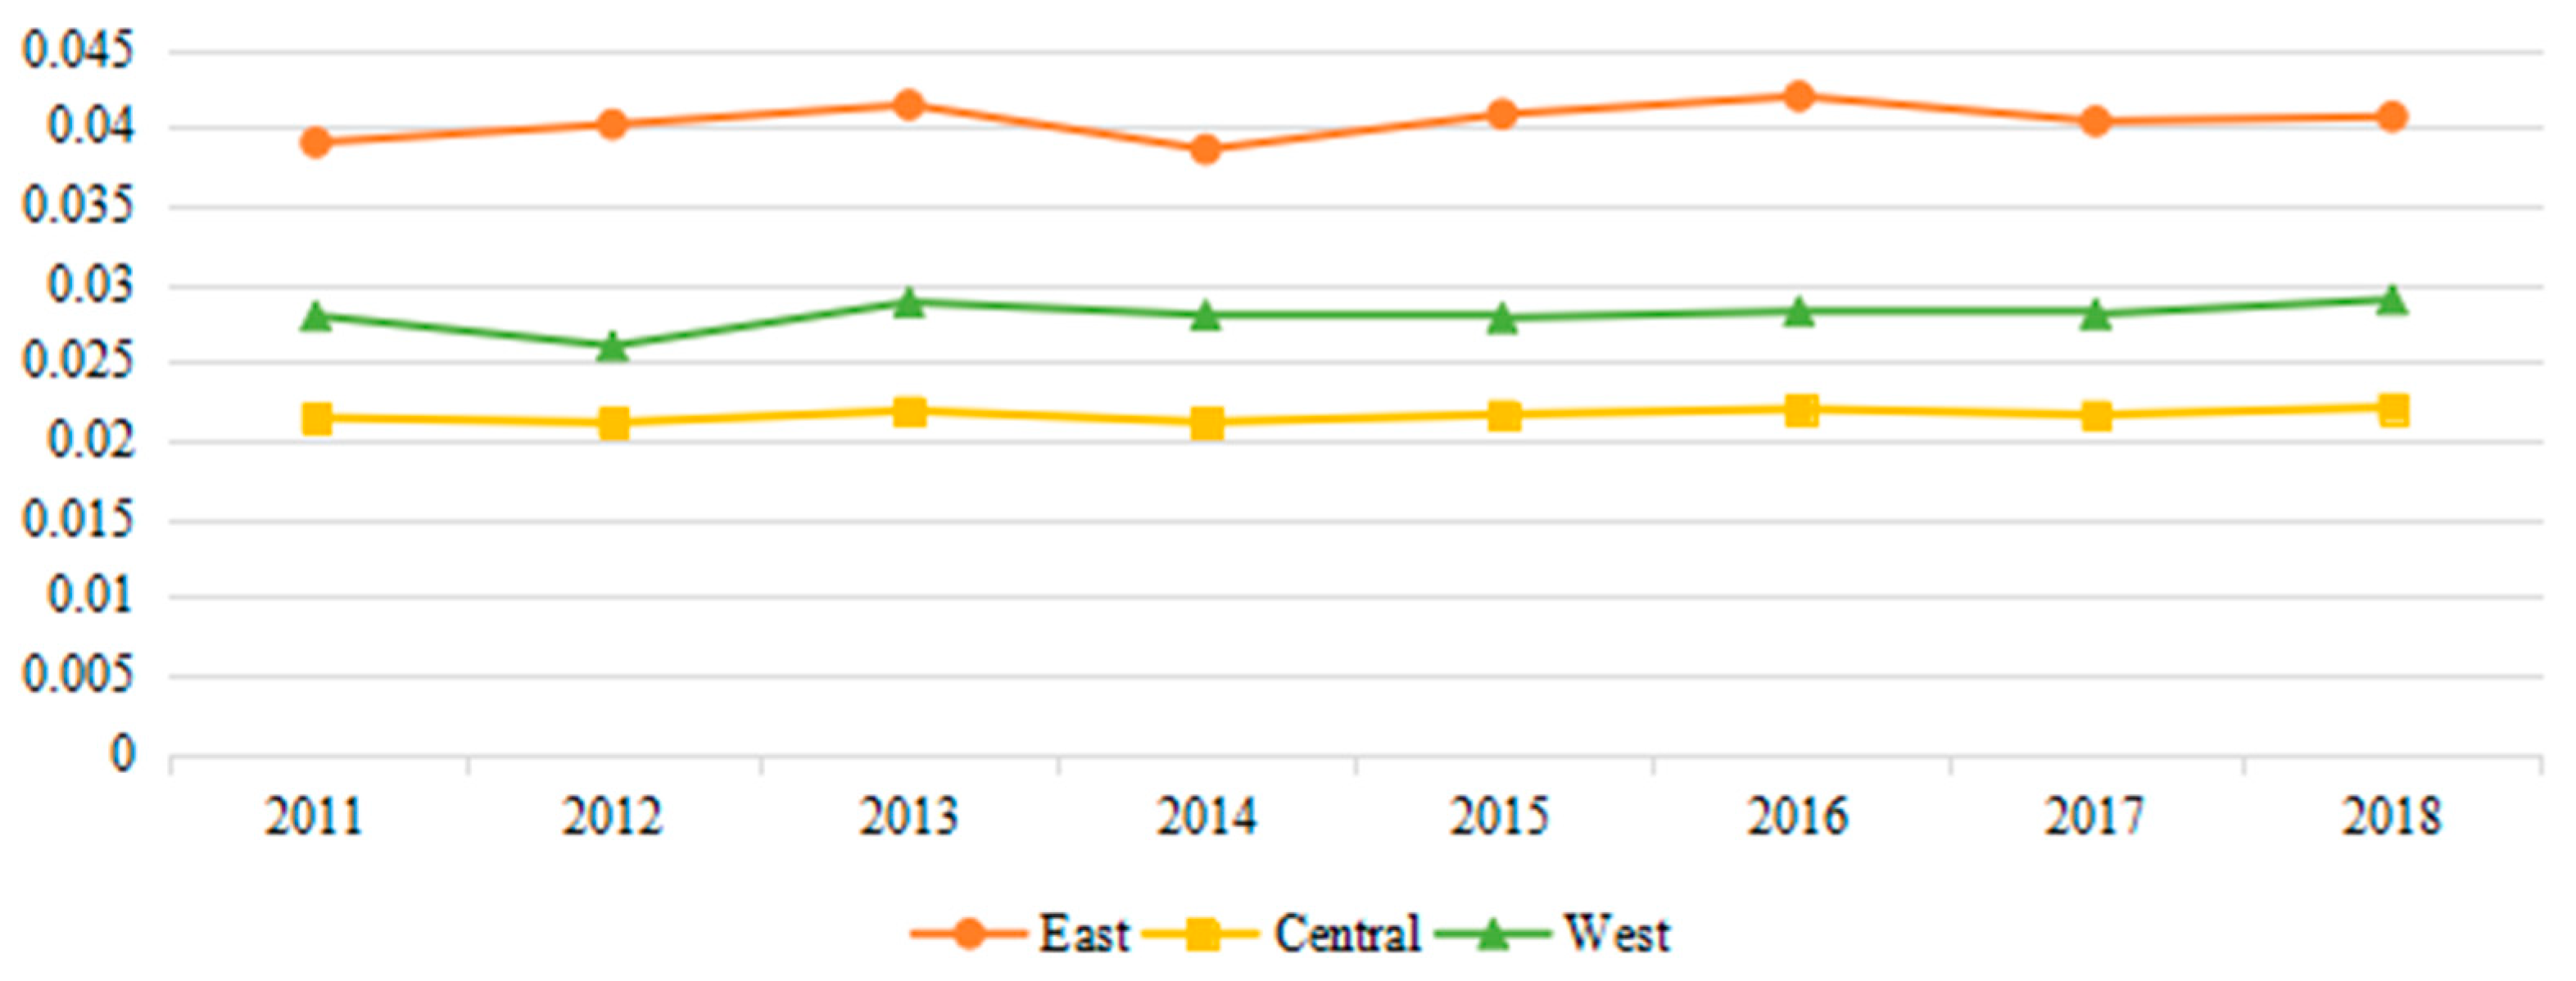
- From 2011 to 2018, the overall urban resilience and the sub-resilience have decreased to different degrees, and the sequence has changed significantly: economic resilience has gradually replaced the dominant position of engineering resilience. No significant α convergence occurred in China and some different regions, but it is noteworthy that the only convergence phenomenon occurred in the engineering resilience. In addition, the global Moran’s I show that the spatial agglomeration trend of China’s urban resilience has been continuously strengthened. In the subsystem, the spatial agglomeration degree of engineering resilience and the institutional resilience have decreased, while other subsystems have increased.
- (2)
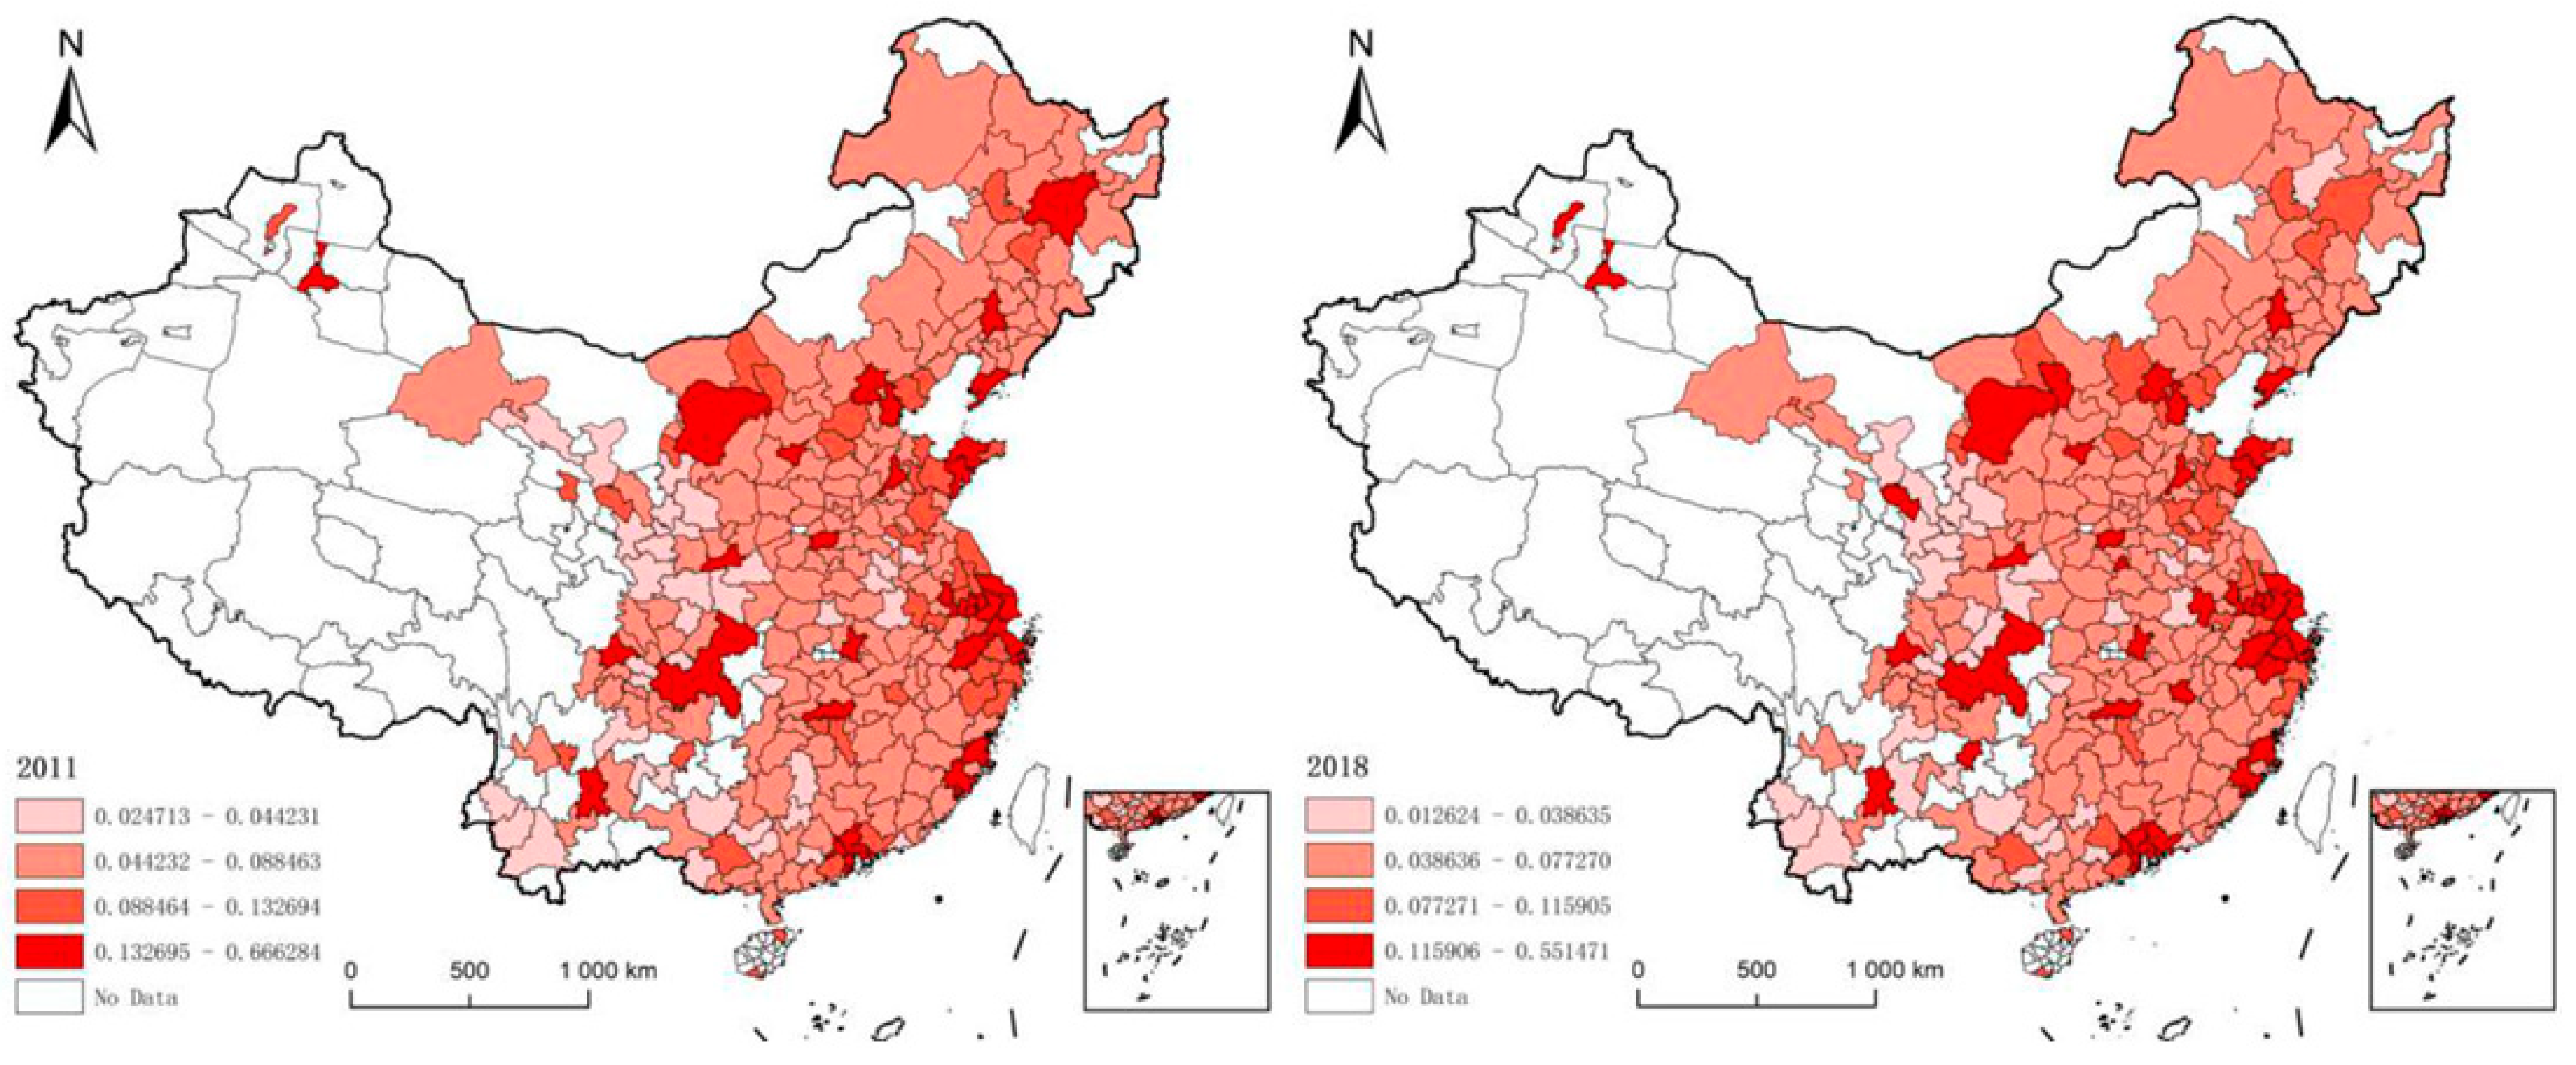
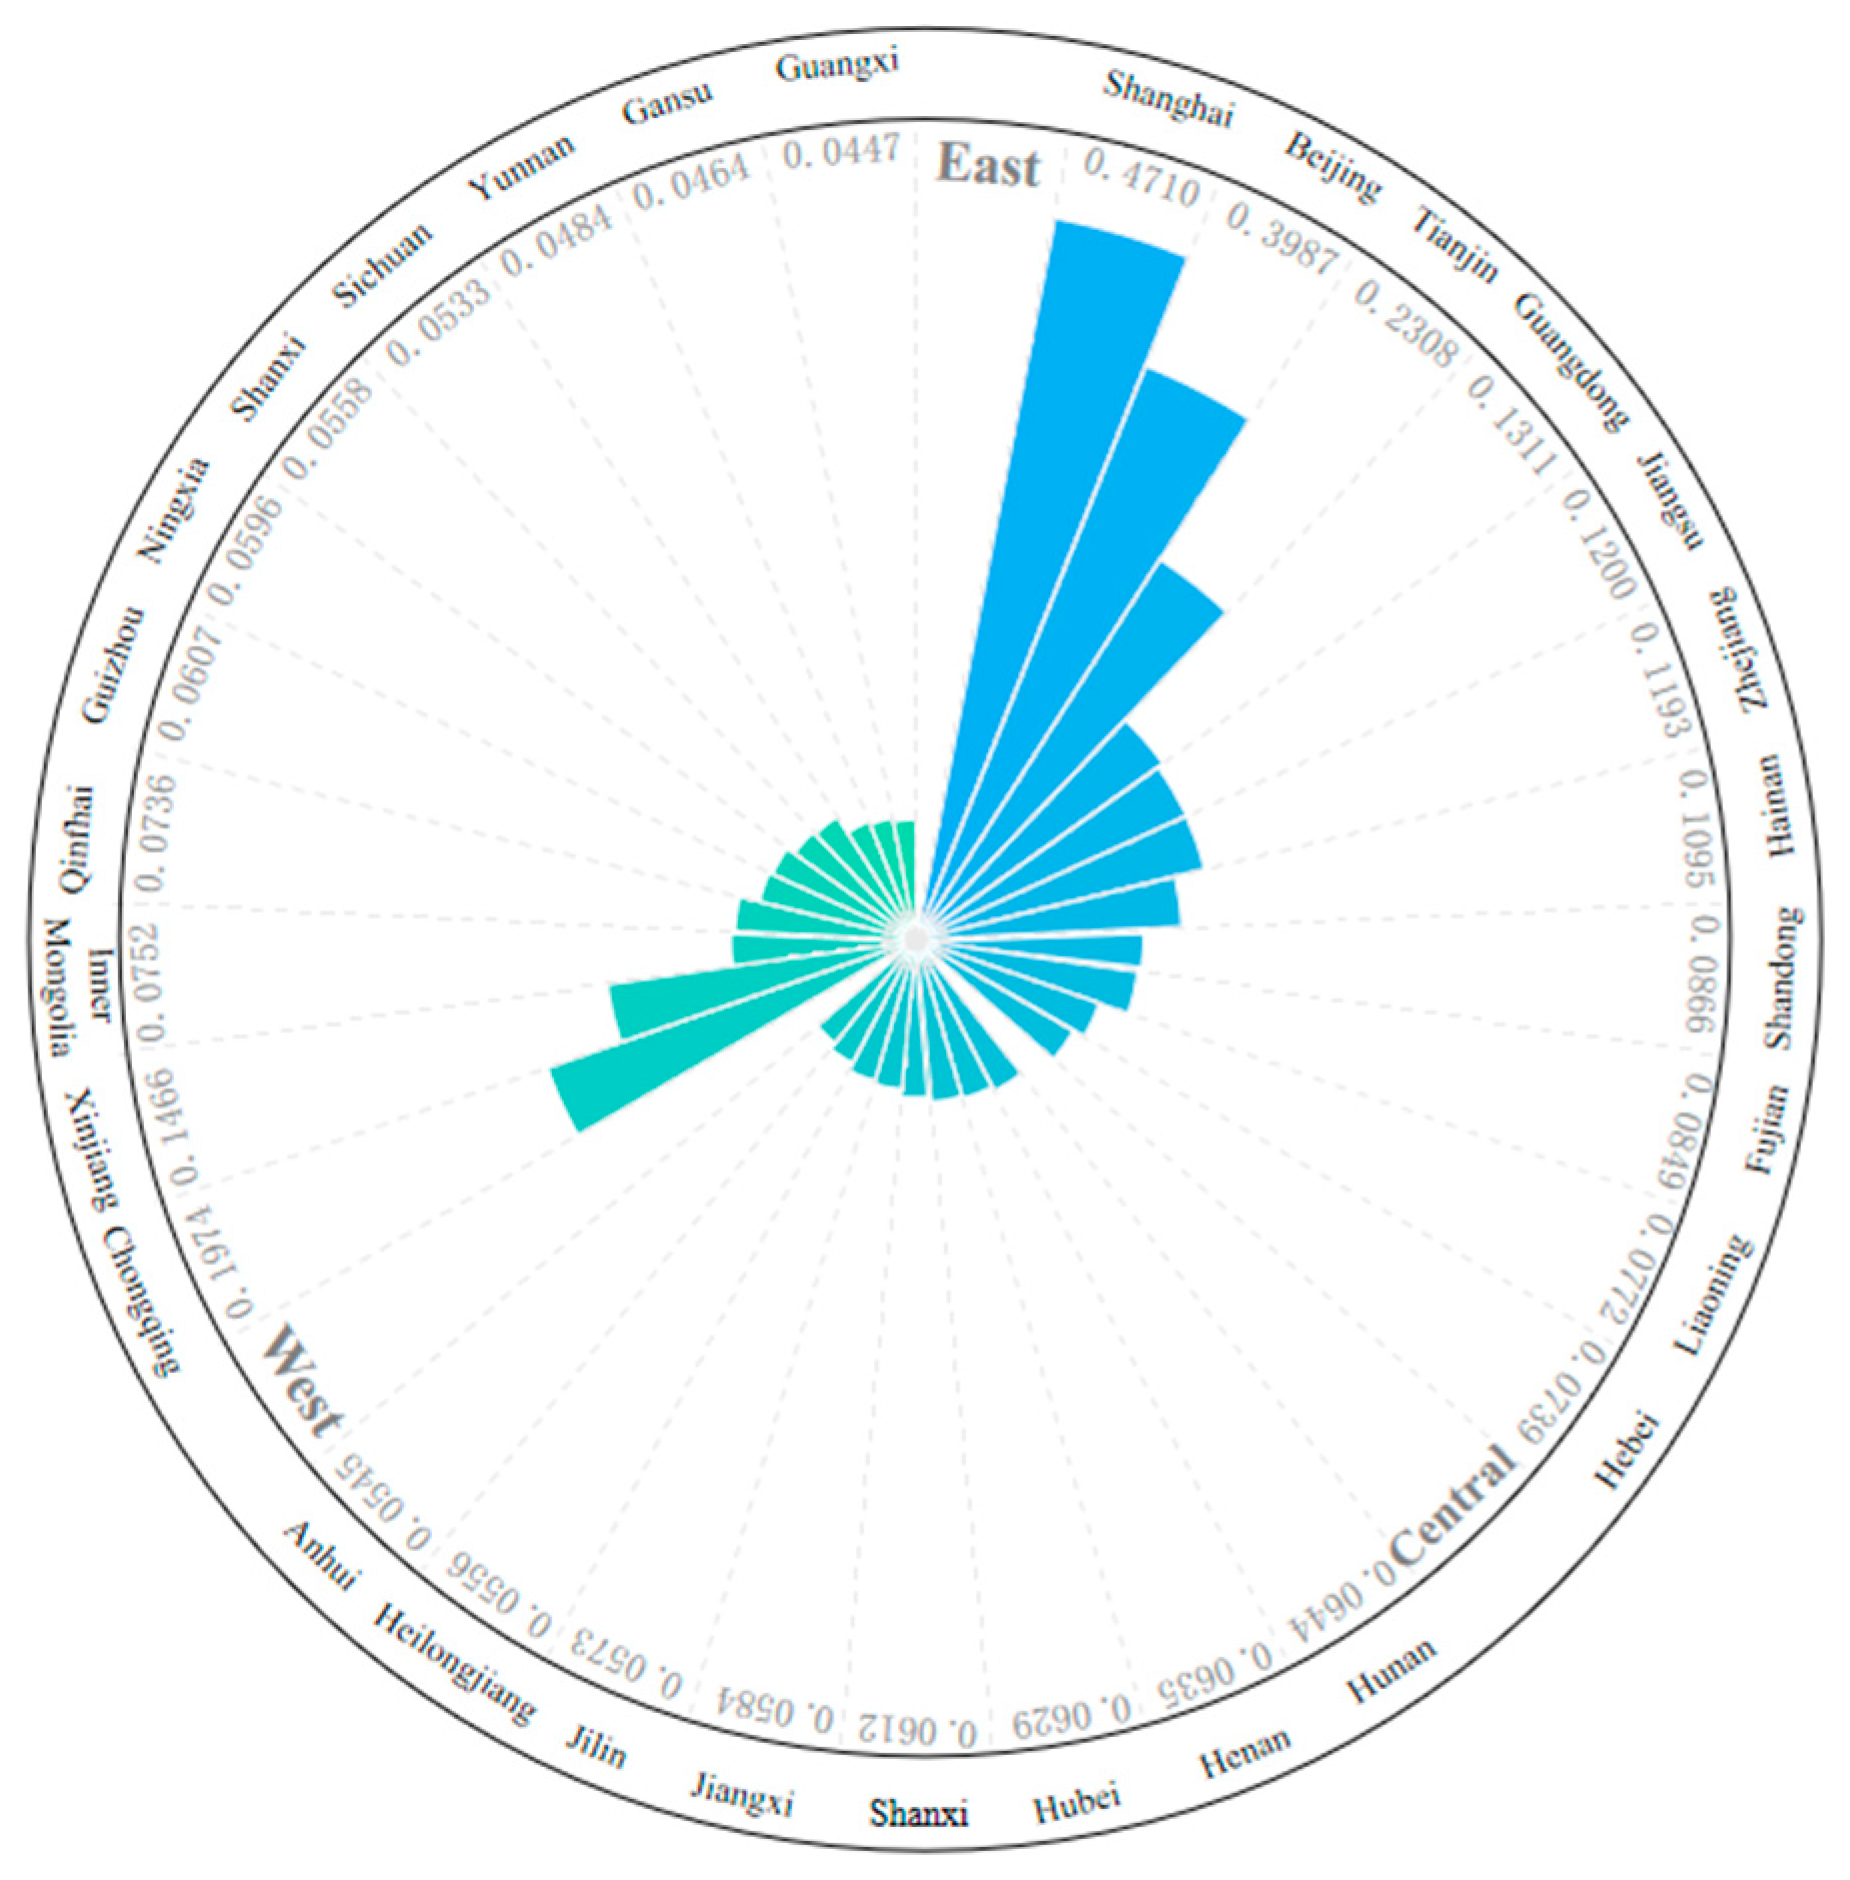
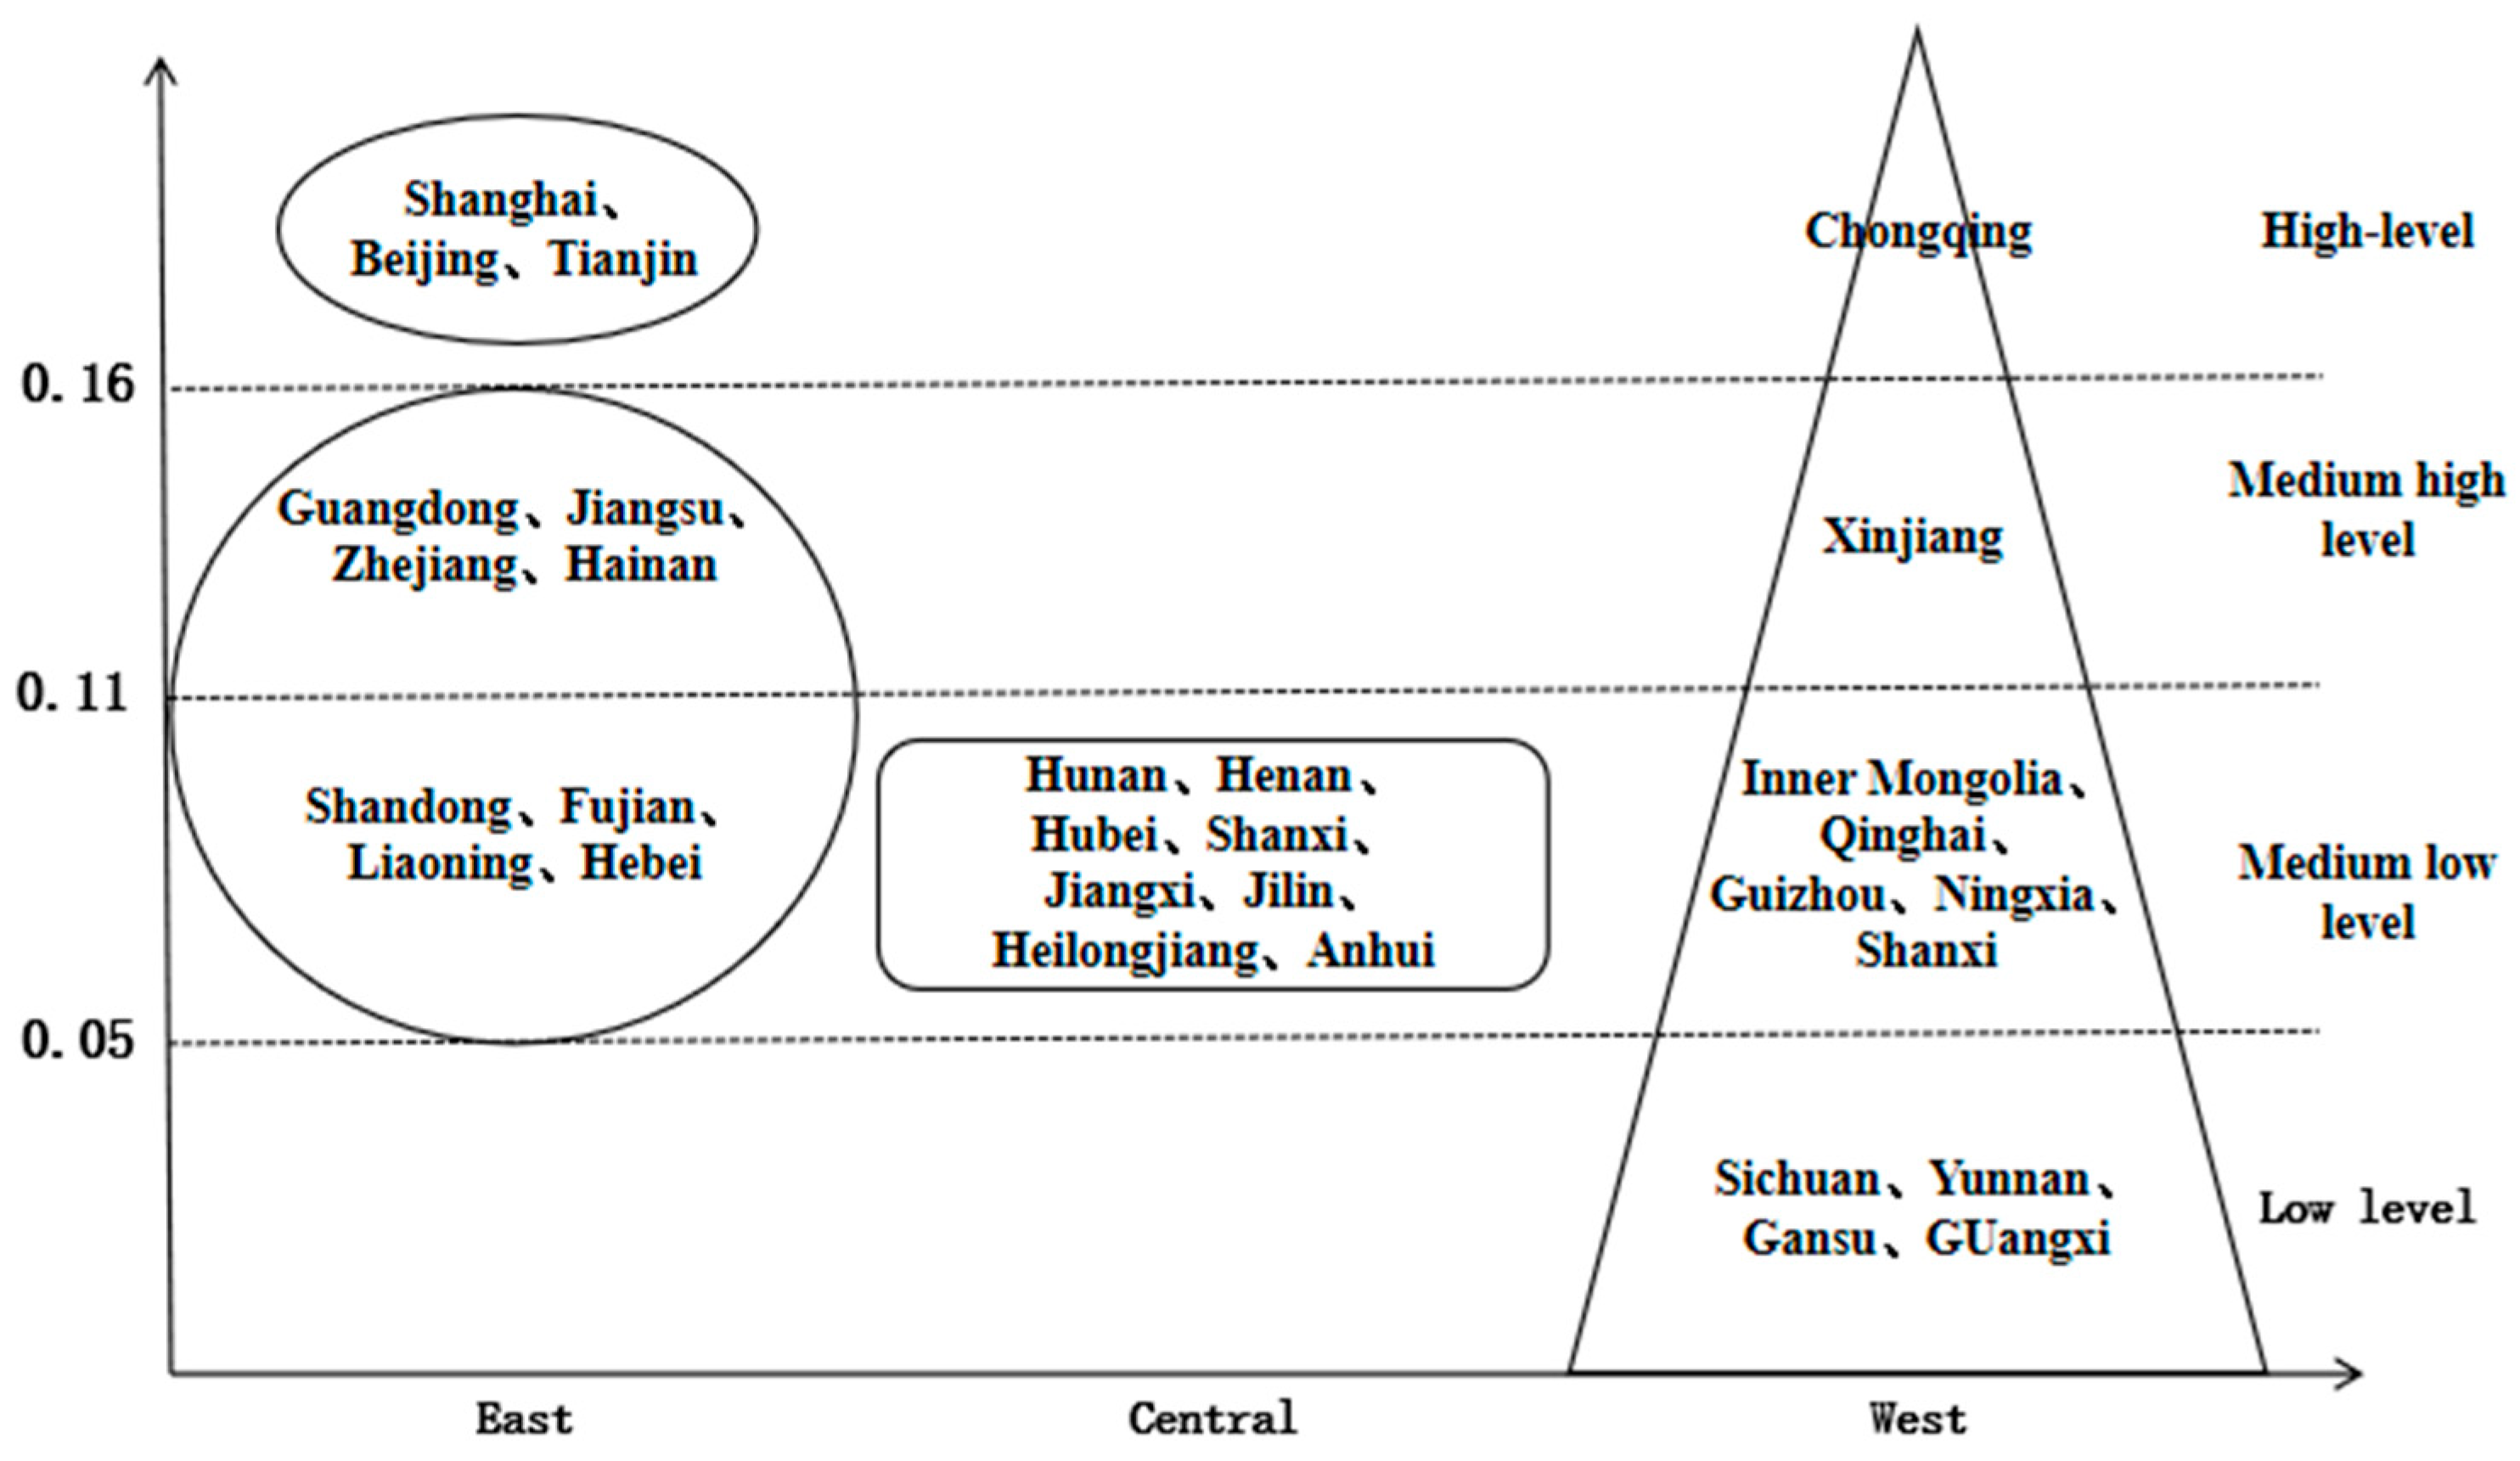
- In terms of spatial layout, cities with medium low-level resilience have always been in the core position. The distribution pattern of the eastern region being superior to the central and western regions has also been stable. Among them, some provinces in the eastern and western regions also show significant polarization. In addition, the development modes among the eastern, central and western regions are “three-core driving model”, “rectangular structure” and “pyramid structure” respectively. The Moran scatter plot explains the different development stages in different cities: The dominance of L-L (growth stage) cities has not changed. L-H (updating stage) and H-L (gestation stage) cities are mostly small and concentrated in the western region. H-H (mature stage) cities are mainly located in the Yangtze River Delta and Pearl River Delta.
- (3)
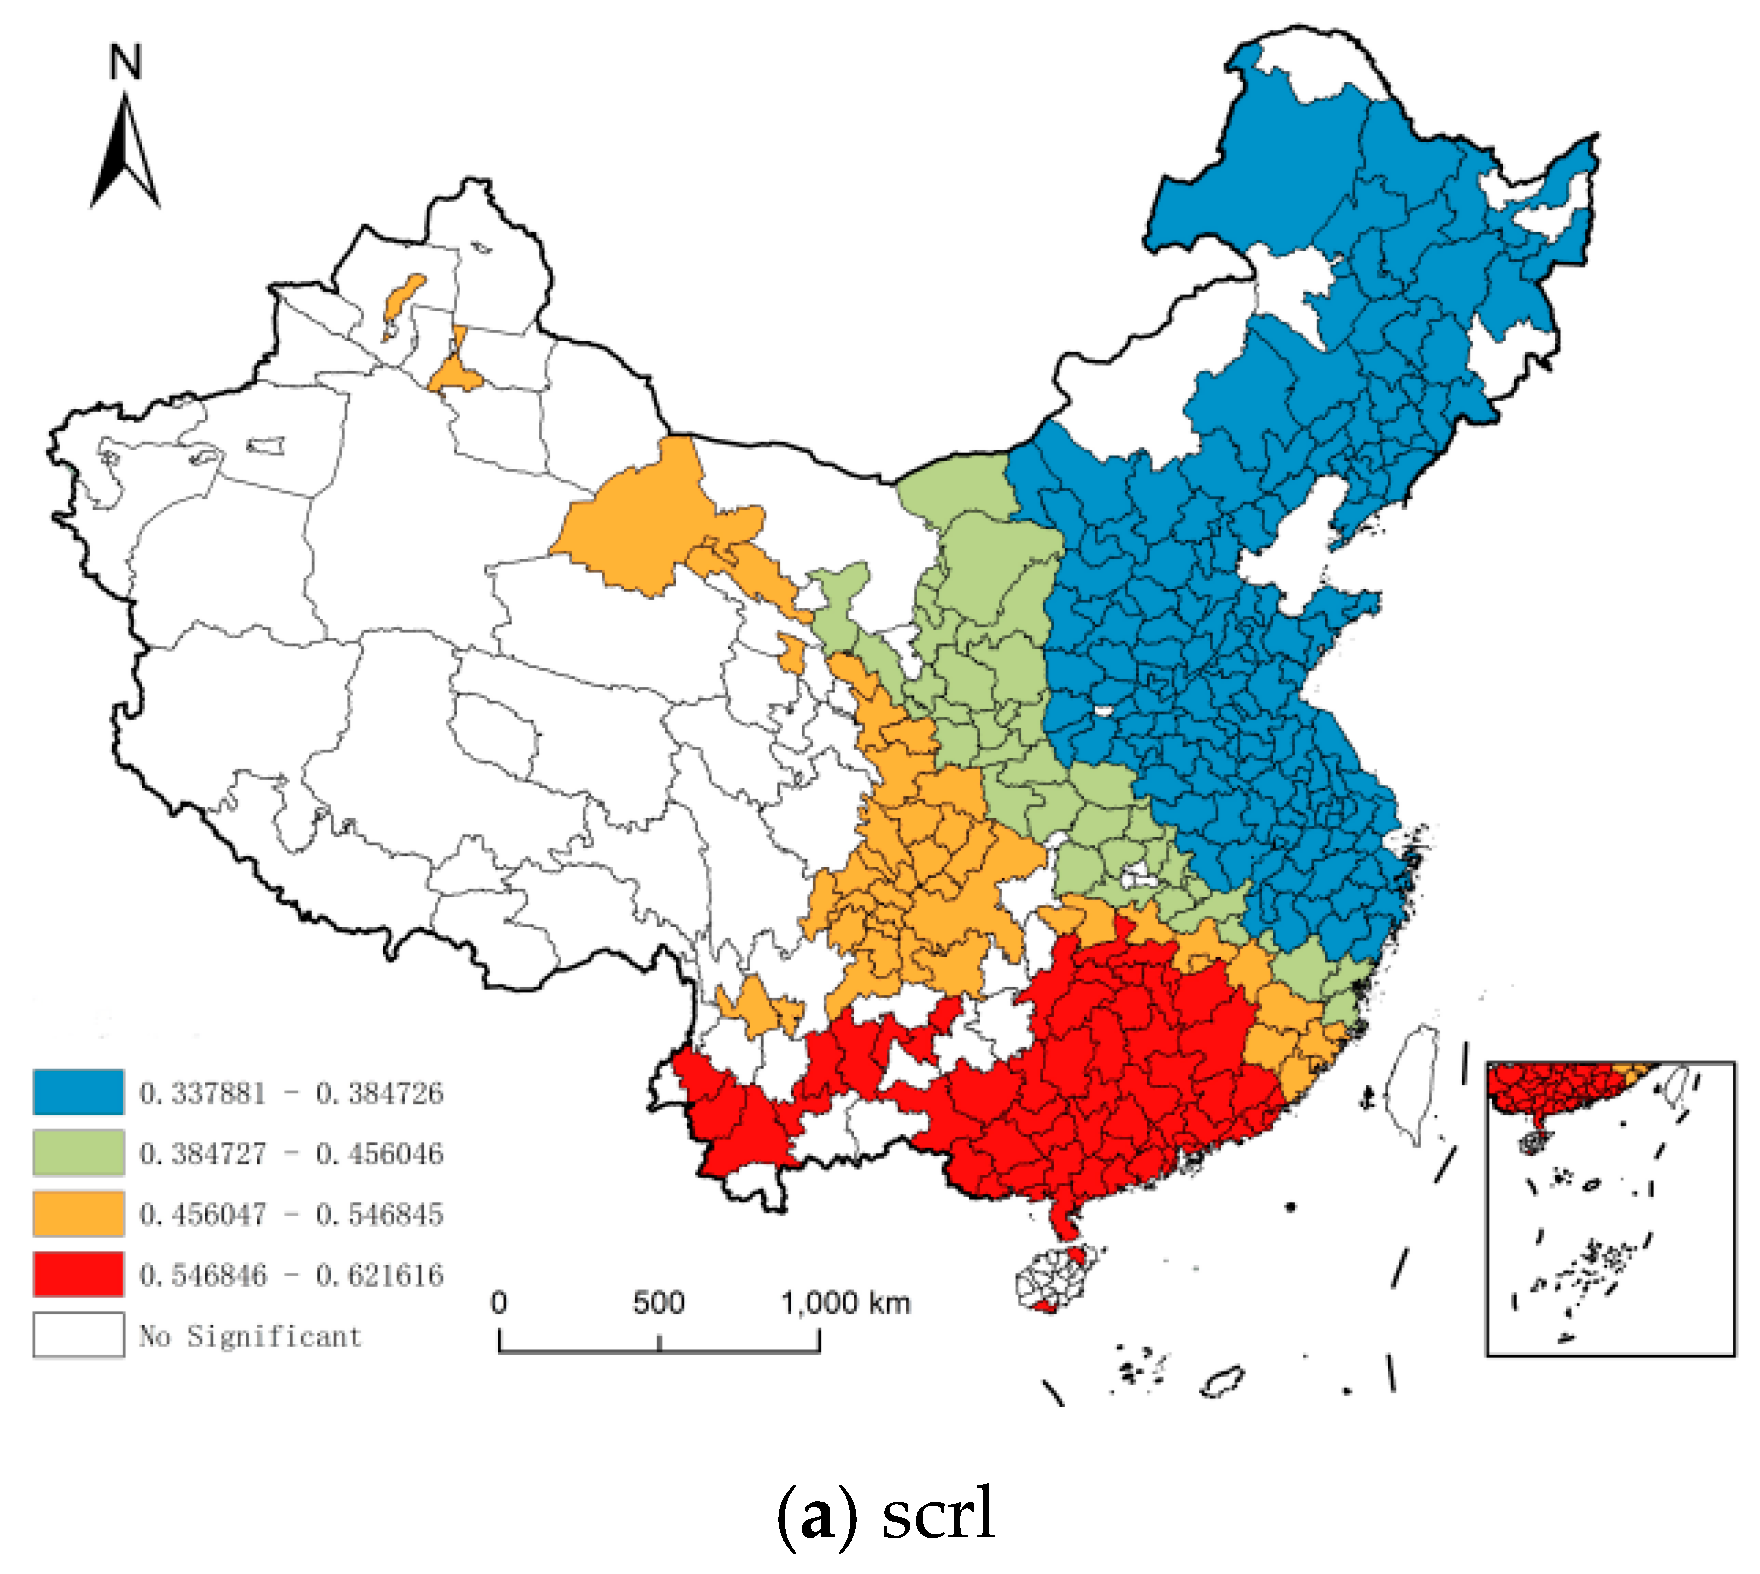
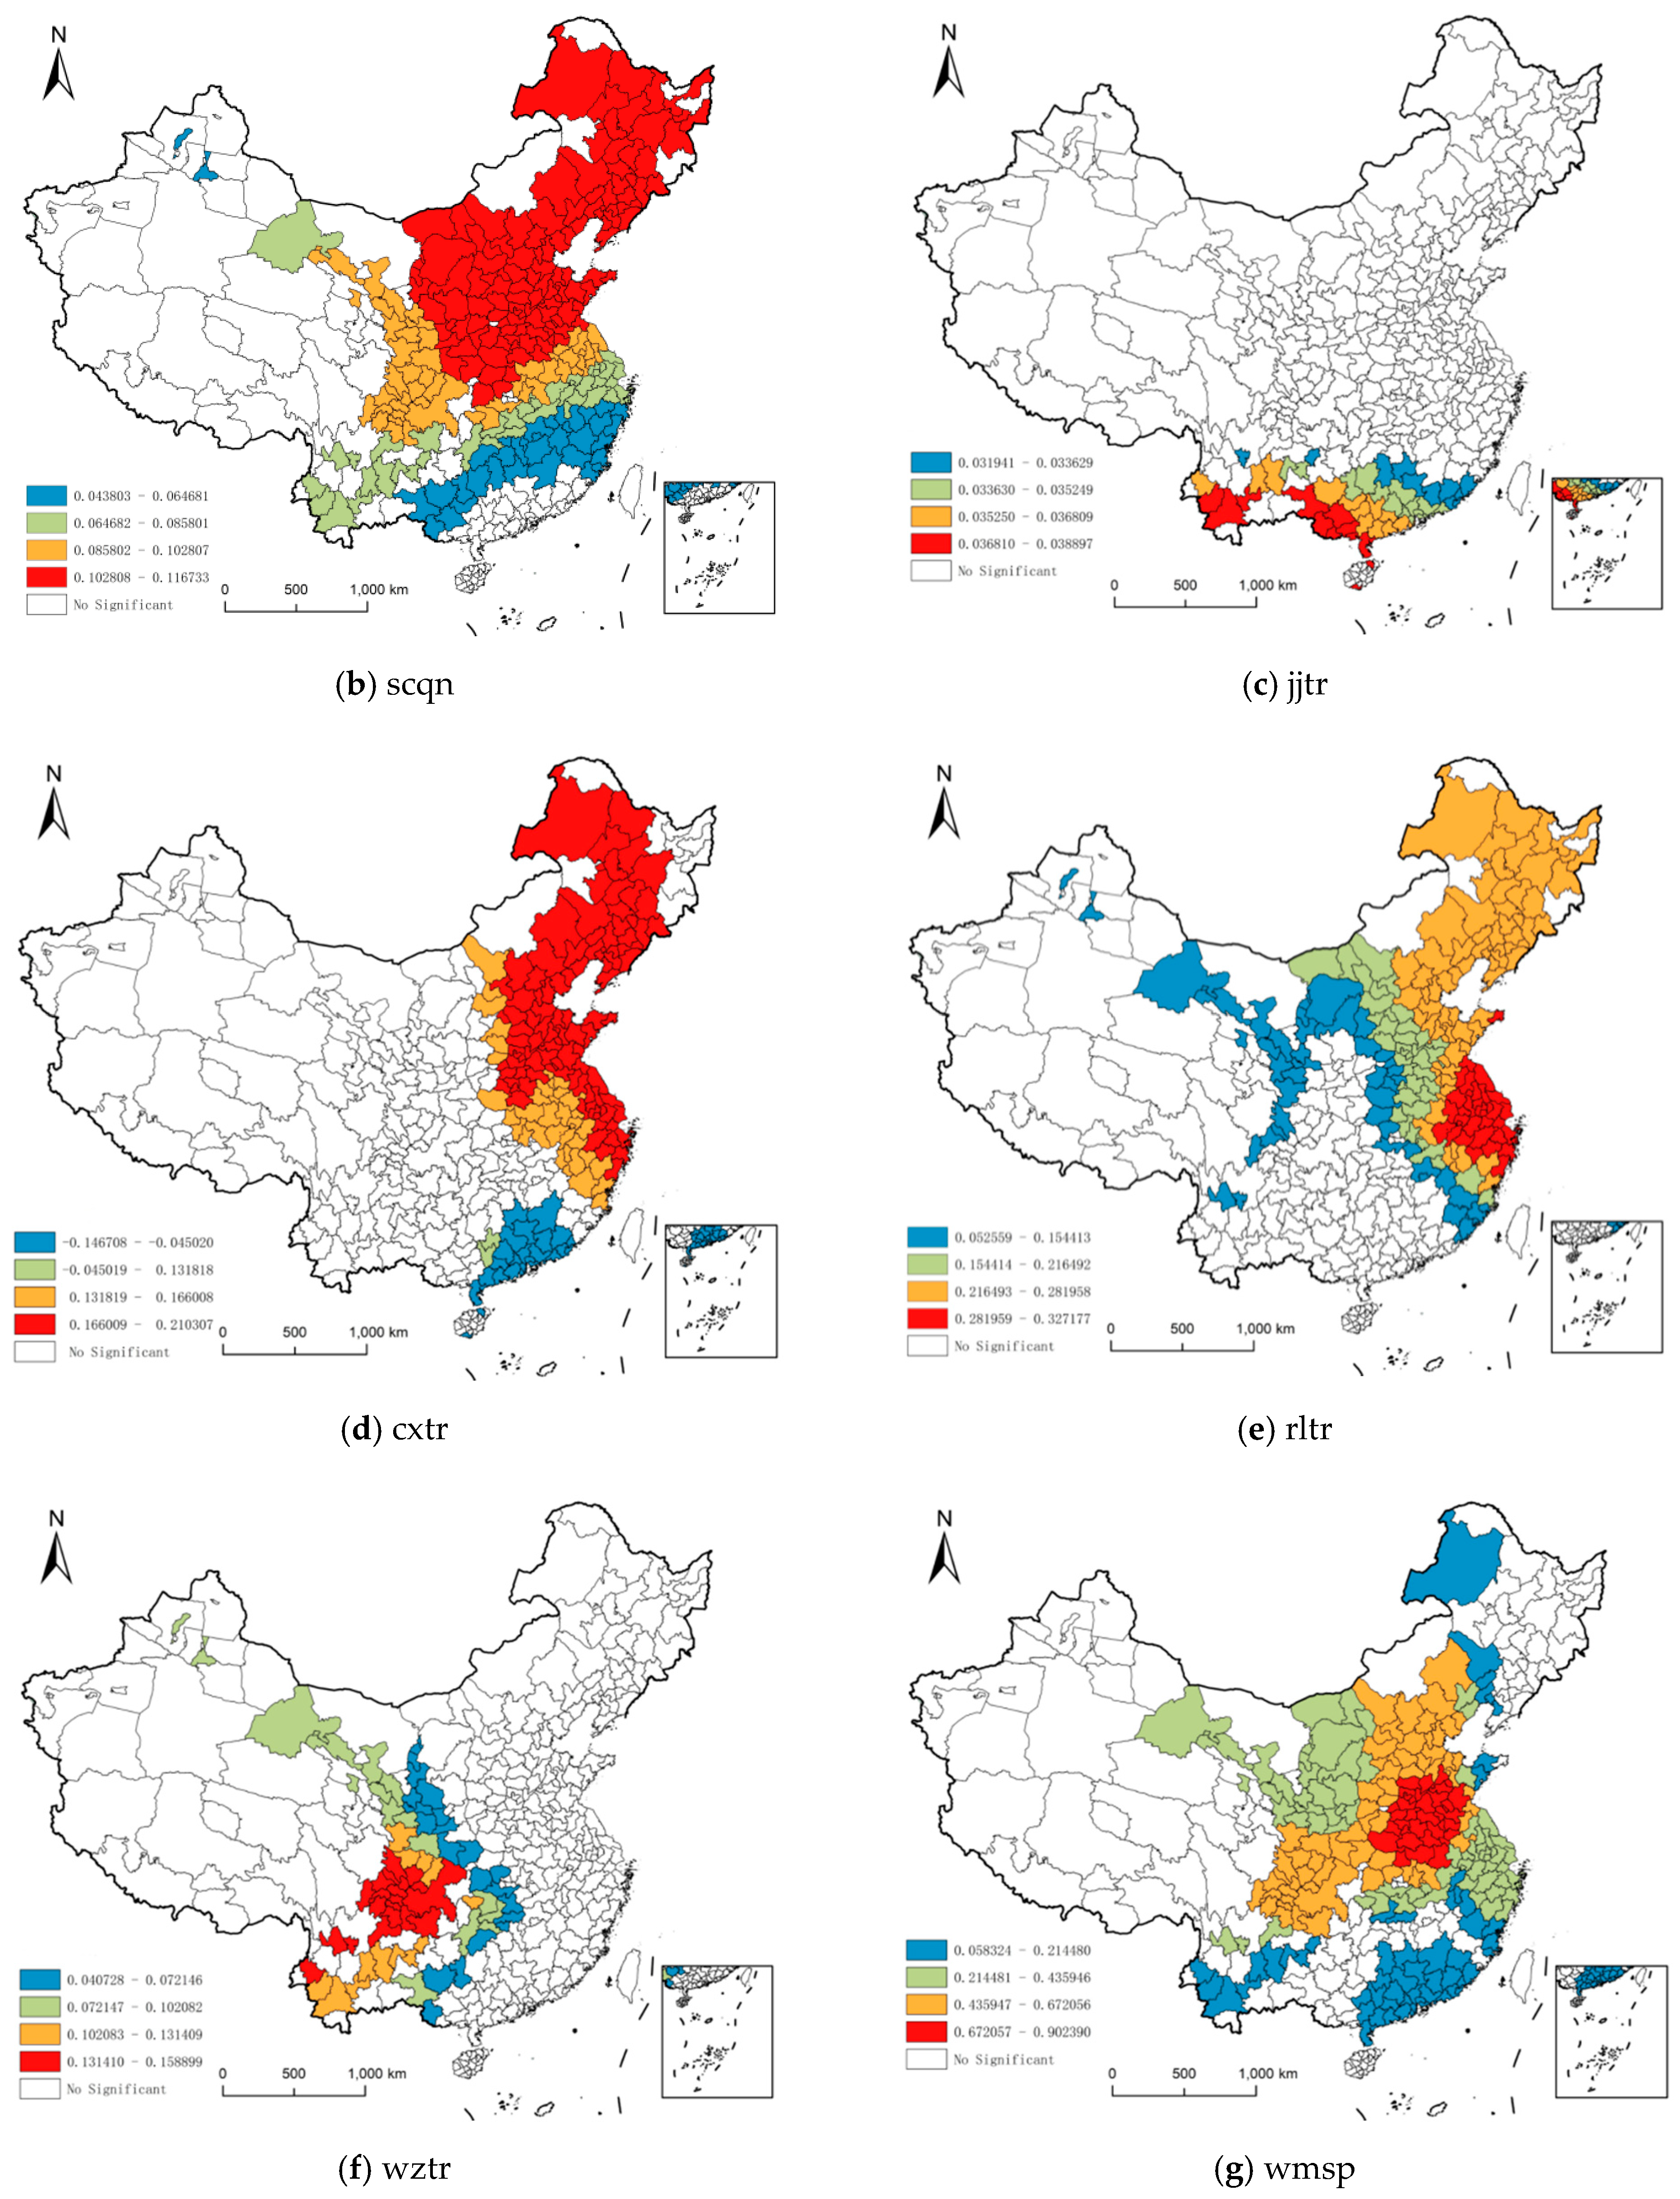
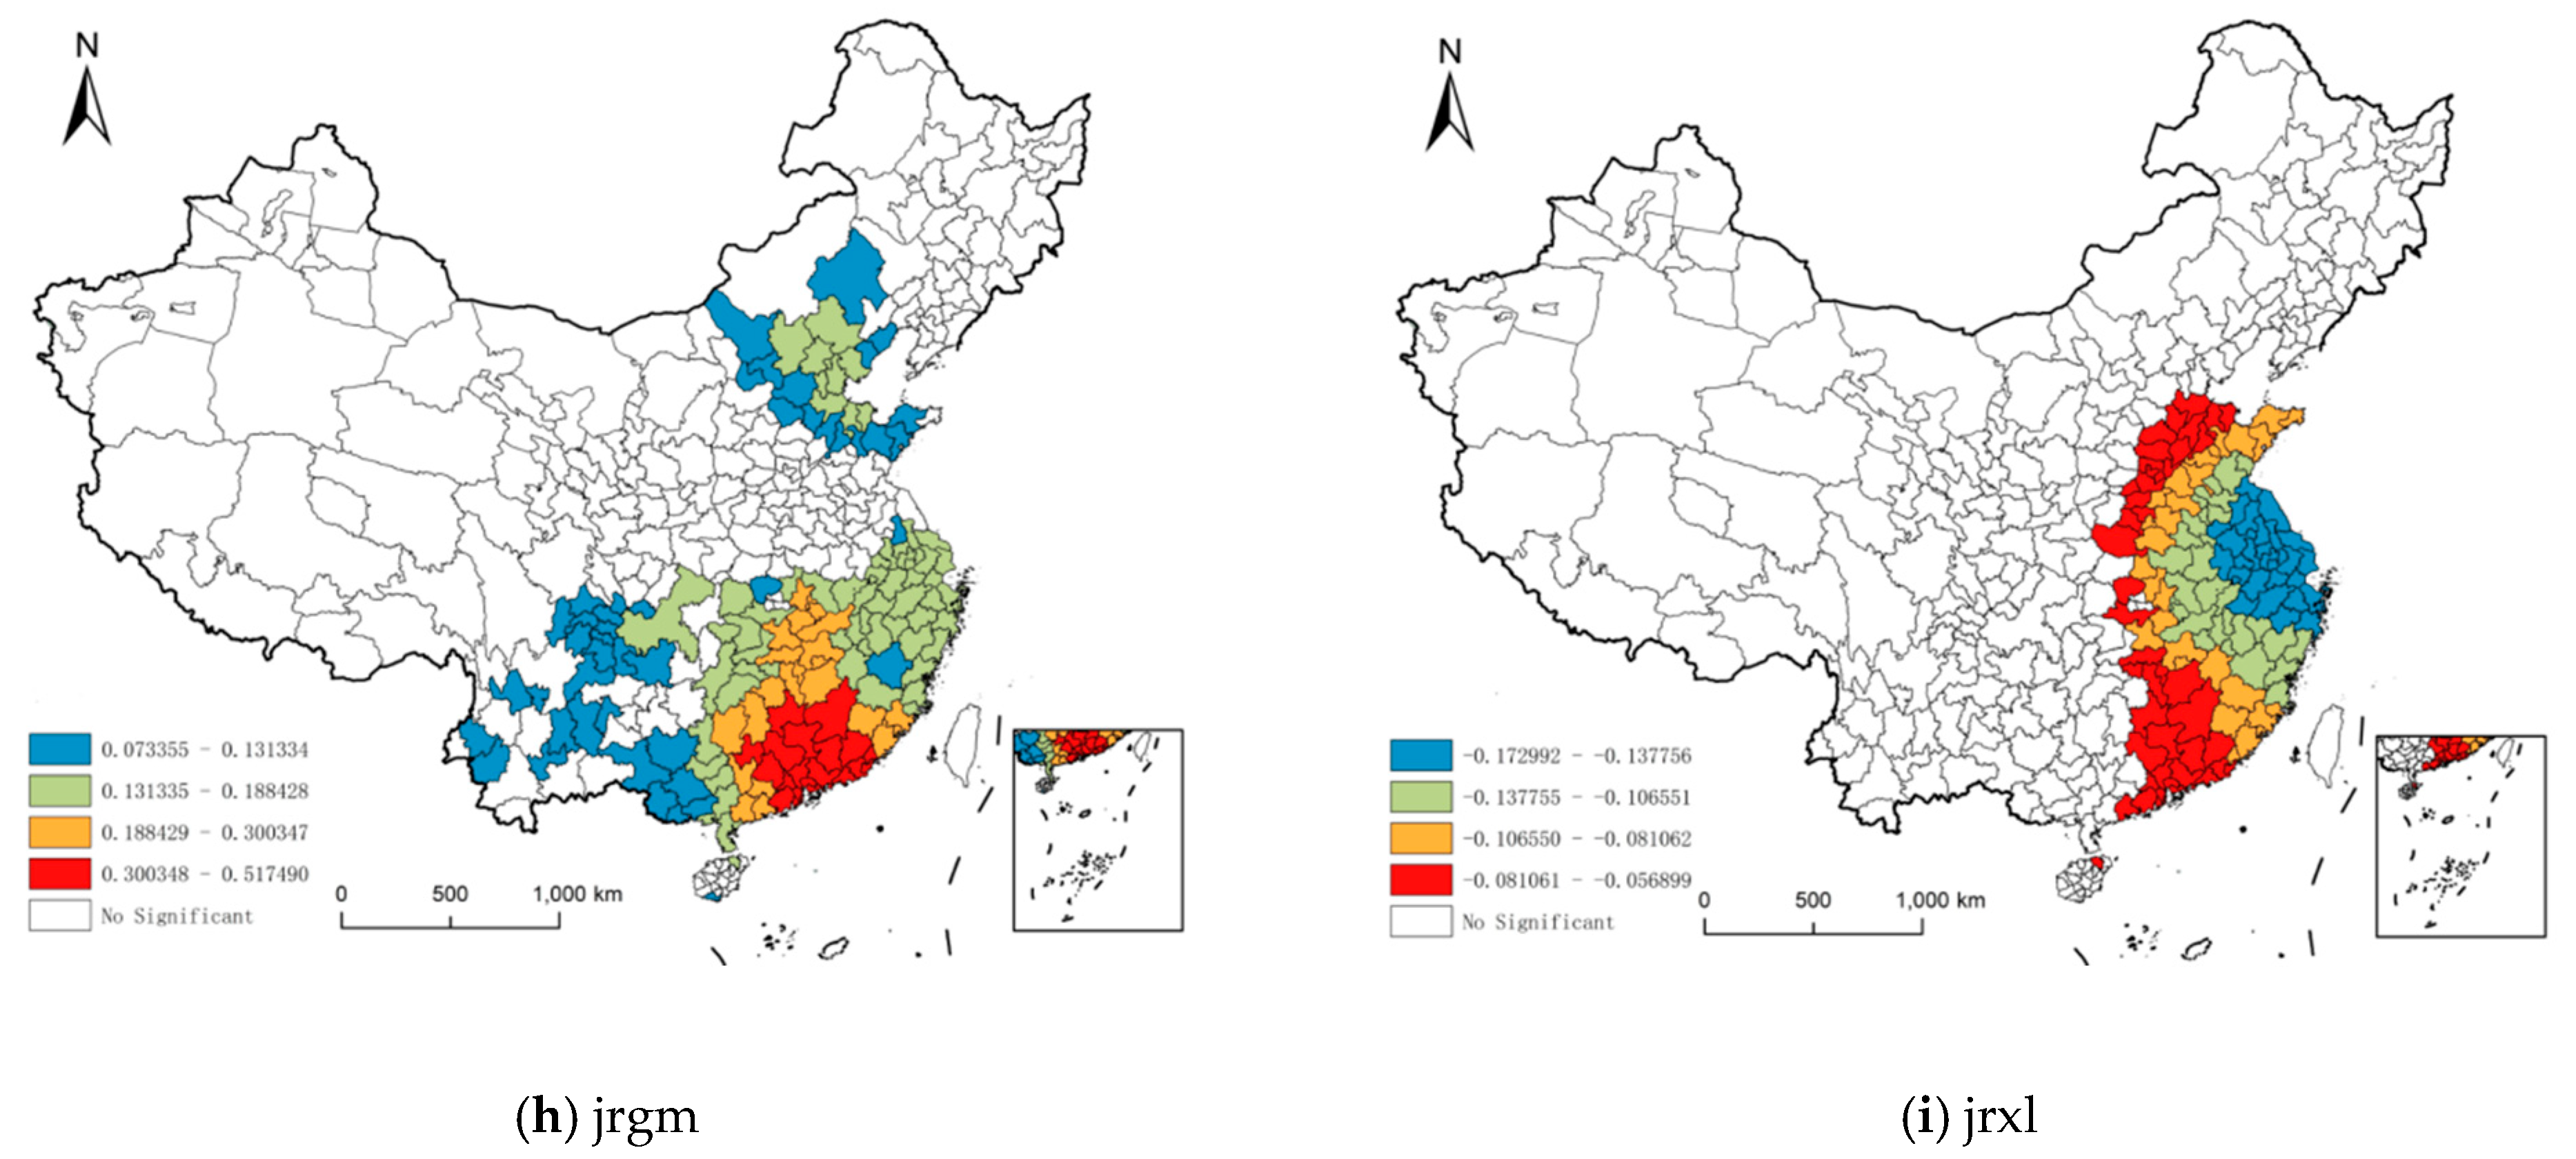
- There are significant differences among scales of driving factors, reflecting that different variables have different levels of spatial heterogeneity. Among them, innovation input, foreign trade level and financial institutions scale are all micro-scale variables. Market capacity, human capital, foreign investment and financial institutions efficiency are macro-scale variables. Only market potential and infrastructure investment are global scale variables. In addition, most variables have a significant positive impact on urban resilience, while effect of innovation input and financial efficiency is different. And the order of influence intensity is: Market capacity > Foreign trade level > Human capital > Financial institutions scale > Market potential > Innovation input > Financial institutions efficiency > Foreign investment > Infrastructure investment. It can be further summarized as: Market factors > Opening factor > Technical factors > Financial factors > Government factor.
4.2. Suggestion
Author Contributions
Funding
Institutional Review Board Statement
Informed Consent Statement
Data Availability Statement
Acknowledgments
Conflicts of Interest
References
- Zhou, Q.; Zhang, X.; Shao, Q.; Wang, X. The non-linear effect of environmental regulation on haze pollution: Empirical evidence for 277 Chinese cities during 2002–2010. J. Environ. Manag. 2019, 248, 109274. [Google Scholar] [CrossRef] [PubMed]
- Liu, K.; Qiao, Y.R.; Shi, T.; Zhou, Q. Study on coupling coordination and spatiotemporal heterogeneity between economic development and ecological environment of cities along the Yellow River Basin. Environ. Sci. Pollut. Res. 2020, 1–15. [Google Scholar] [CrossRef] [PubMed]
- Shao, Y.W.; Xu, J. Understanding Urban Resilience: A Conceptual Analysis Based on Integrated International Literature Review. Urban Plan. Int. 2015, 30, 48–54. [Google Scholar]
- Jack, A.; Qin, Y.; Liu, H.L. From Fail-Safe to Safe-to-Fail: Sustainability and Resilience in the New Urban World. Urban Plan. Int. 2015, 30, 4–7. [Google Scholar]
- Alberti, M.; Marzluff, J.M.; Shulenberger, E.; Bradley, G.; Ryan, C.; Zumbrunnen, C. Integrating Humans into Ecology: Opportunities and Challenges for Studying Urban Ecosystems. BioScience 2003, 53, 1169–1179. [Google Scholar] [CrossRef]
- Xu, J.; Shao, Y.W. Resilient Cities: A New Shift to Urban Crisis Management. Urban Plan. Int. 2015, 30, 1–3. [Google Scholar]
- Holling, C.S. Resilience and stability of ecological systems. Annu. Rev. Ecol. Syst. 1973, 4, 1–23. [Google Scholar] [CrossRef]
- Holling, C.S.; Gunderson, L.H. Resilience and Adaptive Cycles. In Panarchy: Understanding Transformations in Human and Natural Systems; Island Press: London, UK, 2001; pp. 25–62. [Google Scholar]
- Ahern, J. From Fail-Safe to Safe-to-Fail: Sustainability and Resilience in the New Urban World. Landsc. Urban Plan. 2011, 100, 341–343. [Google Scholar] [CrossRef]
- Meerow, S.; Newell, J.P.; Stults, M. Defining urban resilience: A Review. Landsc. Urban Plan. 2016, 147, 38–49. [Google Scholar] [CrossRef]
- Chang, S.E.; Shinozuka, M. Measuring Improvements in the Disaster Resilience of Communities. Earthq. Spectra 2004, 20, 739–755. [Google Scholar] [CrossRef]
- Razafindrabe, B.H.N.; Parvin, G.A.; Surjan, A.; Takeuchi, Y.; Shaw, R. Climate disaster resilience: Focus on coastal urban cities in Asia. United Nations Econ. Soc. Comm. Asia Pac. 2009, 1, 101–116. [Google Scholar] [CrossRef]
- Frazier, T.G.; Thompson, C.M.; Dezzani, R.J.; Butsick, D. Spatial and temporal quantification of resilience at the community scale. Appl. Geogr. 2013, 42, 95–107. [Google Scholar] [CrossRef]
- Orencio, P.M.; Fujii, M. A localized disaster-resilience index to assess coastal communities based on an analytic hierarchy process (AHP). Int. J. Disaster Risk Reduct. 2013, 3, 62–75. [Google Scholar] [CrossRef]
- Zheng, Y.; Zhai, J.Q.; Wu, Z.Y.; Li, Y.; Shi, W.N. A typology analysis on resilient cities based on adaptive cycle. China Popul. Resour. Environ. 2018, 28, 31–38. [Google Scholar]
- Spaans, M.; Waterhout, B. Building up resilience in cities worldwide -Rotterdam as participant in the 100 Resilient Cities Programme. Cities 2017, 61, 109–116. [Google Scholar] [CrossRef]
- Sharifi, A.; Yamagata, Y. Resilient urban planning: Major principles and criteria. Energy Procedia 2014, 61, 1491–1495. [Google Scholar] [CrossRef]
- Novotny, V.; Ahern, J.; Brown, P. Planning and Design for Sustainable and Resilient Cities: Theories, Strategies and Best Practices for Green Infrastructure//Water-centric Sustainable Communities; John Wiley and Sons: Hoboken, NJ, USA, 2010; pp. 135–176. [Google Scholar]
- Huang, X.J.; Huang, X. Resilient city and its planning framework. City Plan. Rev. 2015, 39, 50–56. [Google Scholar]
- Shen, T.Y.; Yu, H.C.; Zhou, L.; Gu, H.; He, H. On Hedonic Price of Second-Hand Houses in Beijing Based on Multi-Scale Geographically Weighted Regression: Scale Law of Spatial Heterogeneity. Econ. Geogr. 2020, 40, 75–83. [Google Scholar]
- Mayunga, J.S. Understanding and Applying the Concept of Community Disaster Resilience: A Capital-based Approach. Summer Acad. Soc. Vulnerability Resil. Build. 2007, 32, 1–16. [Google Scholar]
- Li, X. To Fend off and Control Major Risks, Build a Resilient City. Urban Dev. Stud. 2020, 27, 1–6. [Google Scholar]
- Jha, A.K.; Miner, T.W.; Stanton-Geddes, Z. Building Urban Resilience: Principles, Tools, and Practice; The World Bank: Washington, DC, USA, 2013. [Google Scholar]
- Chen, Y.; Zhu, M.K.; Lu, J.L.; Zhou, Q.; Ma, W. Evaluation of ecological city and analysis of obstacle factors under the background of high-quality development: Taking cities in the Yellow River Basin as examples. Ecol. Indic. 2020, 118, 106771. [Google Scholar] [CrossRef]
- Wang, J.F.; Zhang, T.L.; Fu, B.J. A measure of spatial stratified heterogeneity. Ecol. Indic. 2016, 67, 250–256. [Google Scholar] [CrossRef]
- Zhang, Z.L.; Xue, B.; Chen, X.P.; Li, Y.J. Convergence in Spatial Difference of Industrial Environmental Efficiency in China. China Popul. Resour. Environ. 2015, 25, 30–38. [Google Scholar]
- Bai, L.M.; Xiu, C.L.; Feng, X.H.; Mei, D.W.; Wei, Y. A comprehensive assessment of urban resilience and its spatial differentiation in China. World Reg. Stud. 2019, 28, 77–87. [Google Scholar]
- Holling, C.S. Understanding the complexity of economic. Ecol. Soc. Syst. Ecosyst. 2001, 4, 390–405. [Google Scholar]
- Wei, Y.; Xiu, C.L.; Sun, P.J. Dynamic mechanism of urbanization in China since 2000. Geogr. Res. 2013, 32, 1679–1687. [Google Scholar]
- Zhu, J.H.; Sun, X.H. Research on Spatial-temporal Evolution and Influencing Factors of Urban Resilience of China’s Three Metropolitan Agglomerations. Soft Sci. 2020, 34, 72–79. [Google Scholar]
- Odum, H.T.; Odum, E.P. Trophic structure and productivity of a windward coral reef community on Eniwetok Atoll. Ecol. Monogr. 1955, 25, 291–320. [Google Scholar] [CrossRef]

| Target Layer | Rule Layer | Factor Layer | Index Layer |
|---|---|---|---|
| Urban resilience | Economic resilience | Economic strength | GDP per capita |
| Per capita savings balance | |||
| Industrial enterprises above designated size | |||
| Economic diversity | Ratio of output value of secondary and tertiary industries to GDP | ||
| Economic extroversion | The number of foreign-invested enterprises in industrial enterprises above designated size | ||
| Foreign direct investment contract projects | |||
| Engineering resilience | urban evacuation ability | Road area per capita | |
| The number of buses per 10,000 people | |||
| Basic supply and drainage ability | Drainage pipe density | ||
| Per capita electricity consumption of city | |||
| Total urban gas supply | |||
| Water consumption per capita | |||
| External communication ability | Number of households with Internet broadband | ||
| Number of mobile phone users at the end of year | |||
| Social resilience | Population adaptation ability | Natural population growth rate | |
| Urban unemployment rate | |||
| Social security ability | Social security Index | ||
| Number of beds per 10,000 persons | |||
| Risk response ability | The number of college students per 10,000 persons | ||
| Health technicians per 10,000 persons | |||
| Ecological resilience | Environmental pressure | Industrial wastewater discharge per unit of GDP | |
| Industrial smoke (dust) emissions per unit of GDP | |||
| Governance ability | Comprehensive utilization rate of general industrial solid waste | ||
| Harmless disposal rate of household garbage | |||
| Service ability | Green coverage in built-up areas | ||
| Park green area per capita | |||
| Institutional resilience | Basic guarantee | Unemployment insurance coverage | |
| The number of urban workers participating in basic medical insurance | |||
| Manpower input | Proportion of employees in public administration and social organizations | ||
| Financial input | Fiscal spending |
| Urban Resilience System | Resilience Index | α Value | Moran’s I | ||||||
|---|---|---|---|---|---|---|---|---|---|
| 2011 | 2015 | 2018 | 2011 | 2015 | 2018 | 2011 | 2015 | 2018 | |
| Overall resilience | 0.0885 | 0.0837 | 0.0773 | 0.0297 | 0.0303 | 0.0308 | 0.1717 | 0.1679 | 0.1812 |
| Economic resilience | 0.0211 | 0.0202 | 0.0204 | 0.0297 | 0.0303 | 0.0308 | 0.2001 | 0.1931 | 0.2272 |
| Engineering resilience | 0.0237 | 0.0208 | 0.0189 | 0.0329 | 0.0309 | 0.0294 | 0.0508 | 0.0536 | 0.0447 |
| Social resilience | 0.0197 | 0.0210 | 0.0198 | 0.0295 | 0.0312 | 0.0344 | 0.0667 | 0.0657 | 0.0725 |
| Ecological resilience | 0.0118 | 0.0101 | 0.0089 | 0.0088 | 0.0086 | 0.0098 | 0.1345 | 0.0715 | 0.1499 |
| Institutional resilience | 0.0122 | 0.0115 | 0.0093 | 0.0332 | 0.0383 | 0.0396 | 0.1265 | 0.1061 | 0.1048 |
| Factors | Indicators | Measurement |
|---|---|---|
| Government factor | Infrastructure investment | Investment in the construction of municipal public facilities/Total fixed asset investment |
| Financial level | Fiscal revenue/GDP | |
| Technical factors | Innovation input | Technology expenditure/GDP |
| Human capital | Number of R&D employees per 10,000 persons | |
| Market factors | Market capacity | Total retail sales of social consumption per capita |
| Market potential | The population density | |
| Opening factors | Foreign investment | FDI/GDP |
| Foreign trade level | Total import and export/GDP | |
| Financial factors | Financial institutions scale | The total amount of deposits and loans of financial institutions/GDP |
| Financial institutions efficiency | Financial loan-to-deposit ratio |
| Model Indexes | MGWR | GWR |
|---|---|---|
| R2 | 0.948 | 0.937 |
| AICc | 135.171 | 182.703 |
| Sum of squares of residuals | 14.715 | 17.828 |
| Variable | MGWR | GWR |
|---|---|---|
| Market capacity | 126 | 110 |
| Market potentia | 200 | 110 |
| Infrastructure investment | 199 | 110 |
| Financial level | 276 | 110 |
| Innovation input | 87 | 110 |
| Human capital | 112 | 110 |
| Foreign investment | 120 | 110 |
| Foreign trade level | 44 | 110 |
| Financial institutions scale | 47 | 110 |
| Financial institutions efficiency | 148 | 110 |
| Variable | Definition | Mean | Standard Deviation | Min | Median | Max |
|---|---|---|---|---|---|---|
| scrl | Market capacity | 0.437 | 0.101 | 0.338 | 0.39 | 0.622 |
| scqn | Market potentia | 0.087 | 0.027 | 0.032 | 0.098 | 0.117 |
| jjtr | Infrastructure investment | 0.016 | 0.018 | −0.147 | 0.021 | 0.039 |
| cxtr | Innovation input | 0.065 | 0.093 | −0.147 | 0.089 | 0.21 |
| rlzb | Human capital | 0.165 | 0.096 | 0.018 | 0.156 | 0.327 |
| wztr | Foreign investment | 0.04 | 0.045 | −0.029 | 0.024 | 0.159 |
| wmsp | Foreign trade level | 0.347 | 0.248 | −0.043 | 0.314 | 0.902 |
| jrgm | Financial institutions scale | 0.115 | 0.114 | −0.097 | 0.098 | 0.517 |
| jrxl | Financial institutions efficiency | −0.057 | 0.052 | −0.173 | −0.052 | 0.023 |
Publisher’s Note: MDPI stays neutral with regard to jurisdictional claims in published maps and institutional affiliations. |
© 2021 by the authors. Licensee MDPI, Basel, Switzerland. This article is an open access article distributed under the terms and conditions of the Creative Commons Attribution (CC BY) license (http://creativecommons.org/licenses/by/4.0/).
Share and Cite
Chen, Y.; Zhu, M.; Zhou, Q.; Qiao, Y. Research on Spatiotemporal Differentiation and Influence Mechanism of Urban Resilience in China Based on MGWR Model. Int. J. Environ. Res. Public Health 2021, 18, 1056. https://doi.org/10.3390/ijerph18031056
Chen Y, Zhu M, Zhou Q, Qiao Y. Research on Spatiotemporal Differentiation and Influence Mechanism of Urban Resilience in China Based on MGWR Model. International Journal of Environmental Research and Public Health. 2021; 18(3):1056. https://doi.org/10.3390/ijerph18031056
Chicago/Turabian StyleChen, Yu, Mengke Zhu, Qian Zhou, and Yurong Qiao. 2021. "Research on Spatiotemporal Differentiation and Influence Mechanism of Urban Resilience in China Based on MGWR Model" International Journal of Environmental Research and Public Health 18, no. 3: 1056. https://doi.org/10.3390/ijerph18031056
APA StyleChen, Y., Zhu, M., Zhou, Q., & Qiao, Y. (2021). Research on Spatiotemporal Differentiation and Influence Mechanism of Urban Resilience in China Based on MGWR Model. International Journal of Environmental Research and Public Health, 18(3), 1056. https://doi.org/10.3390/ijerph18031056


