Abstract
This study provides the first data set of 210Po and 210Pb activity concentrations in the organic and inorganic components of several particle size classes of aerosols collected at two sampling stations in Kuwait. The 210Po concentrations in the aerosols (Bq/g) were similar in all of the particle size classes, but as most (91%) of the aerosol load was made of fine fraction particles of PM0.39–2.5 µm, most of the 210Po activity was carried by this aerosol fraction. At the two sampling stations, the 210Po/210Pb activity concentration ratios in the aerosols were similar, stable around the year, and averaged 1.5 (range 1.2–1.9), much higher than the typical activity concentration ratios of these radionuclides in unmodified (background) aerosols, with Po/Pb < 0.1. The aerosol enrichment in 210Po was likely originated from the oil industry, specifically by gas flaring and oil refining in the Gulf region. Radionuclide analysis in the organic and inorganic components of aerosols showed that the 210Po concentration in the organic component was one order of magnitude higher than the 210Po concentration in the inorganic component, in contrast with 210Pb, which displayed similar concentrations in both organic and inorganic aerosol components. The 210Po carrying organic component of aerosols was investigated and it was found to be largely composed of microorganisms with high microbial and fungi diversity, with the phyla Proteobacteria, Ascomycota, and Basidiomycota being dominant among the bacteria and with Zygomycota being dominant among the fungi. Therefore, we are facing an active concentration process of the atmospheric 210Po carried out by microorganisms, which underlies the 210Po enrichment process in the organic component of aerosols. This bioconcentration of polonium in bioaerosols was unknown.
1. Introduction
Polonium (210Po, T1/2 = 138.4 d) and radioactive lead (210Pb, T1/2 = 22.3 a) are naturally occurring radionuclides that belong to the uranium radioactive decay series. Under the environmental conditions that prevail at the surface of our planet, both radionuclides exist in the solid state, and their presence in the atmosphere is primarily related to the radioactive decay of airborne radon gas (222Rn; T1/2 = 3.8 d) [1]. In contrast to radon, which is a noble gas with atoms that carry a neutral electric charge, all of the radon daughters are positive ions that are highly particle reactive and, once formed, they become rapidly attached to particles. In the atmosphere, polonium-210 ions become attached to aerosol particles within 40 to 180 s after its formation from the radioactive decay of the precursor radon daughters [2]. Dry and wet atmospheric depositions continuously scavenge radon daughter ions from the atmosphere, preventing the formation of a secular radioactive equilibrium between radon and radon progeny and maintaining a very significant radioactive disequilibrium between 210Pb and 210Po, with 210Po/210Pb ratios that are generally much lower than 0.1 [3].
Since the pioneering work by Poet and Martell [4], the radioactive disequilibrium 210Po/210Pb and the disequilibria between 210Po/210Bi/210Pb have been used as tracers of atmospheric aerosols, and, in particular, to determine the mean residence time of aerosol particles in the troposphere [3,5]. Later research did elucidate that the 210Pb and 210Po in the atmosphere may have origins other than the radioactive decay of atmospheric radon. Volcanic emissions, atmospheric emissions from certain industrial facilities, forest fires, coal burning, and nuclear weapons tests have been identified as sources of 210Po and sometimes of 210Pb that have been released into the atmosphere [6,7,8,9,10,11,12]. The particularity of these additional sources, which generally generate strong inputs of 210Po with minor or no 210Pb input, is the increase in the 210Po/210Pb ratios of the naturally occurring radionuclides in the background aerosols to values that are much above 0.1 and that may even exceed 10 [9,12].
From surface air, the particle attached 210Po and 210Pb can easily be inhaled, contributing to the radiation exposure of lungs. Polonium-210 and lead-210 are also present in foods and are ingested with the diet [13,14,15]. The intake of these radionuclides through the inhalation and ingestion pathways originates an internal radiation dose to human beings that is generally higher than the dose from other naturally occurring radionuclides, with the exception of radon [16]. The activity-to-dose conversion factors are 4.3 µSv/Bq for inhaled 210Po and 1.2 µSv/Bq for ingested 210Po, and 5.6 µSv/Bq and 0.69 µSv/Bq for inhaled and ingested 210Pb, respectively. These values are much above the conversion factors for other naturally occurring radionuclides [17]. With such high conversion factor values, additional exposures to enhanced 210Po activity in the environment may significantly increase the radiation dose received by human beings. Therefore, research on the environmental behavior of 210Po and 210Pb and 210Po-210Pb environmental monitoring are highly valued for assessing radiation exposure and ensuring the radiation protection of the public [18,19].
Studies on the behavior of 210Po and 210Pb in the air have been conducted at several locations [2,3,9,10,11,20,21,22,23,24,25,26,27,28]. Some of these studies have reported 210Po/210Pb concentration ratios that are occasionally much above the unity, and such exceptionally high ratios have generally been associated with 210Po releases from anthropogenic sources involving high temperatures, such as metal smelters, ceramic kilns, incinerators, and forest fires [2,3,12,20,21,29,30]. Furthermore, radionuclide analysis in fractionated aerosols has indicated that most of the polonium activity is associated with fine and ultrafine aerosol particles. For example, in Japan over, 70% of the 210Po activity in aerosols was reported to be associated with the aerosol size fraction of <0.7 µm [31]. In Poland, 82% of 210Po found in aerosols was measured to be within the particle size class fraction 0.1–0.3 µm while 8 to 30% of 210Po was measured to be in the size class fraction of less than 0.1 µm and was mostly attributed to emissions from industrial sources [20]. In Portugal, a study on smoke from vegetation and forest fires concluded that most of the 210Po in the aerosol was attached to particles that were <1 µm in size [10,11].
Due to the limited radioactivity monitoring of the atmosphere and, in particular, to scarce research on the natural radionuclides 210Po and 210Pb in the Gulf, few data sets on the levels of these radionuclides in that region are available [18]. Notwithstanding, relatively high levels of 210Po have been reported in aerosols across Kuwait, with the largest fraction of activity values being determined in the fine fraction of aerosol particulates (0.39–2.5 µm size), generally confirming the patterns found elsewhere [32].
Aerosol particulates may include inorganic materials, such as soil dust re-suspended by winds and organic materials, such as hydrocarbons, microbes, and pollen. Biomass and fossil fuel burning are considered the two most important sources of primary organic aerosol particles, while secondary organic particles may originate from smog and combustible particles. A significant fraction of organic materials have also been reported to consist of living matter, such as bacteria, fungi, pollen, and viruses, which are also called bioaerosols [33,34,35,36,37]. However, the role of organic matter and especially the role of microorganisms in aerosols in the bonding of airborne radionuclides is totally unknown.
This study focused on polonium (210Po) and radioactive lead (210Pb) distribution in several particle size classes of atmospheric aerosols and, in each class, their partitioning between the organic and inorganic components, both in an urban environment and in a remote location in the desert of Kuwait. Furthermore, this study addressed the characterization of the organic fraction of aerosols in terms of biological composition.
2. Materials and Methods
2.1. Aerosol Sampling and Sample Treatment
High-Volume Air Samplers (HVAS) with a six-stage cascade impactor (Tisch Environmental Inc., Cleves, OH, USA) were utilized to collect the aerosol samples. Each sample was a 24 h time-integrated particulate aerosol sample corresponding to the filtration of an average air volume of 815 ± 5 m3, passing through the filters with an average flow rate of 0.566 m3/min. The air drawn through the cascade impactor allowed the particulates to be trapped on different filters according to the aerodynamic mean diameter of the aerosol particles.
Two sampling sites were selected, one near the Kuwait–Iraq border and designated as remote site, and the second within the urban area of Kuwait City (Figure 1). The remote sampling site was located 120 km North of Kuwait City, in an agricultural area in the desert, away and upwind of the urban and industrial sources of potential atmospheric pollutants in Kuwait. The sampling site at Kuwait City was located well within the urban perimeter and in the vicinity of the main commercial port and 15 km east of a major power and desalination plant, but not near industrial sources of atmospheric pollutants, most of which are located south of the city. At both sites, winds predominantly come from the NW all year round.
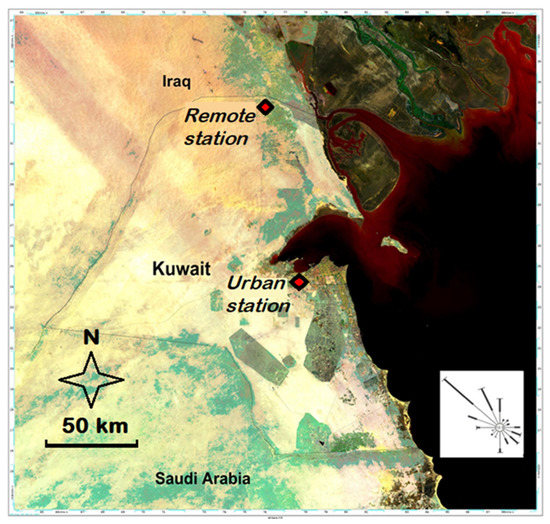
Figure 1.
Location of the remote and urban aerosol sampling stations and wind rose for Kuwait City.
At each of these sampling sites, two samplers were deployed simultaneously to obtain parallel (or replicate) samples, one for determination of 210Po and 210Pb and the other for characterization of the microorganisms in the aerosol particulates. A slotted quartz fiber filter (QFF) TE-230 QZ from Tisch Environment Inc., Cleves, OH, USA with the dimensions of 13.3 cm × 14 cm (5.25-in × 5.5-in) was used as a collection substrate in each of the six stages of the cascade impactor, and a 20.3 cm × 25.4 cm (8-in × 10-in) glass fiber filter (TE-G653 from Tisch Environment Inc., Cleves, OH, USA) was used as a base filter. The sampling was carried out at least monthly and took place during the period from February 2019 to February 2020, with 14 samples (and the replicates) being produced at each site. Originally, each 24 h sample was composed of six size classes of aerosol particulates but because the mass of the samples collected on the individual filters was very small, it was decided to pool some of the cascade filters stages. The samples were pooled into three classes of particulate size fractions: above 10 µm (PM>10), between 2.5 and 10 µm (PM2.5–10), and between 0.39 and 2.5 µm (PM0.39–2.5). Hence, 42 samples, 14 for each of the three size class fractions (and replicates), were obtained from each single sampling site. Sampling was avoided on days with extreme dust resuspension (with visibility under 500 m).
Upon collection, the sample filters were stored in separate cleaned aluminum foil, protected in sealed Ziploc® bags, and transported to the laboratory, where the samples were processed on the same day. The dry weights of the filter before and after the deployment were used to quantify the total mass of the aerosol particulates collected. The filters were weighed using a calibrated Mettler Toledo balance, Columbus, OH, USA (precision ±0.0001 g). From each sampling site, one set of samples was used for 210Po and 210Pb determination, and the replicate set was used for genomic analysis in order to identify the microbial and fungal communities in the aerosols.
2.2. Radioanalytical Procedure
Each of the QFFs for radionuclide analysis was thoroughly brushed with a nylon brush into a Petri dish, and the amount of particulate matter obtained was weighed before and after to correct for losses. The material retrieved was used for analysis. The size-fractionated aerosol samples (PM>10, PM2.5–10, and PM0.39–2.5) were treated to separate the organic and inorganic components, and 210Po and 210Pb were analyzed in each component separately.
For the separation of the organic and inorganic aerosol components, the aerosol sample material was soaked with 30% H2O2 in a 1:3 ratio, and the dissolution of the organic materials (microorganisms) was allowed to proceed for over 24 h [35]. The sample was then filtered through a pre-weighted 0.45 µm nylon filter, and the filter dried at room temperature. The dry weight of the sample retained on the filter was determined gravimetrically and considered to be the inorganic component, while the loss in mass was considered as the weight of the dissolved organic material. Afterwards, the nylon filter with the inorganic deposit was completely digested in 20 mL 69% HNO3. Previous tests have shown that treating filters with H2O2 destroys the microorganisms and dissolves organic molecules. Genomic qPCR tests that were taken of filters with the inorganic fraction were negative, confirming that the large protein molecules had been dissolved, which was in contrast with the non-treated filters where genomic DNA was always present in large amounts. Furthermore, the hydrogen peroxide solution with a neutral pH was determined to be unable to extract 210Po and 210Pb from inorganic soil and sediment particles.
A known activity of 209Po (T1/2 = 103 a), a radioactive isotope of polonium that does not exist in the environment, was added to both the organic and inorganic solutions of the aerosol particulates so that it could be used as an internal isotopic tracer for the determination of polonium (210Po) recovery yield, which varied between 66–90%. The solutions were evaporated and the residue treated with 69% HNO3 to ensure the complete mineralization and oxidation of the sample materials. The solutions were taken again to dryness to eliminate the nitric acid and the residue dissolved in 0.5M HCl followed by the addition of ascorbic acid (50 mg) to reduce the oxidation state of Fe and Mn, and the pH of the solution adjusted to 2. The polonium in the solution was then electroplated onto an Ag planchet at room temperature, and the polonium isotopes determined by alpha spectrometry [38]. An alpha spectrometer Mirion Technologies (Canberra) Inc., Meriden, CT 06450, USA, with eight vacuum chambers equipped with passivated implanted planar silicon (PIPS) detectors with a 450 mm2 surface area (Mirion®) were used for radiometric analysis. This method has been used in previous studies that have been carried out at KISR [14,15,39,40,41,42,43,44,45,46].
After polonium plating, the sample solution was evaporated and the dry residue dissolved in 9 M HCl. This solution was passed through a DOWEX 1X8 ion exchange resin column pre-conditioned with 9 M HCl in order to remove any residual polonium (both 210Po and 209Po) while also allowing the 210Pb to be quantitatively recovered. The eluate fraction containing 210Pb was stored in a sealed HDPE bottle for about 6 months, and the in-grown 210Po from 210Pb radioactive decay, after addition of a new spike of 209Po tracer was plated on a new silver disc. The appropriate decay and in-growth corrections were applied while calculating the 210Po and 210Pb activity in the aerosol sample at the collection date [47].
2.3. Radioanalytical Quality Assurance
Control filters were also deployed during each aerosol sampling campaign, but no air was blown through them. These filters were used as blanks for the analysis of 210Po, 210Pb, and microorganisms. Blank nylon filters, the same type of filters used for the separation of organic and inorganic phases and dissolved with the inorganic fraction, were analyzed for 210Po and 210Pb, and the minimal 210Po-210Pb activity from the blank was deducted from the results of aerosol sample analysis.
As part of the analytical quality assurance procedure, a Certified Reference Material (CRM), IAEA 446–Baltic Sea Seaweed, was analyzed with each batch of samples. The results obtained for this CRM, which was analyzed for 210Po and for 210Pb, varied between 10.1 and 10.5 Bq kg−1, with a median value of 10.4 Bq kg−1. This result compared very well with the 210Pb and 210Po (in secular radioactive equilibrium) information value of 10.9 Bq kg−1, with a 95% confidence interval from 10.2 to 12.0 Bq kg−1, provided in the CRM certificate.
2.4. Microbiological Characterization
The replicate aerosol samples were analyzed for microbial assemblages using a tandem set of 20 samples. Genomic DNA was extracted using the Wizard® Genomic DNA Purification kit (Promega, Madison, WI, USA). Standard Illumina primers were used to amplify the V3 and V4 regions of the 16S rRNA gene and ITS1and ITS2 regions for bacterial and fungal population identification, respectively [48]. The reaction was carried out in Veriti Thermal Cyclers (Applied Biosystems, Grand Island, NY, USA), with the initial DNA polymerase activation taking place at 95 °C for 3 min followed by 35 cycles each for 30 s at 95 °C, 55 °C, and 72 °C, and a final extension step at 72 °C for 5 min. A total of 5 ng of PCR product was used for library preparation using the NEBNext Ultra DNA library preparation kit (New England BioLabs, Genopole, France). The prepared library was sequenced in Illumina HiSeq 2500 (San Diego, CA, USA) with 2 × 250 cycle chemistry. Raw reads (data deposited on NCBI SRA: SUB6214874; BioProject: PRJNA561928 (accessions SRR10128759-SRR10128778) and fungal sequences under the SRA: SUB; BioProject: PRJNA561929 (accessions SRR10481399-SRR10481418)) were processed in order to determine the quality (Fastqc), adapter trimming, and chimera removal. Pre-processed reads from all of the samples were pooled and clustered into OTUs based on their sequence similarity using the Uclust program (similarity cutoff = 0.97) available in Quantative Insight Into Microbial Ecology (QIIME) 2.0 software. The QIIME generated *.biome files were exported to the MicrobiomeAnalyst in order to generate the taxonomy plots and to calculate their relative abundances (RA) [49]. The OTUs that had been generated by QIIME were filtered by applying a sample prevalence of 30% and inter-quartile range of 20%.
3. Results and Discussion
The aerosol samples collected between February 2019 and February 2020 at the two locations are listed in Table 1, with information on the weight of the particulate material collected in each particulate grain size class and the weight of the organic and inorganic components of the aerosols. As the total air volume sampled was equal at both stations every month, the weights of the aerosol samples can be compared directly. The first feature to be noted is that the aerosol sample weights were similar at both sampling sites, with weights averaging 0.9322 ± 0.5405 g at the remote station and 1.0086 ± 0.5368 g at the Kuwait City station. Regarding the aerosol load (mg/m3), the two sampling sites in Kuwait were also not very different from each other. Around the year, the aerosol loads ranged from 0.1690 to 2.4733 mg/m3 at the remote site and from 0.3064 to 2.5653 mg/m3 at the urban site, with higher values generally observed in summer. The percentage of the organic matter in the aerosols was also comparable, representing 15 ± 3% at the remote station and 13% ± 1% at the Kuwait City station (in dry weight).

Table 1.
Aerosol samples: weight (in grams) of total aerosol sample and of organic and inorganic components in each particulate size class.
At both locations, the weight of the finest particle fraction PM0.39–2.5 (organic + inorganic) accounted for most of the aerosol load, with 91 ± 14% at the remote station and 92 ± 4% at the Kuwait City station. The large grain size fraction PM>10 at the remote station accounted for 1–45% of the total aerosol load, while at the city, it always accounted for a smaller percentage, varying from 1–9% of the total aerosol load. Therefore, although the contribution of fine particles was consistently high and dominant at both locations, the variation in the aerosol grain size composition was wider at the remote station than at the city, probably due to episodes of desert dust resuspension.
Results for the 210Po activity concentrations in the aerosol size classes and the organic and inorganic components are shown in Table 2. There was little inter-month fluctuation in terms of the 210Po activity concentration in the aerosols at both stations and, within the experimental uncertainty, the average activity concentrations were not different between locations. The total activity concentrations of 210Po in the aerosols in the three particulate size classes at the remote site and at the urban site were similar. The 210Po per unit mass in the organic component was also identical in both stations and accounted for 88 ± 1% and 89 ± 1% for the 210Po activity concentration in aerosols at the remote and city stations, respectively. A key feature of 210Po distribution was the much higher concentration in the organic component compared to the inorganic component.
Table 2.
Polonium-210 activity concentrations (mBq/g dry weight ± 1σ) in organic and inorganic components of size fractioned aerosol samples.
Results for the 210Pb activity concentrations in aerosols are shown in Table 3. At the two sampling stations, the activity concentrations of 210Pb in the aerosols were comparable in the three particulate size classes and in both the organic and inorganic components, with a mean organic/inorganic ratio of 1.
Table 3.
Lead-210 activity concentrations (mBq/g dry weight ± 1σ) in organic and inorganic components of the size fractioned aerosol samples.
Table 4 displays the 210Po/210Pb activity concentration ratios in the aerosol samples within each size fraction. The main feature is the elevated 210Po/210Pb ratio in the organic components, averaging 5.72 (5.62–5.88), which is in contrast with the 210Po/210Pb ratio of 0.73 (0.71–0.74) in the inorganic component, and this was observed across the three different particulate sizes. Globally, at both stations, the 210Po/210Pb concentration ratio in the organic component of the aerosols was about 8-fold (7.77–8.3) higher than it was in the inorganic component (Table 2).
Table 4.
Polonium/lead (210Po/210Pb) activity concentration ratios in the organic and inorganic components of the size fractionated aerosols.
In the total aerosol samples (all size classes), the annual average 210Po/210Pb ratio was 1.6 (range 1.2–1.9) and 1.4 (range 1.3–1.5) at the remote and at the urban sites, respectively, and this remained remarkably stable throughout the year (Table 5). These 210Po/210Pb ratios are clearly much higher than the radionuclide ratios in the background aerosols and, as the 210Pb concentrations were consistently low, the results show an enhancement of 210Po activity in the atmosphere. These results can be compared with data from the aerosol studies reported for other regions around the world [4,7,9,12,16,23,50,51,52,53,54] (Table 5).
Table 5.
Polonium/lead (210Po/210Pb) activity concentrations (mBq/g) and activity concentration ratios in the total aerosol samples collected at two sampling sites.
It must be noted that in a given location, the 210Po levels in atmospheric aerosols may fluctuate with contributions from natural and anthropogenic sources. The results of 210Po alone do not give sufficient information for the identification of 210Po activity enhancement and potential 210Po sources. For example, at the same station, the 210Po levels in the atmosphere (Bq/m3) may fluctuate throughout the year simply because of variable amounts of re-suspended soil dust. In this case, the 210Po activity concentration in the aerosol (Bq/g) would remain constant over time because the source of the radionuclide is always the soil material, although displaying a fluctuating volume activity concentration (Bq/m3). In such a case, in the atmospheric aerosol, there would be no enhancement in the 210Po concentration compared to the 210Pb concentration.
To detect 210Po enhancement, the 210Po/210Pb ratios in the aerosols also must be determined along with the 210Po activity concentration values. The values of the 210Po/210Pb concentration ratios in the radioactive background levels (with atmospheric radon as the main 210Po and 210Pb source) are much lower than 0.1. Values of 210Po/210Pb ratios > 0.1 are already indicative of a 210Po source(s) other than atmospheric radon, and the 210Po/210Pb ratios > 1 are definitively due to a strong 210Po contribution from other sources. Often, these sources are related to industrial processes that involve high temperatures causing the volatilization of 210Po from combusted materials into the atmosphere. The emission of volatilized 210Po, followed by cooling and condensation onto aerosol particulates with the consequent enhancement of the 210Po/210Pb ratios was described for forest fires, urban waste incinerators, and metal smelters [9,54].
In regions with very high oil and gas refinement and production, such as the Gulf region, the likely sources for 210Po enhancement in aerosols reside in atmospheric emissions from gas flaring and crude oil refining. Furthermore, the results obtained were similar at both sampling stations in Kuwait, which indicates that the enhancement of atmospheric 210Po is not merely from a local point source but it seems to be an enhancement at a regional scale and is probably related to emissions from the entire oil industry around the Gulf.
The composition of aerosol particulates may include diversified materials from several origins, such as soil dust, pollen grains, fungi, microbes, soot, and black carbon from industrial emissions, among others. The contribution of re-suspended soil particles likely accounts for most of the inorganic particulates in all grain size classes. Assuming that the 210Po and 210Pb concentrations that are present in soil materials are generally in close secular radioactive equilibrium (Po/Pb~1), then it is likely that the 210Po contribution from soil dust to the aerosols would be similar to that of the 210Pb concentration as determined in aerosols. The excess of 210Po in aerosol particulates, about 1.2–1.9 times more than 210Pb, thus indicates additional 210Po emissions into the atmosphere. Po-210 released with gas emissions into the atmosphere is rapidly adsorbed onto particles, and potentially into particles of all sizes, primarily by electrostatic forces. The identical percent contribution from the three particle size classes to the total 210Po activity concentration in aerosols indeed suggests that this may occur. Some radioactive lead (210Pb) might also be present in the industrial emissions released into the atmosphere, as reported for fly ash from coal-fired power plants [30], but 210Pb is volatilized at much higher temperatures than 210Po, which renders the 210Pb contribution from anthropogenic sources to be less than the one for 210Po; but also distributed in all particulate size classes.
In the aerosols from Kuwait, it was found that inside each size class while the 210Pb concentration was similar in the organic and inorganic components (Table 3), the 210Po concentration was consistently much higher in the organic component of aerosols (Table 2). This suggests that after the sorption of 210Po ions onto aerosol particulates, there is a mechanism for the re concentration and preferential bonding of 210Po to the organic component of aerosols.
From investigations in aquatic environments, it is known that 210Po displays a very high partitioning coefficient (Kd) and is rapidly removed from the soluble phase through sorption onto suspended particles (Kd = 105) similarly, or even more efficiently than 210Pb (Kd = 104–105), and thus both radionuclides are highly particle reactive [55]. In biological systems, 210Po is known to be accumulated in tissues rich in proteins and in sulphur-containing molecules with a minor accumulation in lipids [19]. In the same biological systems the concentration of 210Pb is much lower than that of 210Po, and it is not particularly concentrated in either proteins or in lipids [56].These features drove the investigation to know more about the organic component of aerosols.
The analysis of aerosol particulates revealed that they were not simply made of organic and mineral particles from soot and soils but, instead, aerosol particulates were very rich in microscopic living forms, mainly bacteria, fungi and virus [57,58,59,60].
The results of the molecular analysis made to characterize the bacteria present in the organic component of aerosols showed dominance of the phylum Proteobacteria (RA-97.6%), including the classes Alpha (RA-26.5%) and Gamma-Proteobacteria (RA-71.0%) (Figure 2). The key orders of Alphaproteobacteria were Caulobacterales (RA-12.8%), Rhizobiales (RA-4.0%), and Sphingomonadales (RA-9.3%), finally culminating into the predominant genus of Brevundimonas (RA-12.5%), Allorhizobium (RA-1.8%), Devosia (RA-0.6%), and Sphingopyxis (RA-2.7%). The class Gamma-proteobacteria was distributed into the main orders of Pseudomonadales (RA-23.8%), Betaprotobacteriales (RA-43.5%), and Oceanospiralles (RA-1.4%). The most prevalent genera in this group were the Pseudomonas (RA-2.5%), Halomonas (1.4%), Massilia (RA-2.4%), and Stenotrophomonas (RA-0.32%).
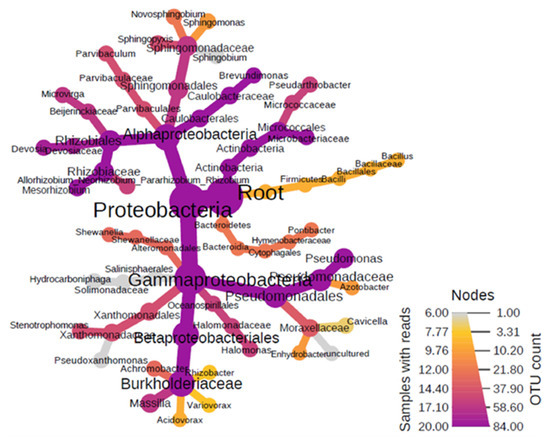
Figure 2.
Heat diagram showing dominant bacterial assemblages within the organic aerosol fractions.
All these bacteria genera belong to both the Gram-negative and Gram-positive bacteria types, and their outer membranes are mainly composed of lipopolysaccharides. It was established that bacteria, especially those involved in sulphur (S) cycle, play a role in the dissolution and mobilization of polonium in rock pore waters and groundwater [61,62] and the 210Po concentration by bacteria seems to be a rather general ability of microorganisms. As the S and Po chemical elements are both members of the Group 16 of the Periodic Table and display similar chemical properties, the bacteria will likely process and concentrate polonium ions as they do with sulphur ions.
The fungal phyla were mainly dominated by Ascomycota (RA-70%), Basidiomycota, and Zygomycota. The Ascomycota were more diverse compared to the other two phyla. The most dominant classes of Ascomycota were Dothideomycetes and Eurotiomycetes followed by the orders Capnodiales, Pleosporales, and Eurotiales (Figure 3). These orders culminated into the three major genera of Aspergillus, Cladosporium, and Alternaria. As for Zygomycota, a single genus, Mucor, subjugated the branch. In Basidimycota, the leading class was Tremellomycetes, which terminated into the genus Cryptococcus. These results show the presence of a great diversity of fungi in aerosols at both stations and throughout the year.
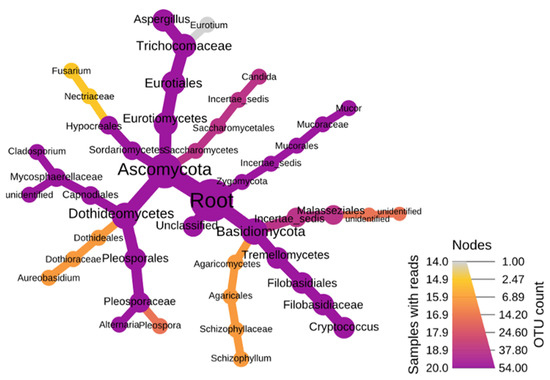
Figure 3.
Heat diagram showing dominant fungal assemblages within the organic aerosol fractions.
Fungi have since long been proven to be regulating radionuclide movement in soils [19,63,64,65,66]. No data are available on the bioconcentration of 210Po in microscopic fungi, but for macroscopic fungi (mushrooms) as well as for liquens, it is known that they concentrate 210Po from the soils and from air [18]. Likewise, the microscopic fungi in aerosols can be expected to concentrate airborne 210Po.
The 210Po concentration in the organic and inorganic components within the three aerosol size fractions at two sites is graphically presented in Figure 4. The graphic shows a minor spatial-temporal variability of 210Po activity in aerosols, and highlights the higher concentration of 210Po in the organic fraction, which was an order of magnitude higher than in the inorganic fraction in all of the three particle size classes and at both sampling sites.
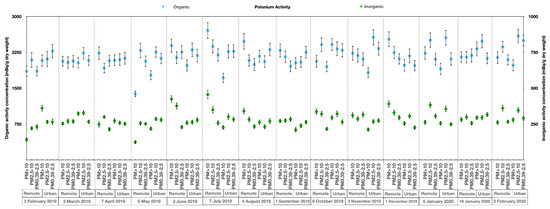
Figure 4.
Polonium (210Po) concentrations in the organic and inorganic components of different aerosol size fractions at both locations. The samples were collected from February 2019 to February 2020; this 210Po study involved 42 samples.
The particulate biological materials in aerosols, or bioaerosols, have not been studied in detail, although they are receiving more attention nowadays due to public health reasons. Bioaerosols contribution to the total aerosol load in the arid climate of Phoenix, USA, was assessed at about 16% to the fine particulate matter PM>2.5 and at about 12% to the PM>10 on a dry weight basis and these seem to be typical values [67]. These percent values are comparable to the amount of organic components that were determined in aerosols in Kuwait (see above), which indicates that most of the organic material in the aerosols on a wet weight basis were bioaerosols. (Note: assuming a dry:wet weight ratio of 0.05–0.10 for bioaerosols, in an aerosol with 15% dw of bioaerosols, these bioaerosols contribute to approximately 65–78% of the aerosol wet weight).
4. Conclusions
Throughout the year, in surface air aerosols in Kuwait the 210Po activity is highly enhanced compared to 210Pb, with the 210Po/210Pb ratio in the total particulates averaging 1.5 (range 1.2–1.9). This ratio is in contrast with reports from many regions around the world, where the natural (or near natural) radioactivity background in aerosols displays 210Po/210Pb ratios < 0.1 (Table 6). In several studies, the 210Po enhancement in aerosols was related to 210Po emissions from industrial sources, volcanic emissions, and forest fires, thus associated with processes involving high temperatures capable of causing the volatilization of 210Po from combusted materials and its release into the atmosphere. This is immediately followed by cooling and 210Po condensation onto aerosol particulates. Therefore, the increase in the 210Po activity in aerosols with simultaneously high 210Po/210Pb ratios (>>0.1), such as those observed in Kuwait, implicates the occurrence of a supplementary 210Po source with continuous atmospheric emissions.
Table 6.
Polonium-210 and 210Pb activity concentrations (mBq/m3, or otherwise indicated) and 210Po/210Pb ratios in surface air at several locations around the world.
In this study, the 210Po/210Pb ratios in aerosols from a remote station in the north of Kuwait and from Kuwait City displayed similar values; thus, the 210Po enhancement in the atmospheric aerosols was not the result of local sources in Kuwait City only but was from transboundary origins. This is likely related to the extensive oil production and specifically to gas flaring and oil refining in the Gulf region, and this 210Po enhancement in aerosols is nowadays a regional feature, and prevails all year round. In a previous investigation on 210Po in the region, one additional sampling station was located south of Kuwait City and was under the influence of emissions from local industry. The 210Po concentrations measured there were slightly higher than at the urban sampling site used in this work, indicating that a 210Po contribution from local industrial sources also exists [32].
The radionuclide analyses showed that airborne 210Po is mostly bound to the organic component of aerosol particulates. The investigation on the composition of organic component of aerosol particulates revealed a great abundance of microscopic fungi and bacteria. Although there is also non-living organic material in aerosols, microorganisms represented about 15% of the dry weight and were estimated to contribute to about 65–78% of the aerosol wet weight. The observed higher 210Po concentration in the aerosol organic component, which was in contrast with the 210Pb equally distributed between organic and inorganic components, implicates that there is an active 210Po concentration by microorganisms in aerosols and not just simple electrostatic adsorption.
We are not aware of any data in the published literature on the partitioning of 210Po and 210Pb among organic and inorganic components and within size-fractionated aerosols. The concentration of 210Po by microorganisms in the aerosols was an unsuspected mechanism, but it efficiently operates the transfer and concentration of atmospheric 210Po into the organic/living component of aerosols, which does not happen with 210Pb.
The enhanced concentration of 210Po in aerosol particulates, especially in the respirable fine fraction of the particulates, may have implications for the radiation exposure of human population. This exposure will be assessed in future work.
Author Contributions
Conceptualization, M.B., F.P.C. and S.U.; methodology, M.B., S.U. and N.H.; formal analysis, M.B., S.U. and N.H.; data curation, M.B., S.U., F.P.C. and N.H.; writing—original draft preparation, review and editing, F.P.C., S.U. and M.B.; visualization, M.B., S.U., F.P.C. and N.H.; funding acquisition, M.B. All authors have read and agreed to the published version of the manuscript.
Funding
This research was funded by Kuwait Institute for Scientific Research, grant number EM090C, and the Kuwait Foundation for Advancement of Sciences, grant number PR18-14-SE-01.
Institutional Review Board Statement
Not applicable.
Informed Consent Statement
Not applicable.
Data Availability Statement
Data are archived at KISR.
Acknowledgments
The authors are thankful to the Kuwait Institute for Scientific Research and to the Kuwait Foundation for Advancement of Sciences for supporting this study.
Conflicts of Interest
The authors declare no conflict of interest.
References
- Baskaran, M. Radon: A Tracer for Geological, Geophysical and Geochemical Studies; Springer International Publishing: Cham, Switzerland, 2016. [Google Scholar]
- Długosz-Lisiecka, M. Excess of 210 polonium activity in the surface urban atmosphere. Part (1) fluctuation of the 210 Po excess in the air. Environ. Sci. Process. Impacts 2015, 17, 458–464. [Google Scholar] [CrossRef]
- Baskaran, M. Po-210 and Pb-210 as atmospheric tracers and global atmospheric Pb-210 fallout: A Review. J. Environ. Radioact. 2011, 102, 500–513. [Google Scholar] [CrossRef] [PubMed]
- Poet, S.E.; Moore, H.E.; Martell, E.A. Lead 210, bismuth 210, and polonium 210 in the atmosphere: Accurate ratio measurement and application to aerosol residence time determination. J. Geophys. Res. Space Phys. 1972, 77, 6515–6527. [Google Scholar] [CrossRef]
- Semertzidou, P.; Piliposian, G.; Appleby, P. Atmospheric residence time of 210Pb determined from the activity ratios with its daughter radionuclides 210Bi and 210Po. J. Environ. Radioact. 2016, 160, 42–53. [Google Scholar] [CrossRef]
- Carvalho, F.P. Origins and concentrations of 222Rn, 210Pb, 210Bi and 210Po in the surface air at Lisbon, Portugal, at the Altantic edge of the European continental landmass. Atmos. Environ. 1995, 29, 1809–1819. [Google Scholar] [CrossRef]
- Ram, K.; Sarin, M. Atmospheric 210Pb, 210Po and 210Po/210Pb activity ratio in urban aerosols: Temporal variability and impact of biomass burning emission. Tellus B Chem. Phys. Meteorol. 2012, 64, 17513. [Google Scholar] [CrossRef][Green Version]
- Yi, Y.; Zhou, P.; Liu, G. Atmospheric deposition fluxes of 7Be, 210Pb and 210Po at Xiamen, China. J. Radioanal. Nucl. Chem. 2007, 273, 157–162. [Google Scholar] [CrossRef]
- Carvalho, F.D.P.; Oliveira, J.M.; Malta, M. Vegetation fires and release of radioactivity into the air. WIT Trans. Biomed. Health 2011, 1, 3–9. [Google Scholar] [CrossRef]
- Carvalho, F.P.; Oliveira, J.M.; Malta, M. Exposure to forest fires, radioactivity and health risks. In Proceedings of the SHO 2012: International Symposium on Occupational Safety and Hygiene, Guimaraes, Portugal, 9–10 February 2012; pp. 126–130. [Google Scholar]
- Carvalho, F.P.; Oliveira, J.M.; Malta, M. Forest Fires and Resuspension of Radionuclides into the Atmosphere. Am. J. Environ. Sci. 2012, 8, 1. [Google Scholar] [CrossRef][Green Version]
- Carvalho, F.P.; Oliveira, J.M.; Malta, M. Exposure to radionuclides in smoke from vegetation fires. Sci. Total Environ. 2014, 472, 421–424. [Google Scholar] [CrossRef] [PubMed]
- Carvalho, F.P. 210Po and 210Pb Intake by the Portuguese Population. Health Phys. 1995, 69, 469–480. [Google Scholar] [CrossRef] [PubMed]
- Uddin, S.; Behbehani, M.; Fowler, S.W.; Al-Ghadban, A.; Dupont, S. Assessment of loss of 210Po from fish and shrimp by cooking and its effect on dose estimates to humans ingesting seafood. J. Environ. Radioact. 2019, 205–206, 1–6. [Google Scholar] [CrossRef] [PubMed]
- Uddin, S.; Fowler, S.; Behbehani, M.; Metian, M. 210Po bioaccumulation and trophic transfer in marine food chains in the northern Arabian Gulf. J. Environ. Radioact. 2017, 174, 23–29. [Google Scholar] [CrossRef] [PubMed]
- UNSCEAR. Sources and Effects of Ionizing Radiation; United Nations Scientific Committee on the Effects of Atomic Radiation: New York, NY, USA, 2000; Volume 1, 654p. [Google Scholar]
- Eckerman, K.; Harrison, J.; Menzel, H.-G.; Clement, C.H. Compendium of Dose Coefficients based on ICRP Publication 60; International Commission on radiological Protection: Stockholm, Sweden, 2012; Publication 119. [Google Scholar]
- Behbehani, M.; Uddin, S.; Al-Rashed, Z.; Sajid, S.; Al-Shemmari, A.; Alam, F.; Kurian, A. Atmospheric Concentration of 210-Pb, 210-Bi, and 210-Po in Kuwait; Kuwait Institute for Scientific Research: Kuwait City, Kuwait, 2019; EM090C; KISR15772; 18p. [Google Scholar]
- Carvalho, F.; Fernandes, S.; Fesemko, S.; Holm, E.; Howard, B.; Martin, P.; Phaneuf, M.; Porcelli, D.; Prohl, G.; Twining, J. The Environmental Behavior of Polonium; Technical Report Series No. 484; International Atomic Energy Agency: Vienna, Austria, 2017. [Google Scholar]
- Długosz-Lisiecka, M. Excess of polonium-210 activity in the surface urban atmosphere. Part 2: Origin of 210Po excess. Environ. Sci. Process. Impacts 2015, 17, 465–470. [Google Scholar] [CrossRef] [PubMed]
- Długosz-Lisiecka, M. The sources and fate of 210Po in the urban air: A review. Environ. Int. 2016, 94, 325–330. [Google Scholar] [CrossRef] [PubMed]
- Carvalho, F.P. Tobacco Smoking, Indoor Exposure and the Lung Radioactivity. In Proceedings of the SHO2009: International Symposium on Occupational Safety and Hygiene, Guimaraes, Portugal, 5–6 February 2009; pp. 131–135. [Google Scholar]
- Behbehani, M.; Uddin, S. Atmospheric Concentrations of 210Pb, 210Bi and 210Po in Kuwait; Final Report KISR16567; Kuwait Institute for Scientific Research: Kuwait City, Kuwait, 2021; 38p. [Google Scholar]
- Carvalho, F.P.; Oliveira, J.M. Polonium in Cigarette Smoke and Radiation Exposure of Lungs. Czech J. Phys. 2006, 56, D697–D703. [Google Scholar] [CrossRef]
- Carvalho, F.P.; Oliveira, J.M. Natural radioisotopes Pa-210 and Pb-210 in human hair as an indicator of exposure. Metal Ions Biol. Med. 2006, 9, 570–576. [Google Scholar]
- Carvalho, F.P.; Oliveira, J.M.; Malta, M.; Lemos, M.E. Radioanalytical assessment of environmental contamination around non-remediated uranium mining legacy site and radium mobility. J. Radioanal. Nucl. Chem. 2013, 299, 119–125. [Google Scholar] [CrossRef]
- Church, T.; Rigaud, S.; Baskaran, M.; Kumar, A.; Friedrich, J.; Masque, P.; Puigcorbé, V.; Kim, G.; Radakovitch, O.; Hong, G.; et al. Intercalibration studies of210Po and210Pb in dissolved and particulate seawater samples. Limnol. Oceanogr. Methods 2012, 10, 776–789. [Google Scholar] [CrossRef]
- Du, J.; Du, J.; Baskaran, M.; Bi, Q.; Huang, D.; Jiang, Y. Temporal variations of atmospheric depositional fluxes of 7Be and 210Pb over 8 years (2006–2013) at Shanghai, China, and synthesis of global fallout data. J. Geophys. Res. Atmos. 2015, 120, 4323–4339. [Google Scholar] [CrossRef]
- Kim, G.; Hong, Y.-L.; Jang, J.; Lee, I.; Hwang, D.-W.; Yang, H.-S. Evidence for anthropogenic 210Po in the urban at-mosphere of Seoul, Korea. Environ. Sci. Technol. 2005, 39, 1519–1522. [Google Scholar] [CrossRef]
- Tadmor, J. Radioactivity from coal-fired power plants: A review. J. Environ. Radioact. 1986, 4, 177–204. [Google Scholar] [CrossRef]
- Suzuki, T.; Maruyama, Y.; Nakayama, N.; Yamada, K.; Ohta, K. Measurement of the 210Po/210Pb activity ratio in size fractionated aerosols from the coast of the Japan sea. Atmos. Environ. 1999, 33, 2285–2288. [Google Scholar] [CrossRef]
- Behbehani, M.; Uddin, S.; Baskaran, M. 210Po concentration in different size fractions of aerosol likely contribution from industrial sources. J. Environ. Radioact. 2020, 222, 106323. [Google Scholar] [CrossRef] [PubMed]
- Jacobson, M.C.; Hansson, H.-C.; Noone, K.J.; Charlson, R.J. Organic atmospheric aerosols: Review and state of the science. Rev. Geophys. 2000, 38, 267–294. [Google Scholar] [CrossRef]
- Hyde, P.; Mahalov, A. Contribution of bioaerosols to airborne particulate matter. J. Air Waste Manag. Assoc. 2019, 70, 71–77. [Google Scholar] [CrossRef] [PubMed]
- Habibi, N.; Uddin, S.; Al-Salameen, F.; Al-Amad, S.; Kumar, V.; Otaibi, M. Identification and Characterization of Novel Corona and Associated Respiratory Viruses in Aerosols; Final Report KISR16345; Kuwait Institute for Scientific Research: Kuwait City, Kuwait, 2021. [Google Scholar]
- Al Salameen, F.; Habibi, N.; Uddin, S.; Mataqi, K.; Al Amad, S.; Kumar, V.; Al Doaij, B.; Al Ali, E. Characterization and Identification of Micro- Organisms Associated with Airborne Dust in Kuwait Final Report (EM075C); Final Report KISR15959; Kuwait Institute for Scientific Research: Kuwait City, Kuwait, 2020. [Google Scholar]
- Al Salameen, F.; Habibi, N.; Uddin, S.; Al Mataqi, K.; Kumar, V.; Al Doaij, B.; Al Amad, S.; Al Ali, E.; Shirshikhar, F. Spatio-temporal variations in bacterial and fungal community associated with dust aerosol in Kuwait. PLoS ONE 2020, 15, e0241283. [Google Scholar] [CrossRef] [PubMed]
- Lee, H.M.; Hong, G.H.; Baskaran, M.; Kim, S.H.; Kim, Y.I. Evaluation of plating conditions for the recovery of 210Po on a Ag planchet. Appl. Radiat. Isot. 2014, 90, 170–176. [Google Scholar] [CrossRef] [PubMed]
- Al Ghadban, A.; Uddin, S.; Aba, A.; Behbehani, M. Baseline Radionuclide Specific Activity in Commercial Fishes of Kuwait. Aquat. Ecosyst. Health Manag. 2012, 15 (Suppl. 1), 45–49. [Google Scholar] [CrossRef]
- Al-Ghadban, A.; Uddin, S.; Aba, A.; Al Shamroukh, D.; Al Mutairi, A.; Al Khabbaz, A.; Behbehani, M. Measurement and Assessment of Radionuclide Concentration in the Coastal Marine Environment; Final Report KISR10540; Kuwait Institute for Scientific Research: Kuwait City, Kuwait, 2010; pp. 1–49. [Google Scholar]
- Uddin, S.; Al Ghadban, A. Environmental Impact Assessment for Land Sand Burrow Pit—Mubarak Al Kabeer Seaport Project; Technical Report; Kuwait Institute for Scientific Research: Kuwait City, Kuwait, 2011; EM021S; p. 30. [Google Scholar]
- Uddin, S.; Al Ghadban, A.N.; Aba, A.; Behbehani, M. Concentration of selected radionuclides in seawater from Kuwait. Mar. Pollut. Bull. 2012, 64, 1261–1264. [Google Scholar] [CrossRef] [PubMed]
- Uddin, S.; Bebhehani, M.; Sajid, S.; Karam, Q. Concentration of 210Po and 210Pb in macroalgae from the northern Gulf. Mar. Pollut. Bull. 2019, 145, 474–479. [Google Scholar] [CrossRef]
- Uddin, S.; Behbehani, M. Concentrations of selected radionuclides and their spatial distribution in marine sediments from the northwestern Gulf, Kuwait. Mar. Pollut. Bull. 2018, 127, 73–81. [Google Scholar] [CrossRef]
- Uddin, S.; Behbehani, M.; Al-Ghadban, A.; Sajid, S.; Al-Zekri, W.; Ali, M.; Al-Jutaili, S.; Al-Musallam, L.; Vinod, V.; Al-Murad, M.; et al. 210Po concentration in selected calanoid copepods in the northern Arabian Gulf. Mar. Pollut. Bull. 2018, 133, 861–864. [Google Scholar] [CrossRef]
- Uddin, S.; Behbehani, M.; Al-Ghadban, A.; Sajid, S.; Kumar, V.V.; Al-Musallam, L.; Al-Zekri, W.; Ali, M.; Al-Julathi, S.; Al-Murad, M.; et al. 210Po concentration in selected diatoms and dinoflagellates in the northern Arabian Gulf. Mar. Pollut. Bull. 2018, 129, 343–346. [Google Scholar] [CrossRef]
- Baskaran, M.; Church, T.M.; Hong, G.-H.; Kumar, A.; Qiang, M.; Choi, H.-Y.; Rigaud, S.; Maiti, K. Effects of flow rates and composition of the filter, and decay/ingrowth correction factors involved with the determination of in situ particulate 210Po and 210Pb in seawater. Limnol. Oceanogr. Methods 2013, 11, 126–138. [Google Scholar] [CrossRef]
- Caporaso, J.G.; Kuczynski, J.; Stombaugh, J.; Bittinger, K.; Bushman, F.D.; Costello, E.K.; Fierer, N.; Peña, A.G.; Goodrich, J.K.; Gordon, J.I.; et al. QIIME allows analysis of high-throughput community sequencing data. Nat. Methods 2010, 7, 335–336. [Google Scholar] [CrossRef] [PubMed]
- Dhariwal, A.; Chong, J.; Habib, S.; King, I.L.; Agellon, L.B.; Xia, J. MicrobiomeAnalyst: A web-based tool for comprehensive statistical, visual and meta-analysis of microbiome data. Nucleic Acids Res. 2017, 45, W180–W188. [Google Scholar] [CrossRef] [PubMed]
- McNeary, D.; Baskaran, M. Residence times and temporal variations of 210Po in aerosols and precipitation from south-eastern Michigan, United States. J. Geophys. Res. Atmos. 2007, 112. [Google Scholar] [CrossRef]
- Dueñas, C.; Fernández, M.; Carretero, J.; Liger, E. Natural radioactivity levels in atmospheric air in Málaga (Spain). Appl. Radiat. Isot. 1996, 47, 1077–1080. [Google Scholar] [CrossRef]
- Baskaran, M.; Shaw, G.E. Residence time of arctic haze aerosols using the concentrations and activity ratios of 210Po, 210Pb and 7Be. J. Aerosol Sci. 2001, 32, 443–452. [Google Scholar] [CrossRef]
- Długosz-Lisiecka, M.; Bem, H. Determination of the mean aerosol residence times in the atmosphere and additional 210Po input on the base of simultaneous determination of 7Be, 22Na, 210Pb, 210Bi and 210Po in urban air. J. Radioanal. Nucl. Chem. 2012, 293, 135–140. [Google Scholar] [CrossRef] [PubMed]
- Jia, G. The Radiological Impact of 210Pb and 210Po Released from the Iron- and Steel-Making Plant ILVA in Taranto (Italy) on the Environment and the Public. J. Chem. 2013, 2013, 964310. [Google Scholar] [CrossRef]
- IAEA. Sediment Distribution Coefficients and Concentration Factors for Biota in the Marine Environment; International Atomic Energy Agency: Vienna, Austria, 2004; p. 95. [Google Scholar]
- Carvalho, F.P.; Oliveira, J.M.; Alberto, G. Factors affecting 210Po and 210Pb activity concentrations in mussels and implications for environmental bio-monitoring programmes. J. Environ. Radioact. 2011, 102, 128–137. [Google Scholar] [CrossRef] [PubMed]
- Habibi, N.; Behbehani, M.; Uddin, S.; Al Salamin, F.; Shajan, A.; Zakir, F. A safe and effective sample collection method for assessment of SARSCoV2 in aerosol samples. In Environmental Resilience and Transformation in Times of COVID-19; Ramanathan, A.L., Chidambaram, S., Jonathan, M.P., Munoz-Arriola, F., Prasanna, M.V., Kumar, P., Eds.; Elsevier: Amsterdam, The Netherlands, 2021; pp. 194–199. [Google Scholar]
- Habibi, N.; Uddin, S.; Al-Salameen, F.; Al-Amad, S.; Kumar, V.; Al-Otaibi, M.; Razzak, N.A.; Sajan, A.; Shirshikar, F. SARS-CoV-2, other respiratory viruses and bacteria in aerosols: Report from Kuwait’s hospitals. Indoor Air 2021, 31, 1815–1825. [Google Scholar] [CrossRef]
- Habibi, N.; Uddin, S.; Salameen, F.A.; Behbehani, M.; Shirshikhar, F.; Razzack, N.A.; Shajan, A.; Zakir Hussain, F. Collection of Bacterial Community Associated with Size Fractionated Aerosols from Kuwait. Data 2021, 6, 123. [Google Scholar] [CrossRef]
- Behbehani, M.; Uddin, S.; Habibi, N.; Al-Salameen, F.; Sajid, S.; Anbdulrazack, N.; Zakir, F.; Shrishsikar, F. 210Po in Ultrafine Aerosol Particles and Its Likelihood to Mutate the Microbial Community; Research Final Report; Kuwait Institute for Scientific Research: Kuwait City, Kuwait, 2021; FB160C KISR 16733; 42p. [Google Scholar]
- Cherrier, J.; Burnett, W.C.; LaRock, P.A. Uptake of polonium and sulfur by bacteria. Geomicrobiol. J. 1995, 13, 103–115. [Google Scholar] [CrossRef]
- Larock, P.; Hyun, J.-H.; Boutelle, S.; Burnett, W.; Hull, C. Bacterial mobilization of polonium. Geochim. Cosmochim. Acta 1996, 60, 4321–4328. [Google Scholar] [CrossRef]
- Osburn, W.S. Ecological concentration of nuclear fallout in a Colorado mountain watershed. In Radiological Concentration Process; Hungate, A.A., Ed.; Pergamon Press: New York, NY, USA, 1967; pp. 675–709. [Google Scholar]
- Heal, O.W.; Horrill, A.D. Terrestrial ecosystems: An ecological context for radionuclide research. In Ecological Aspects of Radionuclide Release; Coughtree, P.J., Ed.; Blackwell Scientific: Oxford, UK, 1983; pp. 31–46. [Google Scholar]
- Ávila, R.; Moberg, L. A systematic approach to the migration of 137Cs in forest ecosystems using interaction matrices. J. Environ. Radioact. 1999, 45, 271–282. [Google Scholar] [CrossRef]
- Dighton, J.; Tugay, T.; Zhdanova, N. Interactions of Fungi and Radionuclides in Soil. In Microbiology of Extreme Soils; Dion, P., Nautiyal, C.S., Eds.; Springer: Berlin/Heidelberg, Germany, 2008; Volume 13, pp. 333–355. [Google Scholar]
- Boreson, J.; Dillner, A.M.; Peccia, J. Correlating bioaerosol load with PM2.5 and PM10cf concentrations: A comparison between natural desert and urban-fringe aerosols. Atmos. Environ. 2004, 38, 6029–6041. [Google Scholar] [CrossRef]
Publisher’s Note: MDPI stays neutral with regard to jurisdictional claims in published maps and institutional affiliations. |
© 2021 by the authors. Licensee MDPI, Basel, Switzerland. This article is an open access article distributed under the terms and conditions of the Creative Commons Attribution (CC BY) license (https://creativecommons.org/licenses/by/4.0/).