
Study of Relationships between Ceiling Smoke Leakage Rate and Evacuation Time in the Ward


Abstract
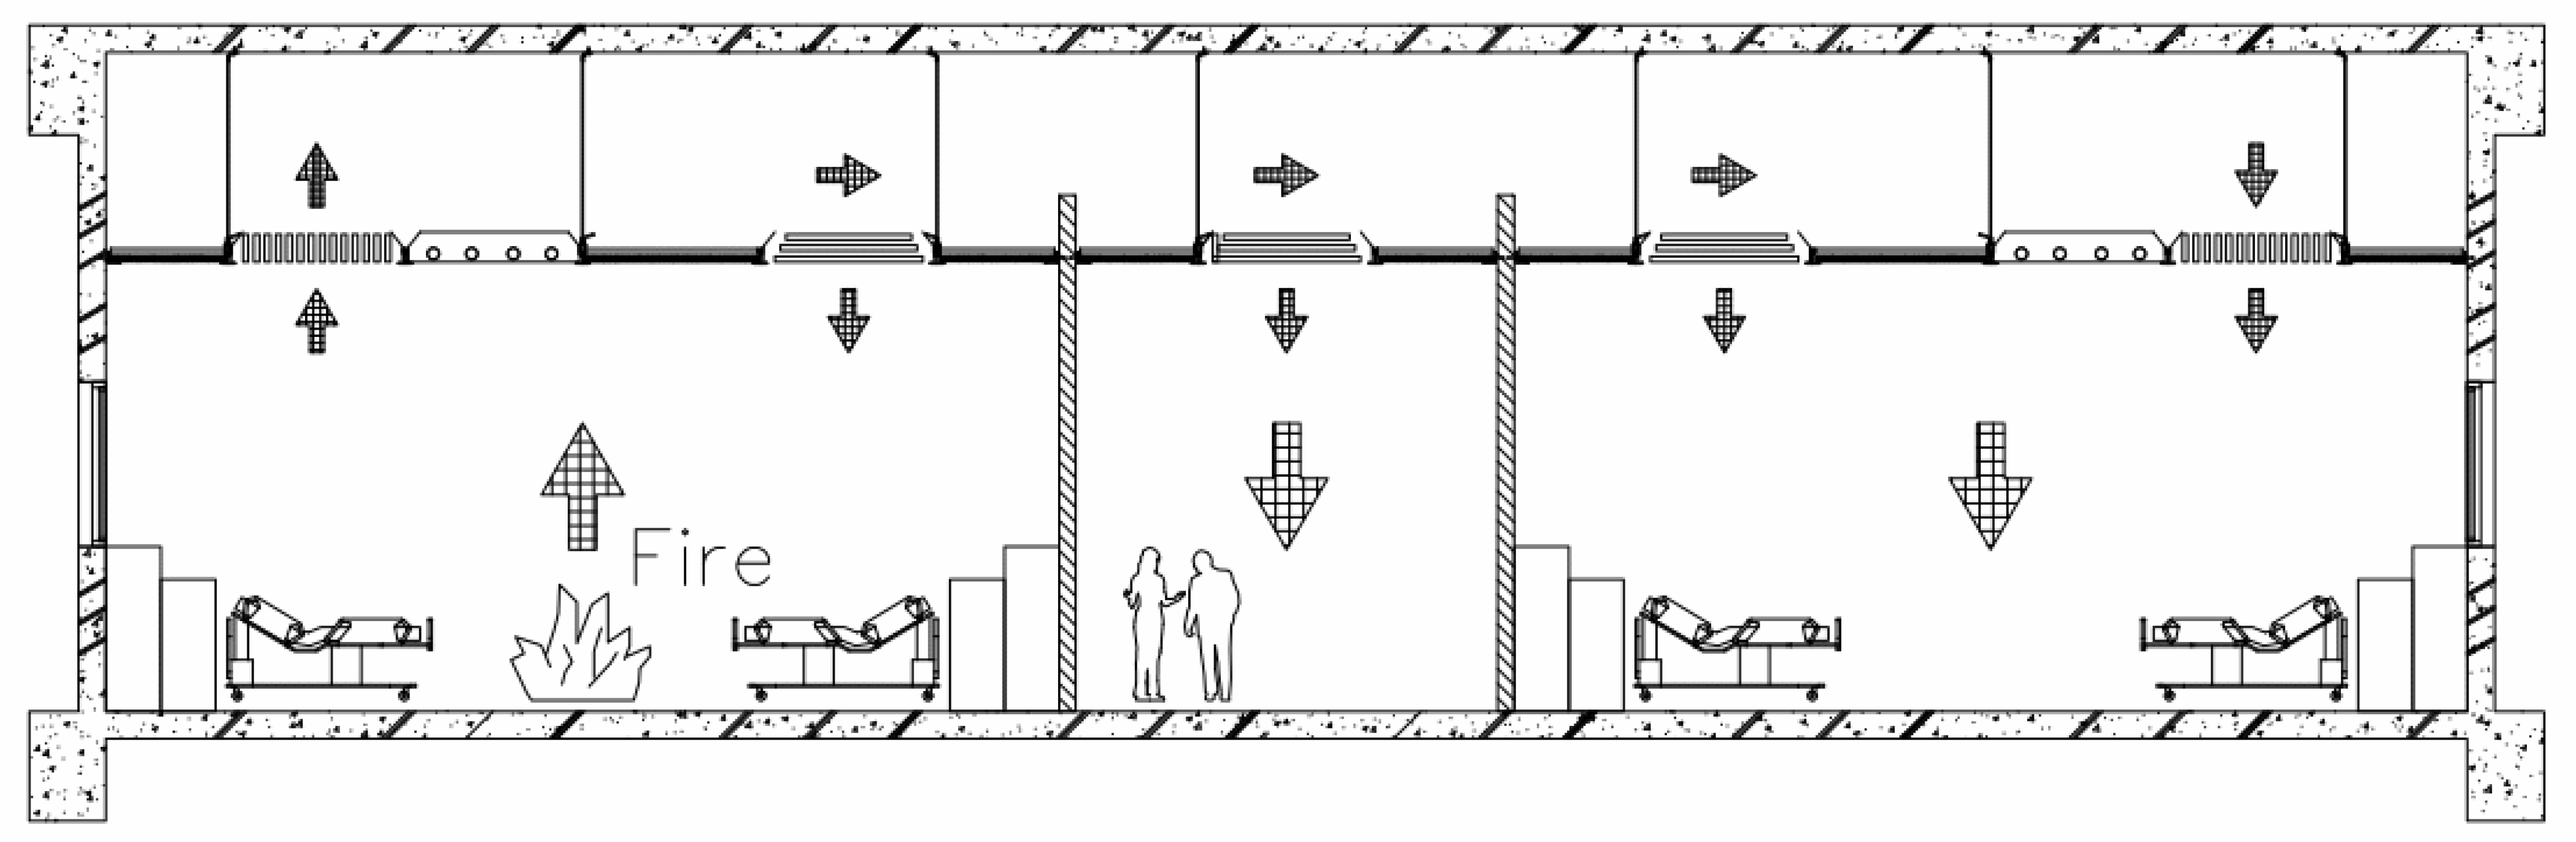
:1. Introduction
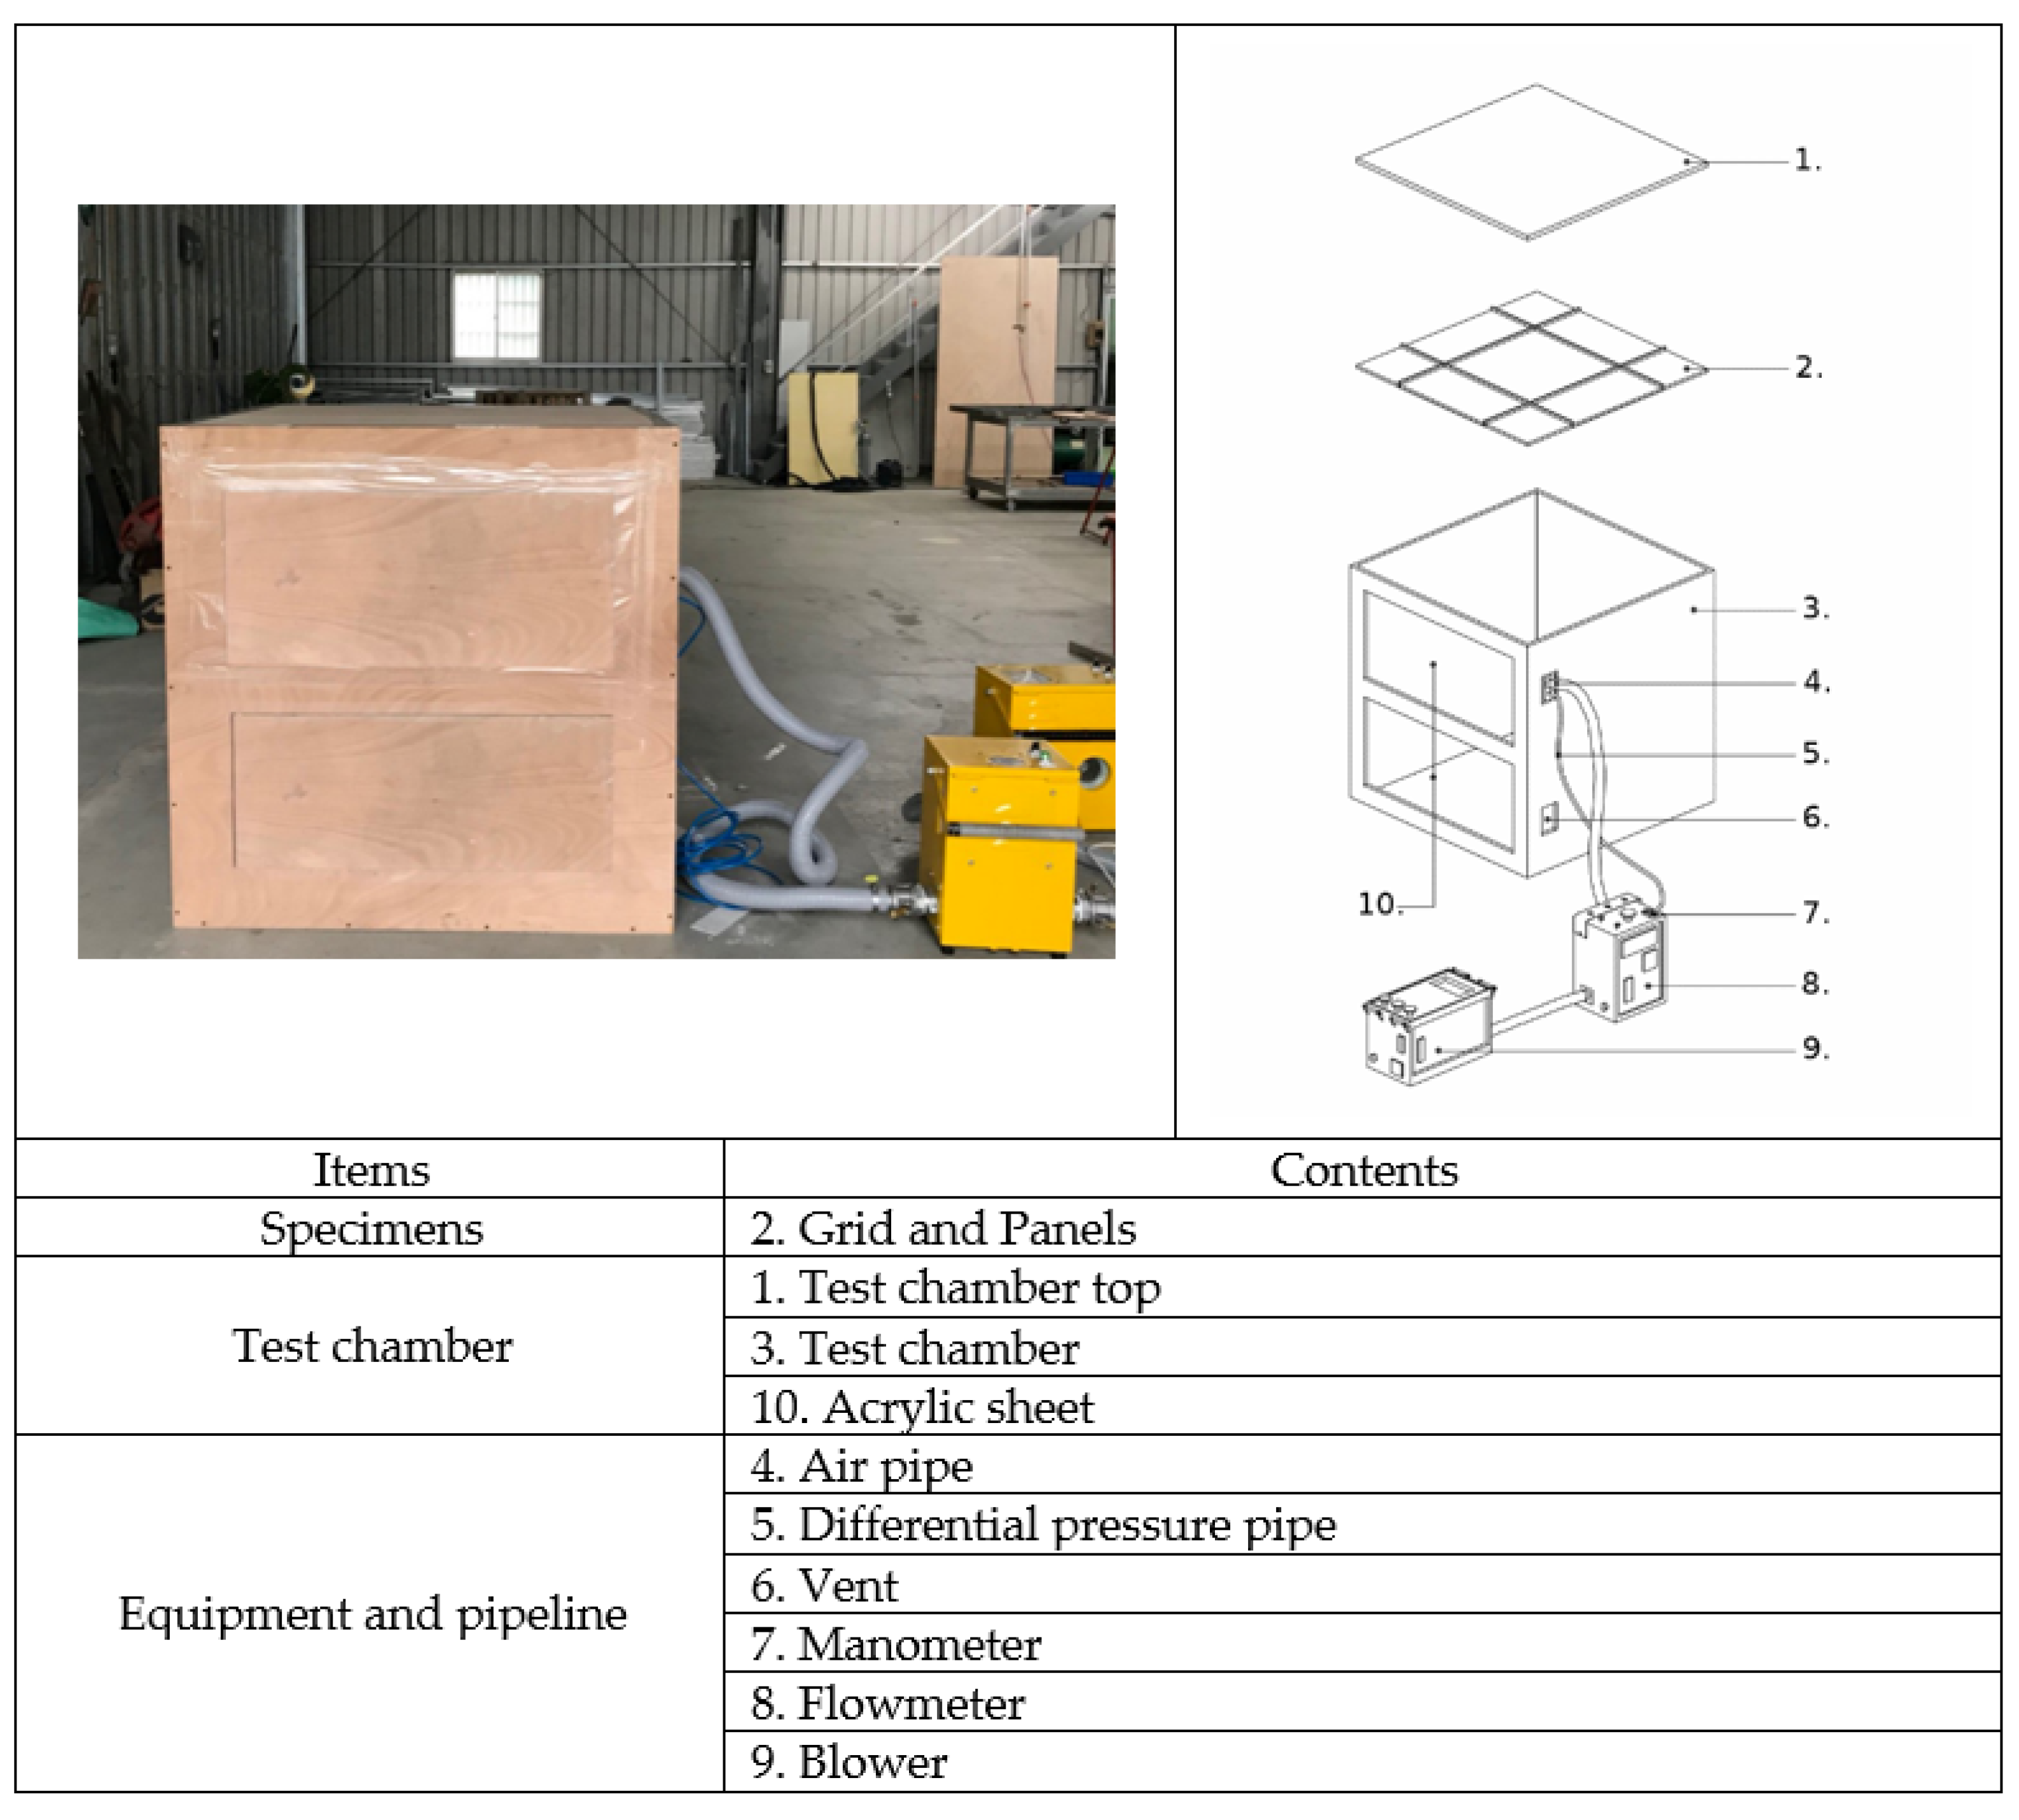
2. Experimental Description
2.1. Experimental Design
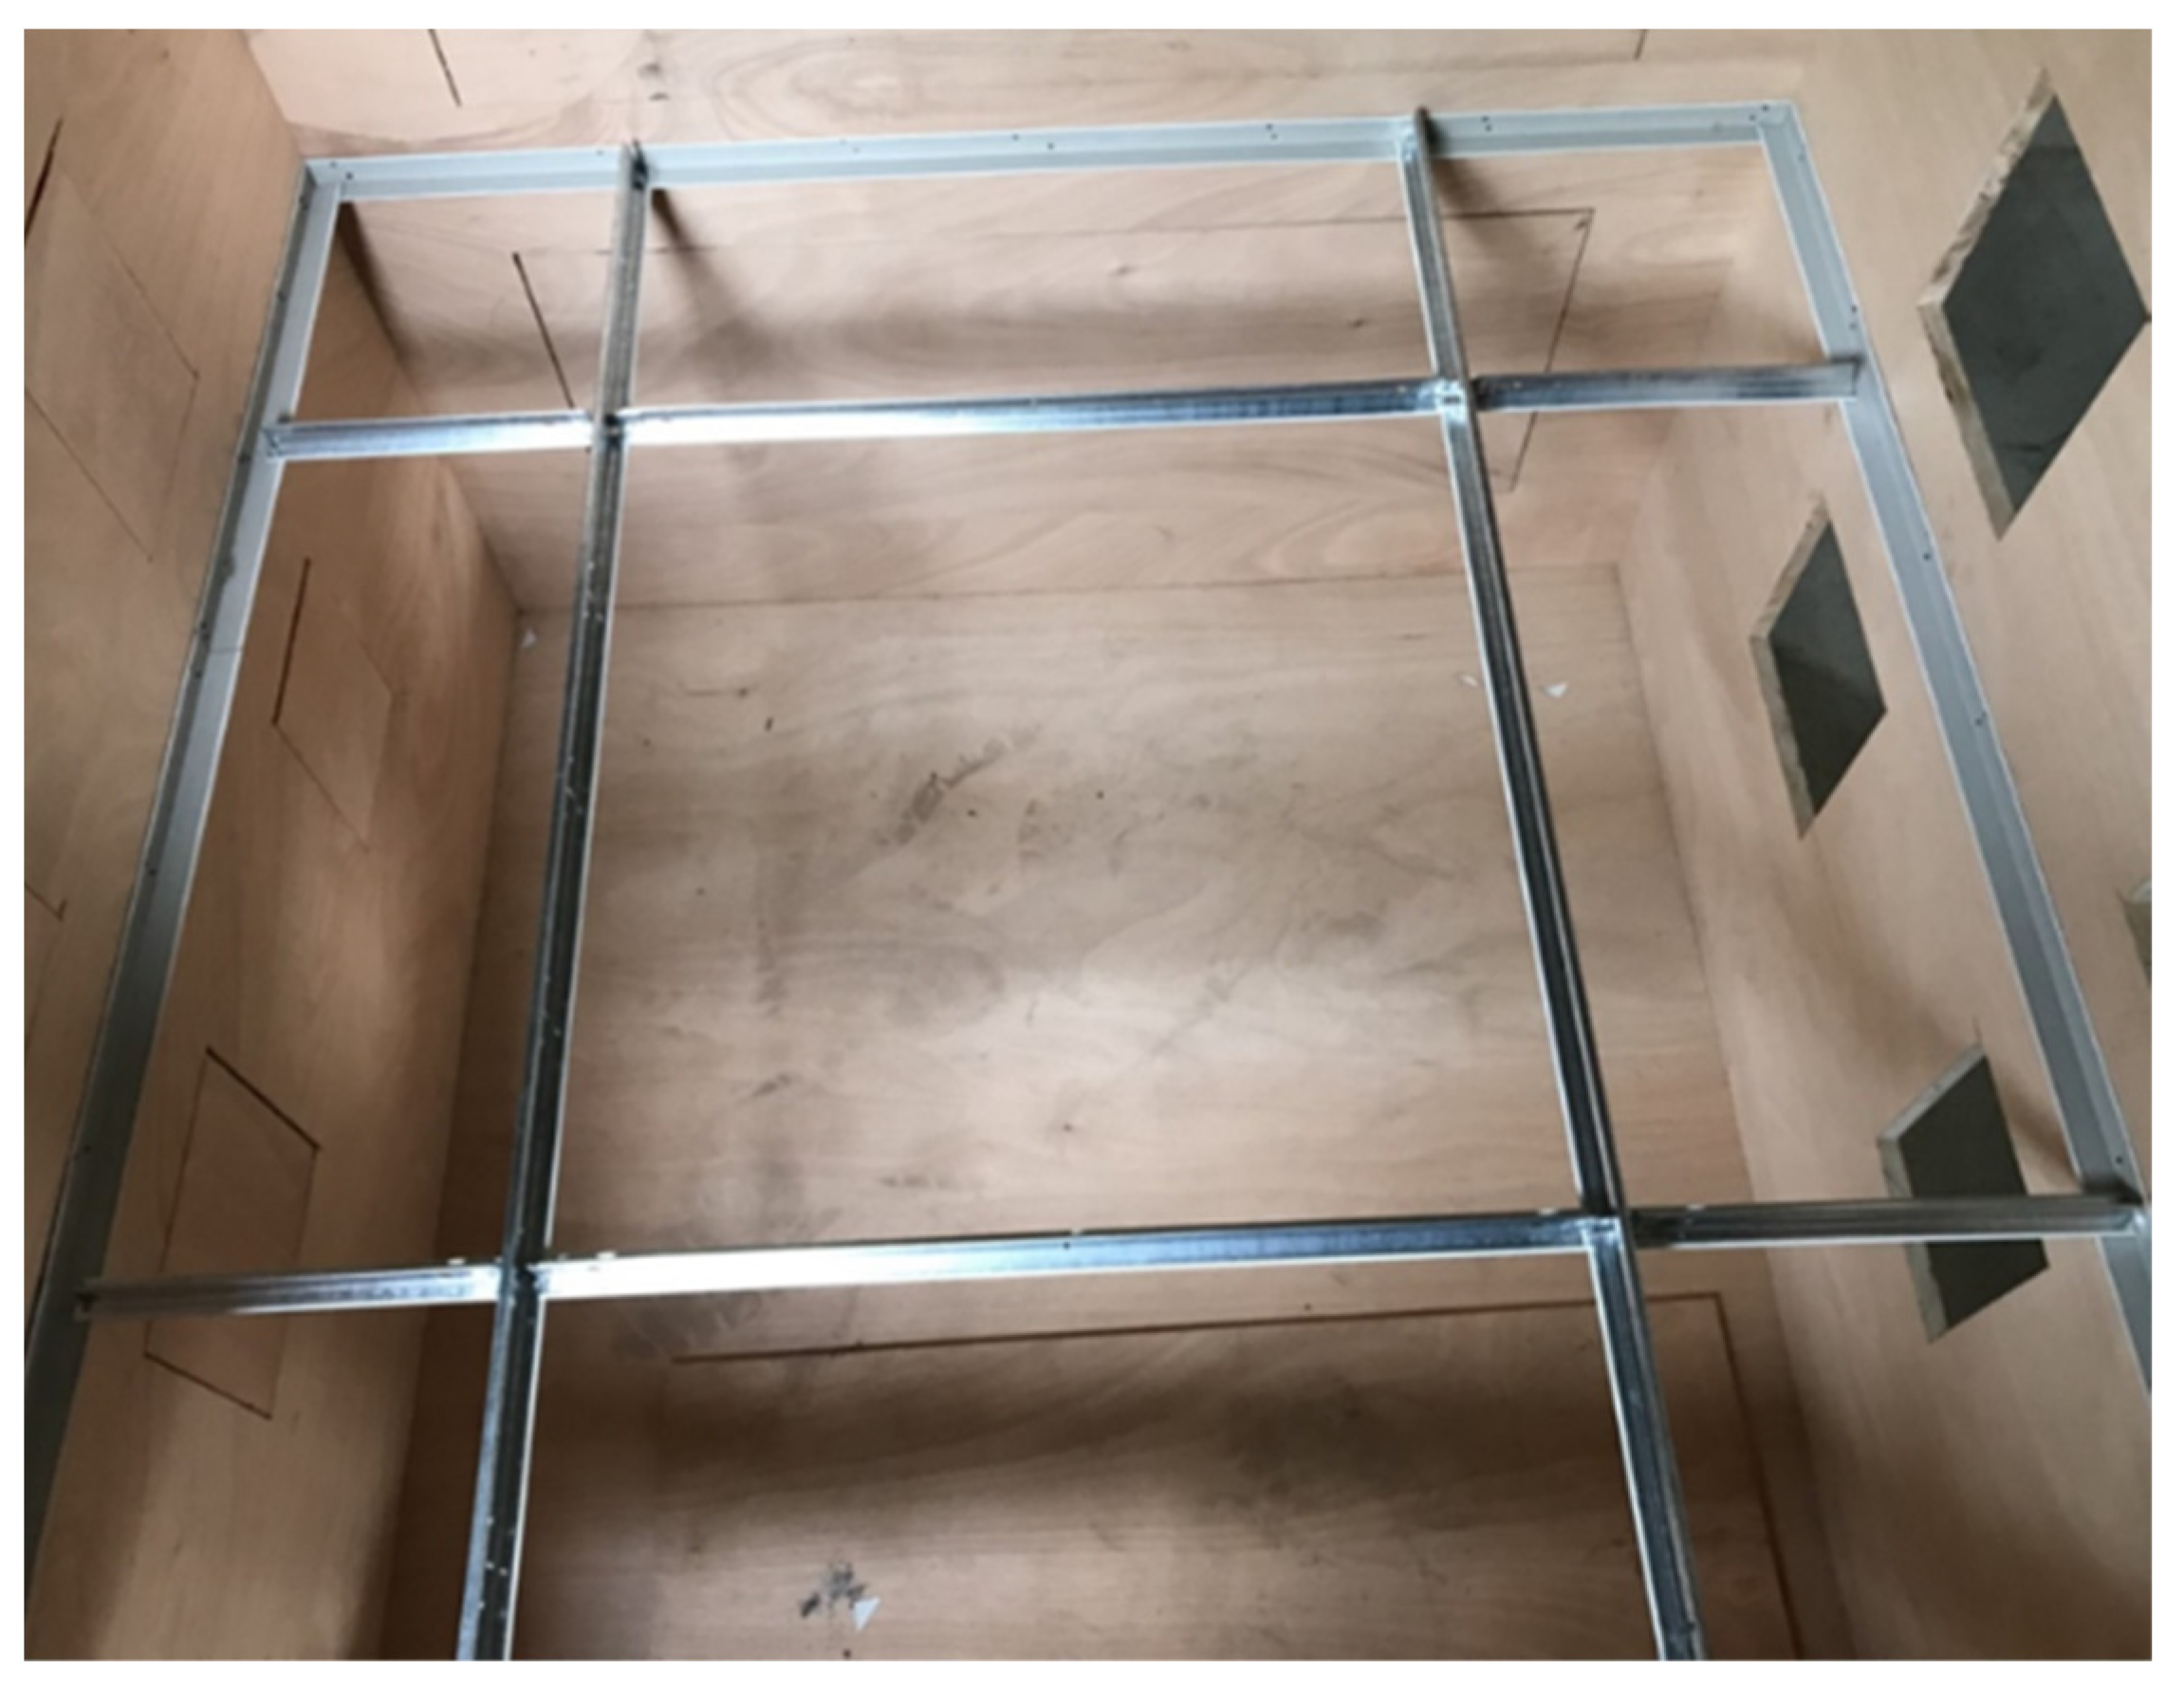
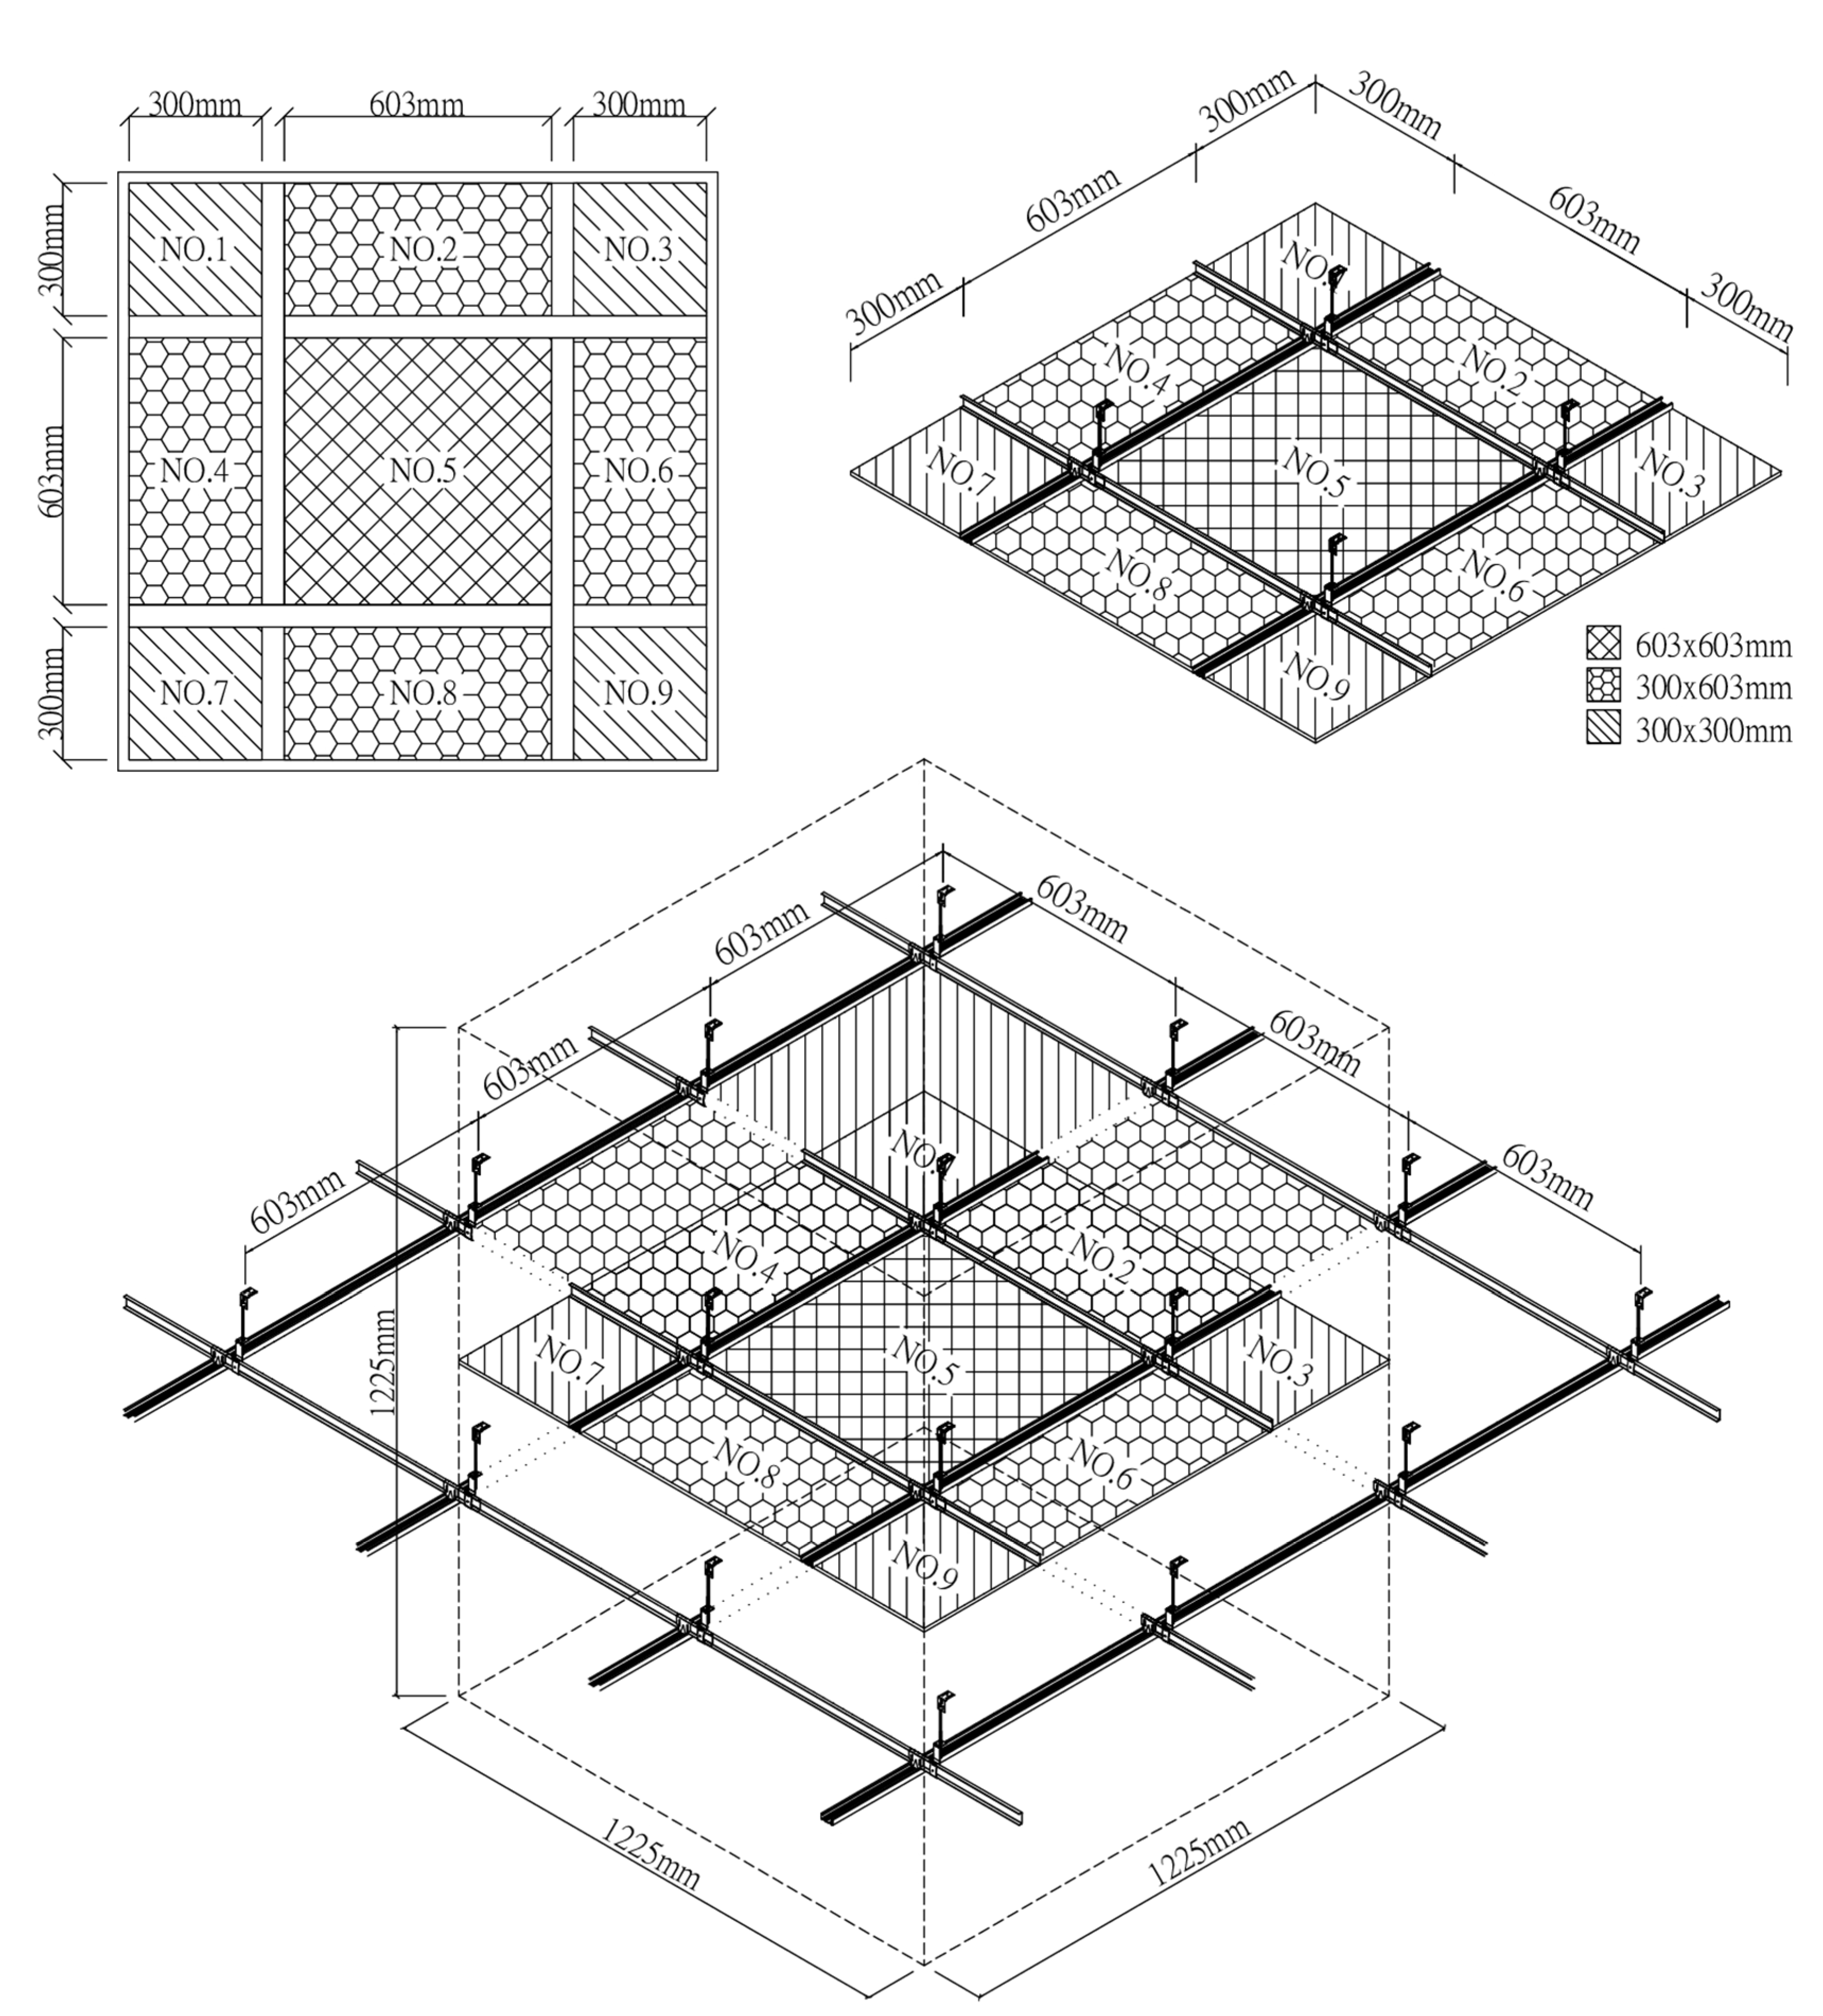
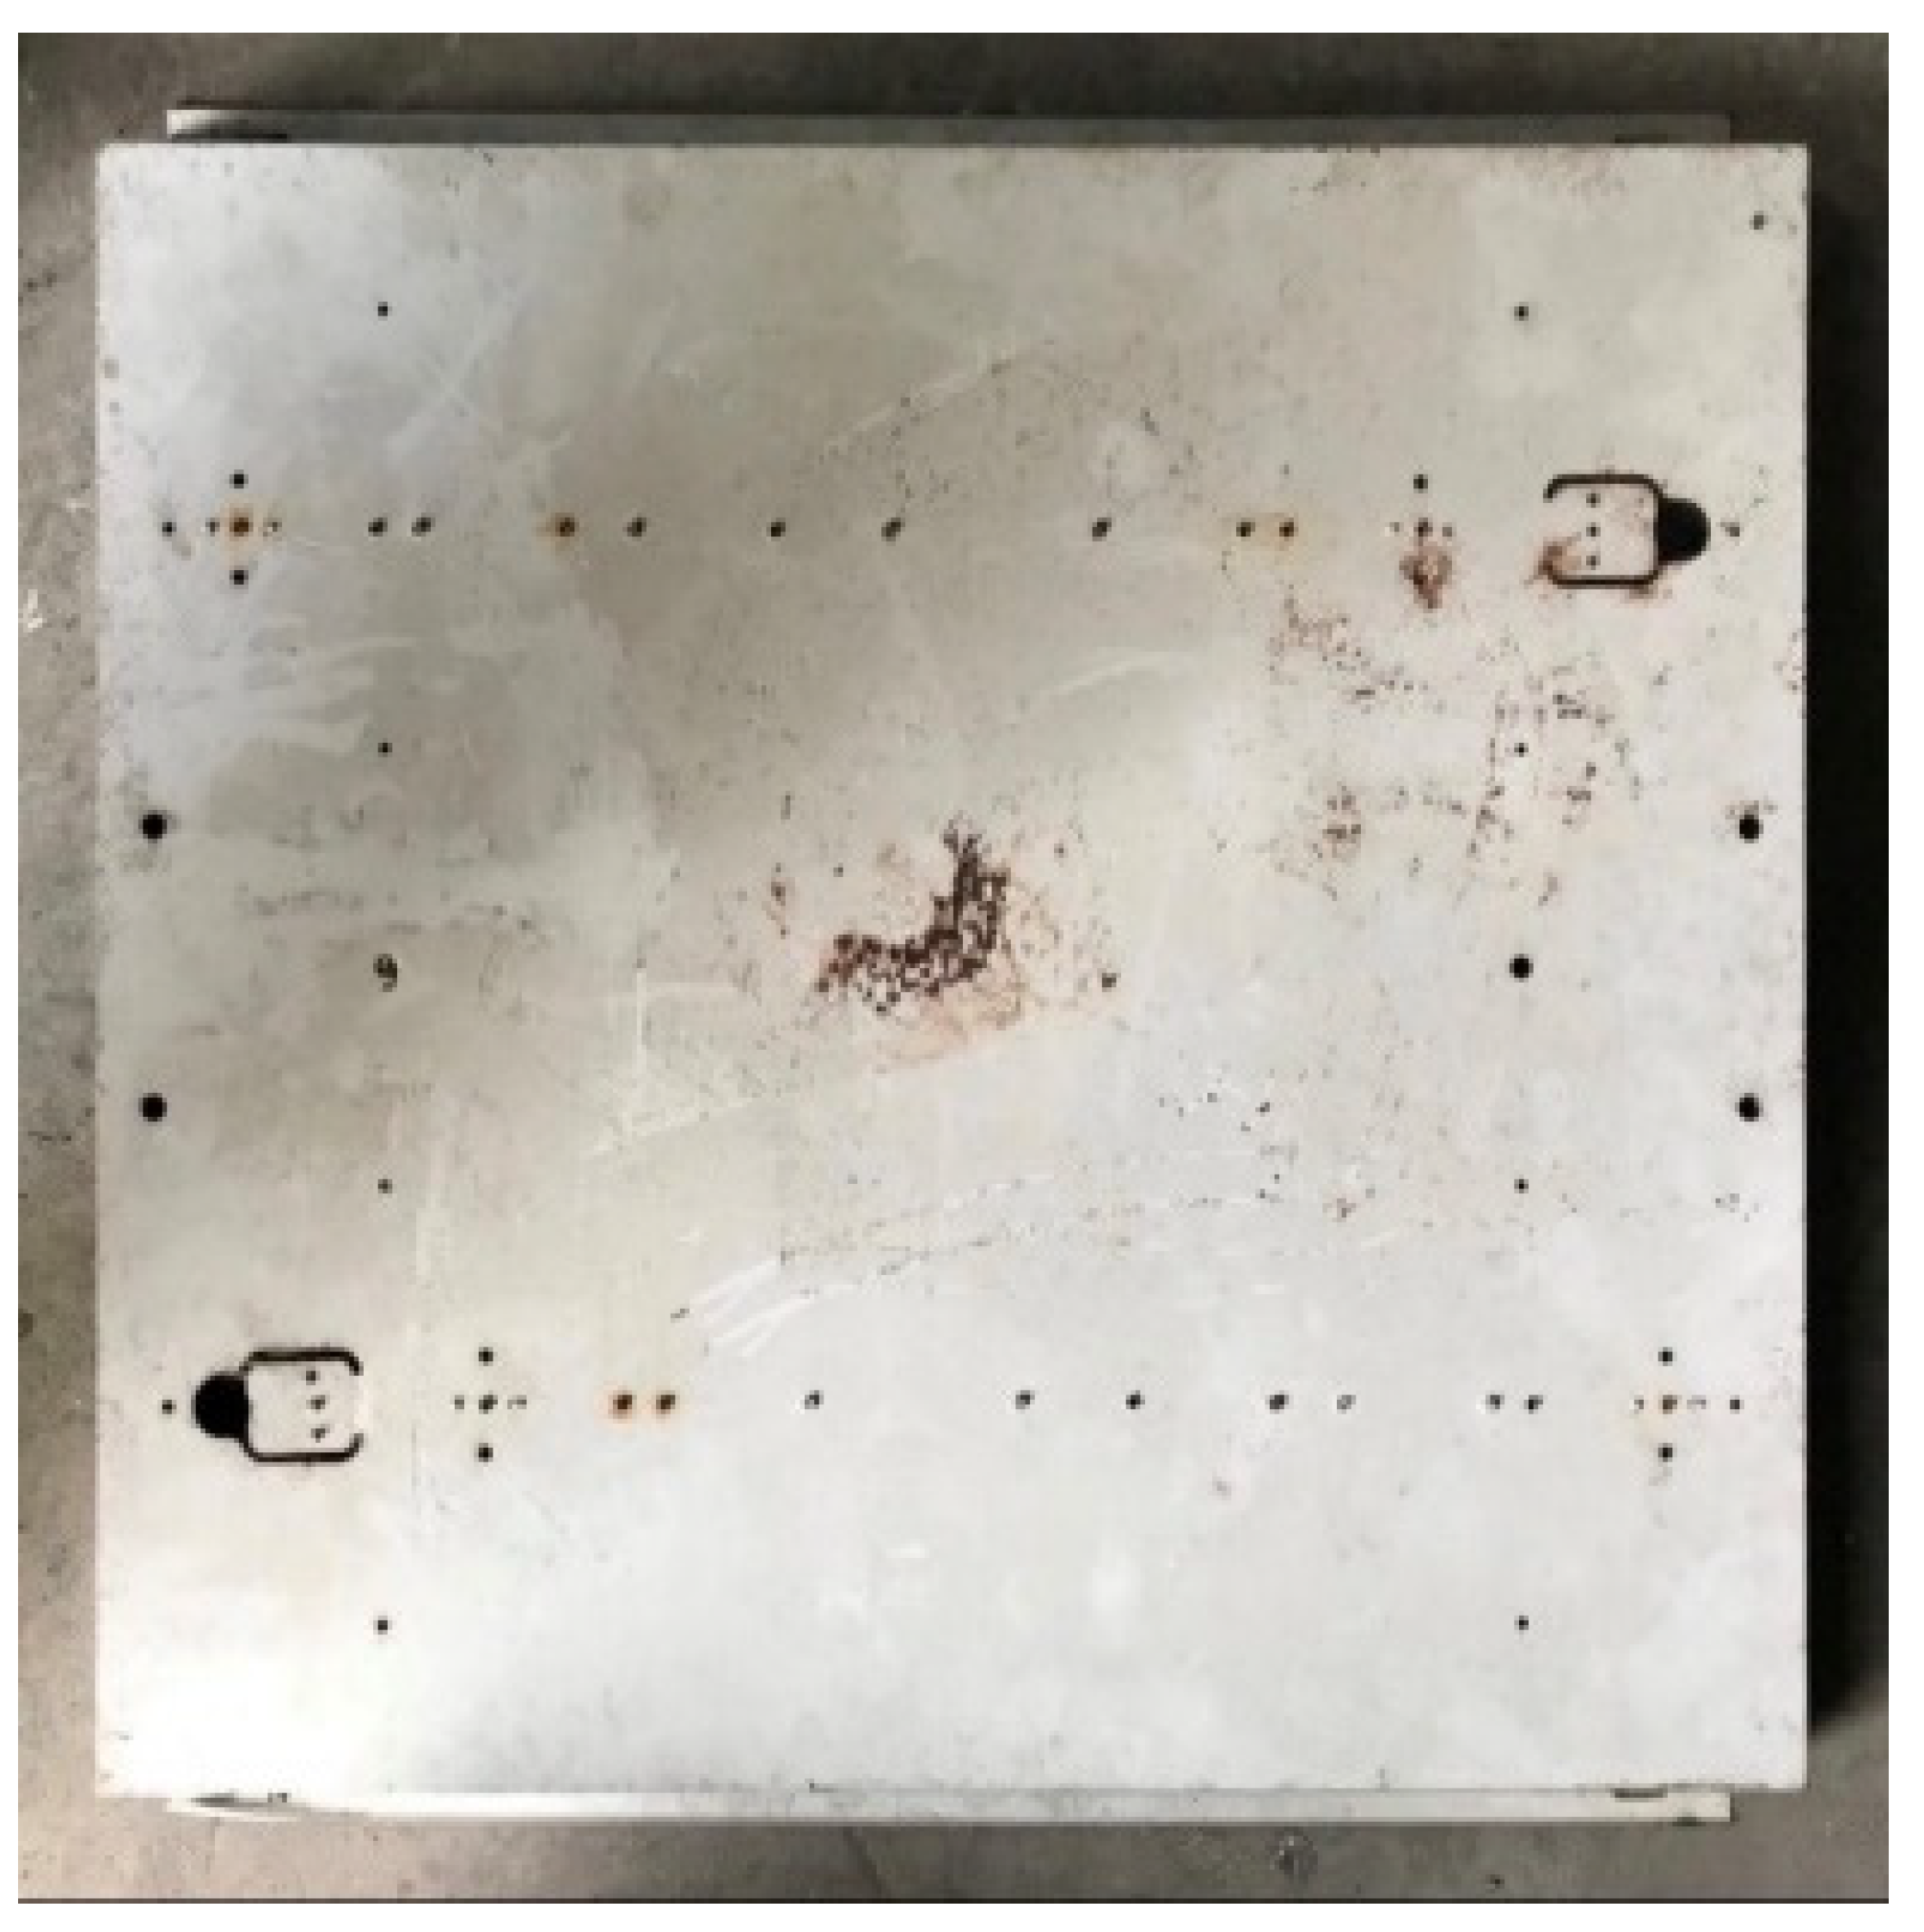
2.2. Experimental Specimens
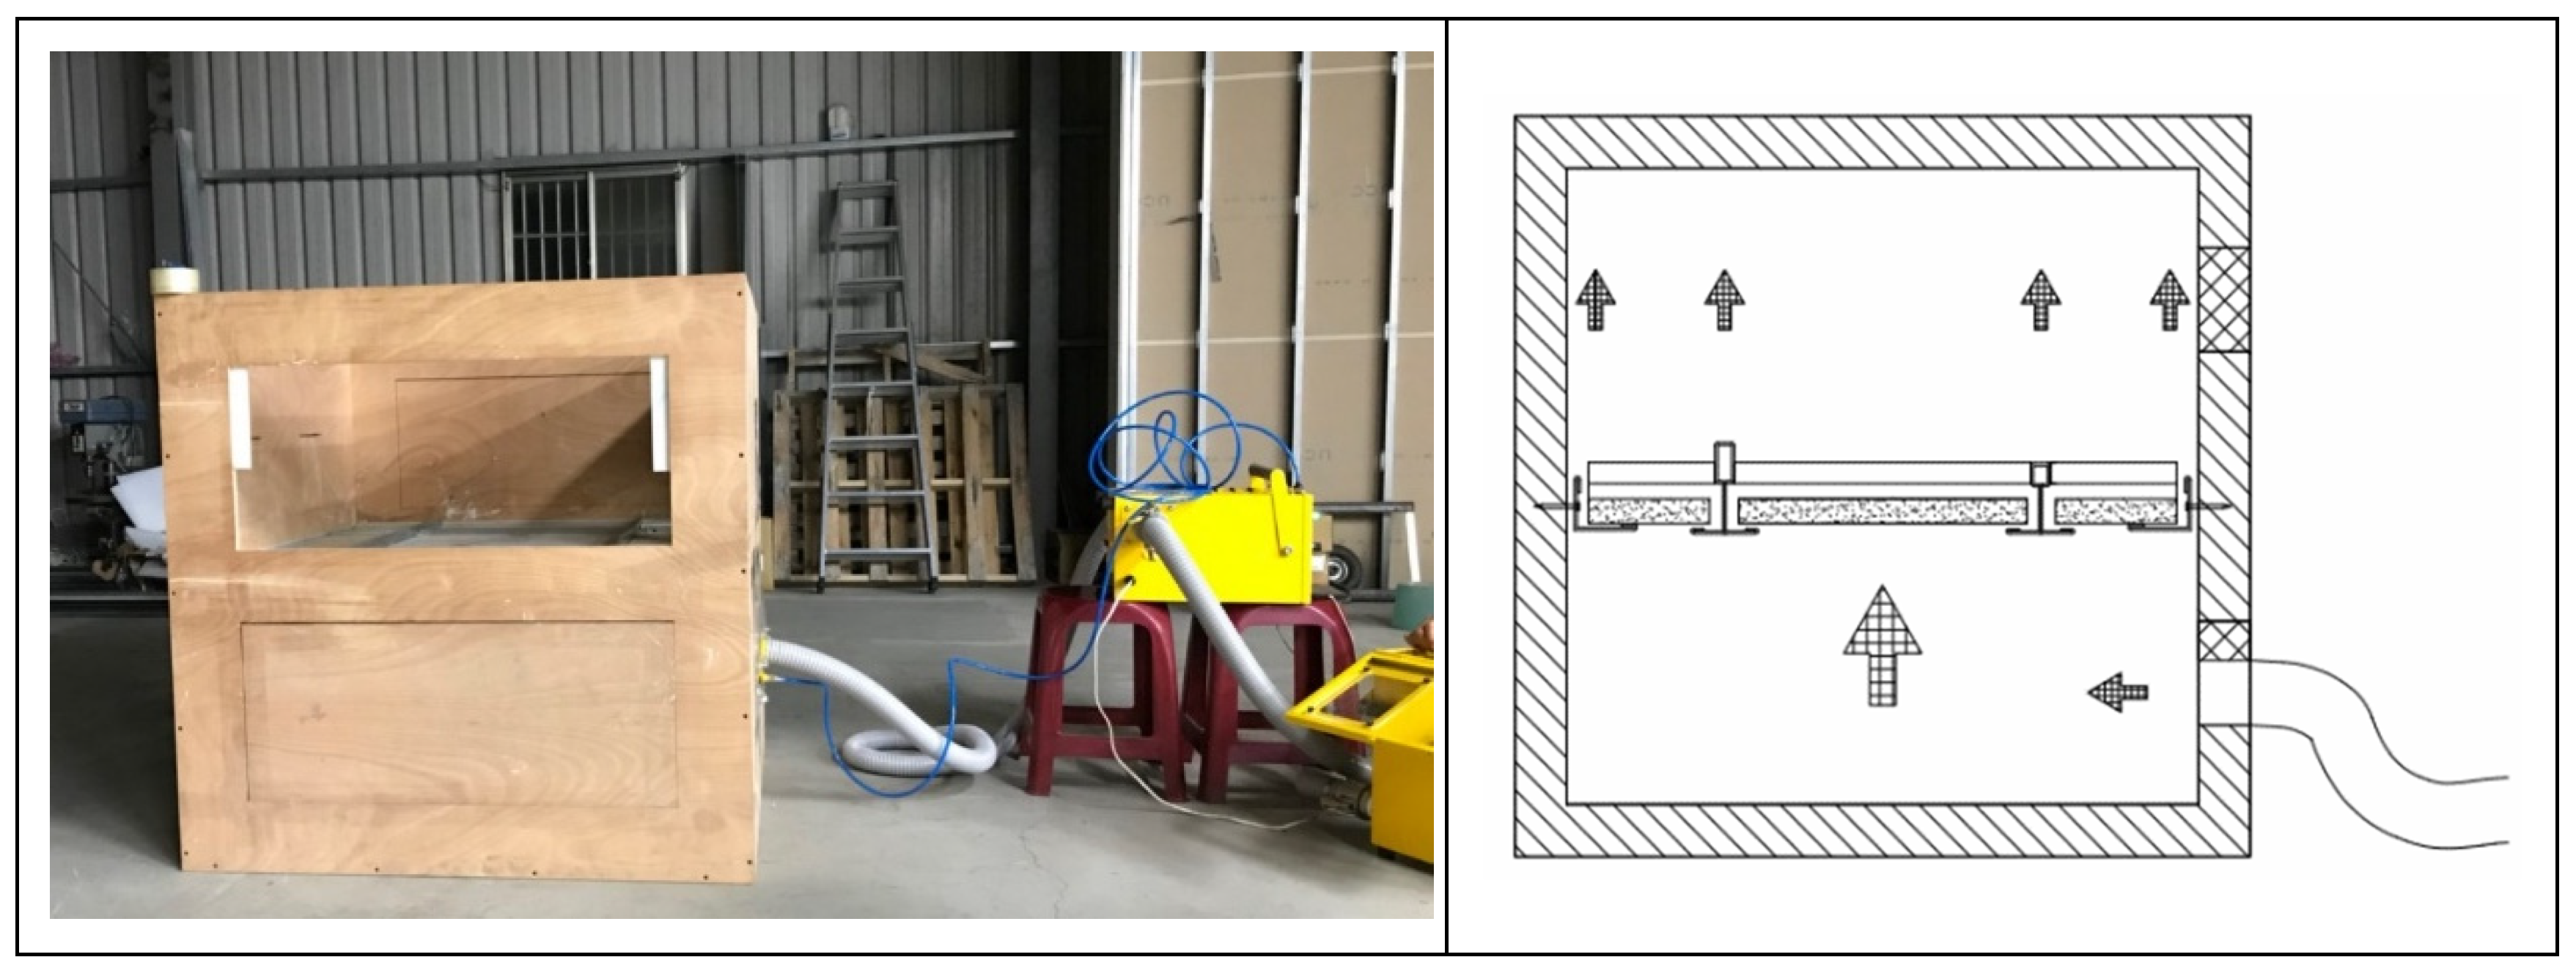
2.3. Experimental Procedure
3. Results and Discussion
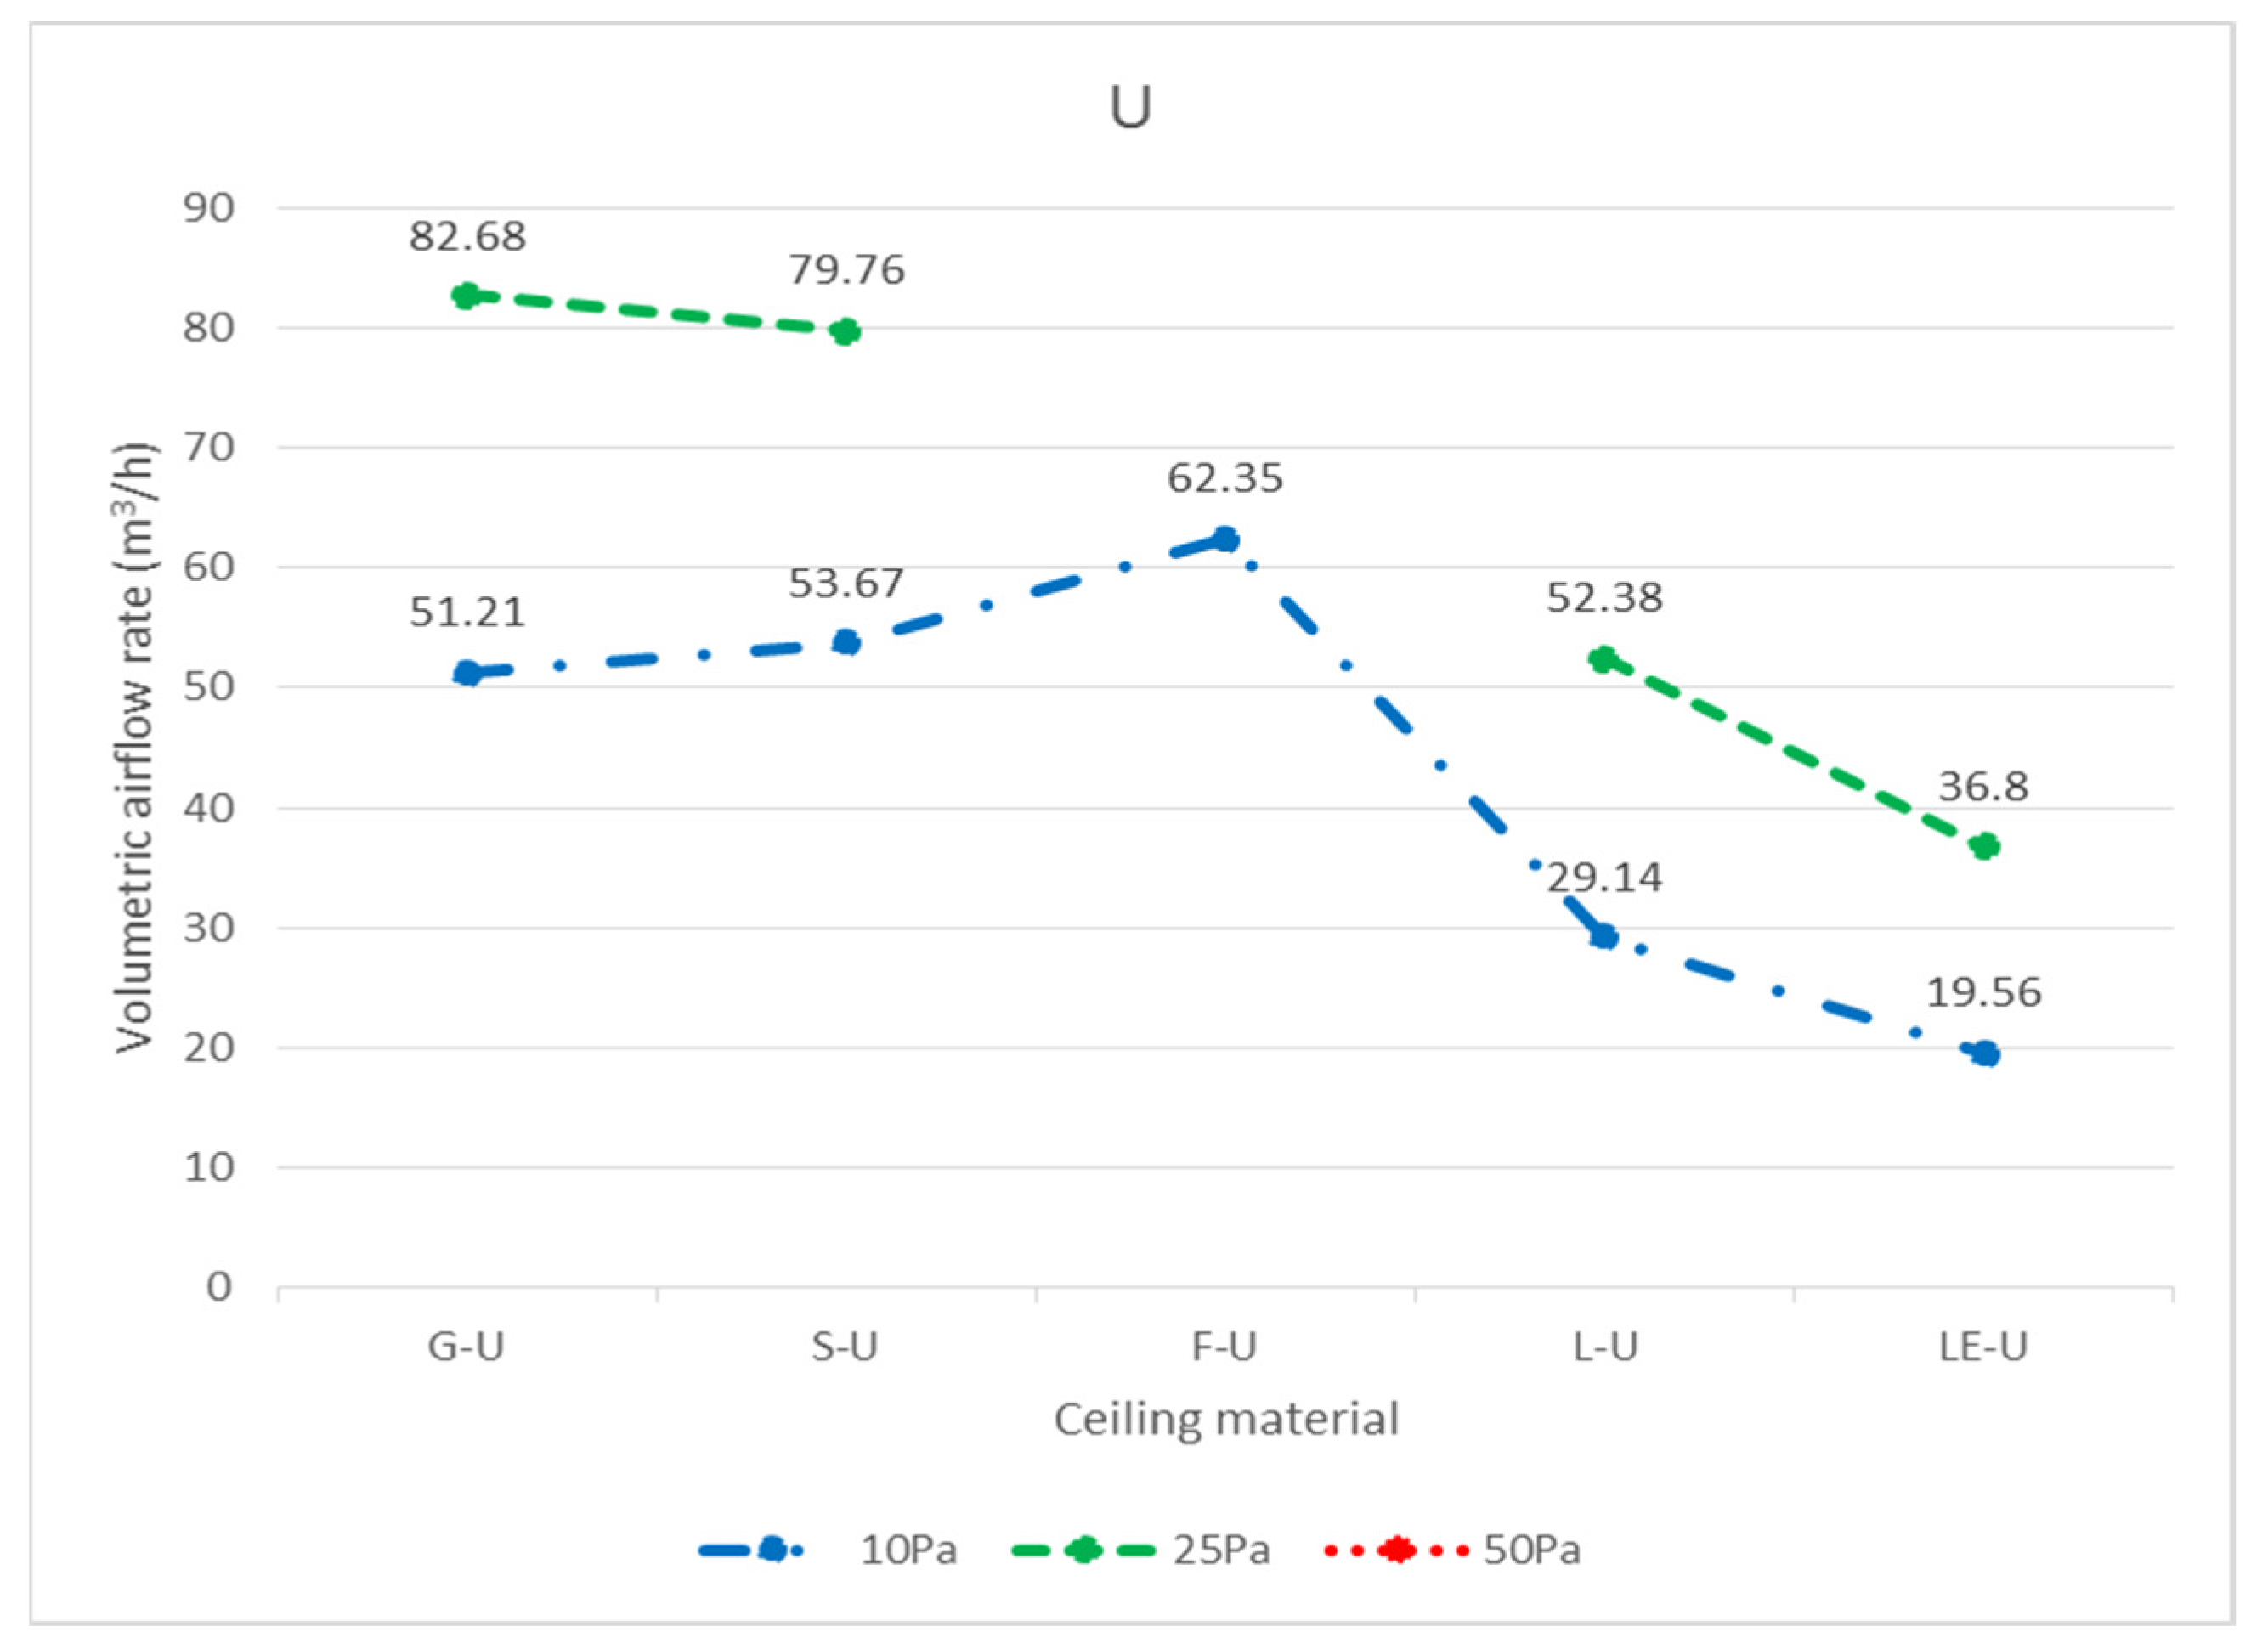
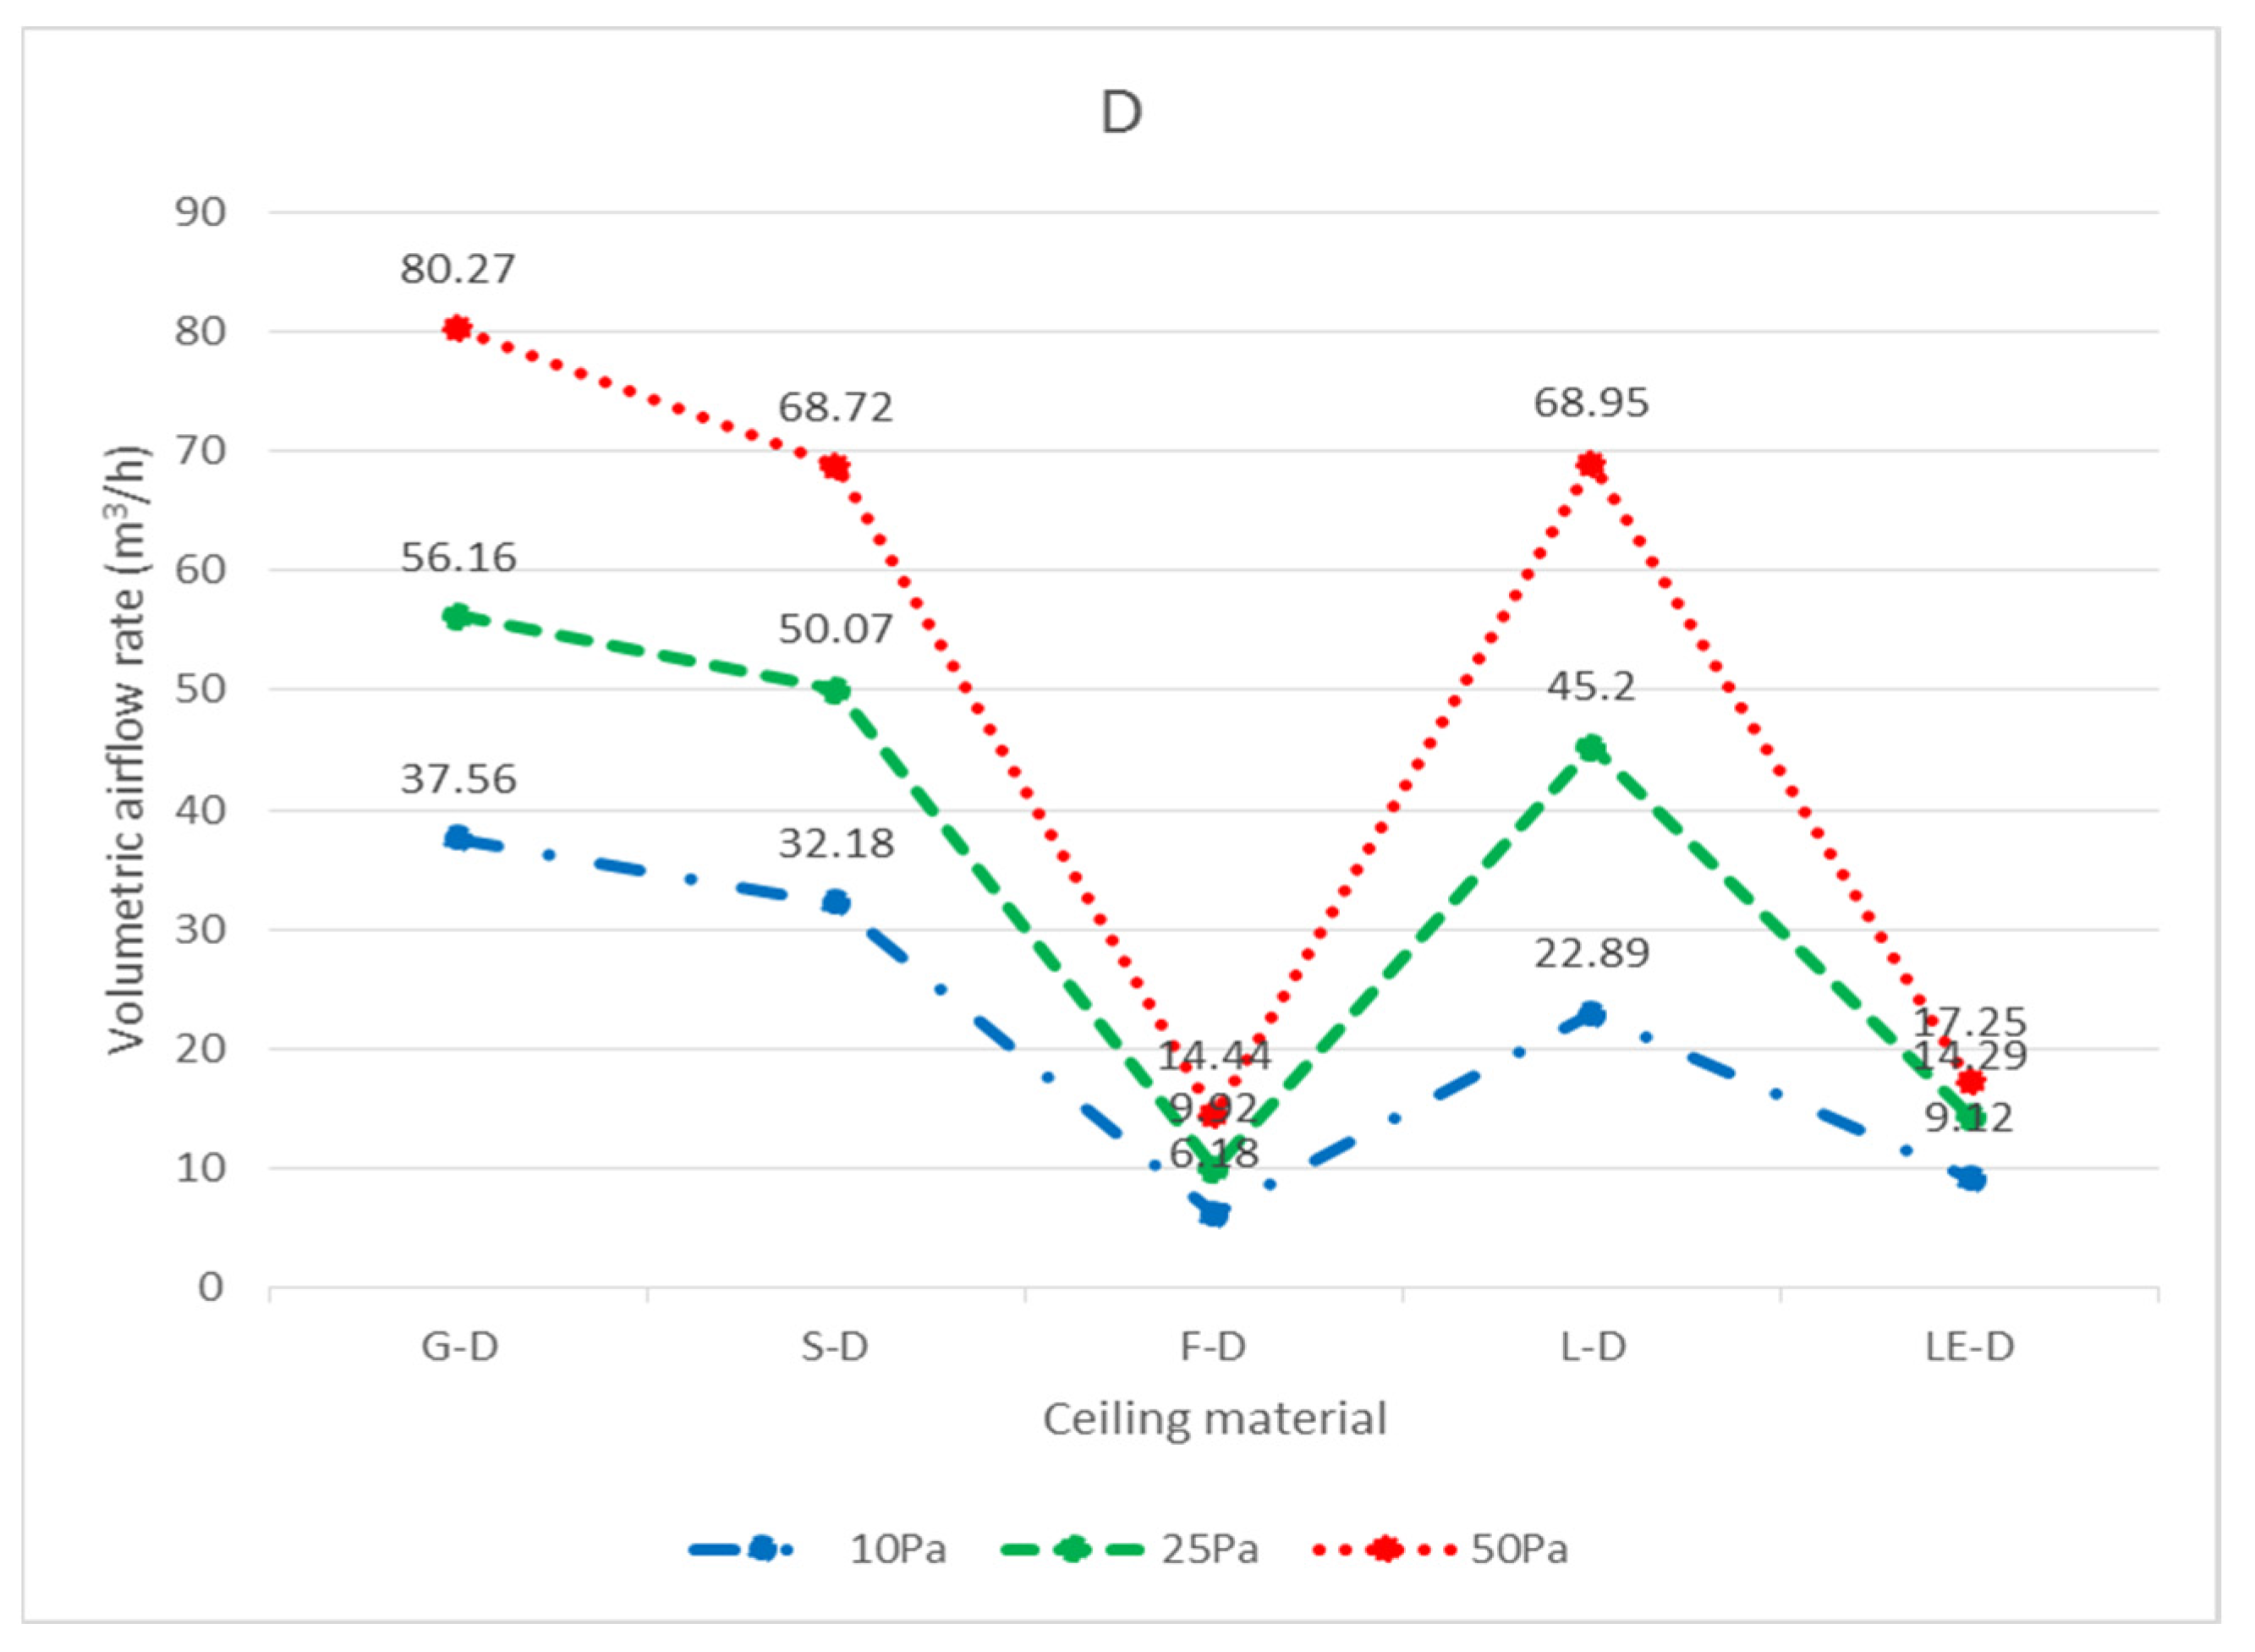
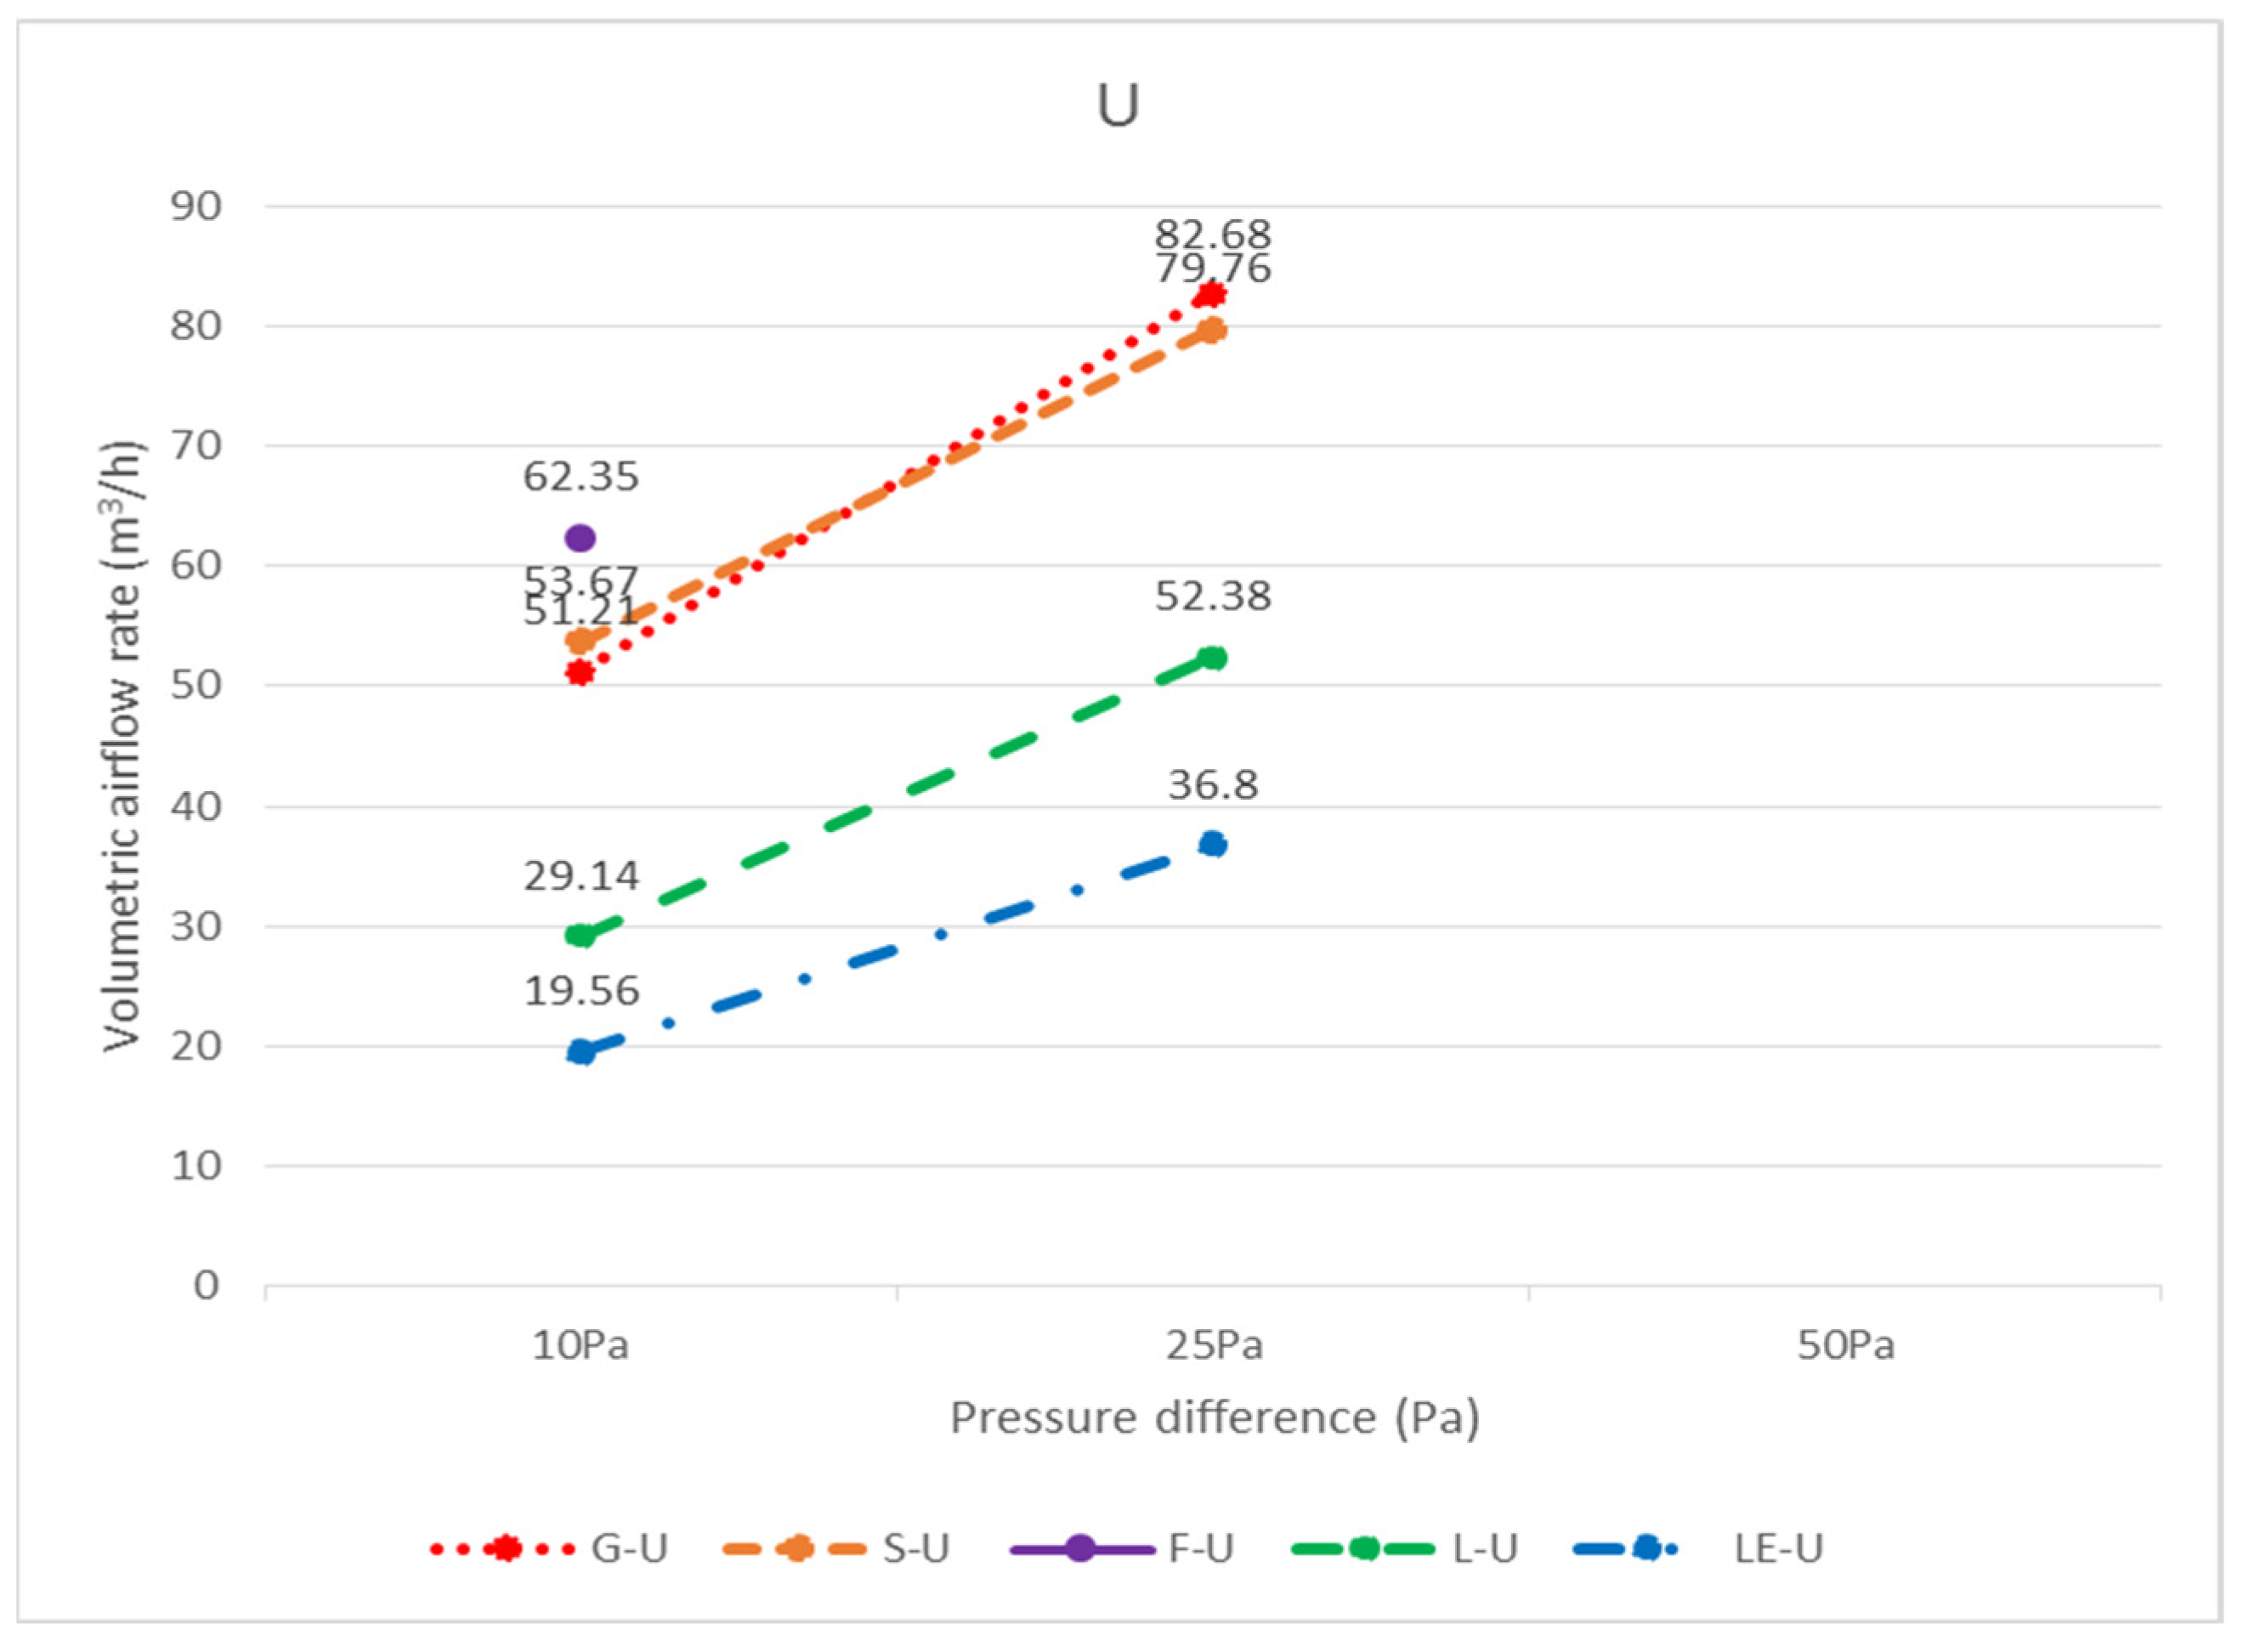
3.1. Test Results
3.2. Leakage Analysis of Specimens
3.3. Relationship between Specimen Size and Leakage
3.4. Evaluation of Evacuation Time
4. Conclusions
Author Contributions
Funding
Institutional Review Board Statement
Informed Consent Statement
Data Availability Statement
Conflicts of Interest
References
- Purser, D.A. Fire toxicity and toxic hazard analysis. In Proceedings of the Sixth International Seminar on Fire and Explosion Hazards (FEH6), Leeds, UK, 11–16 April 2010. [Google Scholar]
- Gałaj, J.A.; Saleta, D.B. Impact of apartment tightness on the concentrations of toxic gases emitted during a fire. Sustainability 2020, 12, 223. [Google Scholar] [CrossRef] [Green Version]
- Clarke, F.B. Physiological effects of smoke: Managing escape. ASHRAE J. 1997, 39, 47–56. [Google Scholar]
- Klote, J.H. Smoke Control. In SFPE Handbook of Fire Protection Engineering, 2nd ed.; SFPE: Gaithersburg, MD, USA, 1995; Chapter 12, Section 4; pp. 230–245. [Google Scholar]
- McGuire, J.H. Smoke movement in buildings. Fire Technol. 1967, 3, 163–174. [Google Scholar] [CrossRef]
- Fothergill, J.W. Smoke movement within a building. Fire Saf. J. 1984, 7, 47–54. [Google Scholar] [CrossRef]
- Liu, F.; Fu, X.Z.; Chow, W.K. A network model of simulating smoke movement in buildings. Int. J. Eng. Perform.-Based Fire Codes 2001, 3, 151–157. [Google Scholar]
- Mowrer, F.W.; Milke, J.A.; Torero, J.L. A comparison of driving forces for smoke movement in buildings. J. Fire Prot. Eng. 2004, 14, 237–264. [Google Scholar] [CrossRef]
- Tsai, T.-H.; Kuo, S.-Y.; Tseng, Y.-T.; Tang, C.-H.; Chuang, Y.-J.; Lin, C.Y. Rates of Smoke Leakage through Fire Stops. J. Eng. Res. 2013, 1, 231–250. [Google Scholar]
- Chuang, Y.-J.; Tsai, T.-H.; Chuang, Y.-H.; Lin, C.-Y.; Huang, C.-H.; Chen, P.-H. Performance assessment of single-leaf timber door in a smoke leakage test. J. Appl. Fire Sci. 2006, 16, 101–114. [Google Scholar] [CrossRef]
- Pan American Health Organization. Hospitals Don’t Burn! Hospital Fire Prevention and Evacuation Guide; World Health Organization and Pan American Health Organization: Washington, DC, USA, 2018. [Google Scholar]
- Ricci, K.A.; Griffin, A.R.; Heslin, K.C.; Kranke, D.; Dobalian, A. Evacuate or Shelter-in-place? The Role of Corporate Memory and Political Environment in Hospital-evacuation Decision Making. Prehospital Disaster Med. 2015, 30, 233–238. [Google Scholar] [CrossRef] [PubMed]
- Zuhal, Ş.; Nilüfer, A. An Evaluation of Hospital Evacuation Strategies with an Example. Int. J. Appl. Sci. Technol. 2015, 5, 109–121. [Google Scholar]
- Huang, D.-C.; Chien, S.-W.; Lin, C.-H.; Huang, P.-T.; Song, Y.-T.; Sie, H.-R. A Study for the Evacuation of Hospital on Fire during Construction. Procedia Eng. 2011, 11, 139–146. [Google Scholar]
- ISO 5925-1. Fire Test-Evaluation of Performance of Smoke Control Door Assemblies—Part 1: Ambient Temperature Test; ISO: Geneva, Switzerland, 2007. [Google Scholar]
- ISO 5925-2. Fire Test-Smoke Control Door and Shutter Assemblies—Part 2: Commentary on Test Method and Test Data Application; ISO: Geneva, Switzerland, 2006. [Google Scholar]
- JIS A 1516. Windows and Doorsets—Air Permeability Test; Japanese Industrial Standards: Tokyo, Japan, 1998. [Google Scholar]
- BS 476-31. Methods for Measuring Smoke Penetration through Door Sets and Shutter Assemblies; British Standards Institution (BSI): London, UK, 1983. [Google Scholar]
- DIN 18095-1. Smoke Control Doors; Concepts and Requirements; German National Standard: Berlin, Germany, 1998. [Google Scholar]
- DIN 18095-2. Smoke Control Doors; Type Testing for Durability and Leakage; German National Standard: Berlin, Germany, 1991. [Google Scholar]
- ASTM E283. Standard Test Method for Determining Rate of Air Leakage through Exterior Windows, Curtain Walls, and Doors under Specified Pressure Differences across the Specimen; American Society for Testing and Materials (ASTM): West Conshohocken, PA, USA, 2004. [Google Scholar]
- UL 1784. Air Leakage Tests of Door Assemblies; Underwriters Laboratories Inc. (UL): Northbrook, IL, USA, 1990. [Google Scholar]
- CNS 15038. Method of Test for Evaluating Smoke Control Performance of Doors; Bureau of Standard, Metrology and Inspection (BSMI): Taipei, Taiwan, 2009. [Google Scholar]
- Klote, J.H. Smoke Movement through a Suspended Ceiling System; NBSIR-81-2444; Center for Fire Research, National Bureau of Standards (U.S.), NIST Interagency: Washington, DC, USA, 1982. [Google Scholar]
- Chou, T.-L.; Tang, C.-H.; Chuang, Y.-J.; Lin, C.-Y. Study on Smoke Leakage Performance of Suspended Ceiling System. Sustainability 2020, 12, 7244. [Google Scholar] [CrossRef]
- Chou, T.L.; Chen, C.J.; Cheng, S.M.; Yuan, C.H.; Chuang, Y.J.; Lin, C.Y. Application Research on BIM-Assisted Building Fire Safety and Evacuation Capability Verification. Archit. Sci. 2020, 22, 1–13. [Google Scholar]
- Yao, G.C. Seismic performance of direct hung suspended ceiling systems. J. Archit. Eng. 2000, 6, 6–11. [Google Scholar] [CrossRef]
- Lin, C.-S.; Wu, M.-E. A study of evaluating an evacuation time. Adv. Mech. Eng. 2018, 10, 1–11. [Google Scholar] [CrossRef] [Green Version]
- Chiu, C.-W.; Chen, C.-H.; Chen, J.-C.; Shu, C.-M. Analyses of smoke management models in TFT-LCD cleanroom. Build. Simul. 2013, 6, 403–413. [Google Scholar] [CrossRef]
- Marchant, E.W. A Complete Guide to Fire and Buildings; Medical and Technical Publishing Co.: Lancaster, UK, 1972. [Google Scholar]


| Specimen | Code | Pressure Difference | ||
|---|---|---|---|---|
| 10 Pa | 25 Pa | 50 Pa | ||
| G | G-U-5 | 19.09 | 35.52 | X |
| G-U-36 | 17.05 | 27.15 | X | |
| G-U-33 | 15.07 | 19.47 | X | |
| Total | 51.21 | 82.68 | X | |
| G-D-5 | 8.54 | 13.45 | 16.88 | |
| G-D-36 | 11.12 | 19.50 | 27.26 | |
| G-D-33 | 17.90 | 23.21 | 36.13 | |
| Total | 37.56 | 56.16 | 80.27 | |
| S | S-U-5 | 20.12 | 40.58 | X |
| S-U-36 | 18.54 | 31.35 | X | |
| S-U-33 | 15.72 | 20.25 | X | |
| Total | 53.67 | 79.76 | X | |
| S-D-5 | 6.09 | 9.67 | 11.25 | |
| S-D-36 | 10.09 | 17.51 | 24.15 | |
| S-D-33 | 16.01 | 22.89 | 33.32 | |
| Total | 32.18 | 50.07 | 68.72 | |
| F | F-U-5 | 25.12 | X | X |
| F-U-36 | 20.08 | X | X | |
| F-U-33 | 17.15 | X | X | |
| Total | 62.35 | X | X | |
| F-D-5 | 1.72 | 2.59 | 3.51 | |
| F-D-36 | 1.93 | 3.44 | 4.87 | |
| F-D-33 | 2.53 | 3.89 | 6.06 | |
| Total | 6.18 | 9.92 | 14.44 | |
| L | L-U-5 | 29.14 | 52.38 | X |
| L-D-5 | 22.89 | 45.20 | 68.95 | |
| LE | LE-U-5 | 19.56 | 36.80 | X |
| LE-D-5 | 9.12 | 14.29 | 17.25 | |
| R | R-U-5 | X | X | X |
| R-D-5 | X | X | X | |
| RF | RF-U-5 | X | X | X |
| RF-D-5 | X | X | X | |
| Area | 603 × 603 (mm) | Below 603 × 603 (mm) Greater than 300 × 300 (mm) | Below 300 × 300 (mm) | Total | |
|---|---|---|---|---|---|
| Specimen | Pressure Difference | ||||
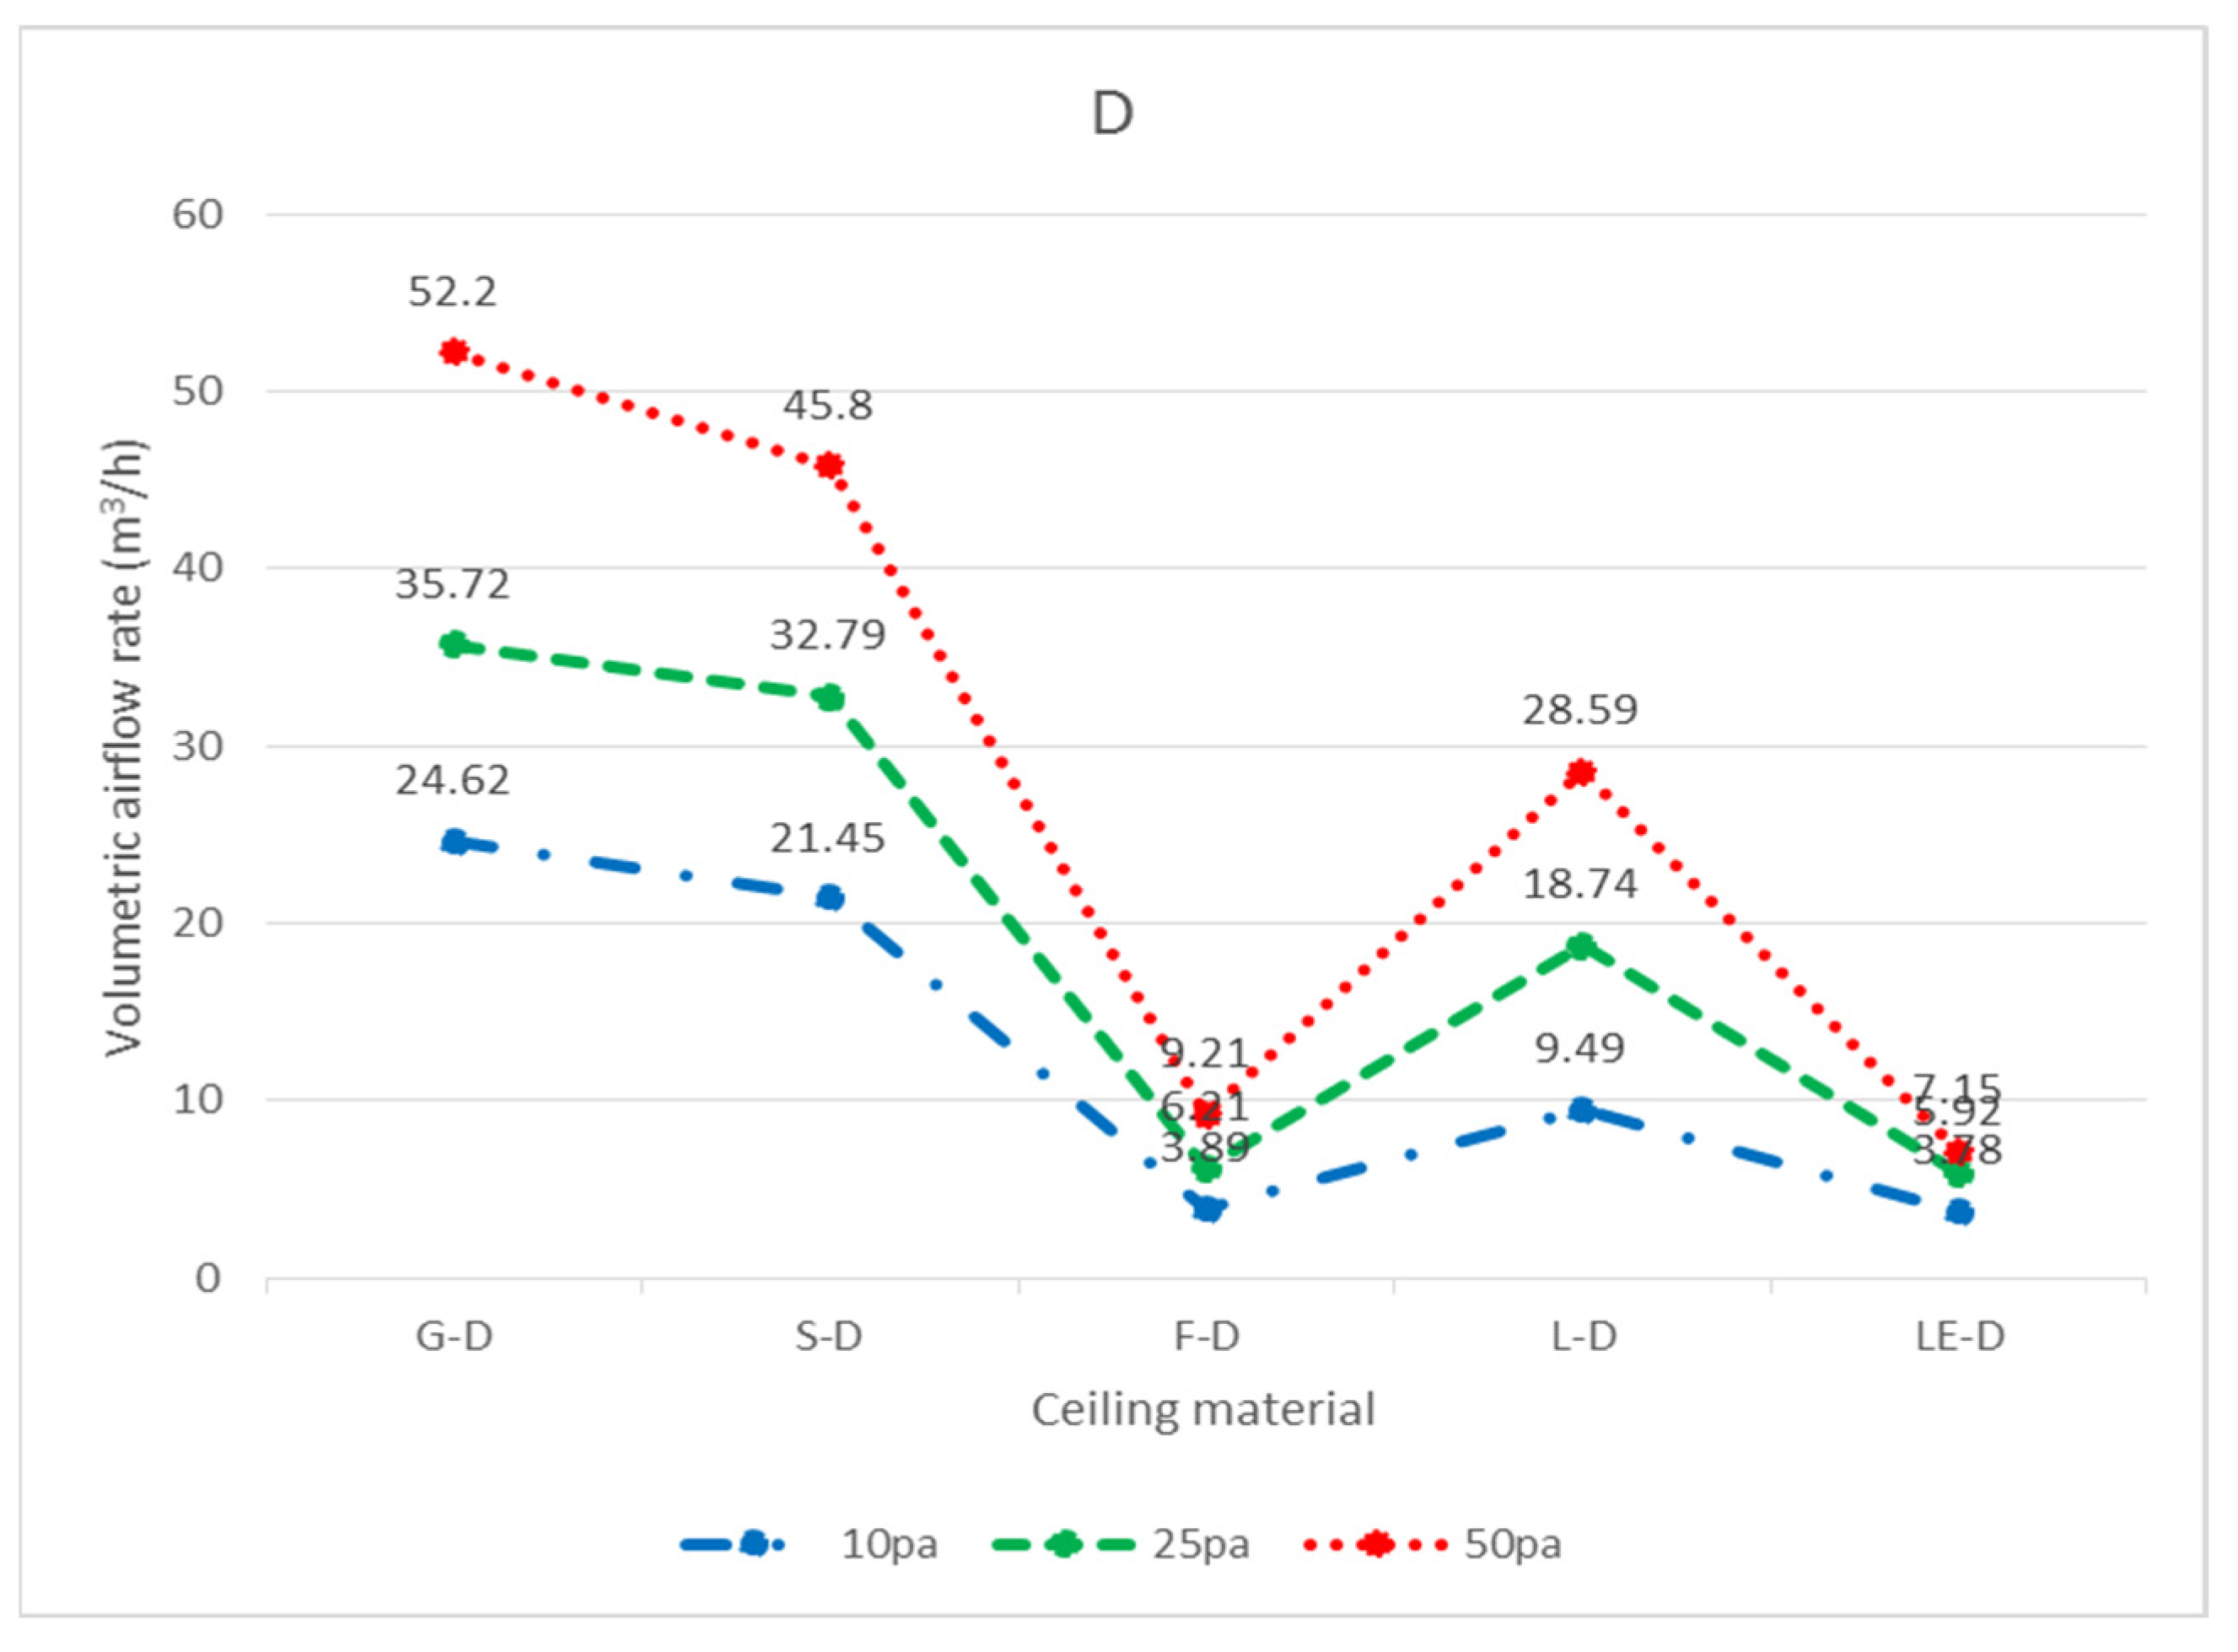
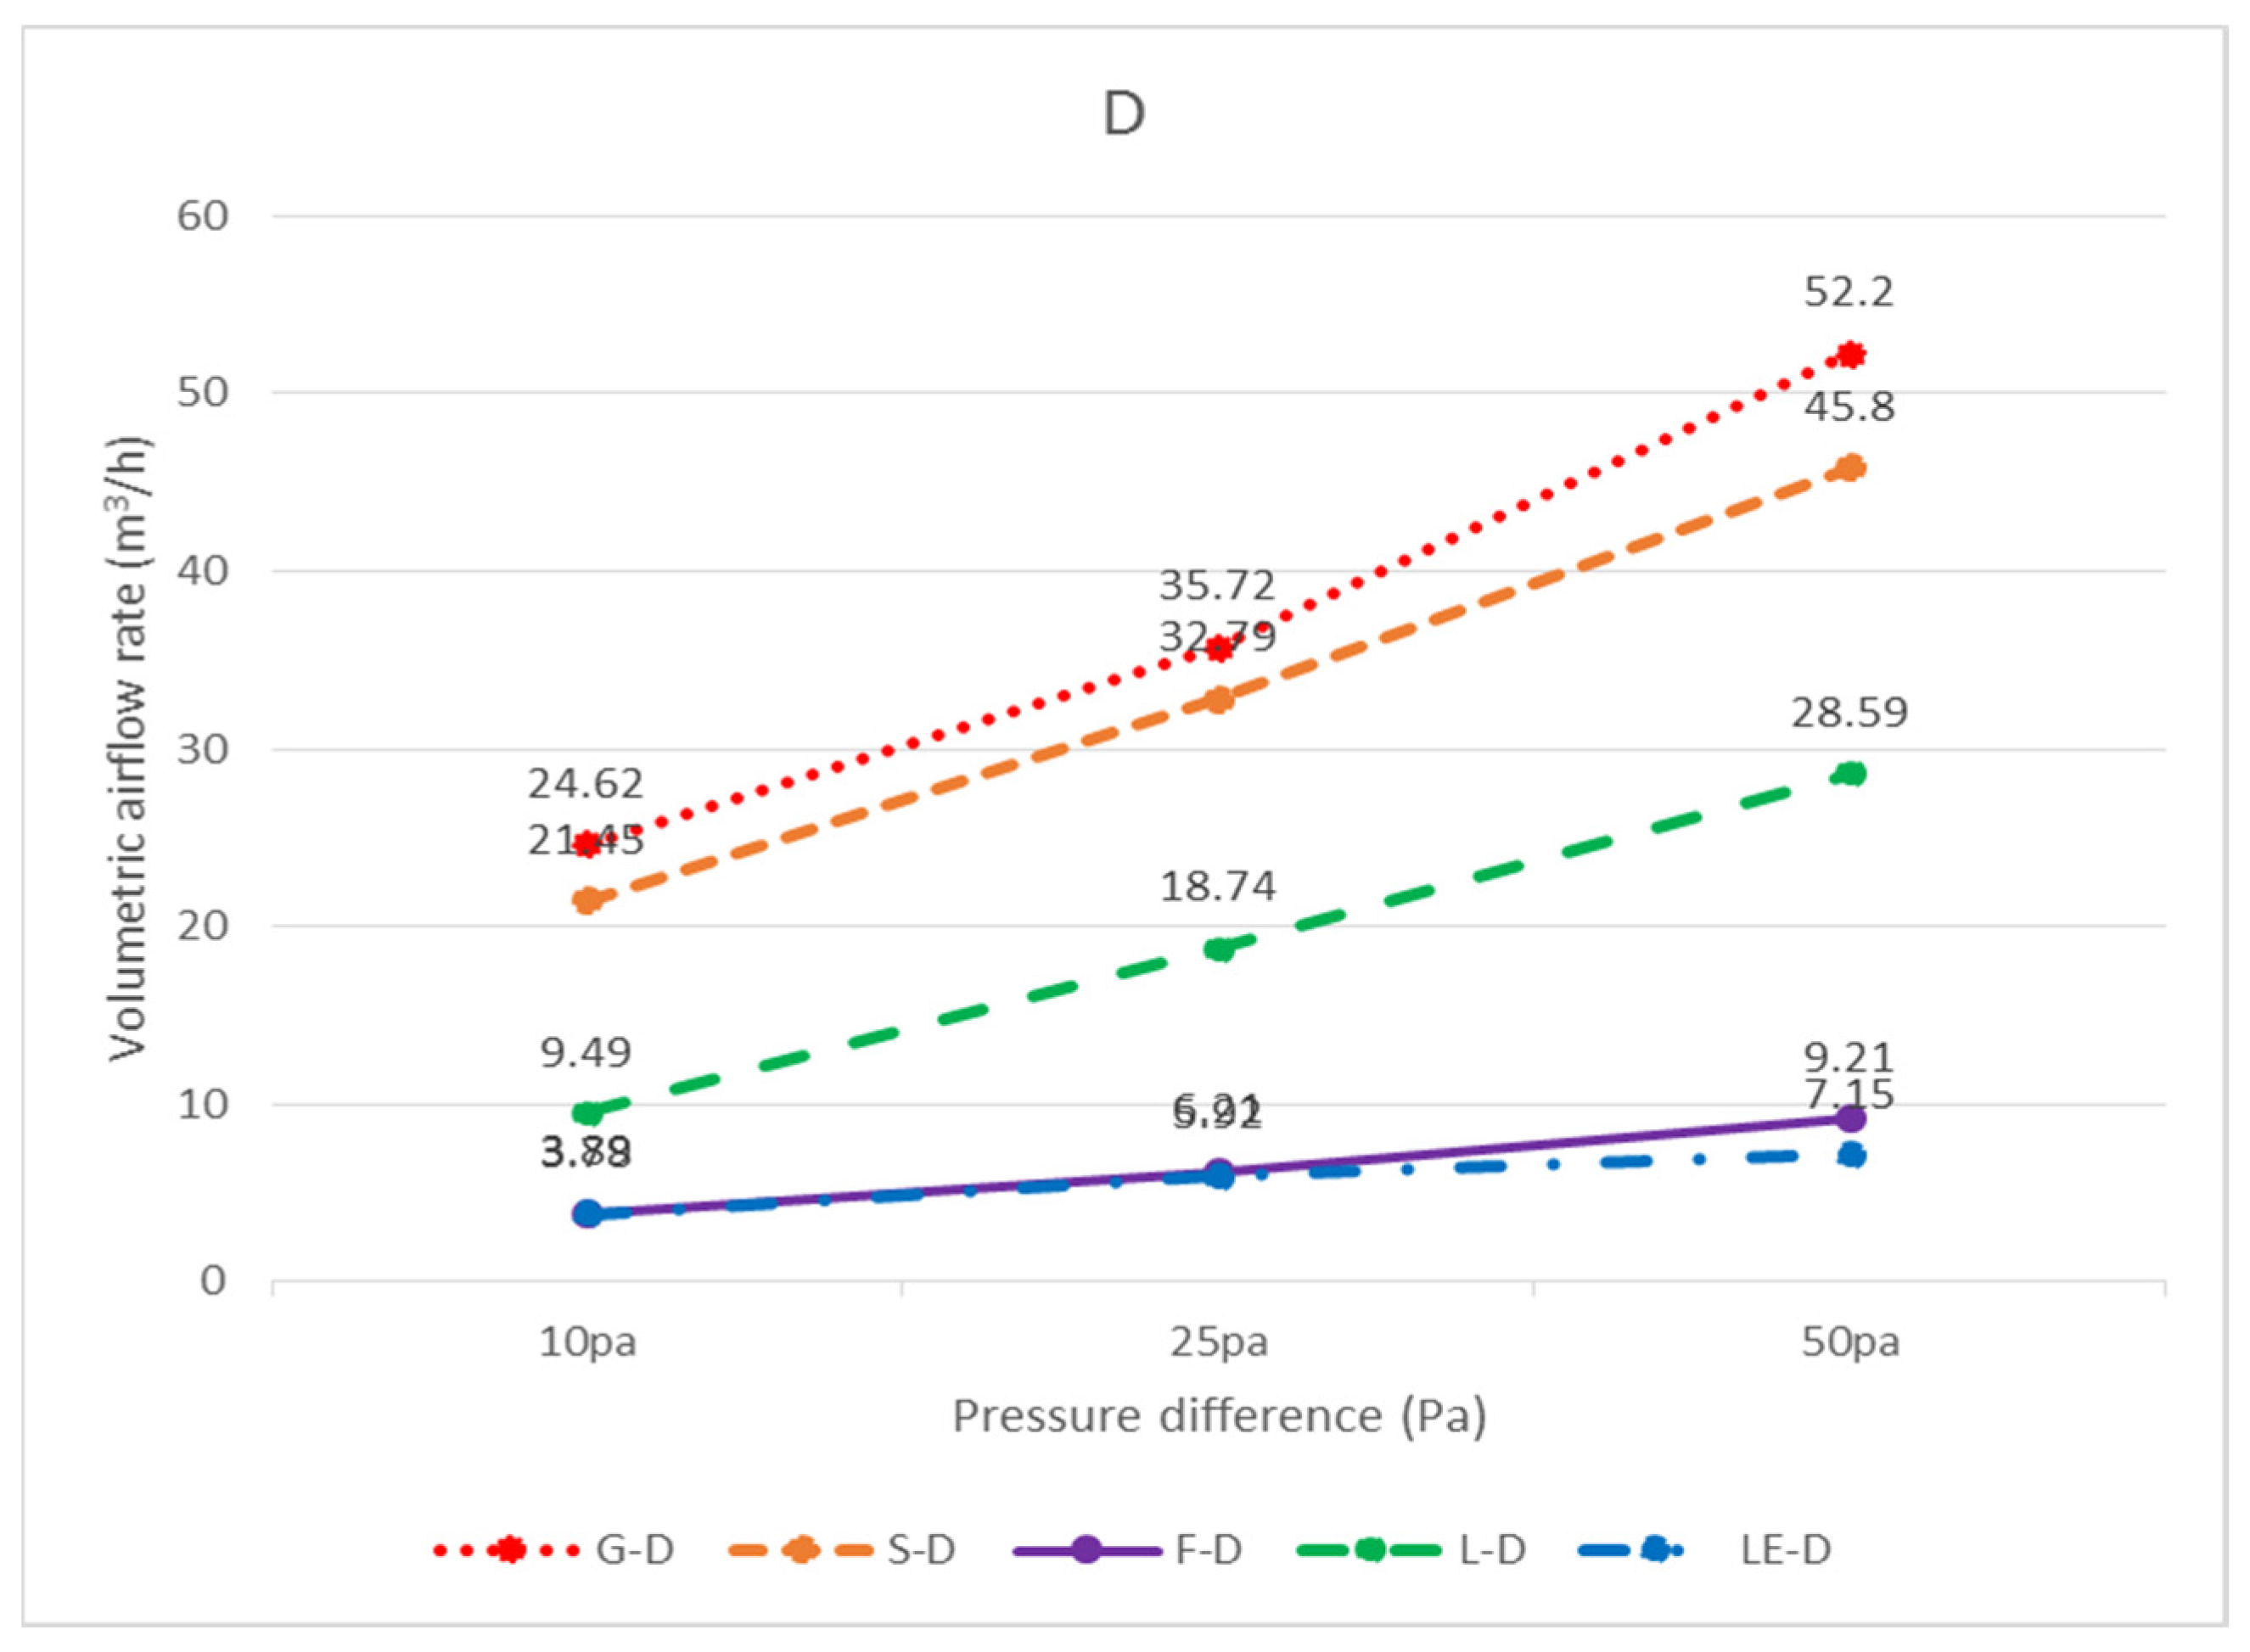
| 9 mm gypsum board (G-D) | 10 pa | 3.54 | 6.16 | 14.92 | 24.62 |
| 25 pa | 5.58 | 10.80 | 19.34 | 35.72 | |
| 50 pa | 7.00 | 15.09 | 30.11 | 52.20 | |
| 3.5 mm calcium silicate board (S-D) | 10 pa | 2.52 | 5.59 | 13.34 | 21.45 |
| 25 pa | 4.01 | 9.70 | 19.08 | 32.79 | |
| 50 pa | 4.66 | 13.37 | 27.77 | 45.80 | |
| 15 mm glass fiber board (F-D) | 10 pa | 0.71 | 1.07 | 2.11 | 3.89 |
| 25 pa | 1.07 | 1.90 | 3.24 | 6.21 | |
| 50 pa | 1.46 | 2.70 | 5.05 | 9.21 | |
| Traditional luminaire (L-D) | 10 pa | 9.49 | Without the size | Without the size | 9.49 |
| 25 pa | 18.74 | 18.74 | |||
| 50 pa | 28.59 | 28.59 | |||
| LED flat panel luminaire (LE-D) | 10 pa | 3.78 | 3.78 | ||
| 25 pa | 5.92 | 5.92 | |||
| 50 pa | 7.15 | 7.15 | |||
| Air return panel (R-D) | 10 pa | X | X | ||
| 25 pa | X | X | |||
| 50 pa | X | X | |||
| Filtered air return panel (RF-D) | 10 pa | X | X | ||
| 25 pa | X | X | |||
| 50 pa | X | X | |||
| Area | 603 × 603 (mm) | Below 603 × 603 (mm) Greater than 300 × 300 (mm) | Below 300 × 300 (mm) | Total | |
|---|---|---|---|---|---|
| Specimen | Pressure Difference | ||||
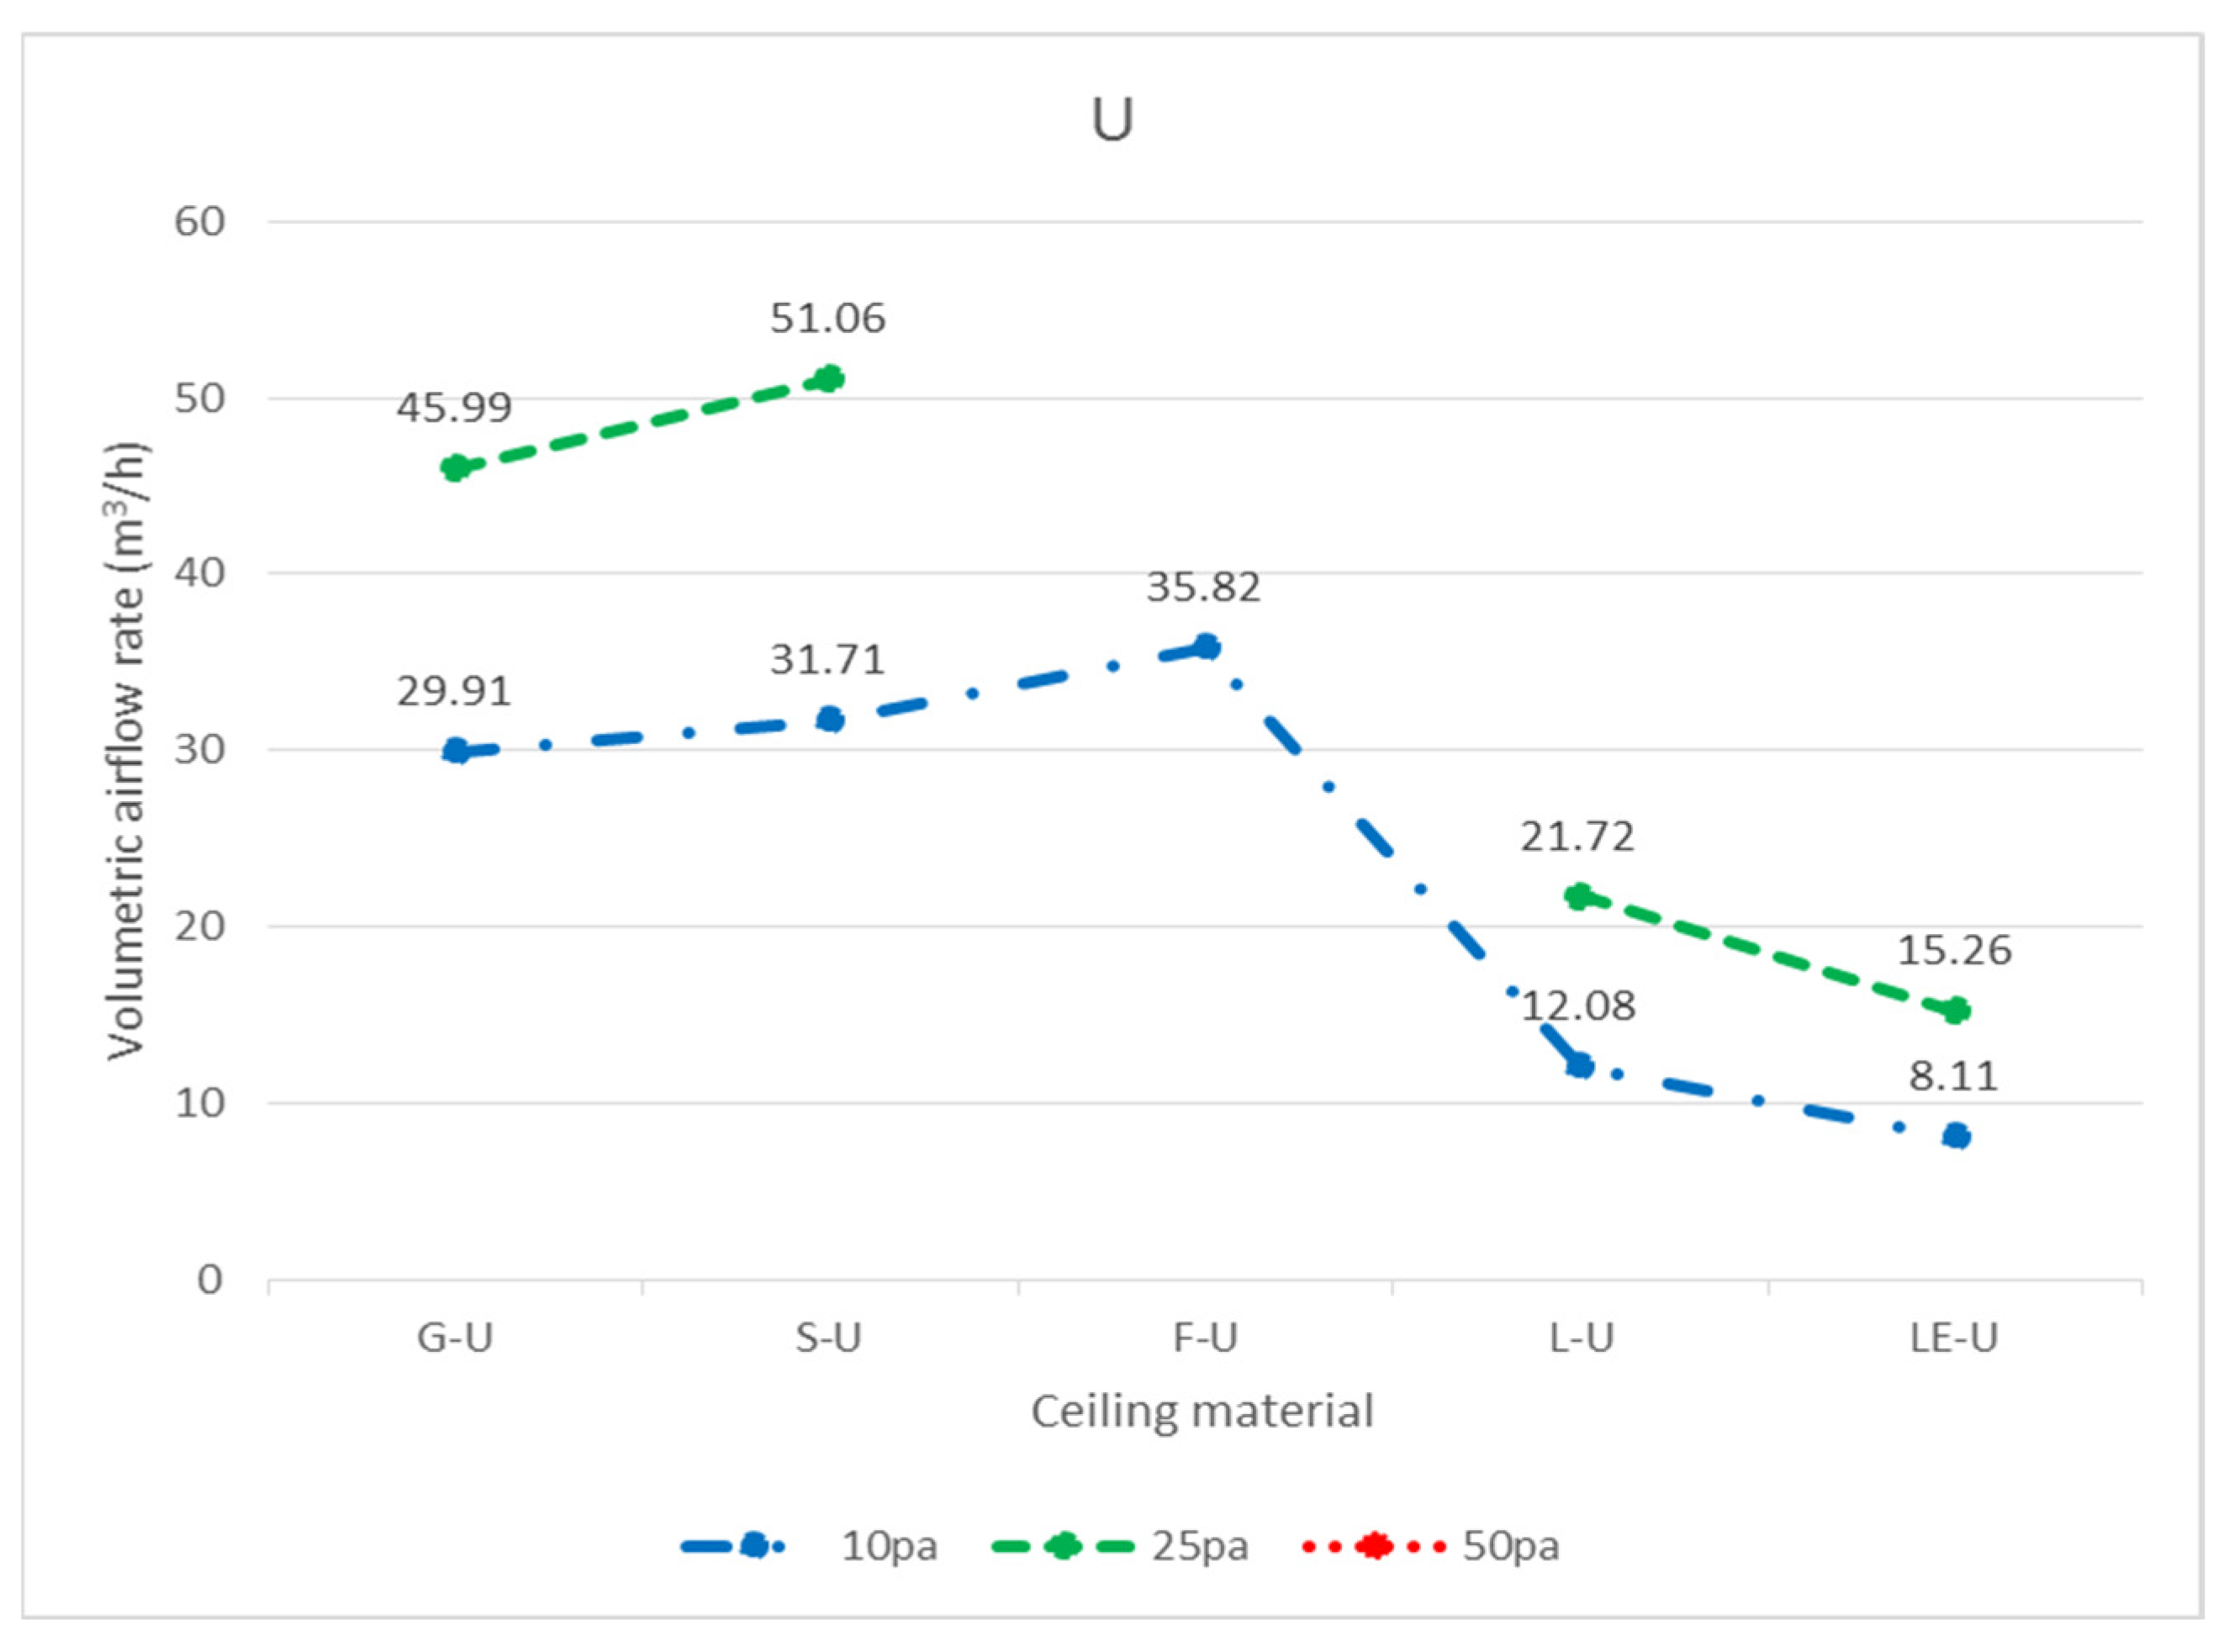
| 9 mm gypsum board (G-U) | 10 pa | 7.91 | 9.44 | 12.56 | 29.91 |
| 25 pa | 14.73 | 15.03 | 16.23 | 45.99 | |
| 50 pa | X | X | X | X | |
| 3.5 mm calcium silicate board (S-U) | 10 pa | 8.34 | 10.27 | 13.10 | 31.71 |
| 25 pa | 16.82 | 17.36 | 16.88 | 51.06 | |
| 50 pa | X | X | X | X | |
| 15 mm glass fiber board (F-U) | 10 pa | 10.41 | 11.12 | 14.29 | 35.82 |
| 25 pa | X | X | X | X | |
| 50 pa | X | X | X | X | |
| Traditional luminaire (L-U) | 10 pa | 12.08 | Without the size | Without the size | 12.08 |
| 25 pa | 21.72 | 21.72 | |||
| 50 pa | X | X | |||
| LED flat panel luminaire (LE-U) | 10 pa | 8.11 | 8.11 | ||
| 25 pa | 15.26 | 15.26 | |||
| 50 pa | X | X | |||
| Air return panel (R-U) | 10 pa | X | X | ||
| 25 pa | X | X | |||
| 50 pa | X | X | |||
| Filtered air return panel (RF-U) | 10 pa | X | X | ||
| 25 pa | X | X | |||
| 50 pa | X | X | |||
| Panel Size (mm) | Pressure Differences of Panel Types | ||||||||
| 9 mm Gypsum Board (G-D) | 3.5 mm Calcium Silicate Board (S-D) | 15 mm Glass Fiber Board (F-D) | |||||||
| 10 Pa | 25 Pa | 50 Pa | 10 Pa | 25 Pa | 50 Pa | 10 Pa | 25 Pa | 50 Pa | |
| Each piece 603 × 603 (mm) | 3.54 | 5.58 | 7.00 | 2.52 | 4.01 | 4.66 | 0.71 | 1.07 | 1.46 |
| 300 × 603–603 × 603 (mm) | 6.16 | 10.80 | 15.09 | 5.59 | 9.70 | 13.37 | 1.07 | 1.90 | 2.70 |
| Below 300 × 300 (mm) | 14.92 | 19.34 | 30.11 | 13.34 | 19.08 | 27.77 | 2.11 | 3.24 | 5.05 |
| Total | 24.62 | 35.72 | 52.20 | 21.45 | 32.79 | 45.80 | 3.89 | 6.21 | 9.21 |
| Panel Size (mm) | Pressure Differences of Panel Types | ||||||||
| Traditional Luminaire (L-D) | LED Flat Panel Luminaire (LE-D) | Air return Panel (R-D), Filtered Air Return Panel (RF-D) | |||||||
| 10 Pa | 25 Pa | 50 Pa | 10 Pa | 25 Pa | 50 Pa | 10 Pa | 25 Pa | 50 Pa | |
| Each piece 603 × 603 (mm) | 9.49 | 18.74 | 28.59 | 3.78 | 5.92 | 7.15 | X | X | X |
| 300 × 603–603 × 603 (mm) | Without the size | ||||||||
| Below 300 × 300 (mm) | Without the size | ||||||||
| Total | 9.49 | 18.74 | 28.59 | 3.78 | 5.92 | 7.15 | X | X | X |
| Panel Size (mm) | Pressure Differences of Panel Types | ||||||||
| 9 mm Gypsum Board (G-U) | 3.5 mm Calcium Silicate Board (S-U) | 15 mm Glass Fiber Board (F-U) | |||||||
| 10 Pa | 25 Pa | 50 Pa | 10 Pa | 25 Pa | 50 Pa | 10 Pa | 25 Pa | 50 Pa | |
| Each piece 603 × 603 (mm) | 7.91 | 14.73 | X | 8.34 | 16.82 | X | 10.41 | X | X |
| 300 × 603–603 × 603 (mm) | 9.44 | 15.03 | X | 10.27 | 17.36 | X | 11.12 | X | X |
| Below 300 × 300 (mm) | 12.56 | 16.23 | X | 13.10 | 16.88 | X | 14.29 | X | X |
| Total | 29.91 | 45.99 | X | 31.71 | 51.06 | X | 35.82 | X | X |
| Panel Size (mm) | Pressure Differences of Panel Types | ||||||||
| Traditional Luminaire (L-U) | LED Flat Panel Luminaire (LE-U) | Air return Panel (R-U),Filtered Air Return Panel (RF-U) | |||||||
| 10 Pa | 25 Pa | 50 Pa | 10 Pa | 25 Pa | 50 Pa | 10 Pa | 25 Pa | 50 Pa | |
| Each piece 603 × 603 (mm) | 12.08 | 21.72 | X | 8.11 | 15.26 | X | X | X | X |
| 300 × 603–603 × 603 (mm) | Without the size | ||||||||
| Below 300 × 300 (mm) | Without the size | ||||||||
| Total | 12.08 | 21.72 | X | 8.11 | 15.26 | X | X | X | X |
Publisher’s Note: MDPI stays neutral with regard to jurisdictional claims in published maps and institutional affiliations. |
© 2021 by the authors. Licensee MDPI, Basel, Switzerland. This article is an open access article distributed under the terms and conditions of the Creative Commons Attribution (CC BY) license (https://creativecommons.org/licenses/by/4.0/).
Share and Cite
Liu, S.-H.; Lin, C.-Y.; Chuang, Y.-J. Study of Relationships between Ceiling Smoke Leakage Rate and Evacuation Time in the Ward. Int. J. Environ. Res. Public Health 2021, 18, 13280. https://doi.org/10.3390/ijerph182413280
Liu S-H, Lin C-Y, Chuang Y-J. Study of Relationships between Ceiling Smoke Leakage Rate and Evacuation Time in the Ward. International Journal of Environmental Research and Public Health. 2021; 18(24):13280. https://doi.org/10.3390/ijerph182413280
Chicago/Turabian StyleLiu, Shuo-Hong, Ching-Yuan Lin, and Ying-Ji Chuang. 2021. "Study of Relationships between Ceiling Smoke Leakage Rate and Evacuation Time in the Ward" International Journal of Environmental Research and Public Health 18, no. 24: 13280. https://doi.org/10.3390/ijerph182413280
APA StyleLiu, S.-H., Lin, C.-Y., & Chuang, Y.-J. (2021). Study of Relationships between Ceiling Smoke Leakage Rate and Evacuation Time in the Ward. International Journal of Environmental Research and Public Health, 18(24), 13280. https://doi.org/10.3390/ijerph182413280