1. Introduction
As climate change is not only increasing average temperatures globally, but also the frequency of extreme heat events [
1], an increasing number of workers (e.g., military, construction, agriculture, etc.) will be exposed to these hotter temperatures on a more frequent basis [
2,
3,
4,
5,
6,
7]. Workers experience a 2% loss in productivity for each 1 °C increase in wet bulb globe temperature (WBGT) ≥ 24 °C [
6], and in addition to productivity losses, the number of heat-related injuries and illnesses at job sites is on the rise. For example, in construction settings, the risk of heat-related deaths has increased since the 1990s, and is predicted to continue to increase unless heat-mitigation strategies are adopted at these sites [
7]. One such heat-mitigation strategy is to monitor core temperature (T
C) and alert workers when they reach temperature thresholds that predispose workers to heat-related injuries and illnesses (i.e., 38.2–38.5 °C; [
8]). While these T
C thresholds are ~1 °C lower than the T
C at which heat injuries and illnesses typically surface, research shows that if workers stop and rest to hydrate and cool down at these lower T
C thresholds, they will be able to work for prolonged periods of time in the heat without ever reaching these detrimental T
C [
6,
8,
9]. However, accurately monitoring individuals’ T
C on a daily basis at the job site is prohibitively invasive (i.e., rectal and esophageal probes) or expensive (i.e., gastrointestinal pill). Thus, it has been a long-standing goal of many entities to develop a way to non-invasively estimate T
C using other physiological parameters like heart rate, skin temperature, and heat flux [
10,
11,
12,
13,
14,
15,
16,
17,
18].
As computational and machine learning approaches have become faster and more accessible over the last decade, there has been a renewed interest in algorithms designed to continuously predict T
C (in real-time) based on various environmental and physiological parameters [
17]. Various research groups have published T
C algorithms that meet field-established accuracy standards through the use of easily obtainable physiological measurements (e.g., heart rate and skin temperature) collected during physical activity [
10,
11,
12,
13,
14,
15,
16,
17,
18]. However, while model accuracy is high, many of these algorithms were trained and validated on datasets involving primarily young fit males [
11,
12,
13,
14,
16,
18,
19], or only hot conditions [
19], or with minimal data for ground truth T
C ≥ 38.5 °C [
10,
14,
16,
19]—the temperatures above which heat injuries and illnesses are most prevalent, and thus accuracy is of utmost importance.
Another important factor to consider is that many of the previous T
C algorithms have been designed using various laboratory-grade physiological monitoring devices like chest straps for monitoring heart rate or thermocouples for measuring skin temperature [
10,
11,
12,
13,
14,
15,
16]. While these physiological measurements using laboratory-grade equipment are highly accurate, these sorts of measurements are typically cumbersome to implement daily as they can interfere with worker comfort. Additionally, each physiological parameter being measured often has a separate device and output (e.g., one device for heart rate and a separate device for skin temperature), which makes real-time integration of these measurements into a T
C prediction difficult. As such, a core temperature-monitoring algorithm implemented in occupational settings must generally meet the following criteria: (1) small enough not to interfere with the individual’s work tasks, (2) waterproof/sweat proof, (3) continuously (non-invasively) monitor various physiological parameters throughout the day from a single location, (4) be intrinsically safe, and (5) meet the field-established accuracy criteria across a range of body temperatures and environmental conditions [
9,
17]. While it has been suggested that such T
C algorithms could be implemented in a wearable device [
17], we are only aware of one recent study that reported the reliability and validity of a T
C algorithm to be implemented in a wearable device using heat flux sensors [
20]. The authors concluded that while this wearable device provided reliable T
C measurements, it did not provide accurate T
C measurements [
20]. Consequently, we are unaware of any studies showing T
C can be accurately implemented into a commercially available wearable device.
Thus, the purpose of this study was determine whether the Kenzen wearable device could accurately predict TC continuously during physical activity across a range of environmental conditions. The Kenzen device is a wearable device worn on the upper arm, attached by Velcro straps, and is designed to meet the wearable device criteria for the occupational settings listed above. Equally important, another goal of this study was to address some of the limitations of previous studies by developing a non-invasive estimate of TC that meets field-established accuracy criteria for (a) men and women, (b) physical activity in a wide variety of environmental conditions, and (c) TC ≥ 38.5 °C.
2. Materials and Methods
2.1. Subject Characteristics and Experimental Design
The Kenzen device is a sweatproof and waterproof wearable device worn on the upper arm. The device has a photoplethysmography (PPG) sensor to measure heart rate (HR), along with temperature and relative humidity sensors on the inner and outer side of the device to measure skin-side and ambient-side temperatures and relative humidity (RH), respectively. Additionally, a 3-axis accelerometer provides step rate measurements. Temperature and humidity measurements are collected from the same single sensor, and accurately measure temperature and relative humidity within ranges of 0–90 °C and 0–100% RH, respectively, with a reported accuracy of ±0.2 °C and 2% RH, respectively.
For each trial, subjects set up a user profile through the Kenzen application (iOS and Android), where the onboarding process involves inputting their age, height, body mass, and biological sex, and answering a brief medical history questionnaire about previous heat-related injuries and/or illnesses and current medications they are taking to treat cardiovascular and/or neurological conditions. In this dataset, all subjects were free from any diseases or conditions that would affect thermoregulation, sweating, and/or core body temperature. Subjects were also free from any heat-related injuries or illnesses in the last six months. All subjects’ data were de-identified (via the universities and/or through the Kenzen platform) before being used retrospectively for the algorithm development in this manuscript; thus, according to the Advarra IRB, the research project did not meet the DHHS definition of human subjects research under 45 CFR 46, and therefore, did not require IRB oversight.
Twenty-seven subjects (19 males and 8 females) completed 52 exercise trials (14 trials completed by females; subjects’ mean ± SD (range) for age = 28.9 ± 7.8 y (21–62 y), body mass = 75.2 ± 9.9 kg (53–96 kg), height = 176.1 ± 9.1 cm (149–191 cm), body surface area = 1.9 ± 0.17 m
2). On average, subjects completed ~2 trials (mean ± SD = 1.92 ± 1.17; median = 2); however, depending on the study and experimental design, several subjects completed only one trial, while one subject completed a total of six trials in various environmental conditions. Body surface area was calculated according to Dubois and Dubois equation [
21]. None of the subjects were heat acclimatized or heat acclimated.
Data to train and test the Kenzen T
C algorithm comprised 52 trials from four different studies (i.e., Study 1–4), where subjects wore the Kenzen device on their upper arm during physical activity while ground truth T
C was collected either via a gastrointestinal pill (19 trials) or rectal probe (33 trials) according to standard protocols [
22]. Specifically, studies involving the rectal probe used a standard depth of >10 cm, and those involving the gastrointestinal pill required subjects to take the pill right before going to sleep the night before the morning trial (i.e., >8 h but <12 h before trial start). Of these 52 trials, a total of 4036 min of data were collected from subjects during low- to high-intensity physical activity, ranging from 32–110% of the subject’s age-predicted maximum HR (mean ± SD = 71 ± 16% [
23]), in a variety of environmental conditions from 13.4–43.2 °C (mean ± SD = 28.5 ± 7.2 °C), and trial lengths spanning 40 to 107 min (mean ± SD = 77 ± 19 min).
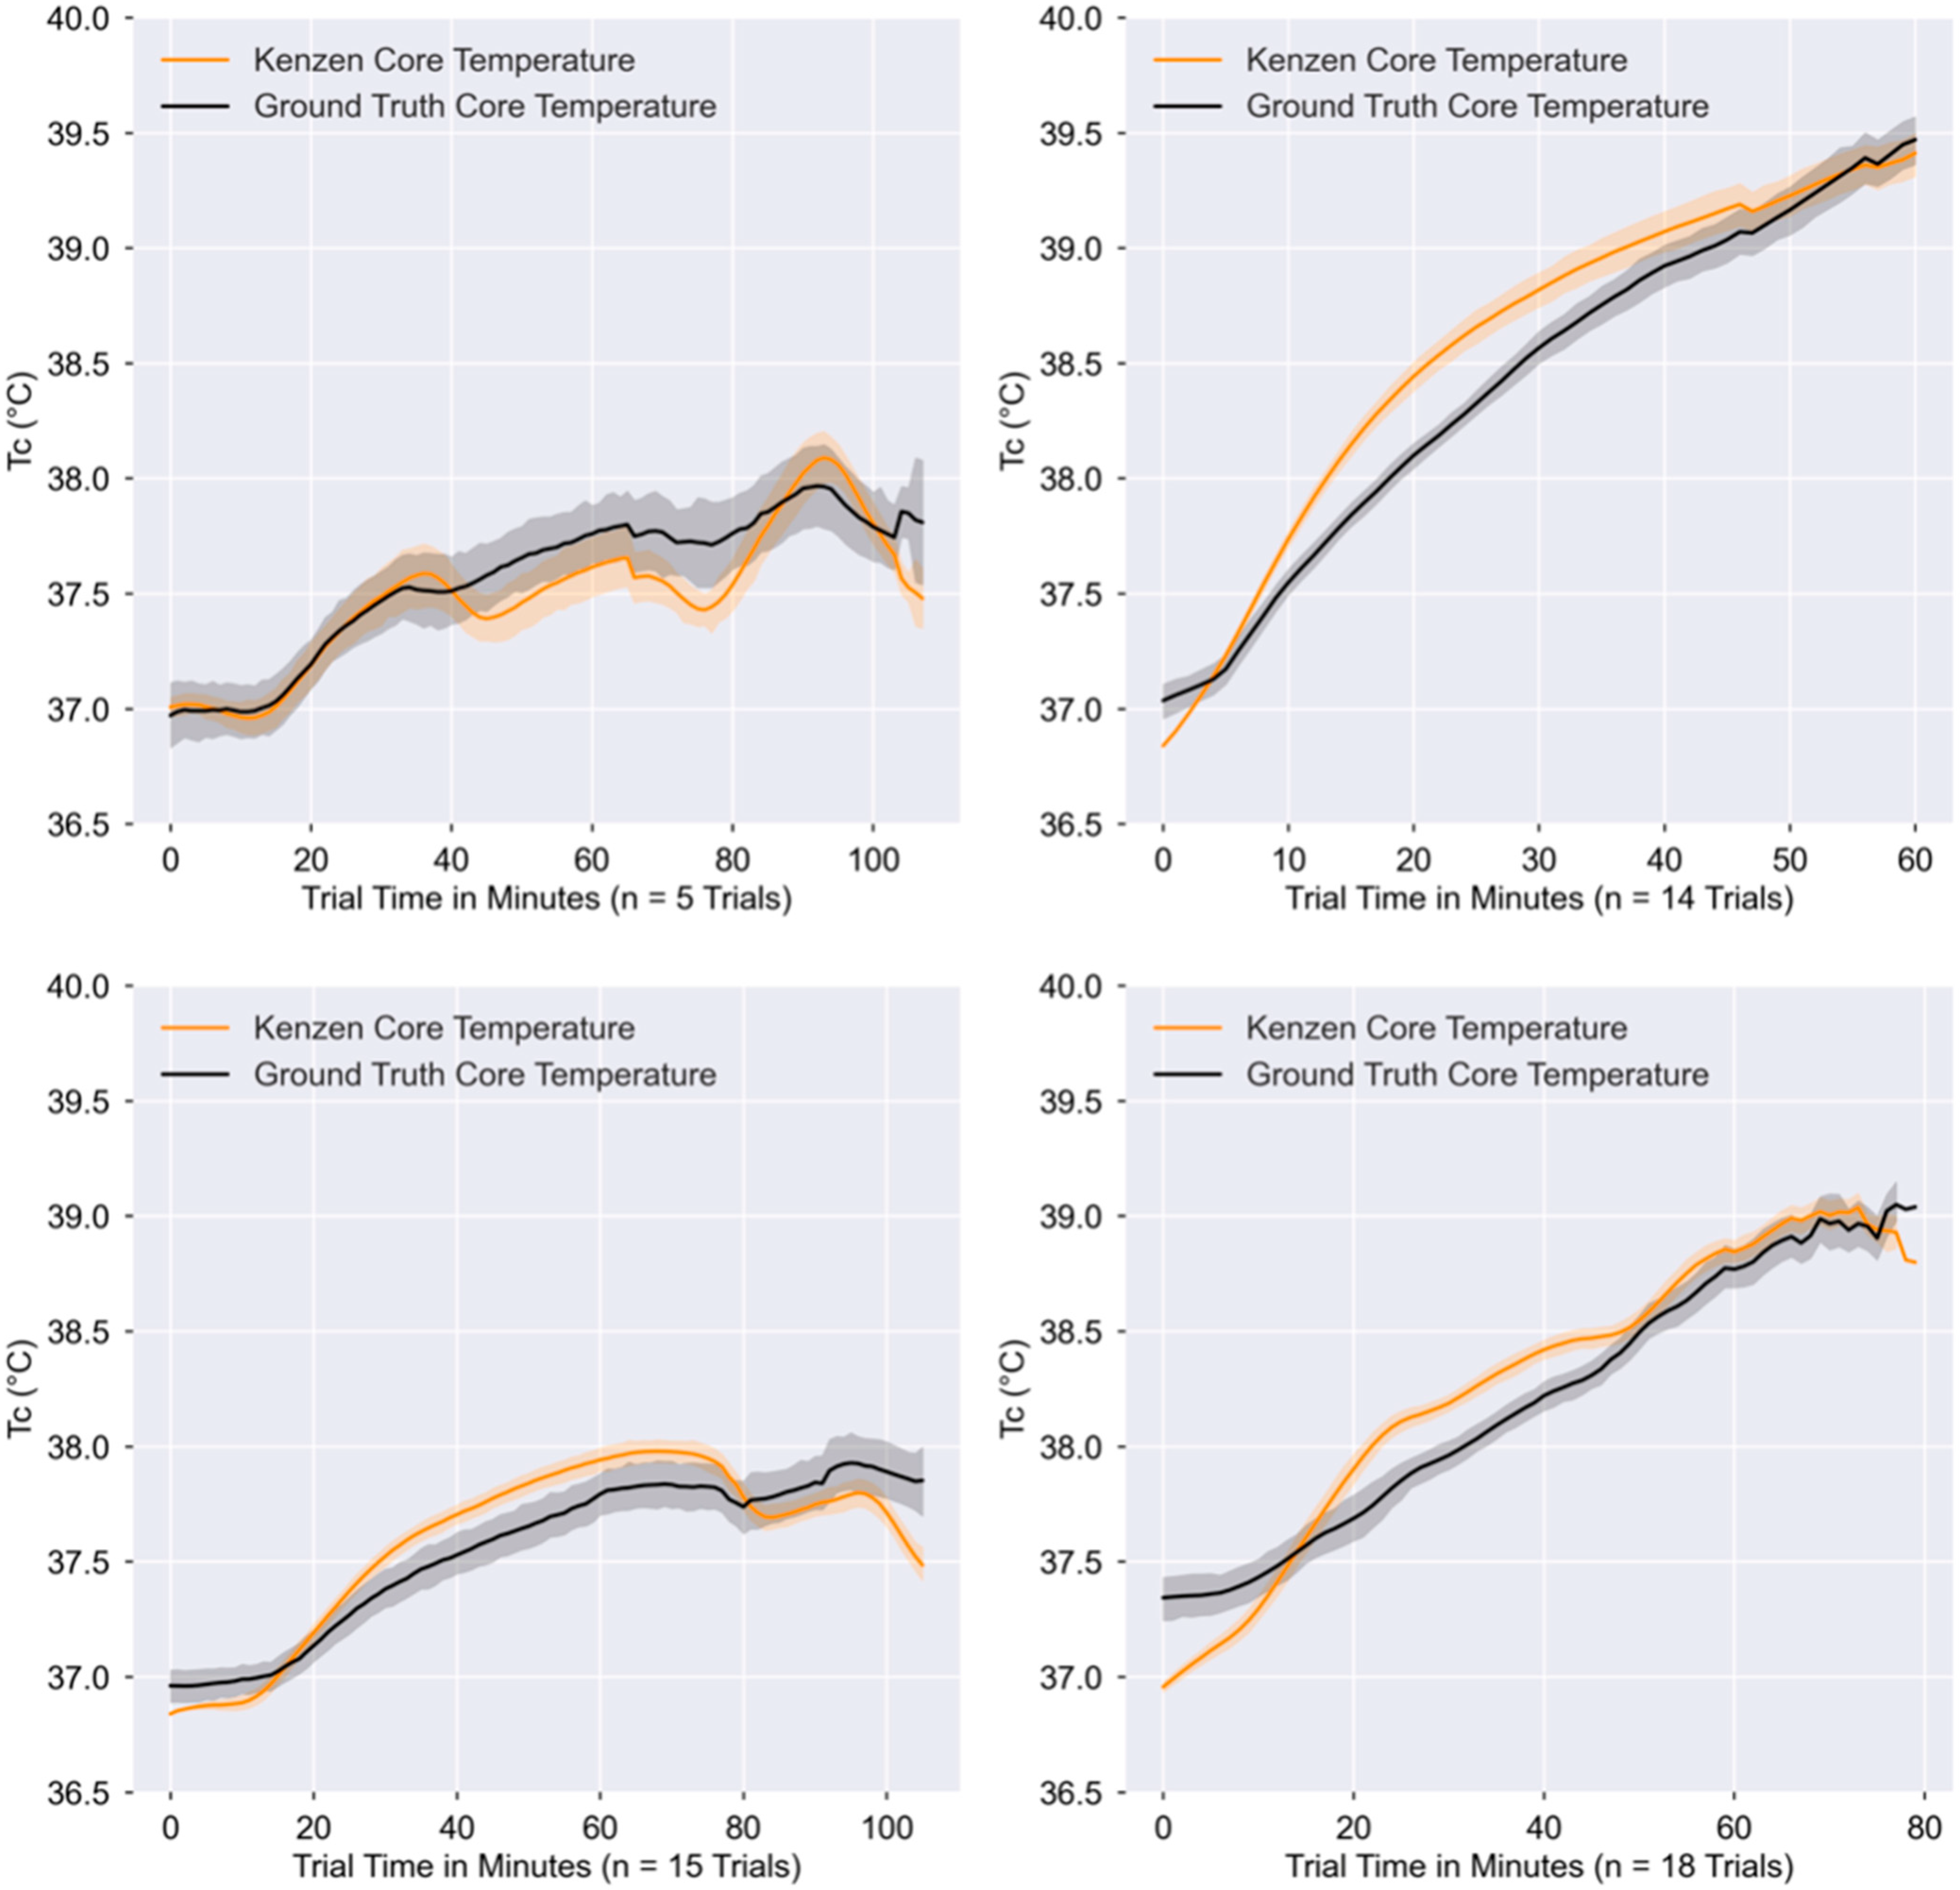
Study 1 (n = 5) involved 10 min seated rest, followed by two 25 min cycling bouts at 50–65% of age-predicted maximum HR, with a 5 min seated rest after each bout, and then a 15 min high-intensity cycling bout at >76% of age-predicted maximum HR followed by a 15 min seated rest. Study 2 (n = 14) involved 60 min of running on a treadmill, where for the first 45 min subjects ran at 70% of their ventilatory threshold and the last 15 min were a self-paced work trial. Study 3 (n = 15) involved a 10 min seated baseline followed by 60 min walking on a treadmill at 6 km/h with a 3% gradient, a 10 min rest, 15 min walking at 6 km/h with a 3% gradient, and a final 10 min seated recovery. Study 4 (n = 18) involved walking (on a treadmill) for 5 min at 3 mph with a 1% gradient, followed by two 15 min periods of running at a moderate intensity (64–76% age-predicted maximum HR), with 5 min of walking at the same speed and gradient in between periods. Subjects then sprinted (rating of perceived exertion of 17–19) for 15 s with 30 s recovery in between, continuing this sprint-recovery cycle until TC exceeded at least 38.25 °C (with a goal of reaching 39.0 °C). For Study 1–3, subjects wore minimal clothing layers (i.e., a t-shirt and shorts, or just shorts and sports bra/no shirt). For Study 4, subjects wore impermeable clothing to assist in elevating core temperature faster.
2.2. Data Preprocessing
Python version 3.8 with Jupyter Notebook were used for all data processing, algorithm development, statistical analyses, and graphics (including the built-in packages of pandas, matplotlib, glob, scikit-learn, scipy stats). The de-identified data were collected from all four studies (i.e., Kenzen data and ground truth TC), parsed, and time-aligned so that sampling rates were similar across variables. Data from the Kenzen device has sampling rates as follows: skin and ambient temperatures, along with skin and ambient relative humidity are collected every 5 s, while HR and step rate are collected every second. After the trials were completed, Kenzen device data were queried from an autonomous database where Kenzen data are stored. The ground truth TC values were collected at different sampling rates based on each study design (see above), ranging from 5 to 300 s apart. Due to variable sampling rates for the ground truth and Kenzen data, an interval of 1 min (60 s) was selected for aggregation and time alignment of all data. This meant that the Kenzen data were aggregated each minute, where the one-minute aggregation for temperature and relative humidity comprised 12 samples, and the one-minute aggregation for HR and step rate comprised 60 samples. For ground truth TC data where the sampling rate of the study exceeded 60 s, the Python interpolate() function was used to interpolate ground truth TC values to obtain a value each minute that would time-align with the Kenzen physiological data for that minute. These one-minute values were used to build the Kenzen TC model, and therefore, to calculate the model accuracy metrics (presented below) which compared the Kenzen TC vs. ground truth TC.
Once data were time aligned, we began feature engineering on the physiological data as inputs to the models. Kenzen HR, skin and ambient temperatures, skin and ambient relative humidity, and step rate were engineered in different ways for each one-minute aggregation, including transformations such as higher-degree polynomials, variable interactions, log transformations, rolling averages, minimum, maximum, median, standard deviation, etc. In order to select the best features for the Kenzen TC algorithm, an iterative process of feature engineering and feature selection were performed on each of these variables and tested separately for each model listed below (see below for details).
2.3. Algorithm Development and Accuracy Criteria
Previous research has used a variety of accuracy criteria to conclude that their algorithm is accurate compared to ground truth T
C measurements, including a mean absolute error (MAE) ≤ 0.3 °C, mean bias < 0.1 °C, root mean squared error (RMSE) ≤ 0.35 °C, standard error of the measurement (SEM) ≤ 0.2 °C, limits of agreement (LOA) ± 0.58 °C, and/or a Pearson
r correlation
r ≥ 0.7 [
12,
14,
19,
24]. For algorithm development purposes (i.e., to identify which algorithm was performing best during the training phase), we used the criteria of MAE ≤ 0.3 °C to determine whether iterative modifications of our algorithm were improving model accuracy. However, all accuracy metrics were evaluated in the final model and are presented in the results below.
We used a common machine learning approach called leave one out cross validation (LOOCV) to split our dataset into training and test datasets and avoid overfitting [
25]. Briefly, in the LOOCV method, one trial or subject is left out of the training dataset and used as the test dataset; the model is created on the training dataset and then tested on the one dataset that was left out. This process continues in an iterative manner, where each iteration leaves out a different trial. In this case, there were 52 iterations for any given model that was created (e.g., multiple regression with heart rate, skin temperature, and skin relative humidity). The MAE and mean bias from the 52 iterations of the test datasets are then averaged to give an overall model accuracy. In this manner, different models can be tested fairly quickly, where the best model has the lowest MAE. Once the best model was selected, the coefficients of all training iterations were averaged to get the overall T
C model. Then, this overall model was implemented on all 52 datasets to obtain the accuracy metrics outlined in the results below.
Note that as each subject completed a different number of trials (ranging from 1–6, with a median of 2 trials), we completed this LOOCV process by leaving a single trial out each time or by leaving out an entire subject’s set of trials for each iteration (i.e., LOPO, leave one participant out). In doing so, we found no difference in the performance of the algorithm with either method; thus, we used the coefficients for the model based on the LOOCV where each trial was left out.
2.4. Machine Learning Models
The primary purpose of the algorithm was to predict the ground truth TC given the physiological data collected by the Kenzen wearable device and the physical characteristics of the subjects that were collected through the Kenzen app when subjects created a user profile. Several different machine learning models (described below) were trained and tested on the dataset using the LOOCV method (using sklearn LeaveOneGroupOut, where the groups input was the trials), and the accuracy criteria listed above were used to determine whether each model’s performance was better or worse than the previous model. This iterative model selection phase continued until a model met the key accuracy criteria (outlined above); in particular, we wanted to ensure that these accuracy criteria were met when TC was ≥38.5 °C, because temperatures above these TC predispose workers to heat injuries and illnesses.
First, all features were checked for multicollinearity (using python’s statsmodels variance_inflation_factor (VIF)), where features with VIF > 5 were excluded. For each of the models that were tested, feature selection was completed using python packages and functions like the ordinary least squares (OLS) statsmodel package, where variable coefficients with p ≤ 0.05 were selected as being significant predictors in the models (e.g., backward regression). After obtaining the features from the OLS package, the SelectKBest function from the sklearn package was used with the f_regression scoring to further validate that these features should be implemented in the model moving forward. Additionally, we tried other types of machine learning models, such as Lasso and Ridge regressions, XGBoost regressor, Random Forest regressor, and an Extended Kalman Filter (EKF) model, all using the LOOCV method to obtain the model accuracy and select the best model.
It should be noted that while this problem may be approached using deep learning models, there were two main limitations in taking this approach. First, in the field, many workers do not carry phones with them and/or are not near Wi-Fi throughout the day, and so the Kenzen TC algorithm must be implemented on the device firmware and utilize as little memory as possible. Deploying the algorithm on the device firmware ensures that workers will be alerted in real-time when their TC is too high. Second, many of the workers at these sites have inconsistent work schedules (e.g., work for 2 weeks, off for 2 weeks), and so traditional deep learning models that rely on 24 h wear time for continual learning were not possible, and therefore these models would likely not be as accurate compared to simpler machine learning models.
2.5. Statistical Analyses
To evaluate the performance of different Kenzen TC models compared to ground truth TC, different statistical metrics and plot-based representations were used to identify the best-performing model. These statistics were first calculated on each one-minute datapoint for each individual trial (e.g., calculated MAE for a given subject’s trial for a specific category), and then all the one-minute values were averaged across that subject’s trial. Next, the averages from all 52 trials were averaged to give an overall performance value for that model. Each metric—MAE, RMSE, SEM, Pearson r correlation, and mean absolute percent error—were all calculated in the same manner, and the details of these calculations are described below.
The MAE was calculated by taking the absolute value of the difference between the Kenzen TC and the ground truth TC for each minute, and then obtaining the mean from all minutes for that trial. The RMSE was calculated by squaring each minute-based residual, and then calculating the square root of the mean of the residuals for that trial. The Pearson r correlation coefficient was also used to compare the ground truth TC with the predicted Kenzen TC using the pearsonr function from the scipy.stats package in python to obtain a Pearson r correlation coefficient for each trial. The mean absolute percent error (MAPE) was calculated by taking the mean absolute error for each one-minute timepoint and dividing this value by the ground truth TC at that minute, and then taking the average of all one-minute values and multiplying by 100 to obtain a percentage for each trial. Then, all 52 trials’ MAPE was averaged to obtain a final percent error value. The standard error of measurement (SEM) was calculated by taking the standard deviation of all residuals for all minutes in each trial; the SEM from each trial was averaged to get an overall mean SEM.
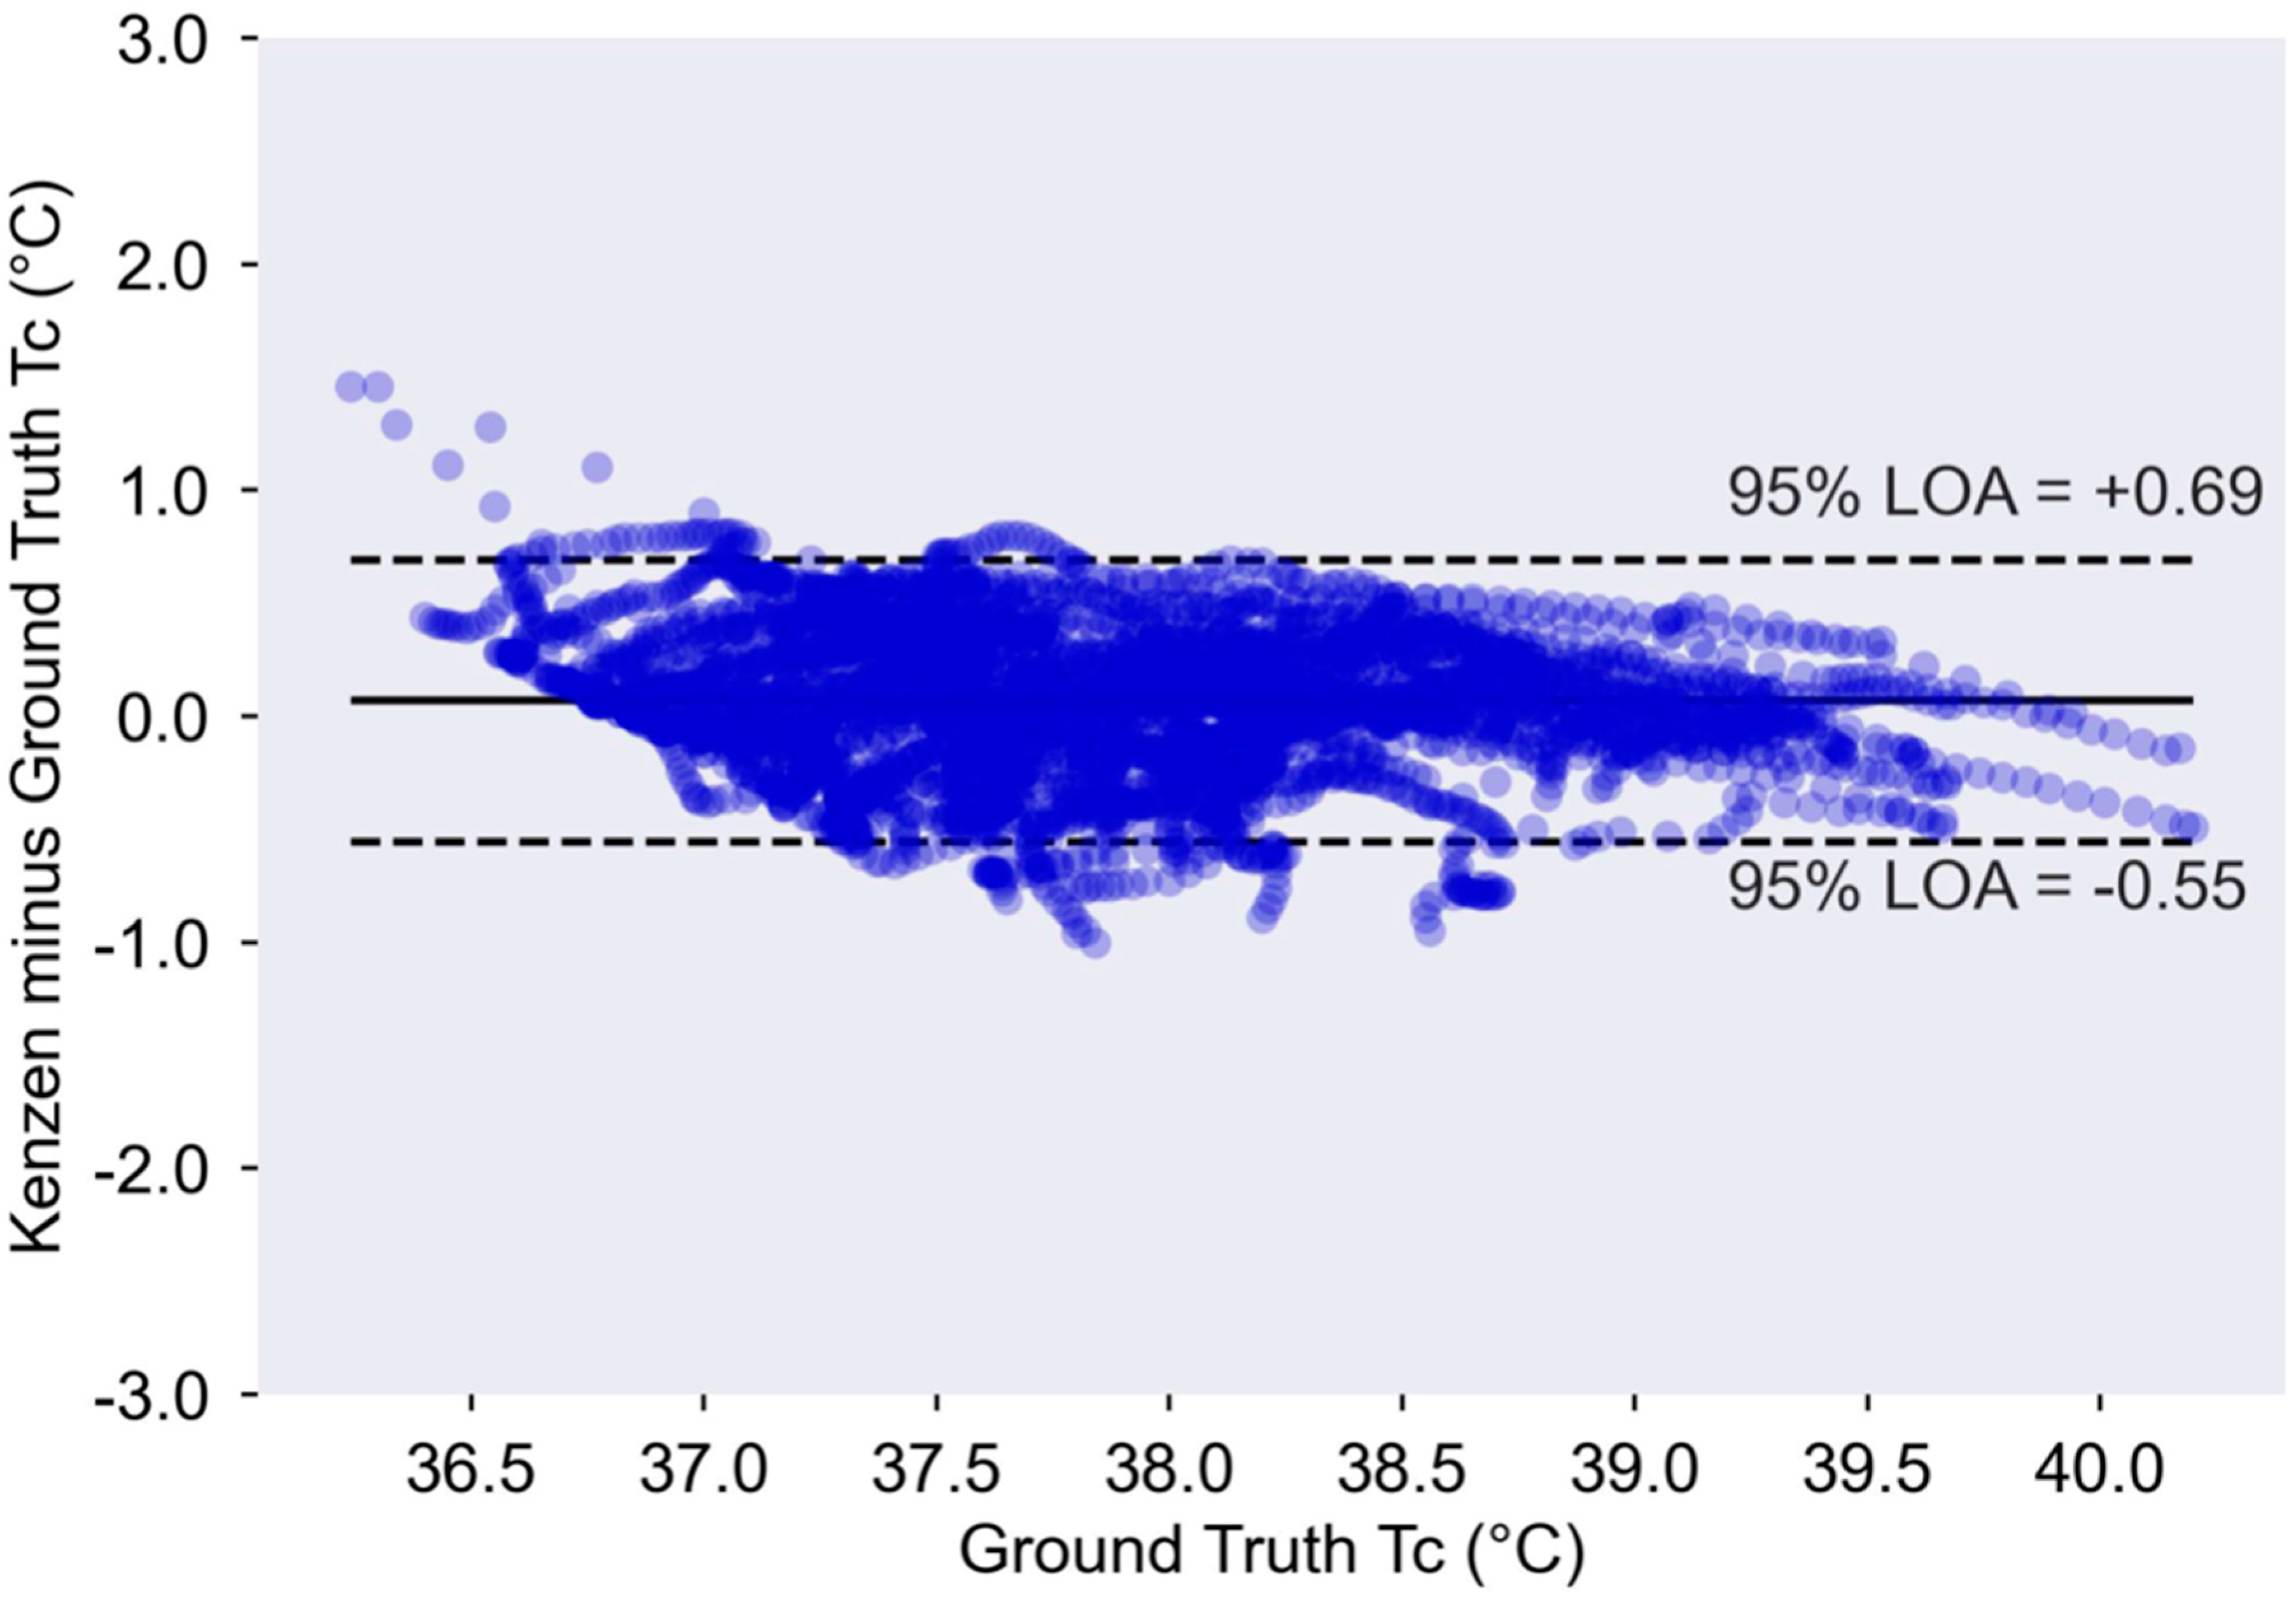
A modified Bland Altman plot was used to identify any patterns or biases in the residuals across the range of ground truth TC. The mean bias was calculated by taking the mean of all of the one-minute errors overall, where ground truth TC was subtracted from Kenzen TC. Thus, a positive mean bias indicates the Kenzen TC overestimated ground truth TC, and a negative mean bias indicates the Kenzen TC underestimates ground truth TC. The 95% LOA were calculated as 1.96 × standard deviation of all errors.
4. Discussion
The aim of this study was to demonstrate that an algorithm to predict core body temperature could successfully be implemented on a wearable device and produce accurate non-invasive TC estimates in real-time. Here, we show that the Kenzen wearable device can accurately predict TC compared to gold-standard measurements of TC via a rectal probe or gastrointestinal pill. Importantly, the Kenzen algorithm maintains high accuracy as TC increases above the point at which heat injuries and illnesses become more prevalent (i.e., ≥38.5 °C). To maintain strong accuracy at higher TC (when workers are at greatest risk of heat-related problems), accuracy is slightly comprised at lower core temperatures, where TC is underestimated (i.e., at rest, TC range of 36–37 °C). Furthermore, the Kenzen TC algorithm remains accurate throughout a wide range of environmental conditions, for both biological sexes, and for physical activity spanning light to vigorous HR zones.
Overall, Kenzen’s T
C accuracy is similar to, and in some cases, more accurate than previously reported T
C algorithms. Seng et al. (2016) also used an EKF model to predict T
C and reported a mean bias of 0.11 °C (vs. Kenzen = 0.08 °C) and an RMSE of 0.29 °C (vs. Kenzen = 0.30 °C) [
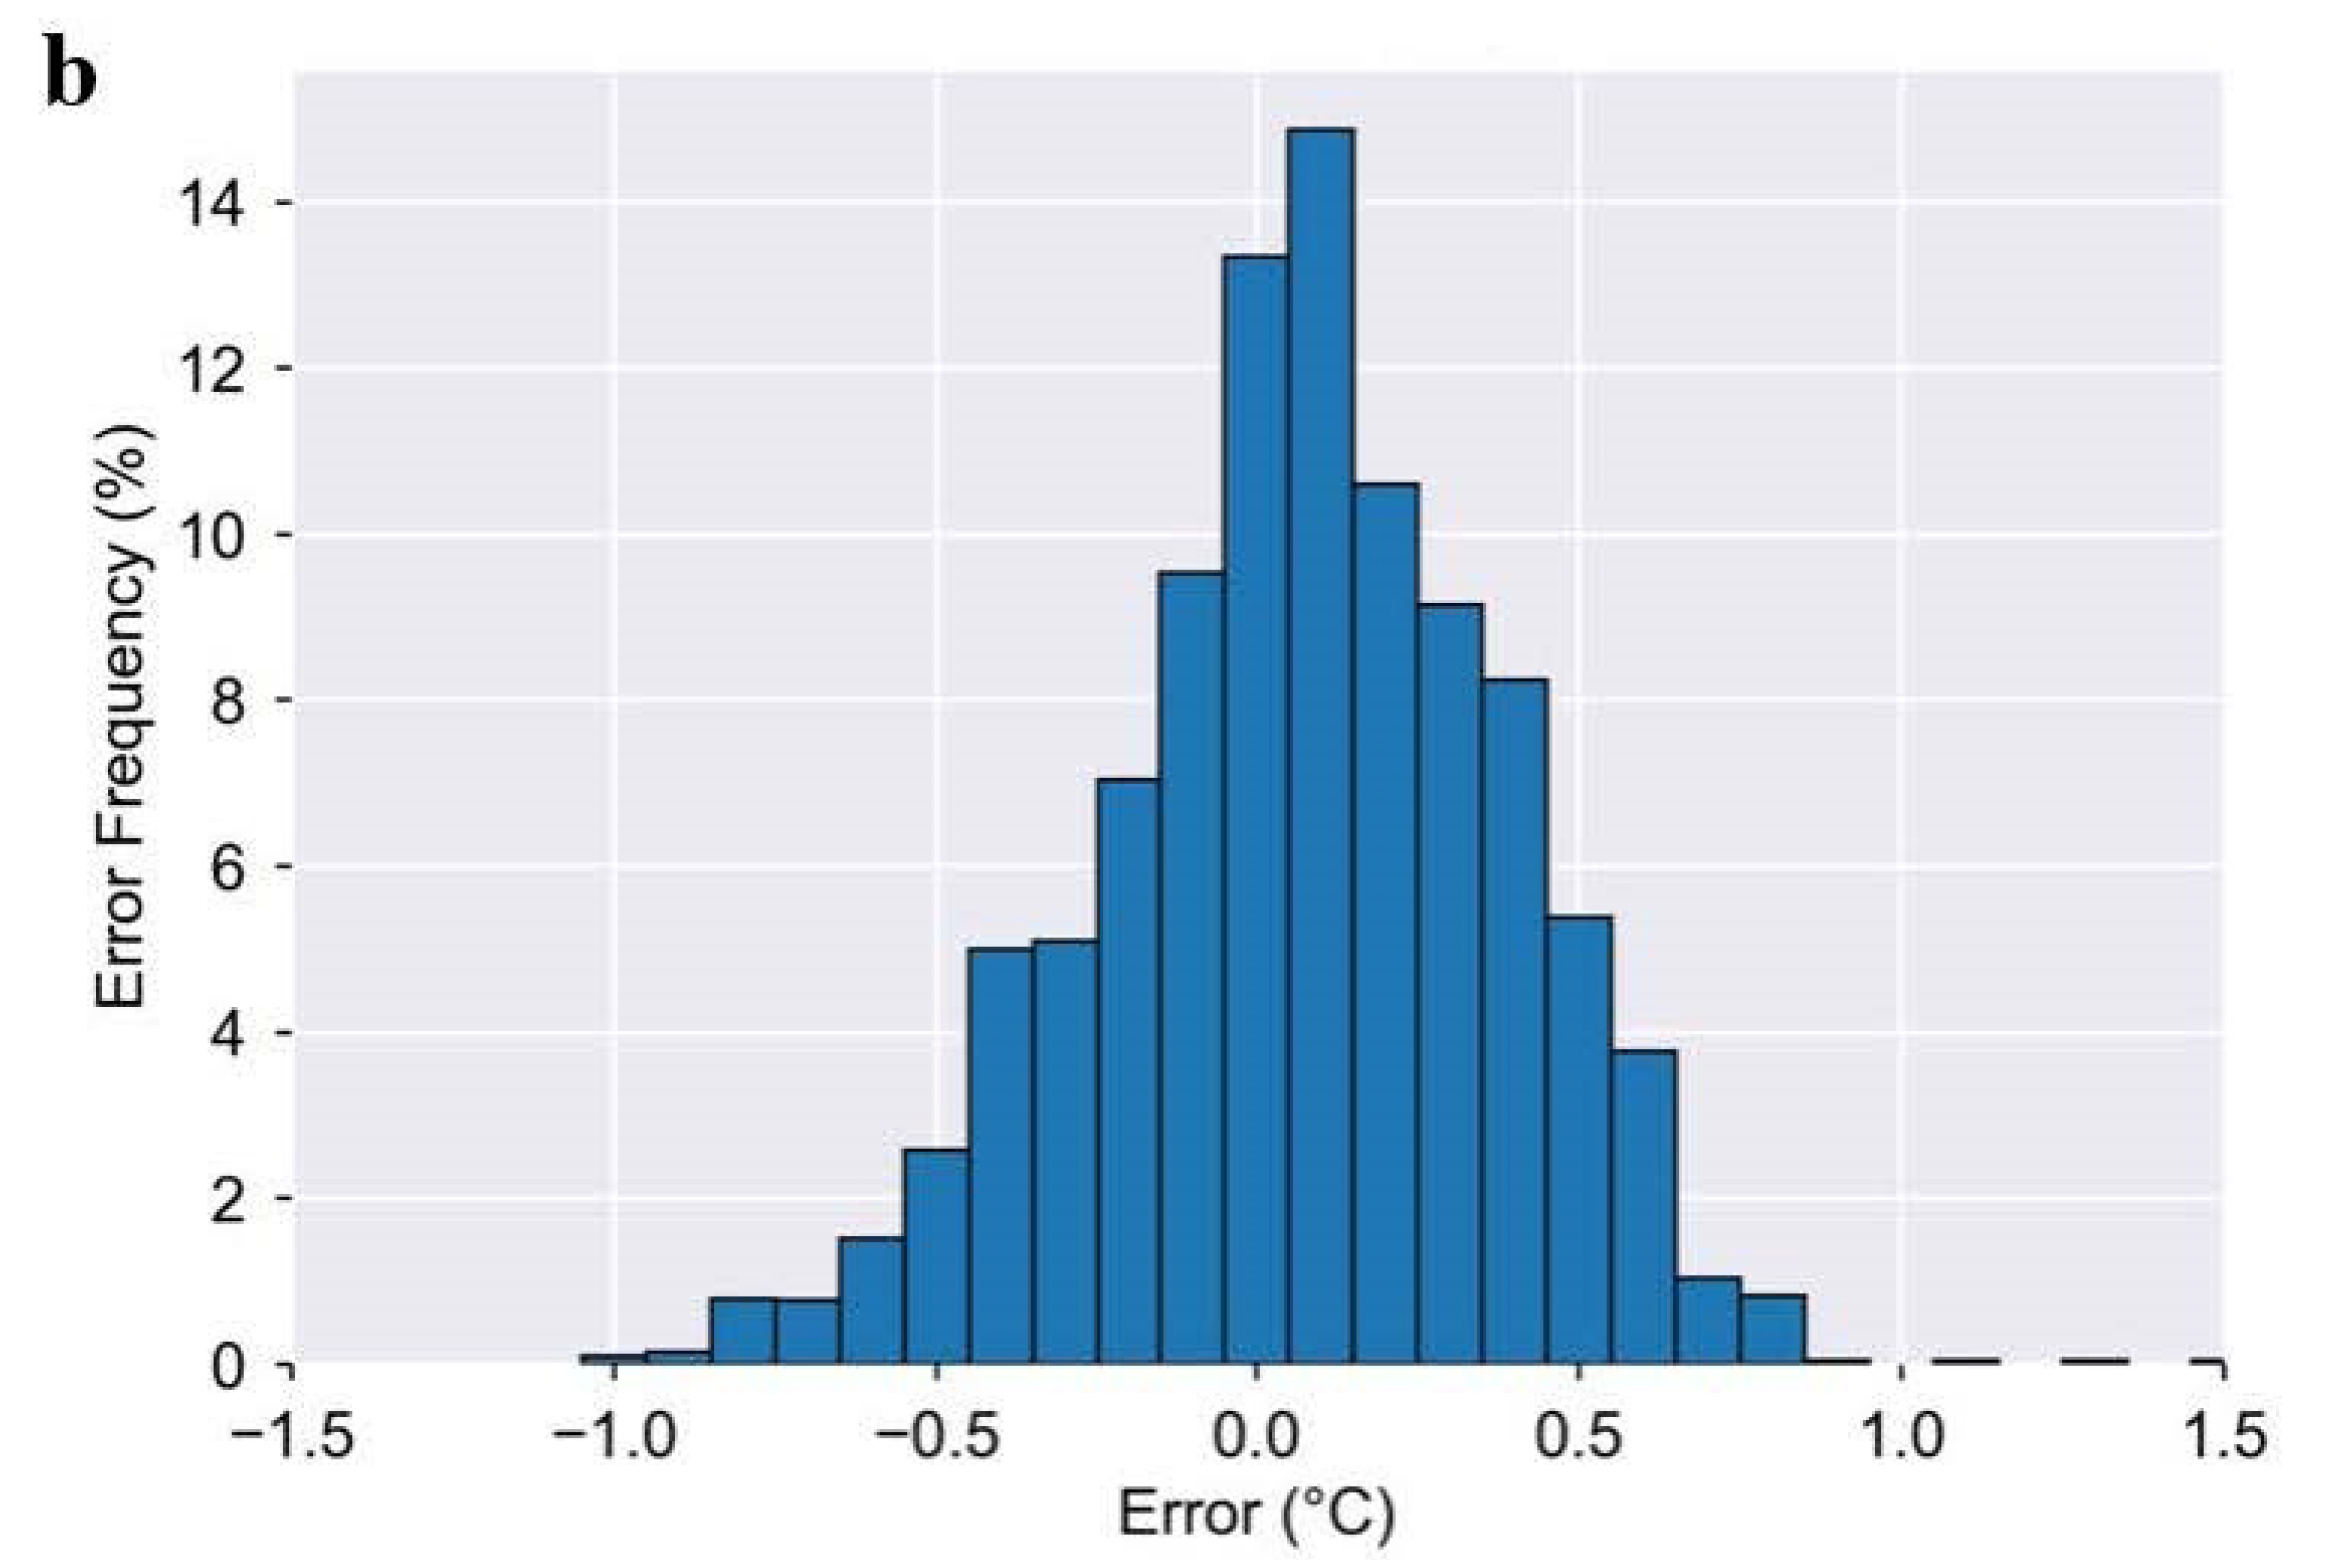
19]. Seng et al. reported that ~87% of their data fell within ≤0.3 °C MAE, while we show that ~70% of Kenzen data fall within MAE ≤ 0.3 °C (
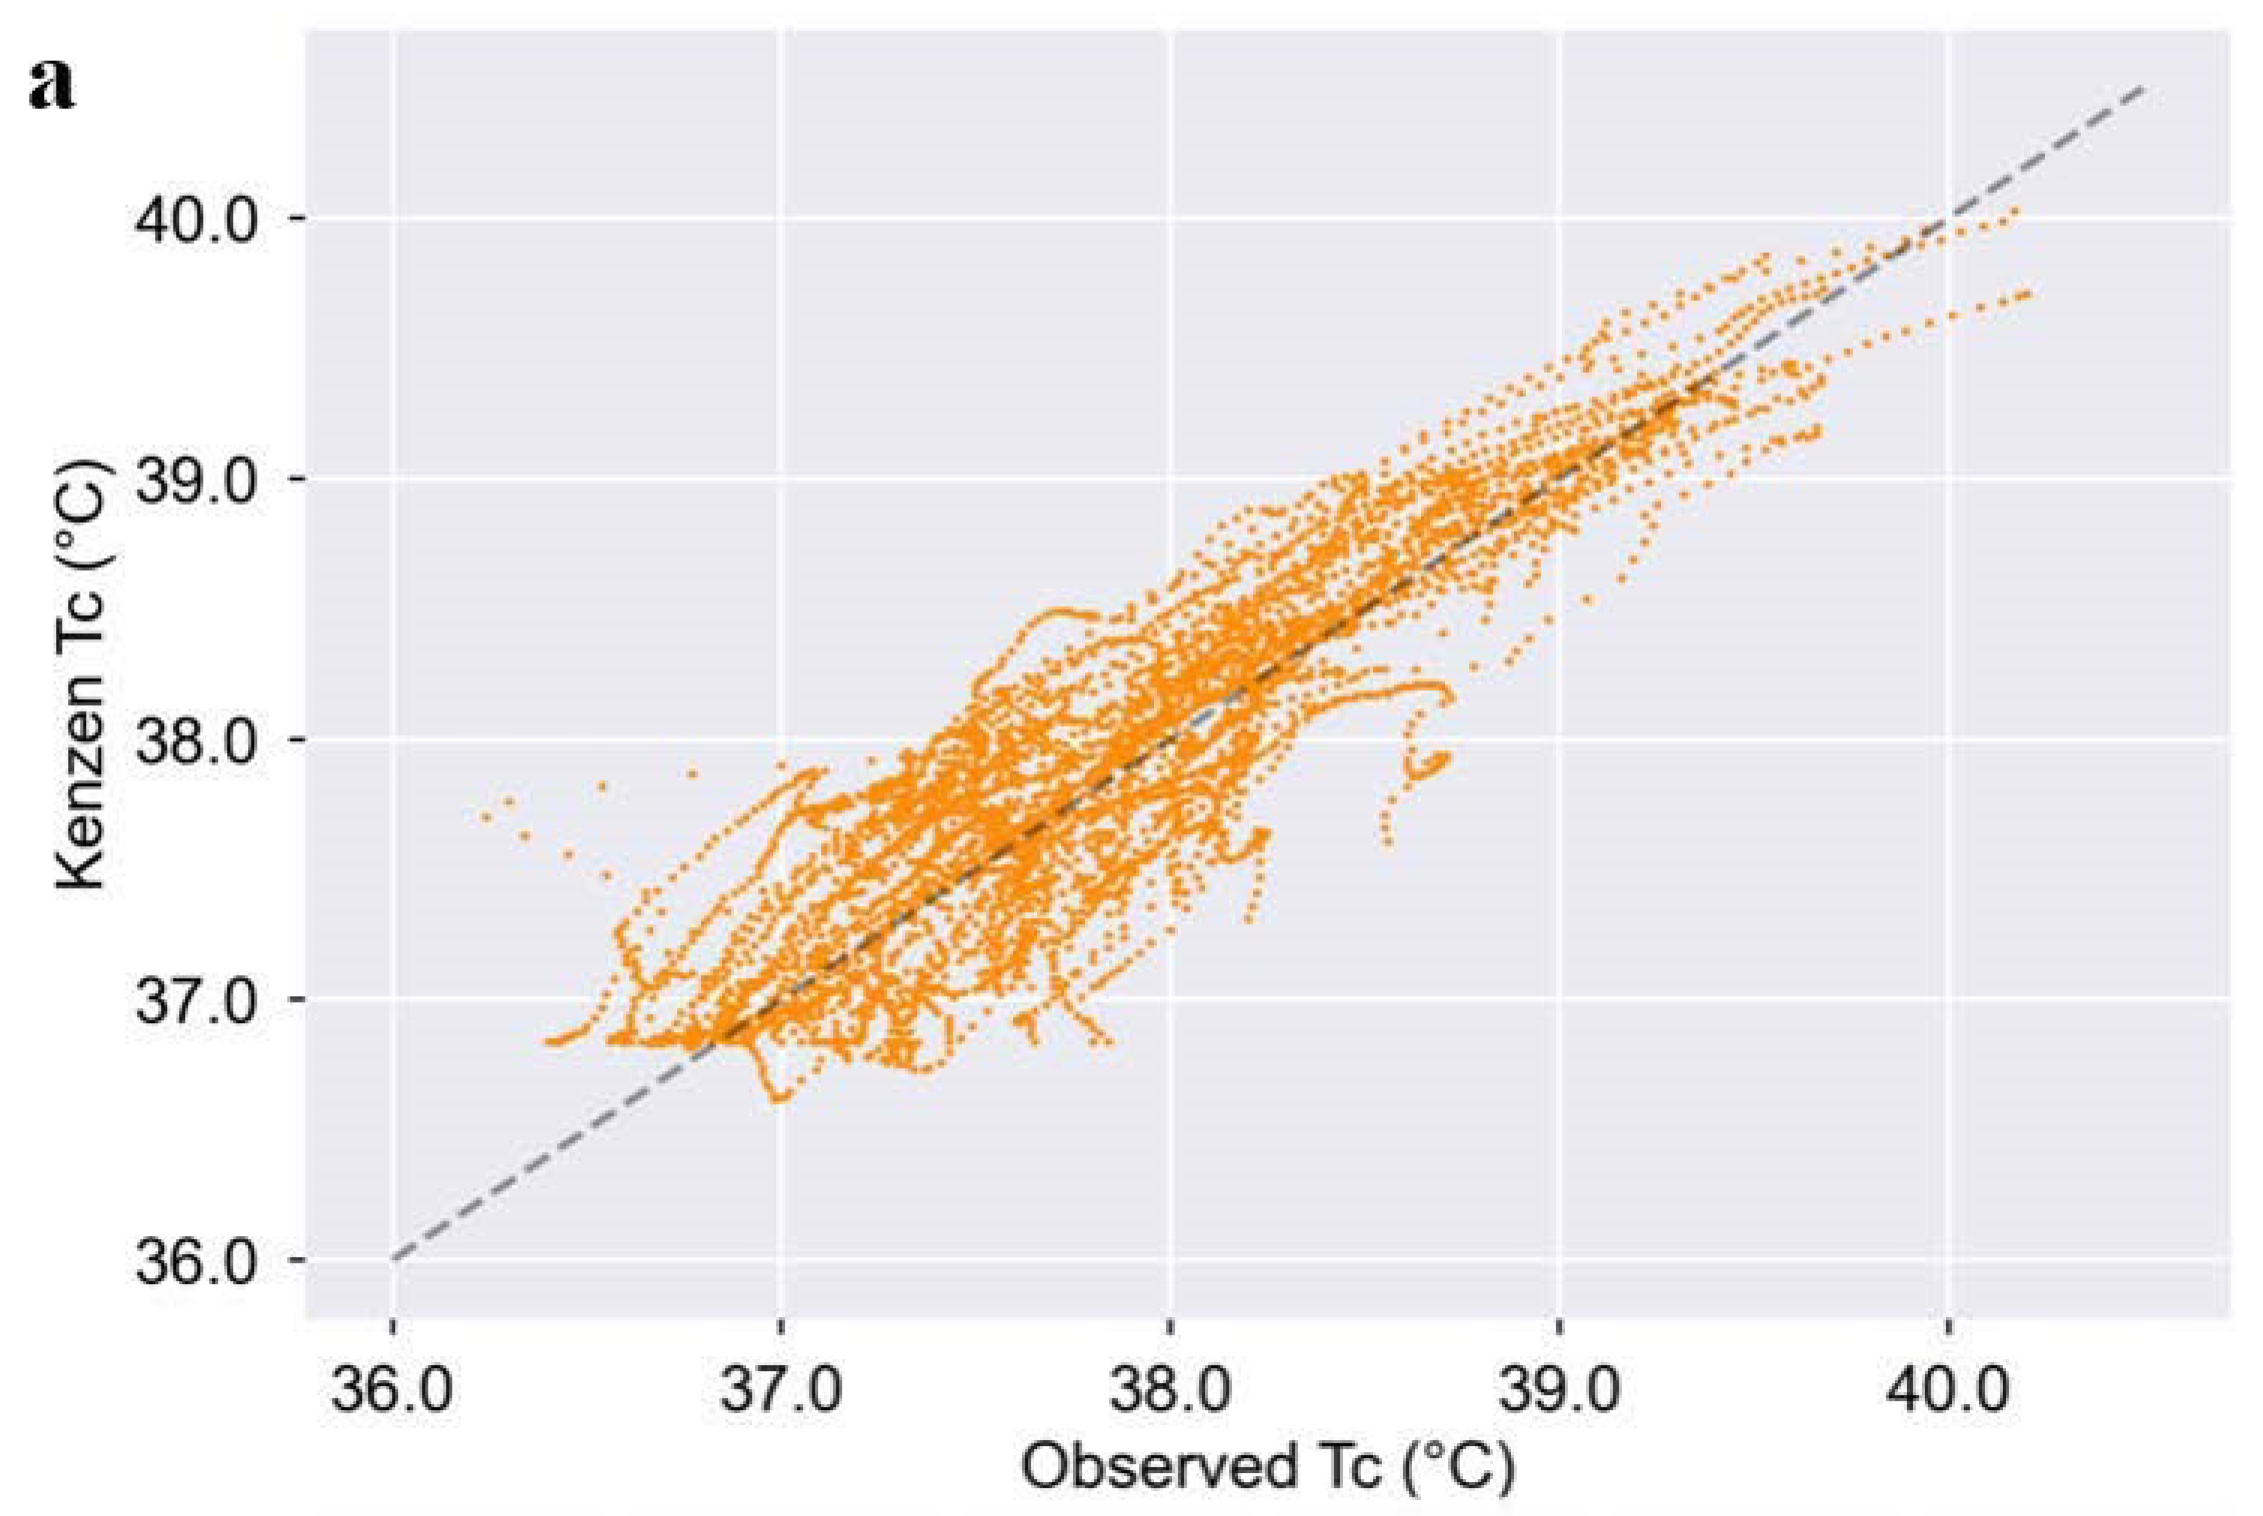
Figure 2). This slightly higher accuracy reported by Seng et al. may be due to the fact that they built and tested their algorithm only on men and within a tight ambient temperature range (30–35 °C), whereas Kenzen’s dataset included women and a much wider temperature range (13–43 °C). Moreover, Kenzen’s algorithm demonstrates a slightly stronger correlation with ground truth T
C than Seng et al. (2016): 0.94 vs. 0.89, respectively [
19]. Although the Kenzen T
C algorithm and Seng et al.’s (2016) algorithm are not the same, they both use an EKF to predict T
C from commonly measured physiological variables. The performance is similar between these two algorithms; however, the Kenzen algorithm was built and tested on a wider variety of environmental conditions, women, and a larger range in ground truth T
C.
Buller et al. (2013) also have a T
C algorithm that uses an EKF model. However, different to Seng et al. and Kenzen’s model, Buller et al.’s model only uses heart rate as the single input variable [
12]. Buller et al. reported an overall mean bias ± LOA of –0.03 ± 0.63 °C, which is similar to Kenzen’s mean bias of 0.07 ± 0.62 °C. Buller et al.’s reported RMSE was 0.30 ± 0.13 °C, which is comparable to that of Kenzen (
Table 1), and they reported a correlation coefficient of 0.84 for the observed vs. predicted T
C, which is slightly lower than Kenzen’s correlation coefficient of 0.94. Although Buller et al. had a much larger test dataset (vs. Kenzen’s), which included a variety of clothing layers and acclimatization states, the training and test datasets only included one female whereas Kenzen’s train/test dataset was comprised of 27% females and a wider range in ages. The environmental conditions for the datasets from Buller et al. (2013) and Kenzen are similar: 13–43 and 9–45 °C, respectively, with slightly colder temperatures in the test dataset for Buller et al. (2013). As the Buller et al. algorithm only uses one input variable, HR, one question that might arise is why it would be necessary to incorporate more variables into the model if the accuracy is similar (between the Buller and Kenzen algorithms). As HR is susceptible to many acute physiological changes (e.g., caffeine, stress and anxiety, drugs and medications, fatigue, etc.), a model that incorporates multiple input variables (especially when they are easily measured simultaneously in a wearable device) will help minimize false alerts and therefore more accurately identify workers that are at core temperature limits where a break is required.
Kenzen’s overall MAE is 0.25 °C throughout a range of exercise intensities and environmental conditions, for both sexes, and a wide range in T
C. Importantly though, the Kenzen T
C algorithm maintains its accuracy (and even becomes more accurate) as the ground truth core temperature exceeds 38.5 °C. This is important because NIOSH recommends workers stop and take a break (to avoid heat injury and illness) at 38.2 and 38.5 °C if workers are unacclimatized or acclimatized, respectively [
8]. In the case of manual labor work settings, where workers typically endure 8+ hour shifts and must stay safe in the heat, it is preferable to slightly overestimate T
C (vs. underestimate) in order to protect these workers from heat-related injuries and illnesses throughout the day. As such, Kenzen’s T
C algorithm was designed to slightly overestimate (vs. underestimate) T
C at these dangerous T
C ranges in order to protect workers, whereas previous algorithms or wearable devices have been shown to underestimate T
C at these higher temperatures [
20], which can put workers at even greater risk for heat injury and illness if solely relying on the wearable device for safety feedback. Another point to note is that this slight overestimation of core temperature at T
C ≥ 38.5 °C may be even greater when compared to the gold-standard T
C measurement of esophageal temperature, since gastrointestinal and rectal temperatures tend to be ~0.24–0.28 °C higher than esophageal temperatures during lower body exercise in the heat which causes a heat sink [
22]. Of course, the magnitude of error between esophageal T
C and Kenzen T
C would also be dependent on the environmental conditions, type and duration of exercise, and therefore further research is needed to better understand how Kenzen T
C compares to esophageal T
C at these higher T
C.
There are many strengths of the current study where the Kenzen T
C algorithm was trained and tested. These strengths include an adequate sample size (52 trials with 27 unique subjects including females), a variety of exercise intensities within and among trials, a wide range of environmental conditions, and a dataset where ~40% of ground truth T
C data were ≥38.0 °C. As a result, the Kenzen T
C algorithm is equally accurate for both biological sexes, for a range of cool to hot environmental conditions, and maintains accuracy at higher T
C which predispose workers to heat injuries and illnesses. Some limitations of the current Kenzen T
C model include minimal clothing layers for most of the studies and a relatively younger subject population. Many of the worksites include older individuals (e.g., >50 y) and workers often wear 2–3 layers of clothing [
3,
4,
5,
6,
9,
27]. Thus, future research should validate the Kenzen T
C algorithm in older adults and individuals wearing heavy clothing layers while working in the heat. Further research should also explore a core temperature algorithm that accounts for subjects being heat acclimatized vs. non-heat acclimatized. Based on previous research [
28], if using an EKF model, it is likely that the seed value may need to be shifted to a lower starting point in heat-acclimatized (vs. unacclimatized) individuals.


 ,
, 

