Analysis of Occupational Accidents in the Spanish Mining Sector in the Period 2009–2018
Abstract
:1. Introduction
2. Materials and Methods
2.1. Study Population
2.2. Methods
3. Results and Discussion
3.1. Accident Analysis
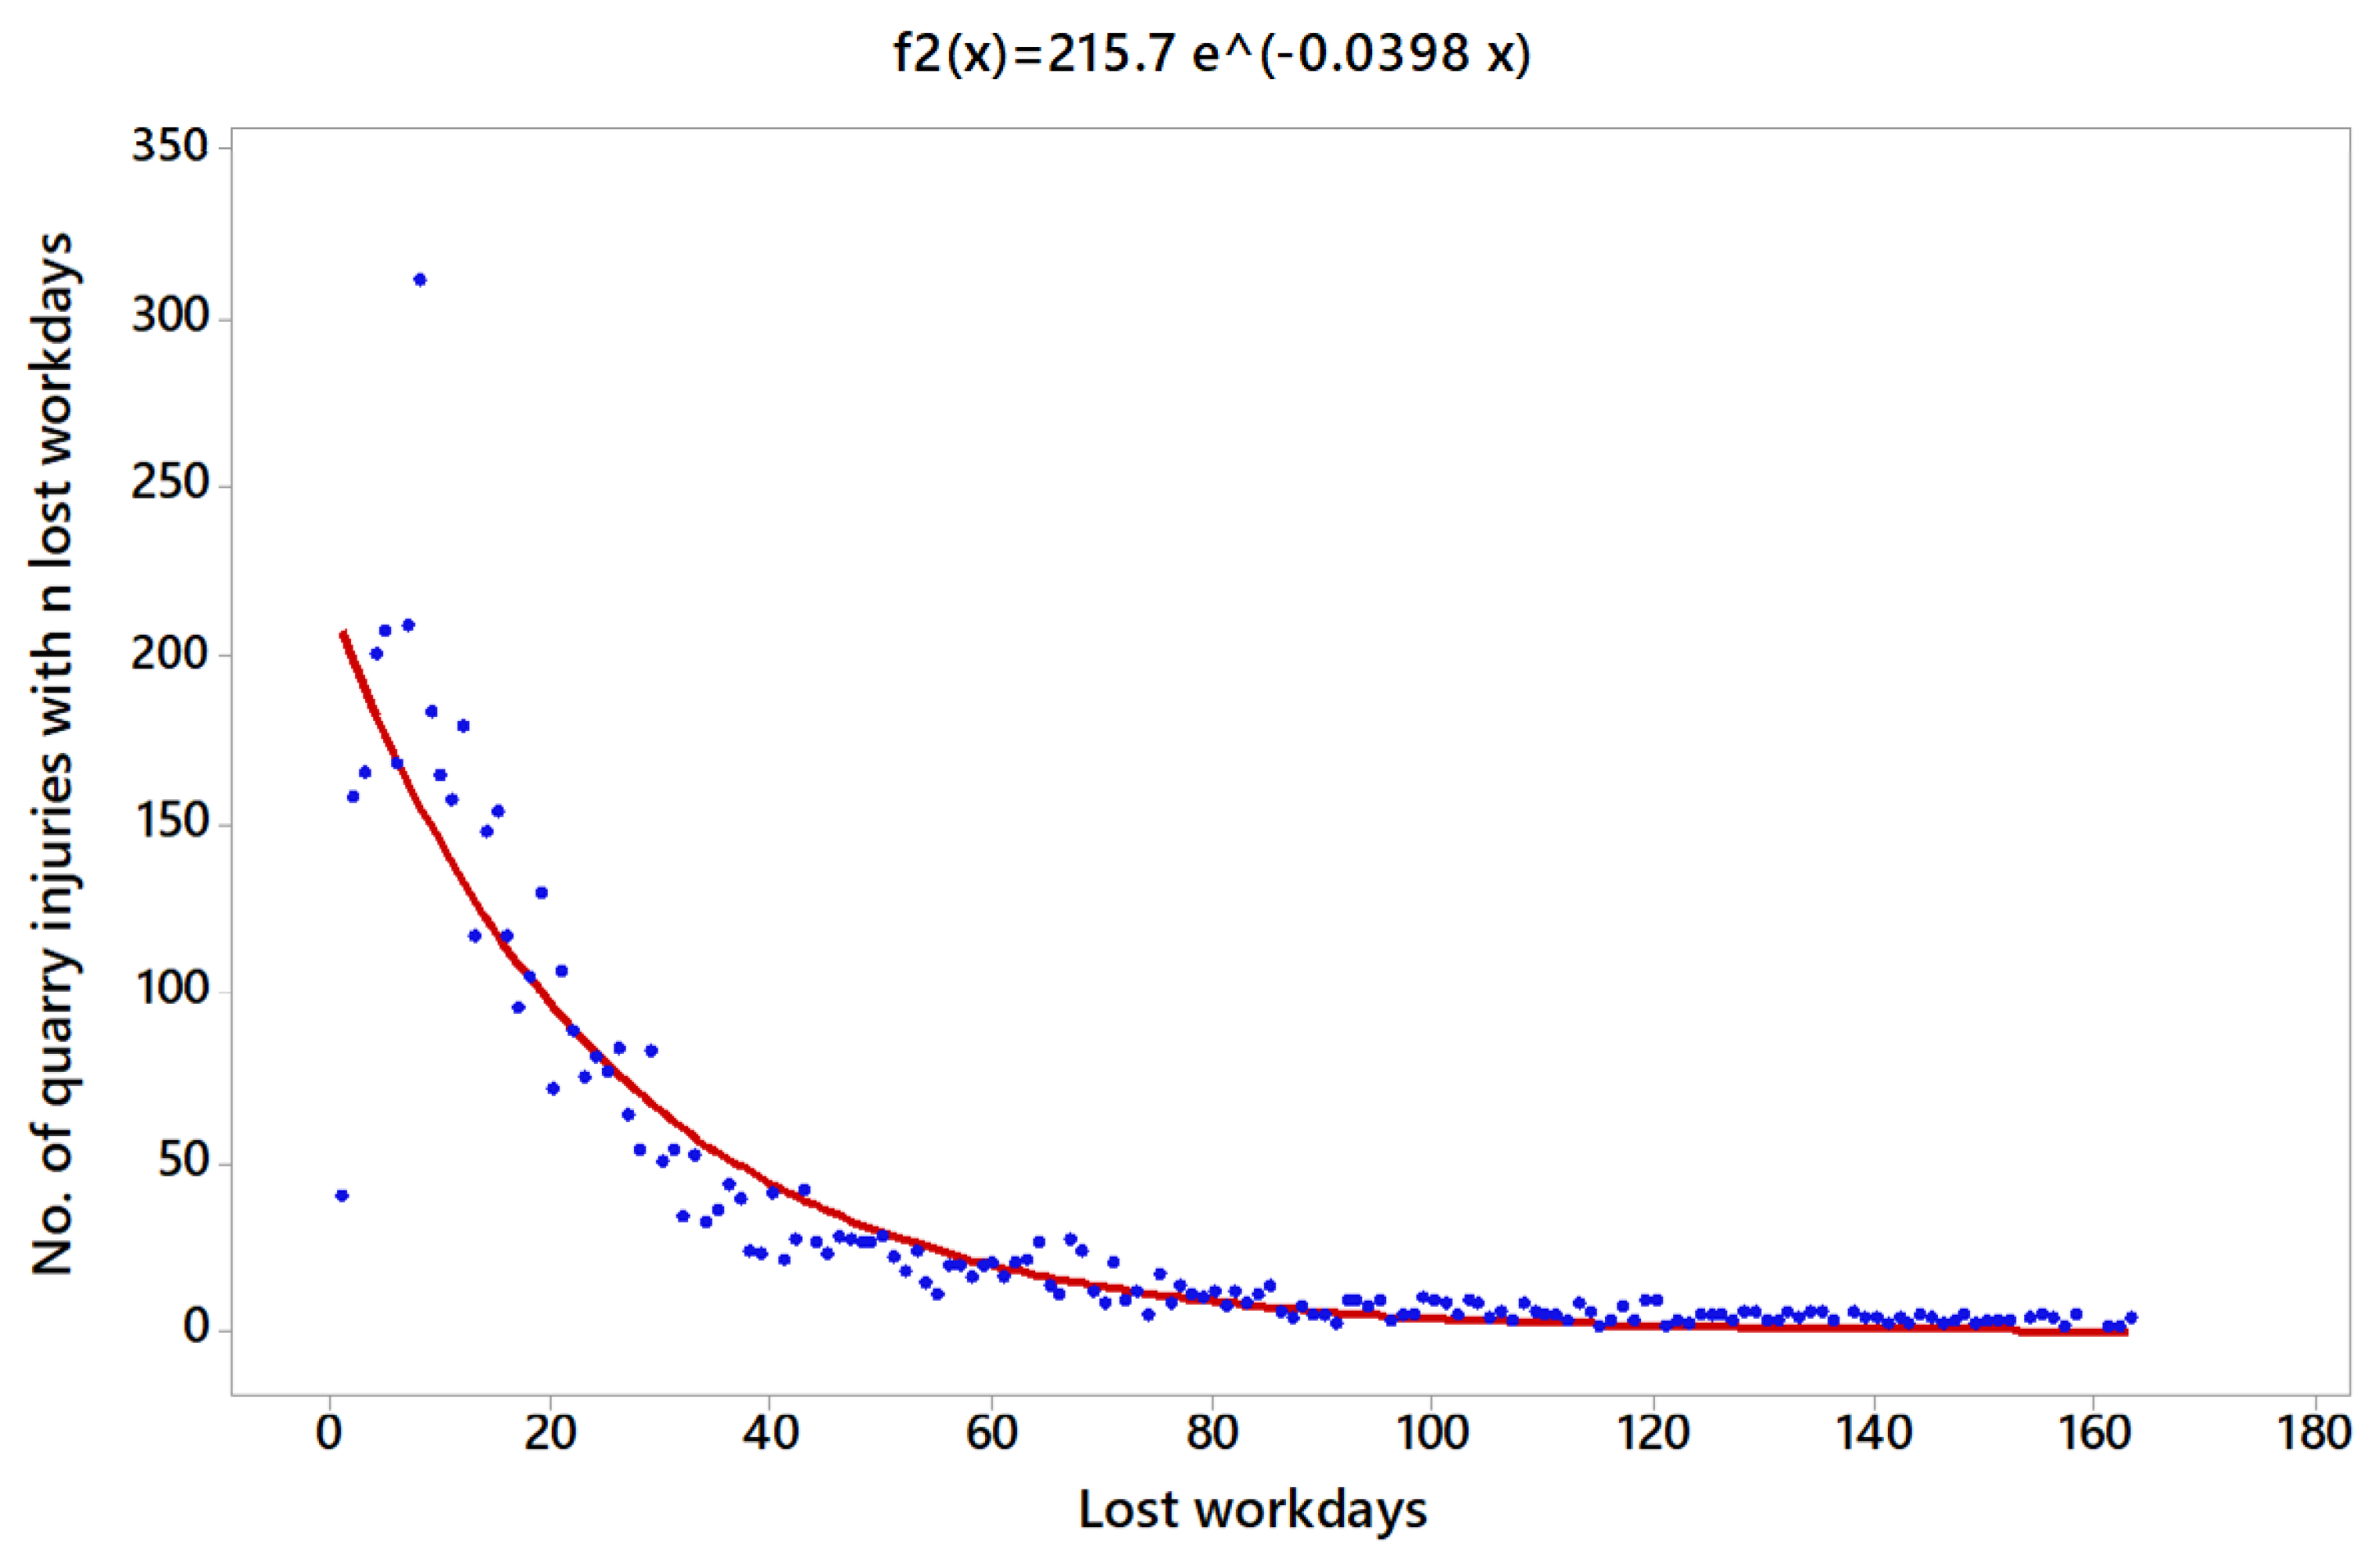
3.2. Analysis of the Distribution of the Number of Accidents Based on the Lost Workdays
3.3. Incidence and Severity Risk Index Based on the Center Size
4. Conclusions
Author Contributions
Funding
Institutional Review Board Statement
Informed Consent Statement
Data Availability Statement
Acknowledgments
Conflicts of Interest
References
- Hämäläinen, P.; Takala, J.; Leena, K. Global estimates of occupational accidents. Saf. Sci. 2006, 44, 137–156. [Google Scholar] [CrossRef]
- International Labour Organization. Safety in Numbers: Suggestions for a General Safety Culture at Work; International Labour Organization: Geneva, Switzerland, 2003; ISBN 92-2-313741-1. [Google Scholar]
- Saxen, H.; Adam, J.L.; Duhamel-Henry, N.; Jacquier, B.; Linares, C.; Hull, B.P.; Leigh, J.; Driscoll, T.R.; Mandryk, J. Factors associated with occupational injury severity in the New South Wales underground coal mining industry. Saf. Sci. 1996, 21, 191–204. [Google Scholar]
- Mitchell, R.J.; Driscoll, T.R.; Harrison, J.E. Traumatic work-related fatalities involving mining in Australia. Saf. Sci. 1998, 29, 107–123. [Google Scholar] [CrossRef]
- Gyekye, S.A. Causal attributions of Ghanaian industrial workers for accident occurrence: Miners and non-miners perspective. J. Saf. Res. 2003, 34, 533–538. [Google Scholar] [CrossRef] [PubMed]
- Martín, J.E.; Rivas, T.; Matías, J.M.; Taboada, J.; Argüelles, A. A Bayesian network analysis of workplace accidents caused by falls from a height. Saf. Sci. 2009, 47, 206–214. [Google Scholar] [CrossRef]
- Sanmiquel, L.; Freijo, M.; Edo, J.; Rossell, J.M. Analysis of work related accidents in the Spanish mining sector from 1982–2006. J. Saf. Res. 2010, 41, 1–7. [Google Scholar] [CrossRef]
- Wu, X.; Li, Y.; Yao, Y.; Luo, X.; He, X.; Yin, W. Development of construction workers job stress scale to study and the relationship between job stress and safety behavior: An empirical study in Beijing. Int. J. Environ. Res. Public Health 2018, 15, 2409. [Google Scholar] [CrossRef] [Green Version]
- Ural, S.; Demirkol, S. Evaluation of occupational safety and health in surface mines. Saf. Sci. 2008, 46, 1016–1024. [Google Scholar] [CrossRef]
- Zhang, M.; Kecojevic, V.; Komljenovic, D. Investigation of haul truck-related fatal accidents in surface mining using fault tree analysis. Saf. Sci. 2014, 65, 106–117. [Google Scholar] [CrossRef]
- Groves, W.; Kecojevic, V.; Komljenovic, D. Analysis of Fatalities and Injuries Involving Mining Equipment. J. Saf. Res. 2007, 38, 461–470. [Google Scholar] [CrossRef] [PubMed]
- Torres, N.; Dinis, C. Environmental, health and safety management systems for underground mining. In Proceedings of the 1st International Conference on Sustainable Development and Management of the Subsurface, Utrecht, The Netherlands, 5–7 November 2003. [Google Scholar]
- Zhong-Xue, L.; Jia-Jie, L.; Cui-Ping, L.; Shuang-Yue, L. Overview of the South African mine health and safety standardization and regulation systems. J. Coal Sci. Eng. 2008, 14, 329–333. [Google Scholar]
- Bottani, E.; Monica, L.; Vignali, G. Safety management systems: Performance differences between adopters and non-adopters. Saf. Sci. 2009, 47, 155–162. [Google Scholar] [CrossRef]
- Sanmiquel, L.; Rossell, J.M.; Vintró, C.; Freijo, M. Influence of occupational safety management on the incidence rate of occupational accidents in the Spanish industrial and ornamental stone mining. Work 2014, 49, 307–314. [Google Scholar] [CrossRef]
- Ivaz, J.; Stojadinovic, S.; Petrovic, D.; Stojkovic, P. Analysis of fatal injuries in Serbian underground coal mines—50 years review. Int. J. Fatal. Inj. Control Saf. Promot. 2020, 27, 362–377. [Google Scholar] [CrossRef]
- Düzgün, H.S.; Leveson, N. Analysis of soma mine disaster using causal analysis based on systems theory (CAST). Saf. Sci. 2018, 110, 37–57. [Google Scholar] [CrossRef]
- Wang, X.; Meng, F. Statistical analysis of large accidents in China’s coal mines in 2016. Nat. Hazards 2018, 92, 311–325. [Google Scholar] [CrossRef]
- Grayson, R.L.; Layne, L.A.; Althouse, R.C.; Klishis, M.J. Risk indices for roof bolter injuries using microanalysis. Min. Eng. 1992, 2, 164–166. [Google Scholar]
- Ames, R.G.; Trent, R.B. Respiratory predictors of disability days: A five year prospective study of U.S. coal miners. Am. J. Ind. Med. 1985, 7, 337–342. [Google Scholar] [CrossRef] [PubMed]
- Hunting, K.L.; Weeks, J.L. Transport injuries in small coal mines: An exploratory analysis. Am. J. Ind. Med. 1993, 23, 391–406. [Google Scholar] [CrossRef]
- Sanmiquel, L.; Vintró, C.; Freijo, M. Characteristics of the 3 most common types of occupational accident in Spanish sub-surface and surface mining, from 2003–2008. Dyna 2012, 79, 118–125. [Google Scholar]
- Coleman, P.J.; Kerkering, J.C. Measuring mining safety with injury statistics: Lost workdays as indicators of risk. J. Saf. Res. 2007, 38, 523–533. [Google Scholar] [CrossRef] [PubMed]
- Bates, D.M.; Watts, D.G. Nonlinear Regression Analysis and Its Applications. In Wiley Series in Probability and Statistics; John Wiley & Sons INC: Hoboken, NJ, USA, 2008. [Google Scholar]
- Butani, S.J. Relative risk analysis of injuries in coal mining by age and experience at present company. J. Occup. Accid. 1988, 10, 209–216. [Google Scholar] [CrossRef]
- Sanmiquel, L.; Bascompta, M.; Rossell, J.M.; Anticoi, H.F.; Guash, E. Analysis of Occupational Accidents in Underground and Surface Mining in Spain Using Data-mining techniques. Int. J. Environ. Res. Public Health 2018, 15, 462. [Google Scholar] [CrossRef] [PubMed] [Green Version]
- Williamson, A.; Feyer, A.M. The Causes of Electrical Fatalities at Work. J. Saf. Res. 1998, 29, 187–196. [Google Scholar] [CrossRef]
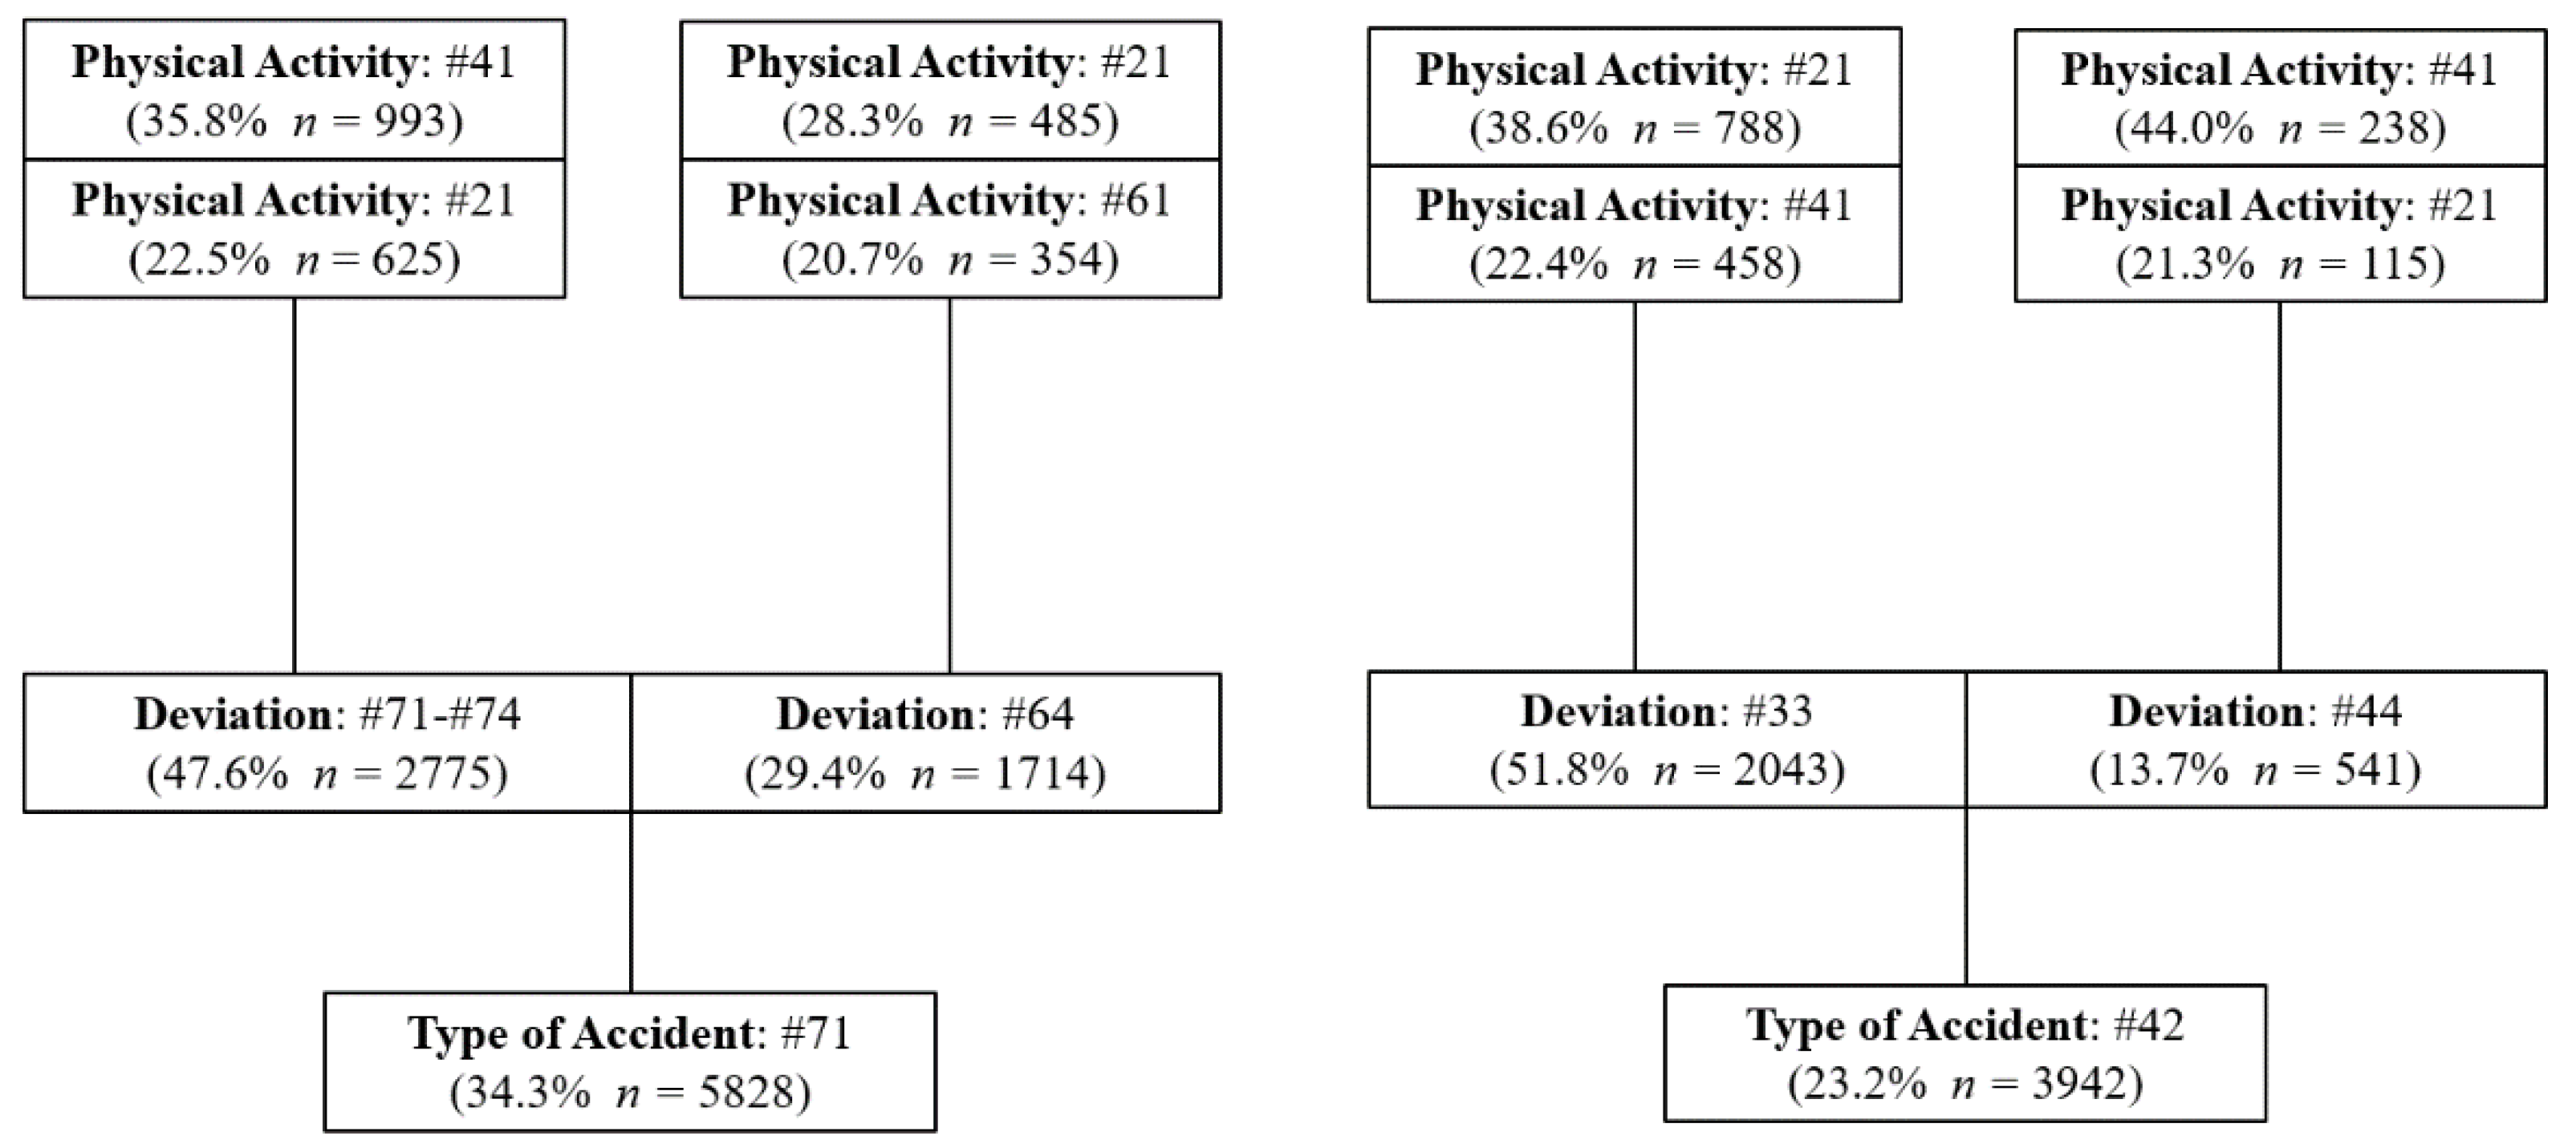
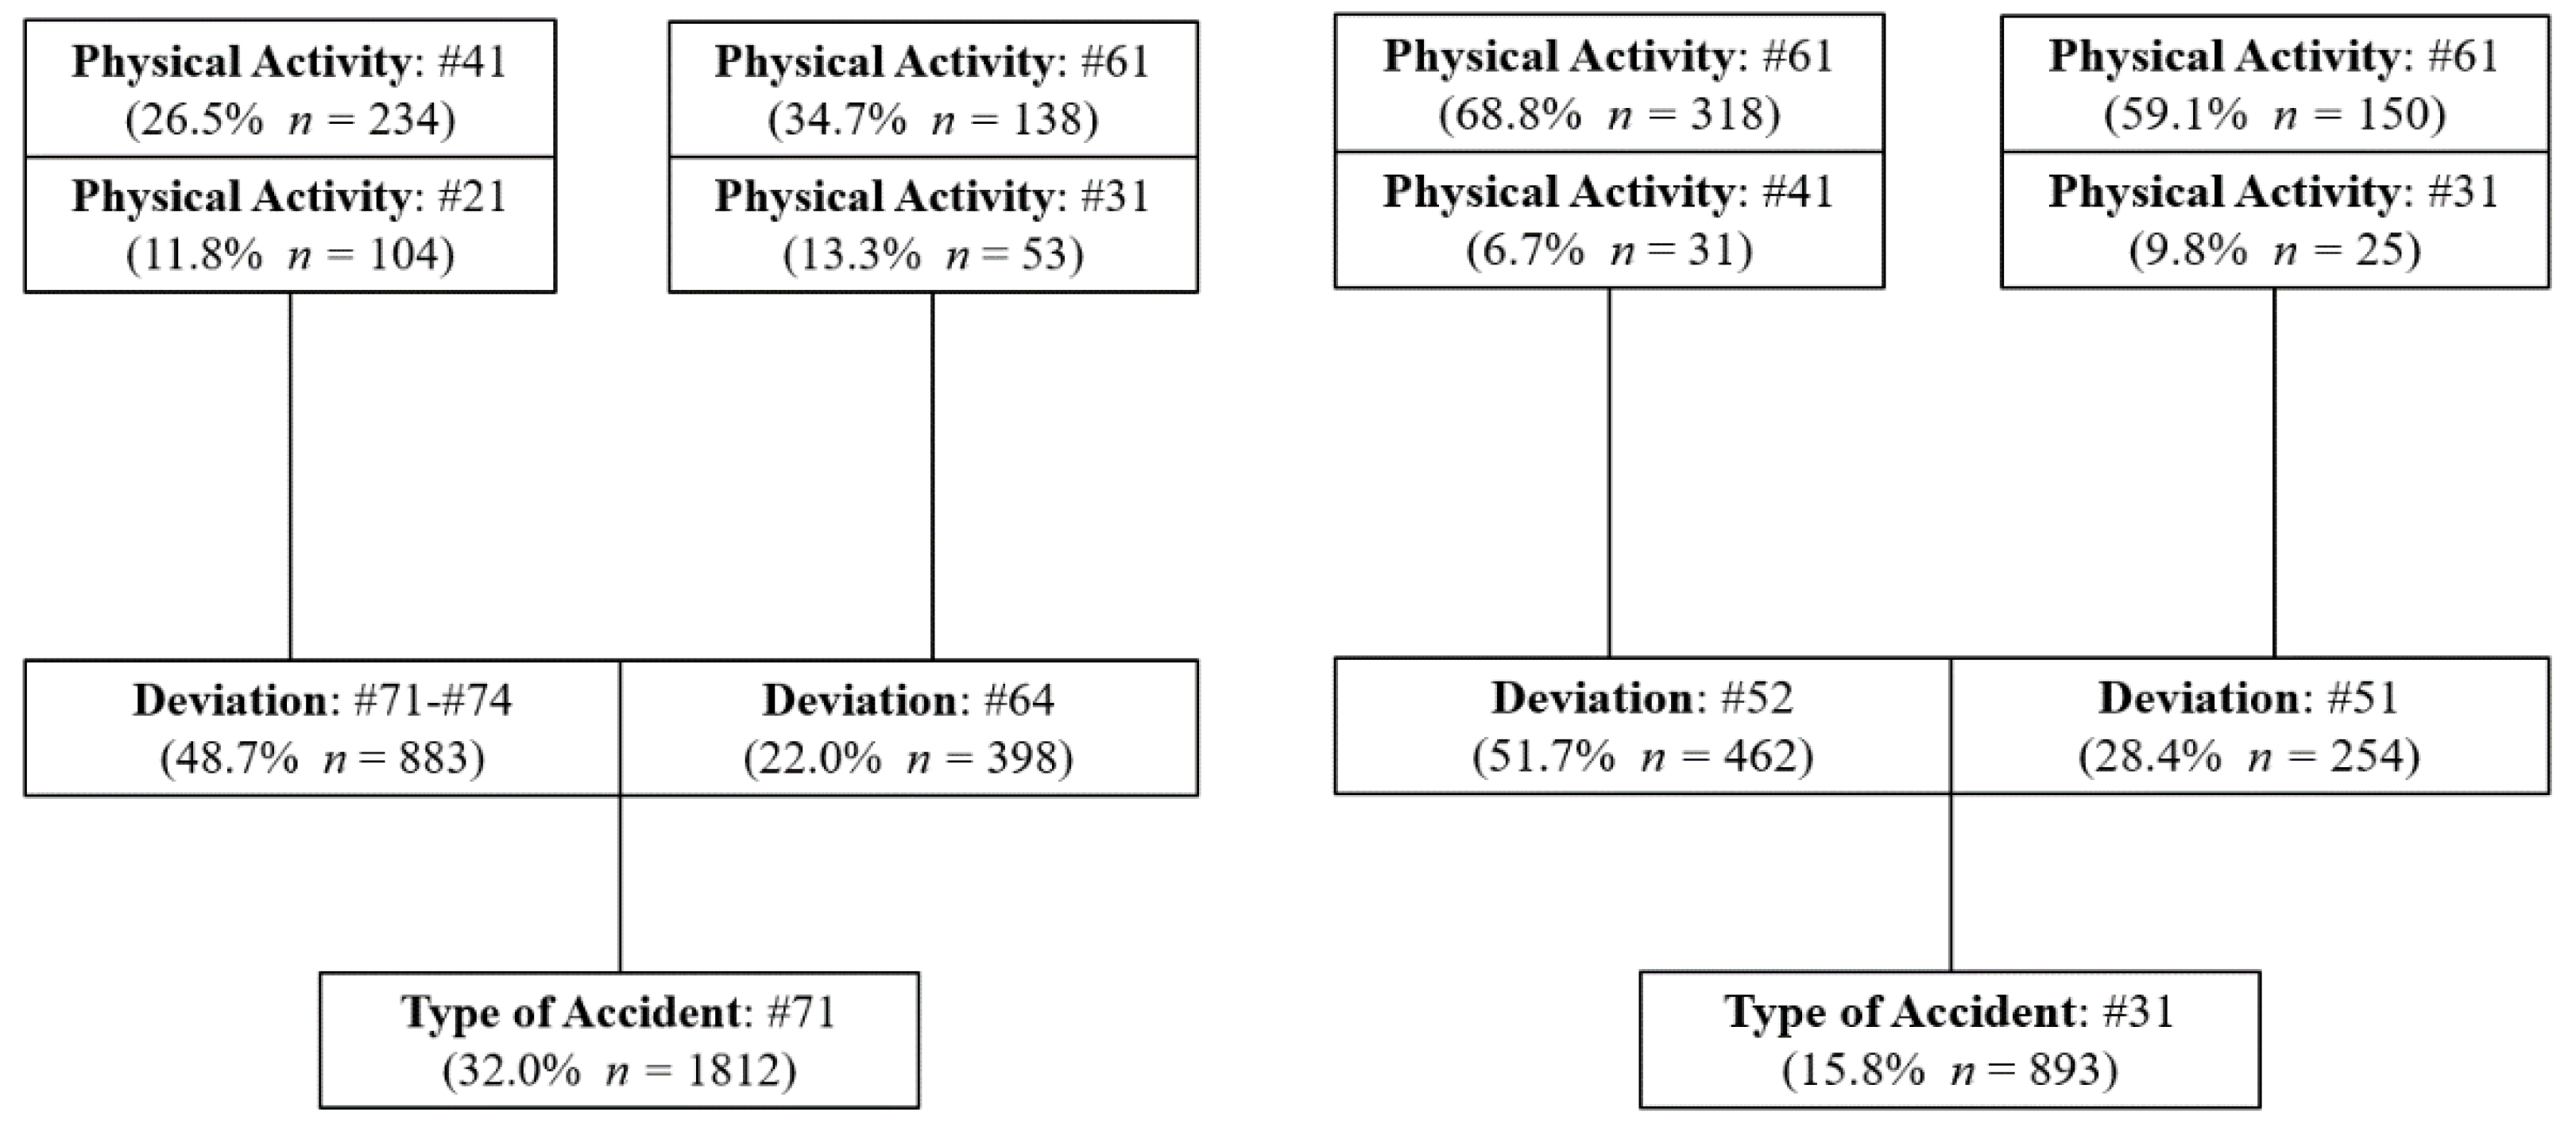
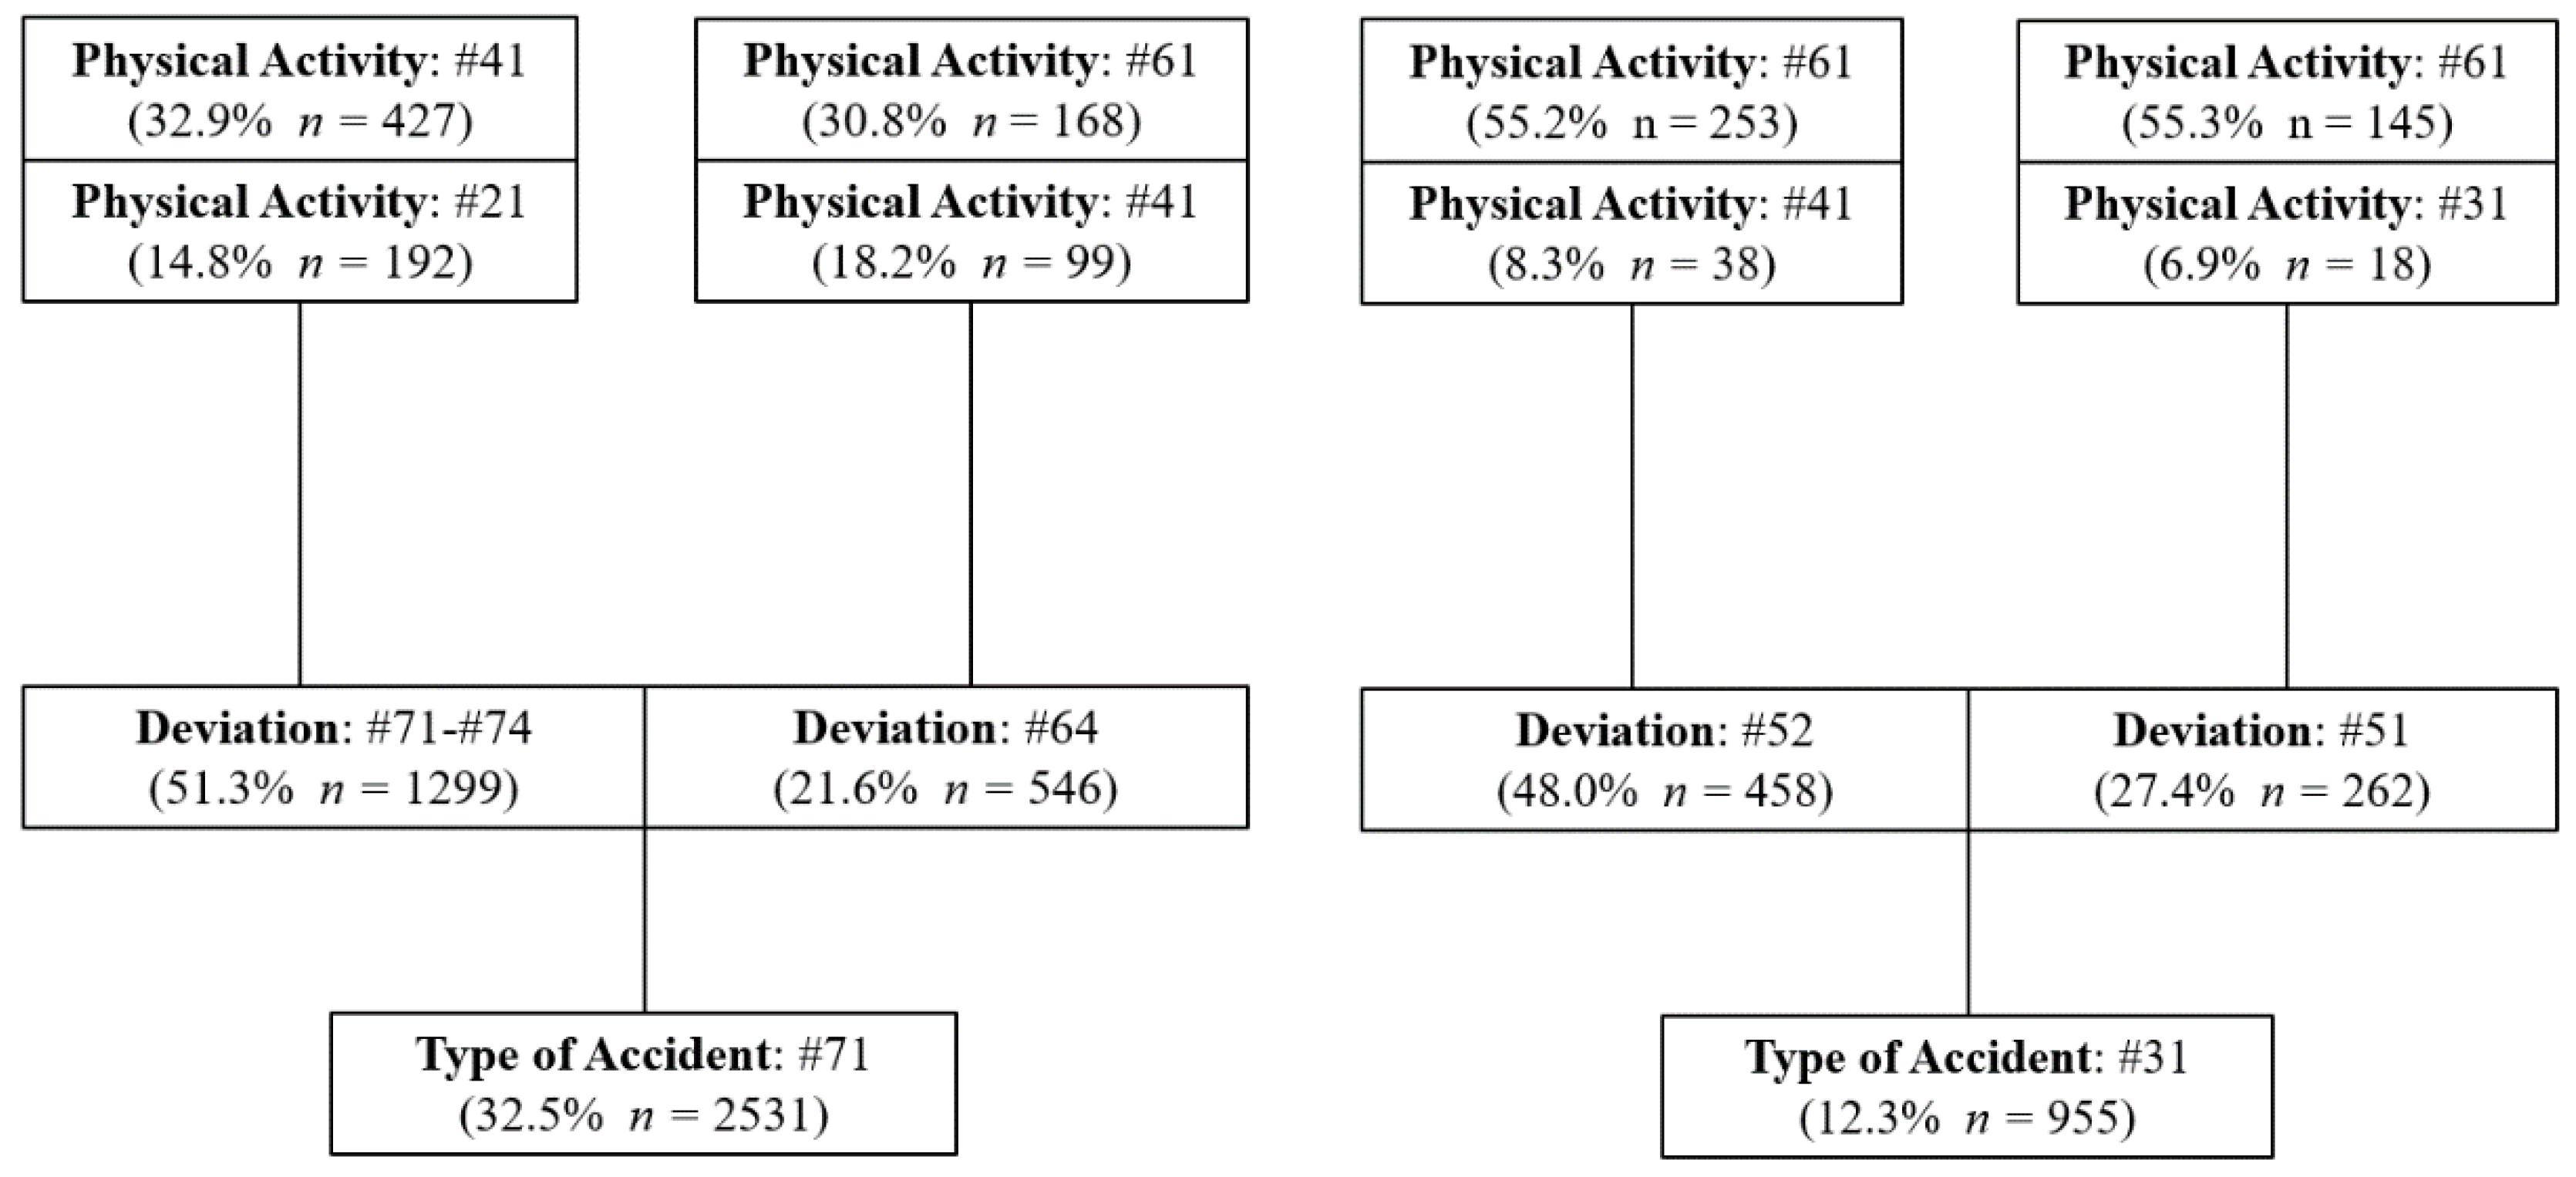

| Type of Accident Code |
|---|
| UG (16,985 accidents) |
| #71: Physical over-exertion on the muscular-skeletal system (34.3%) #42: To be hit by a falling object or one that is detached (23.2%) #31: Blows or hitting something as a result of a fall (8.1%) |
| OP (5659 accidents) |
| #71: Physical over-exertion on the muscular-skeletal system (32.0%) #31: Blows or hitting something as a result of a fall (15.8%) #32: Blows as the result of a fall, or crashing into an immovable object (9.6%) |
| PP (7784 accidents) |
| #71: Physical over-exertion on the muscular-skeletal system (32.5%) #31: Blows or hitting something as a result of a fall (12.3%) #32: Blows as the result of a fall, or crashing into an immovable object (9.2%) |
| Deviation Code |
| #71–74: Worker’s body movement as a result of physical exertion due to handling a load or object |
| #64: Worker’s body movement without added physical effort. Uncoordinated movements, untimely or inopportune gestures #33: Slip, fall or collapse of an upper material agent (that falls on the injured worker) #44: Loss (total or partial) of control of the object or material (transported, moved, handled, etc.) #52: Fall of a person-to the same level #51: Fall of a person-from a height |
| Physical Activity Code |
| #61: Worker movements: walk, run, jump, stand up, sit down, etc. #41: Manipulation of objects: to take by hand, grasp, hold, etc. -in a horizontal plane #31: Driving a vehicle or loading equipment -mobile and motorized #21: Working with non-powered hand tools |
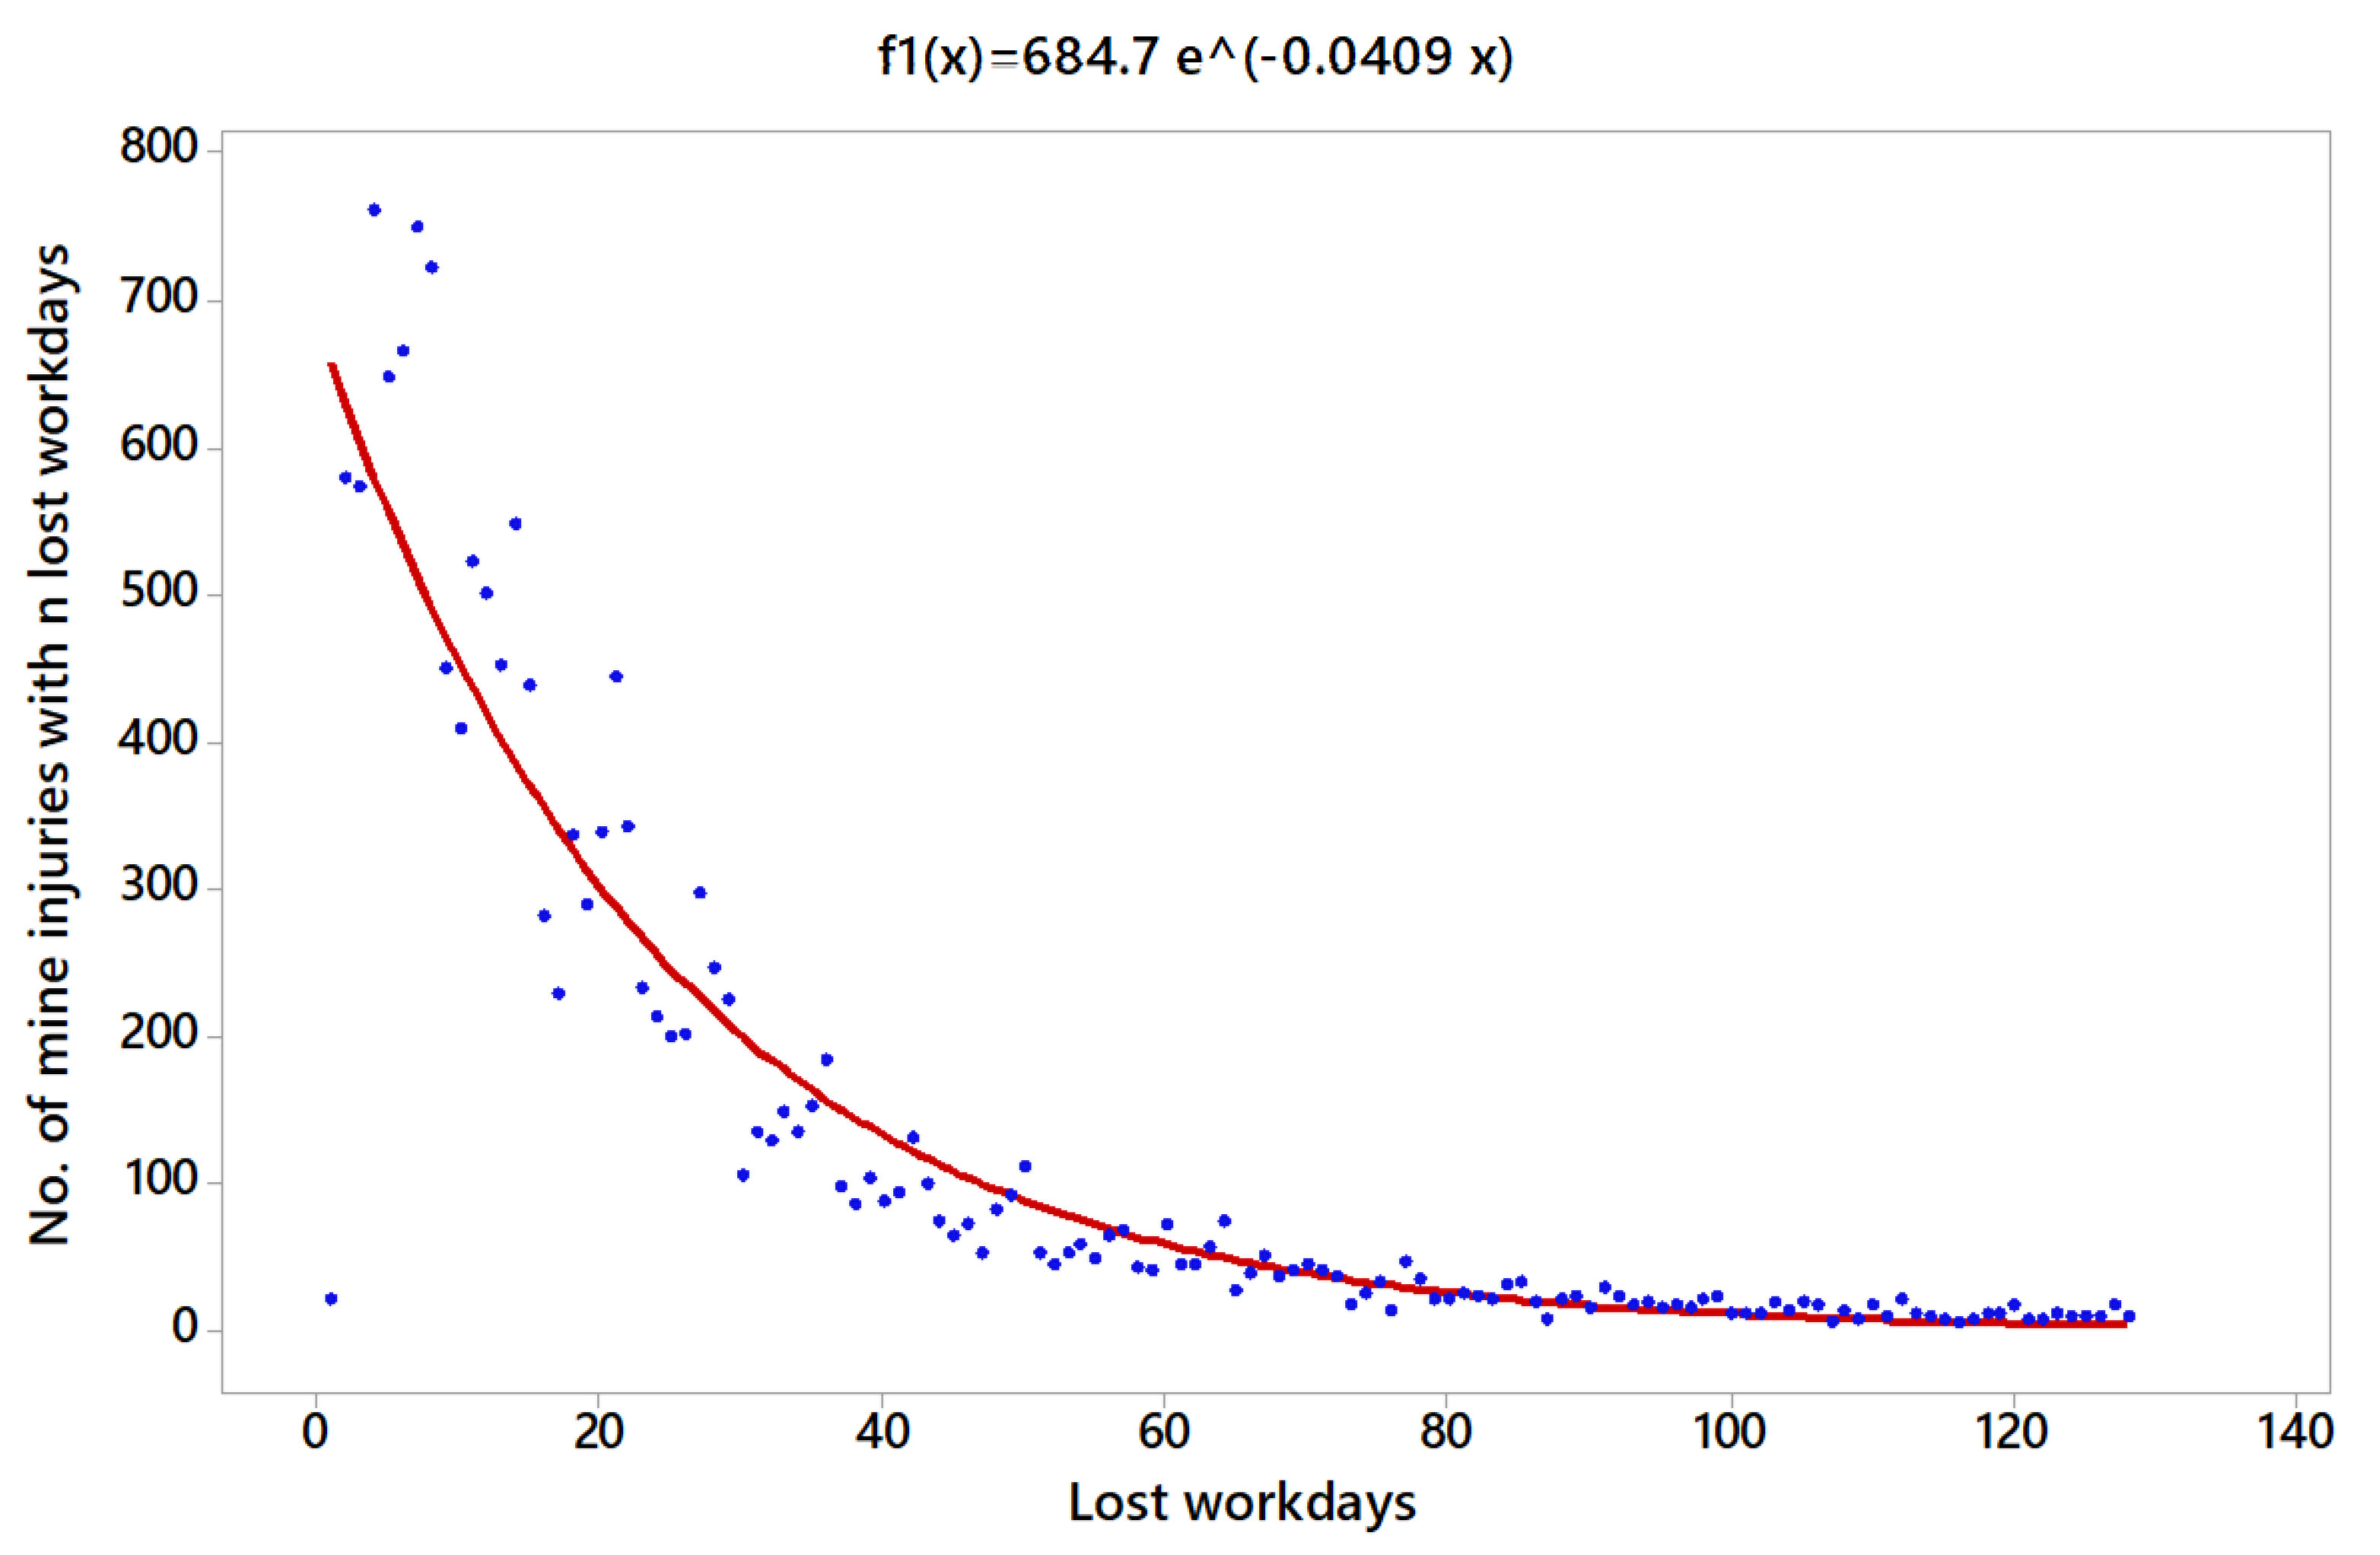
| UG | OP | PP | |
|---|---|---|---|
| ≥10 lost workdays | 69.0% | 69.8% | 67.5% |
| ≥20 lost workdays | 45.7% | 46.9% | 43.6% |
| ≥30 lost workdays | 30.1% | 31.4% | 28.1% |
| ≥60 lost workdays | 8.4% | 9.4% | 7.4% |
| Center Size | ||||||
| Year | 1–9 | 10–19 | 20–49 | 50–99 | 100–499 | ≥500 |
| 2009 | 0.23 | 0.24 | 2.58 | 4.18 | 41.12 | 51.65 |
| 2010 | 0.74 | 0.88 | 2.71 | 5.98 | 36.55 | 53.13 |
| 2011 | 0.34 | 1.00 | 3.46 | 8.30 | 42.14 | 44.75 |
| 2012 | 0.41 | 1.44 | 4.90 | 4.19 | 38.93 | 50.14 |
| 2013 | 0.55 | 1.13 | 1.37 | 6.28 | 39.63 | 51.04 |
| 2014 | 0.65 | 1.04 | 4.98 | 2.91 | 52.21 | 38.22 |
| 2015 | 0.36 | 1.20 | 3.06 | 3.44 | 41.83 | 50.10 |
| 2016 | 0.11 | 1.60 | 2.57 | 3.06 | 26.83 | 65.83 |
| 2017 | 0.08 | 1.92 | 3.30 | 3.22 | 28.72 | 62.76 |
| 2018 | 0.36 | 1.58 | 2.54 | 1.45 | 24.85 | 69.23 |
| Average | 0.39 | 1.14 | 3.12 | 4.47 | 37.75 | 53.13 |
| Accidents | ||||||
| Year | 1–9 | 10–19 | 20–49 | 50–99 | 100–499 | ≥500 |
| 2009 | 0.82 | 1.40 | 11.68 | 12.37 | 59.60 | 14.13 |
| 2010 | 1.06 | 2.40 | 10.72 | 13.24 | 59.31 | 13.28 |
| 2011 | 0.59 | 0.98 | 11.81 | 6.10 | 67.35 | 13.18 |
| 2012 | 0.67 | 1.89 | 15.21 | 10.27 | 67.15 | 4.83 |
| 2013 | 1.00 | 2.46 | 10.15 | 10.22 | 71.07 | 5.11 |
| 2014 | 0.73 | 2.31 | 9.83 | 13.35 | 68.99 | 4.79 |
| 2015 | 1.59 | 1.53 | 13.26 | 13.79 | 65.12 | 4.71 |
| 2016 | 1.28 | 2.30 | 12.94 | 8.09 | 69.87 | 5.53 |
| 2017 | 0.87 | 1.25 | 12.72 | 7.23 | 70.57 | 7.36 |
| 2018 | 0.90 | 1.47 | 9.84 | 4.98 | 73.76 | 9.05 |
| Average | 0.92 | 1.80 | 11.79 | 10.63 | 65.68 | 9.18 |
| Center Size | ||||||
| Year | 1–9 | 10–19 | 20–49 | 50–99 | 100–499 | ≥500 |
| 2009 | 41.96 | 25.30 | 18.91 | 6.86 | 6.96 | |
| 2010 | 45.13 | 25.74 | 17.83 | 6.69 | 4.61 | |
| 2011 | 45.69 | 25.62 | 17.34 | 7.31 | 4.05 | |
| 2012 | 49.07 | 24.62 | 15.77 | 6.58 | 3.97 | |
| 2013 | 48.04 | 23.51 | 17.57 | 6.15 | 4.74 | |
| 2014 | 49.82 | 23.31 | 17.62 | 5.66 | 3.59 | |
| 2015 | 48.14 | 22.79 | 18.38 | 7.49 | 3.20 | |
| 2016 | 43.60 | 23.19 | 17.63 | 6.70 | 8.89 | |
| 2017 | 42.48 | 24.03 | 17.51 | 6.81 | 9.17 | |
| 2018 | 40.78 | 25.64 | 18.57 | 6.86 | 8.15 | |
| Average | 45.22 | 24.50 | 17.76 | 6.73 | 5.78 | |
| Accidents | ||||||
| Year | 1–9 | 10–19 | 20–49 | 50–99 | 100–499 | ≥500 |
| 2009 | 26.03 | 28.64 | 27.84 | 10.05 | 7.14 | |
| 2010 | 27.41 | 28.56 | 27.98 | 9.06 | 6.77 | |
| 2011 | 29.23 | 26.93 | 26.22 | 7.45 | 10.03 | |
| 2012 | 36.06 | 26.69 | 22.31 | 6.37 | 8.57 | |
| 2013 | 32.80 | 31.18 | 22.31 | 6.45 | 6.99 | |
| 2014 | 42.30 | 24.83 | 19.31 | 4.83 | 8.51 | |
| 2015 | 32.23 | 25.39 | 26.49 | 7.73 | 8.17 | |
| 2016 | 35.75 | 25.85 | 30.19 | 3.38 | 4.59 | |
| 2017 | 38.20 | 24.33 | 24.82 | 5.84 | 6.33 | |
| 2018 | 32.54 | 24.65 | 30.18 | 5.92 | 6.11 | |
| Average | 31.90 | 26.98 | 26.21 | 7.26 | 7.40 | |
| Center Size | ||||||
| Year | 1–9 | 10–19 | 20–49 | 50–99 | 100–499 | ≥500 |
| 2009 | 29.18 | 17.62 | 13.91 | 6.04 | 17.43 | 15.83 |
| 2010 | 31.94 | 18.36 | 13.34 | 6.48 | 12.78 | 17.11 |
| 2011 | 31.19 | 17.75 | 12.90 | 7.62 | 14.53 | 16.01 |
| 2012 | 33.06 | 16.99 | 12.19 | 5.79 | 13.50 | 18.46 |
| 2013 | 32.15 | 16.02 | 12.15 | 6.19 | 14.24 | 19.24 |
| 2014 | 33.83 | 15.99 | 13.23 | 4.48 | 14.33 | 18.14 |
| 2015 | 33.57 | 16.20 | 13.71 | 6.26 | 12.63 | 17.63 |
| 2016 | 32.16 | 17.57 | 13.77 | 5.86 | 8.56 | 22.08 |
| 2017 | 31.68 | 18.47 | 14.01 | 6.01 | 7.30 | 22.54 |
| 2018 | 31.57 | 20.20 | 15.00 | 5.67 | 7.10 | 20.46 |
| Average | 31.98 | 17.54 | 13.41 | 6.07 | 12.37 | 18.64 |
| Accidents | ||||||
| Year | 1–9 | 10–19 | 20–49 | 50–99 | 100–499 | ≥500 |
| 2009 | 15.36 | 17.85 | 22.56 | 17.93 | 22.85 | 3.45 |
| 2010 | 17.95 | 16.79 | 22.36 | 18.71 | 21.69 | 2.50 |
| 2011 | 18.37 | 17.50 | 20.43 | 20.54 | 19.46 | 3.70 |
| 2012 | 19.94 | 18.35 | 16.18 | 20.23 | 19.80 | 5.49 |
| 2013 | 20.70 | 18.36 | 21.37 | 20.20 | 14.69 | 4.67 |
| 2014 | 21.34 | 18.49 | 18.32 | 19.33 | 17.98 | 4.54 |
| 2015 | 22.79 | 16.79 | 15.59 | 15.59 | 22.94 | 6.30 |
| 2016 | 21.07 | 16.35 | 23.43 | 16.04 | 16.67 | 6.45 |
| 2017 | 21.81 | 16.70 | 25.38 | 13.97 | 13.97 | 8.18 |
| 2018 | 18.10 | 16.79 | 25.84 | 14.89 | 15.62 | 8.76 |
| Average | 21.07 | 16.35 | 23.43 | 16.04 | 16.67 | 6.45 |
| UG | ||||||
| Year | 1–9 | 10–19 | 20–49 | 50–99 | 100–499 | ≥500 |
| 2009 | 3.56 | 5.82 | 4.53 | 2.96 | 1.45 | 0.27 |
| 2010 | 1.43 | 2.71 | 3.95 | 2.21 | 1.62 | 0.25 |
| 2011 | 1.70 | 0.97 | 3.41 | 0.74 | 1.60 | 0.29 |
| 2012 | 1.62 | 1.31 | 3.10 | 2.45 | 1.73 | 0.10 |
| 2013 | 1.82 | 2.17 | 7.42 | 1.63 | 1.79 | 0.10 |
| 2014 | 1.12 | 2.22 | 1.97 | 4.59 | 1.32 | 0.13 |
| 2015 | 4.40 | 1.27 | 4.33 | 4.01 | 1.56 | 0.09 |
| 2016 | 11.20 | 1.44 | 5.04 | 2.64 | 2.60 | 0.08 |
| 2017 | 11.04 | 0.65 | 3.85 | 2.24 | 2.46 | 0.12 |
| 2018 | 2.54 | 0.93 | 3.88 | 3.44 | 2.97 | 0.13 |
| Average | 2.37 | 1.57 | 3.78 | 2.38 | 1.74 | 0.17 |
| OP | ||||||
| Year | 1–9 | 10–19 | 20–49 | 50–99 | 100–499 | ≥500 |
| 2009 | 0.62 | 1.13 | 1.47 | 1.47 | 1.02 | |
| 2010 | 0.61 | 1.11 | 1.57 | 1.35 | 1.47 | |
| 2011 | 0.64 | 1.05 | 1.51 | 1.02 | 2.47 | |
| 2012 | 0.73 | 1.08 | 1.41 | 0.97 | 2.16 | |
| 2013 | 0.68 | 1.33 | 1.27 | 1.05 | 1.48 | |
| 2014 | 0.85 | 1.07 | 1.10 | 0.85 | 2.37 | |
| 2015 | 0.67 | 1.11 | 1.44 | 1.03 | 2.55 | |
| 2016 | 0.82 | 1.11 | 1.71 | 0.51 | 0.52 | |
| 2017 | 0.90 | 1.01 | 1.42 | 0.86 | 0.69 | |
| 2018 | 0.80 | 0.96 | 1.63 | 0.86 | 0.75 | |
| Average | 0.71 | 1.10 | 1.48 | 1.08 | 1.28 | |
| PP | ||||||
| Year | 1–9 | 10–19 | 20–49 | 50–99 | 100–499 | ≥500 |
| 2009 | 0.53 | 1.01 | 1.62 | 2.97 | 1.31 | 0.22 |
| 2010 | 0.56 | 0.91 | 1.68 | 2.89 | 1.70 | 0.15 |
| 2011 | 0.59 | 0.99 | 1.58 | 2.70 | 1.34 | 0.23 |
| 2012 | 0.60 | 1.08 | 1.33 | 3.49 | 1.47 | 0.30 |
| 2013 | 0.64 | 1.15 | 1.76 | 3.26 | 1.03 | 0.24 |
| 2014 | 0.63 | 1.16 | 1.38 | 4.31 | 1.26 | 0.25 |
| 2015 | 0.68 | 1.04 | 1.14 | 2.49 | 1.82 | 0.36 |
| 2016 | 0.66 | 0.93 | 1.70 | 2.74 | 1.95 | 0.29 |
| 2017 | 0.69 | 0.90 | 1.81 | 2.32 | 1.91 | 0.36 |
| 2018 | 0.57 | 0.83 | 1.72 | 2.62 | 2.20 | 0.43 |
| Average | 0.66 | 0.93 | 1.75 | 2.64 | 1.35 | 0.35 |
| Worked Hours | ||||||
| Year | 1–9 | 10–19 | 20–49 | 50–99 | 100–499 | ≥500 |
| 2009 | 0.25 | 0.36 | 3.16 | 5.12 | 46.17 | 44.94 |
| 2010 | 0.61 | 0.96 | 2.76 | 5.32 | 32.34 | 58.01 |
| 2011 | 0.29 | 1.04 | 3.02 | 5.91 | 35.19 | 54.55 |
| 2012 | 0.27 | 1.30 | 4.47 | 3.73 | 33.99 | 56.23 |
| 2013 | 0.43 | 0.87 | 1.32 | 3.48 | 32.09 | 61.81 |
| 2014 | 0.48 | 1.14 | 6.63 | 2.63 | 58.84 | 30.28 |
| 2015 | 0.32 | 0.96 | 3.04 | 2.96 | 33.29 | 59.43 |
| 2016 | 0.15 | 1.51 | 2.61 | 2.42 | 19.24 | 74.06 |
| 2017 | 0.07 | 1.38 | 2.65 | 1.22 | 18.43 | 76.25 |
| 2018 | 0.29 | 1.42 | 2.94 | 1.42 | 17.30 | 76.62 |
| Average | 0.32 | 1.07 | 3.24 | 3.53 | 33.15 | 58.69 |
| Workdays Lost | ||||||
| Year | 1–9 | 10–19 | 20–49 | 50–99 | 100–499 | ≥500 |
| 2009 | 2.63 | 1.58 | 13.50 | 12.51 | 54.13 | 15.65 |
| 2010 | 1.58 | 3.35 | 14.95 | 15.65 | 51.34 | 13.13 |
| 2011 | 0.19 | 1.32 | 10.42 | 5.74 | 71.45 | 10.89 |
| 2012 | 0.58 | 2.37 | 14.32 | 9.02 | 69.81 | 3.89 |
| 2013 | 0.61 | 2.23 | 7.70 | 9.39 | 76.68 | 3.40 |
| 2014 | 0.49 | 1.30 | 8.99 | 11.79 | 74.25 | 3.17 |
| 2015 | 1.30 | 0.98 | 10.86 | 14.07 | 69.35 | 3.43 |
| 2016 | 0.49 | 1.59 | 11.98 | 6.64 | 76.63 | 2.66 |
| 2017 | 0.56 | 2.09 | 9.94 | 5.35 | 77.17 | 4.88 |
| 2018 | 1.17 | 1.85 | 8.87 | 5.80 | 74.98 | 7.33 |
| Average | 0.99 | 1.86 | 11.31 | 10.02 | 68.79 | 7.02 |
| Worked Hours | ||||||
| Year | 1–9 | 10–19 | 20–49 | 50–99 | 100–499 | ≥500 |
| 2009 | 22.54 | 28.88 | 26.09 | 13.13 | 9.35 | |
| 2010 | 28.00 | 26.86 | 22.36 | 13.09 | 9.69 | |
| 2011 | 27.83 | 25.65 | 22.34 | 13.56 | 10.62 | |
| 2012 | 29.31 | 24.79 | 22.46 | 12.20 | 11.24 | |
| 2013 | 30.58 | 23.96 | 24.08 | 8.31 | 13.07 | |
| 2014 | 29.82 | 23.20 | 24.81 | 11.36 | 10.81 | |
| 2015 | 29.05 | 23.45 | 24.00 | 14.15 | 9.36 | |
| 2016 | 27.65 | 23.48 | 24.77 | 12.97 | 11.13 | |
| 2017 | 26.63 | 24.01 | 23.51 | 14.38 | 11.47 | |
| 2018 | 25.58 | 25.31 | 21.96 | 14.18 | 12.97 | |
| Average | 27.39 | 25.33 | 23.69 | 12.79 | 10.79 | |
| Workdays Lost | ||||||
| Year | 1–9 | 10–19 | 20–49 | 50–99 | 100–499 | ≥500 |
| 2009 | 29.40 | 25.54 | 29.19 | 9.03 | 6.73 | |
| 2010 | 23.87 | 29.25 | 31.18 | 7.66 | 7.86 | |
| 2011 | 29.97 | 24.93 | 25.17 | 8.70 | 11.16 | |
| 2012 | 34.72 | 27.63 | 22.15 | 6.65 | 8.85 | |
| 2013 | 37.48 | 28.78 | 20.48 | 7.45 | 5.77 | |
| 2014 | 41.77 | 20.22 | 23.26 | 4.58 | 10.05 | |
| 2015 | 29.23 | 22.30 | 24.30 | 12.31 | 11.87 | |
| 2016 | 35.72 | 24.77 | 29.78 | 5.87 | 3.70 | |
| 2017 | 38.39 | 28.74 | 21.13 | 4.86 | 6.66 | |
| 2018 | 38.76 | 25.96 | 23.16 | 4.96 | 6.36 | |
| Average | 33.04 | 25.88 | 25.54 | 7.42 | 7.95 | |
| Worked Hours | ||||||
| Year | 1–9 | 10–19 | 20–49 | 50–99 | 100–499 | ≥500 |
| 2009 | 23.57 | 14.75 | 14.18 | 7.97 | 15.72 | 23.80 |
| 2010 | 18.60 | 17.98 | 15.64 | 10.42 | 14.32 | 23.04 |
| 2011 | 17.96 | 16.82 | 15.42 | 10.81 | 14.56 | 24.42 |
| 2012 | 17.68 | 15.38 | 15.24 | 8.82 | 14.61 | 28.27 |
| 2013 | 17.40 | 13.83 | 14.07 | 12.12 | 13.27 | 29.32 |
| 2014 | 17.18 | 13.43 | 14.86 | 6.77 | 4.91 | 42.86 |
| 2015 | 18.20 | 14.95 | 16.08 | 9.92 | 11.14 | 29.71 |
| 2016 | 16.35 | 14.45 | 15.67 | 8.64 | 6.85 | 38.05 |
| 2017 | 15.70 | 14.68 | 14.91 | 8.96 | 2.09 | 43.66 |
| 2018 | 15.72 | 16.00 | 14.54 | 9.20 | 7.64 | 36.90 |
| Average | 17.94 | 15.30 | 15.06 | 9.38 | 10.76 | 31.56 |
| Workdays Lost | ||||||
| Year | 1–9 | 10–19 | 20–49 | 50–99 | 100–499 | ≥500 |
| 2009 | 18.41 | 15.97 | 24.10 | 21.28 | 15.42 | 4.81 |
| 2010 | 20.62 | 18.65 | 24.92 | 15.76 | 16.86 | 3.19 |
| 2011 | 21.54 | 16.81 | 23.27 | 17.96 | 16.34 | 4.07 |
| 2012 | 20.65 | 18.43 | 16.43 | 19.12 | 20.80 | 4.56 |
| 2013 | 19.35 | 16.47 | 24.76 | 18.96 | 17.92 | 2.55 |
| 2014 | 21.26 | 15.99 | 17.45 | 16.94 | 23.12 | 5.25 |
| 2015 | 28.54 | 14.99 | 12.24 | 11.60 | 25.08 | 7.55 |
| 2016 | 21.95 | 15.50 | 27.10 | 12.61 | 16.63 | 6.21 |
| 2017 | 26.08 | 11.55 | 26.67 | 12.12 | 15.17 | 8.40 |
| 2018 | 23.06 | 18.51 | 22.31 | 11.83 | 14.89 | 9.40 |
| Average | 21.96 | 16.40 | 22.18 | 16.02 | 17.92 | 5.51 |
| UG | ||||||
| Year | 1–9 | 10–19 | 20–49 | 50–99 | 100–499 | ≥500 |
| 2009 | 10.53 | 4.38 | 4.27 | 2.44 | 1.17 | 0.35 |
| 2010 | 2.58 | 3.48 | 5.42 | 2.94 | 1.59 | 0.23 |
| 2011 | 0.65 | 1.28 | 3.45 | 0.97 | 2.03 | 0.20 |
| 2012 | 2.12 | 1.83 | 3.20 | 2.42 | 2.05 | 0.07 |
| 2013 | 1.40 | 2.57 | 5.81 | 2.70 | 2.39 | 0.06 |
| 2014 | 1.02 | 1.14 | 1.36 | 4.48 | 1.26 | 0.10 |
| 2015 | 4.09 | 1.02 | 3.57 | 4.75 | 2.08 | 0.06 |
| 2016 | 3.33 | 1.05 | 4.58 | 2.74 | 3.98 | 0.04 |
| 2017 | 7.74 | 1.52 | 3.75 | 4.37 | 4.19 | 0.06 |
| 2018 | 4.01 | 1.31 | 3.01 | 4.07 | 4.33 | 0.10 |
| Average | 3.13 | 1.75 | 3.49 | 2.84 | 2.08 | 0.12 |
| OP | ||||||
| Year | 1–9 | 10–19 | 20–49 | 50–99 | 100–499 | ≥500 |
| 2009 | 1.30 | 0.88 | 1.12 | 0.69 | 0.72 | |
| 2010 | 0.85 | 1.09 | 1.39 | 0.59 | 0.81 | |
| 2011 | 1.08 | 0.97 | 1.13 | 0.64 | 1.05 | |
| 2012 | 1.18 | 1.11 | 0.99 | 0.55 | 0.79 | |
| 2013 | 1.23 | 1.20 | 0.85 | 0.90 | 0.44 | |
| 2014 | 1.40 | 0.87 | 0.94 | 0.40 | 0.93 | |
| 2015 | 1.01 | 0.95 | 1.01 | 0.87 | 1.27 | |
| 2016 | 1.29 | 1.06 | 1.20 | 0.45 | 0.33 | |
| 2017 | 1.44 | 1.20 | 0.90 | 0.34 | 0.58 | |
| 2018 | 1.51 | 1.03 | 1.05 | 0.35 | 0.49 | |
| Average | 1.21 | 1.02 | 1.08 | 0.58 | 0.74 | |
| PP | ||||||
| Year | 1–9 | 10–19 | 20–49 | 50–99 | 100–499 | ≥500 |
| 2009 | 0.78 | 1.08 | 1.70 | 2.67 | 0.98 | 0.20 |
| 2010 | 1.11 | 1.04 | 1.59 | 1.51 | 1.18 | 0.14 |
| 2011 | 1.20 | 1.00 | 1.51 | 1.66 | 1.12 | 0.17 |
| 2012 | 1.17 | 1.20 | 1.08 | 2.17 | 1.42 | 0.16 |
| 2013 | 1.11 | 1.19 | 1.76 | 1.56 | 1.35 | 0.09 |
| 2014 | 1.24 | 1.19 | 1.17 | 2.50 | 4.71 | 0.12 |
| 2015 | 1.57 | 1.00 | 0.76 | 1.17 | 2.25 | 0.25 |
| 2016 | 1.34 | 1.07 | 1.73 | 1.46 | 2.43 | 0.16 |
| 2017 | 1.66 | 0.79 | 1.79 | 1.35 | 7.24 | 0.19 |
| 2018 | 1.47 | 1.16 | 1.53 | 1.29 | 1.95 | 0.25 |
| Average | 1.22 | 1.07 | 1.47 | 1.71 | 1.67 | 0.17 |
Publisher’s Note: MDPI stays neutral with regard to jurisdictional claims in published maps and institutional affiliations. |
© 2021 by the authors. Licensee MDPI, Basel, Switzerland. This article is an open access article distributed under the terms and conditions of the Creative Commons Attribution (CC BY) license (https://creativecommons.org/licenses/by/4.0/).
Share and Cite
Sanmiquel, L.; Bascompta, M.; Rossell, J.M.; Anticoi, H. Analysis of Occupational Accidents in the Spanish Mining Sector in the Period 2009–2018. Int. J. Environ. Res. Public Health 2021, 18, 13122. https://doi.org/10.3390/ijerph182413122
Sanmiquel L, Bascompta M, Rossell JM, Anticoi H. Analysis of Occupational Accidents in the Spanish Mining Sector in the Period 2009–2018. International Journal of Environmental Research and Public Health. 2021; 18(24):13122. https://doi.org/10.3390/ijerph182413122
Chicago/Turabian StyleSanmiquel, Lluís, Marc Bascompta, Josep M. Rossell, and Hernan Anticoi. 2021. "Analysis of Occupational Accidents in the Spanish Mining Sector in the Period 2009–2018" International Journal of Environmental Research and Public Health 18, no. 24: 13122. https://doi.org/10.3390/ijerph182413122
APA StyleSanmiquel, L., Bascompta, M., Rossell, J. M., & Anticoi, H. (2021). Analysis of Occupational Accidents in the Spanish Mining Sector in the Period 2009–2018. International Journal of Environmental Research and Public Health, 18(24), 13122. https://doi.org/10.3390/ijerph182413122


