Article

Alcohol and Cigarette Use among Adolescents and Young Adults in Austria from 2004–2020: Patterns of Change and Associations with Socioeconomic Variables

1
Gesundheit Österreich GmbH (Austrian Public Health Institute), 1010 Vienna, Austria
2
Faculty of Psychotherapy Science, Sigmund Freud University Vienna, 1020 Vienna, Austria
3
Swiss Research Institute of Public Health and Addiction (ISGF), University of Zürich, 8006 Zurich, Switzerland
4
Institute for Addiction Prevention, Office of Addiction and Drug Policy of Vienna, 1030 Vienna, Austria
*
Authors to whom correspondence should be addressed.
Int. J. Environ. Res. Public Health 2021, 18(24), 13080; https://doi.org/10.3390/ijerph182413080
Submission received: 21 October 2021 / Revised: 6 December 2021 / Accepted: 7 December 2021 / Published: 11 December 2021

Abstract

:
Background: Adolescents and young adults are a crucial target group for preventing harm related to substance use. Recently, declining alcohol and tobacco consumption in young people has been observed in many countries. Based on survey data from 2004 to 2020, we describe time trends for several subgroups of adolescents and young adults (based on consumption levels and socioeconomic variables) and analyze associations between the level of alcohol per capita consumption or daily smoking and socioeconomic variables. Methods: Time trends for males and females are analyzed by a two-way ANOVA and predictors of use by using multivariate regression and logistic regression. Results: Alcohol per capita consumption decreased significantly for both sexes in the 16-year period, with male and female consumption levels converging. Daily smoking was equally prevalent for young males and females and decreased to a similar degree for both sexes. Being male and living in rural areas are associated with a higher level of alcohol consumption. Daily smoking is associated with a low level of education and is more prevalent among young adults who have already started to work. Conclusions: The decline in alcohol use and daily smoking among adolescents and young adults is taking place simultaneously. However, higher levels of alcohol consumption and daily smoking occur in different groups of adolescents and young adults, which should be considered in prevention strategies.

1. Introduction

Alcohol use has been found to be causally linked to many diseases and injury categories [1]. For those aged from 25–49 years, alcohol use is the leading risk factor for disability-adjusted life years (DALY), representing years lost due to disability, illness, and early death. Tobacco use is the second highest risk factor on a global level and was the leading cause of death in many high-income countries in 2019 [2]. Alcohol and tobacco consumption, therefore, ranks high among public health priorities for young adolescents in affluent countries. At the same time, efforts are being made to improve skills and coping strategies in the general population regarding legal and illegal substances and/or addictive behaviors. Universal prevention is complemented by selective prevention for risk groups and by indicated prevention for those who already show symptoms of addiction (e.g., to prevent relapse) [3]. In Austria, regional addiction prevention institutes organize and offer preventive measures such as life-skill and risk-skill programs (e.g., Gemeinsam stark werden (Growing stronger together), plus, ready4life) for various target groups. The national association “ARGE Suchtvorbeugung” [4] develops guidelines for anyone who is interested in offering preventive measures in the field of addictive behaviors.
With regard to alcohol consumption, the European School Survey Project on Alcohol and other Drugs (ESPAD) revealed a constant downward trend between 1995 and 2015 for the majority of participating countries. In the latest survey from 2019, this decline leveled off in some countries but continued in others, including Austria [5]. Data from the Health Behaviour in School-Aged Children study (HBSC) also indicate that there has been a clear decline, especially in countries with previously high levels of alcohol consumption by adolescents [6,7].
The available evidence is not robust enough to permit firm conclusions as to the reasons for that decline [8,9]. There is evidence that it is affecting all strata of society, while concerns have also been raised that some disadvantaged subgroups are not following this trend. The decline in alcohol consumption seems to be limited to adolescents (aged 18 and under), whereas young adults and adults in many regions did not reduce their consumption [10]. This is exactly what can be observed in Austria, where student data indicate a sharp decline since 2003 [11], although data from the alcohol industry only suggest a minor change in overall per capita consumption over the last two decades [12]. In line with this decline in alcohol consumption in the youngest age groups, some authors argue that it is due to a prolongation of childhood or to a delay in adolescence, which does not only affect substance use but also affects other behaviors related to late adolescence, like having a first job [13]. In most countries, the decline in alcohol consumption is particularly strong among young males. As a consequence, some authors suggest that alcohol has lost its role in youth culture as a rite of passage ritual or as an identity-forming element of (predominantly) male adolescence [14,15]. In this interpretation, the sober life style among young people seems to reflect a common understanding of legitimate behavior: being moderate, nuanced, and in control [16]. For this reason, for a project to be successful, it has proven essential for the peers of the target group concerned to be involved in the development of preventive measures.
Alcohol consumption is not distributed equally among young people. There is some evidence that young people in rural areas drink more than those in urban areas [17,18] and report binge drinking more frequently [19]. Increased rates for alcohol use are thought to be more common in rural areas due to more permissive attitudes toward legal substances [20] or a lack of leisure time activities not related to substance use [21]. In contrast, the prevalence rates for using illicit substances are thought to be higher in urban areas [22] due to easier access to illicit substances in urban areas. However, differences between rural and urban areas in terms of illicit drug use seem to be narrowing or even vanishing entirely [19].
Changes in drinking behavior at the population level can occur collectively (i.e., they apply to all levels of consumers in a similar manner as postulated by Skog [23]) or they may accentuate differences between low-level and high-level drinkers (i.e., a polarization of drinking habits as posited by Hallgren et al. [24]. A recent study [25] based on student data indicates that in 15 European countries the decline in alcohol consumption happened collectively, whereas in 11 countries a polarization of drinking patterns occurred (more individuals consuming less and more individuals consuming more).
Similar to alcohol consumption, tobacco smoking is on the decline in many European countries [26]. In contrast to alcohol, however, the reduction in tobacco consumption goes hand in hand with more restrictions on the availability and affordability of tobacco products. Consequently, this trend is less surprising and is often attributed to a tighter tobacco control policy [27,28]. Even though this interpretation is tempting in the tobacco field, we should keep in mind that such studies are based on ecological correlations (i.e., policy measures and prevalence rates at the population level) and, therefore, caution is warranted when results are extrapolated to individual behavior. In Austria, for example, smoking among adolescents decreased even before tighter tobacco control measures were introduced [29]. Surprisingly, analyses based on HBSC data suggest that pricing policies do affect the smoking habits of male adolescents but not of females [30,31]. The decline in the consumption of traditional cigarettes is also accompanied by an increase in alternative ways to consume nicotine (e.g., e-cigarettes, smoke-free tobacco), which are particularly popular among younger consumers of nicotine products [5,32]. Data from the UK did not support concerns about a ‘renormalisation’ of smoking as a consequence of increased experience with e-cigarettes among adolescents [33].
Smoking has a strong social gradient. Disadvantaged groups are more likely to start smoking, and their attempts to quit smoking are less successful [34,35]. Results from the latest Austrian Health Interview Survey (ATHIS) indicate a particularly strong social gradient for daily adult smokers: respondents with a lower educational level are twice as likely to be daily smokers as respondents with the highest level of education [36]. Students with a low socioeconomic status also showed an increased risk for daily smoking in a Danish sample of HBSC students [37]. Apart from socioeconomic differences, there is also evidence for a strong demand to adjust smoking cessation programs to the cultural background of smokers [38].
In our paper, we provide detailed descriptive information on trends for both alcohol and cigarette consumption among adolescents and young adults in Austria to highlight the similarities and differences in the developments for both substances. Our analyses are based on four waves of general population surveys (2004, 2008, 2015, 2020) covering a time period of 16 years [39,40,41]. The trends are analyzed for different subgroups (sex, educational level, employment status, place of residence) to assess whether the decline occurred homogenously across all adolescents and young adults or whether some subgroups were affected more strongly than others. In addition, we assess changes in different levels of consumption to detect polarization or collective shifts. Finally, we try to identify variables associated with substance use using a pooled data set of all survey waves and controlling for time trends.

2. Materials and Methods

2.1. Data Sources

The data were provided by four national, representative samples of the Austrian resident adult population (15 years and older) in projects commissioned and funded by the Austrian Ministry of Health. The surveys were conducted following the guidelines for general population surveys issued by international bodies like the EMCDDA [42] or recommendations from international expert groups in alcohol epidemiology [43]. Participation in all four surveys was completely voluntary and anonymous.
Homeless people, people living in institutions, and people with severe learning deficits were not included in our samples. Data collection was conducted face-to-face in 2004 and 2008, using a split-half method (face-t-face and online) in 2015, and completely online in 2020. In both 2015 and 2020, the online interviewees were selected from a predefined panel representative of the Austrian population. Analysis of the 2015 data did not show any relevant effect of the mode of collection on the observed prevalence rates [41].

2.2. Target Group and Weighting

For all analyses presented in this paper, only data from respondents aged between 15 and 24 were considered. In all four survey waves, younger age groups were oversampled, resulting in a disproportionately larger sample for those age groups (2004: n = 989, 2008: n = 1824, 2015: n = 829; 2020: n = 1126). The data from different survey waves were weighted based on the overall distribution of age and sex to control for potential effects of those two variables on the overall trend of prevalence rates. Analyses including information on their educational level and employment status were restricted to young adults aged between 20 and 24. Below, the term “young adults” will always refer to 20- to 24-year-olds, with the term “adolescents and young adults” referring to 15- to 24-year-olds.

2.3. Measures

Alcohol consumption and cigarette use were analyzed in time trends and used as dependent variables in multivariate analyses.
The concept of a ‘standard drink’ reveals great variation in different drinking cultures [44] and, therefore, the results of alcohol per capita consumption are indicated in grams of alcohol a day (g/d). Twenty grams of alcohol translate to half a liter of beer of normal strength or a quarter of a liter of light wine. Grams of alcohol per day were calculated following the recommendations of the Standardized European Alcohol Survey [43] using a beverage-specific quantity–frequency measure.
Cigarette consumption was assessed in terms of the percentage of daily/almost daily smokers and transformed into a dichotomous variable. In addition, the number of cigarettes smoked per day was used as a measure to indicate the intensity of smoking behavior.
Sex (male/female), educational level, employment status, and place of residence were used as dichotomous indicator variables for both alcohol per capita consumption and daily smoking. Educational level distinguishes between a low-level (corresponding to ISCED level 3 or lower) and a high-level (corresponding to ISCED level 4 or higher). Employment status distinguishes between “working” and “in education”. Unemployed respondents and those on parental leave were assigned to the category “other”. As there turned out to be very few cases in this last category, it was dropped for further analysis so as to avoid random variations due to confounders unrelated to employment status. Place of residence distinguishes between rural (living in the countryside or small villages) and urban settings (living in towns or metropolitan areas) based on the main residence of the respondent.

2.4. Analyses

The time trends in Section 3.1 provide descriptive information on changes in mean per capita consumption (including abstention) and in the prevalence of daily smokers. The overall change for males and females is displayed in charts and change rates were calculated for different subgroups. A two-way ANOVA was used to assess significant differences (alpha level = 0.05) between the two sexes, survey years, and the interaction term (sex * survey year). A significant effect of the interaction term indicates that the association between sex and the dependent variable differs between survey years. Interactions terms were also calculated to assess temporal changes in the association between educational level, employment status, place of residence, and the dependent variable.
In Section 3.2, trends are displayed for different levels of consumption using quartiles of alcohol per capita consumption and quartiles for the number of cigarettes smoked a day. Data from respondents who abstain from alcohol or do not smoke at all were excluded from these analyses.
In Section 3.3, multivariate analyses were carried out based on the pooled sample of the four survey waves to predict alcohol per capita consumption and daily smoking. Trend effects were controlled for by using a dichotomous indicator variable for each survey year. Sex, educational level, employment status, and place of residence were included as dependent variables in the final model. For the metric outcome of alcohol per capita consumption, multiple regression was applied. For the dichotomous outcome of daily smoking, binary logistic regression was applied. Significance was assessed using an alpha level of 0.05. All analyses were performed using SPSS 24 (IBM, Amonk, NY, USA).

3. Results

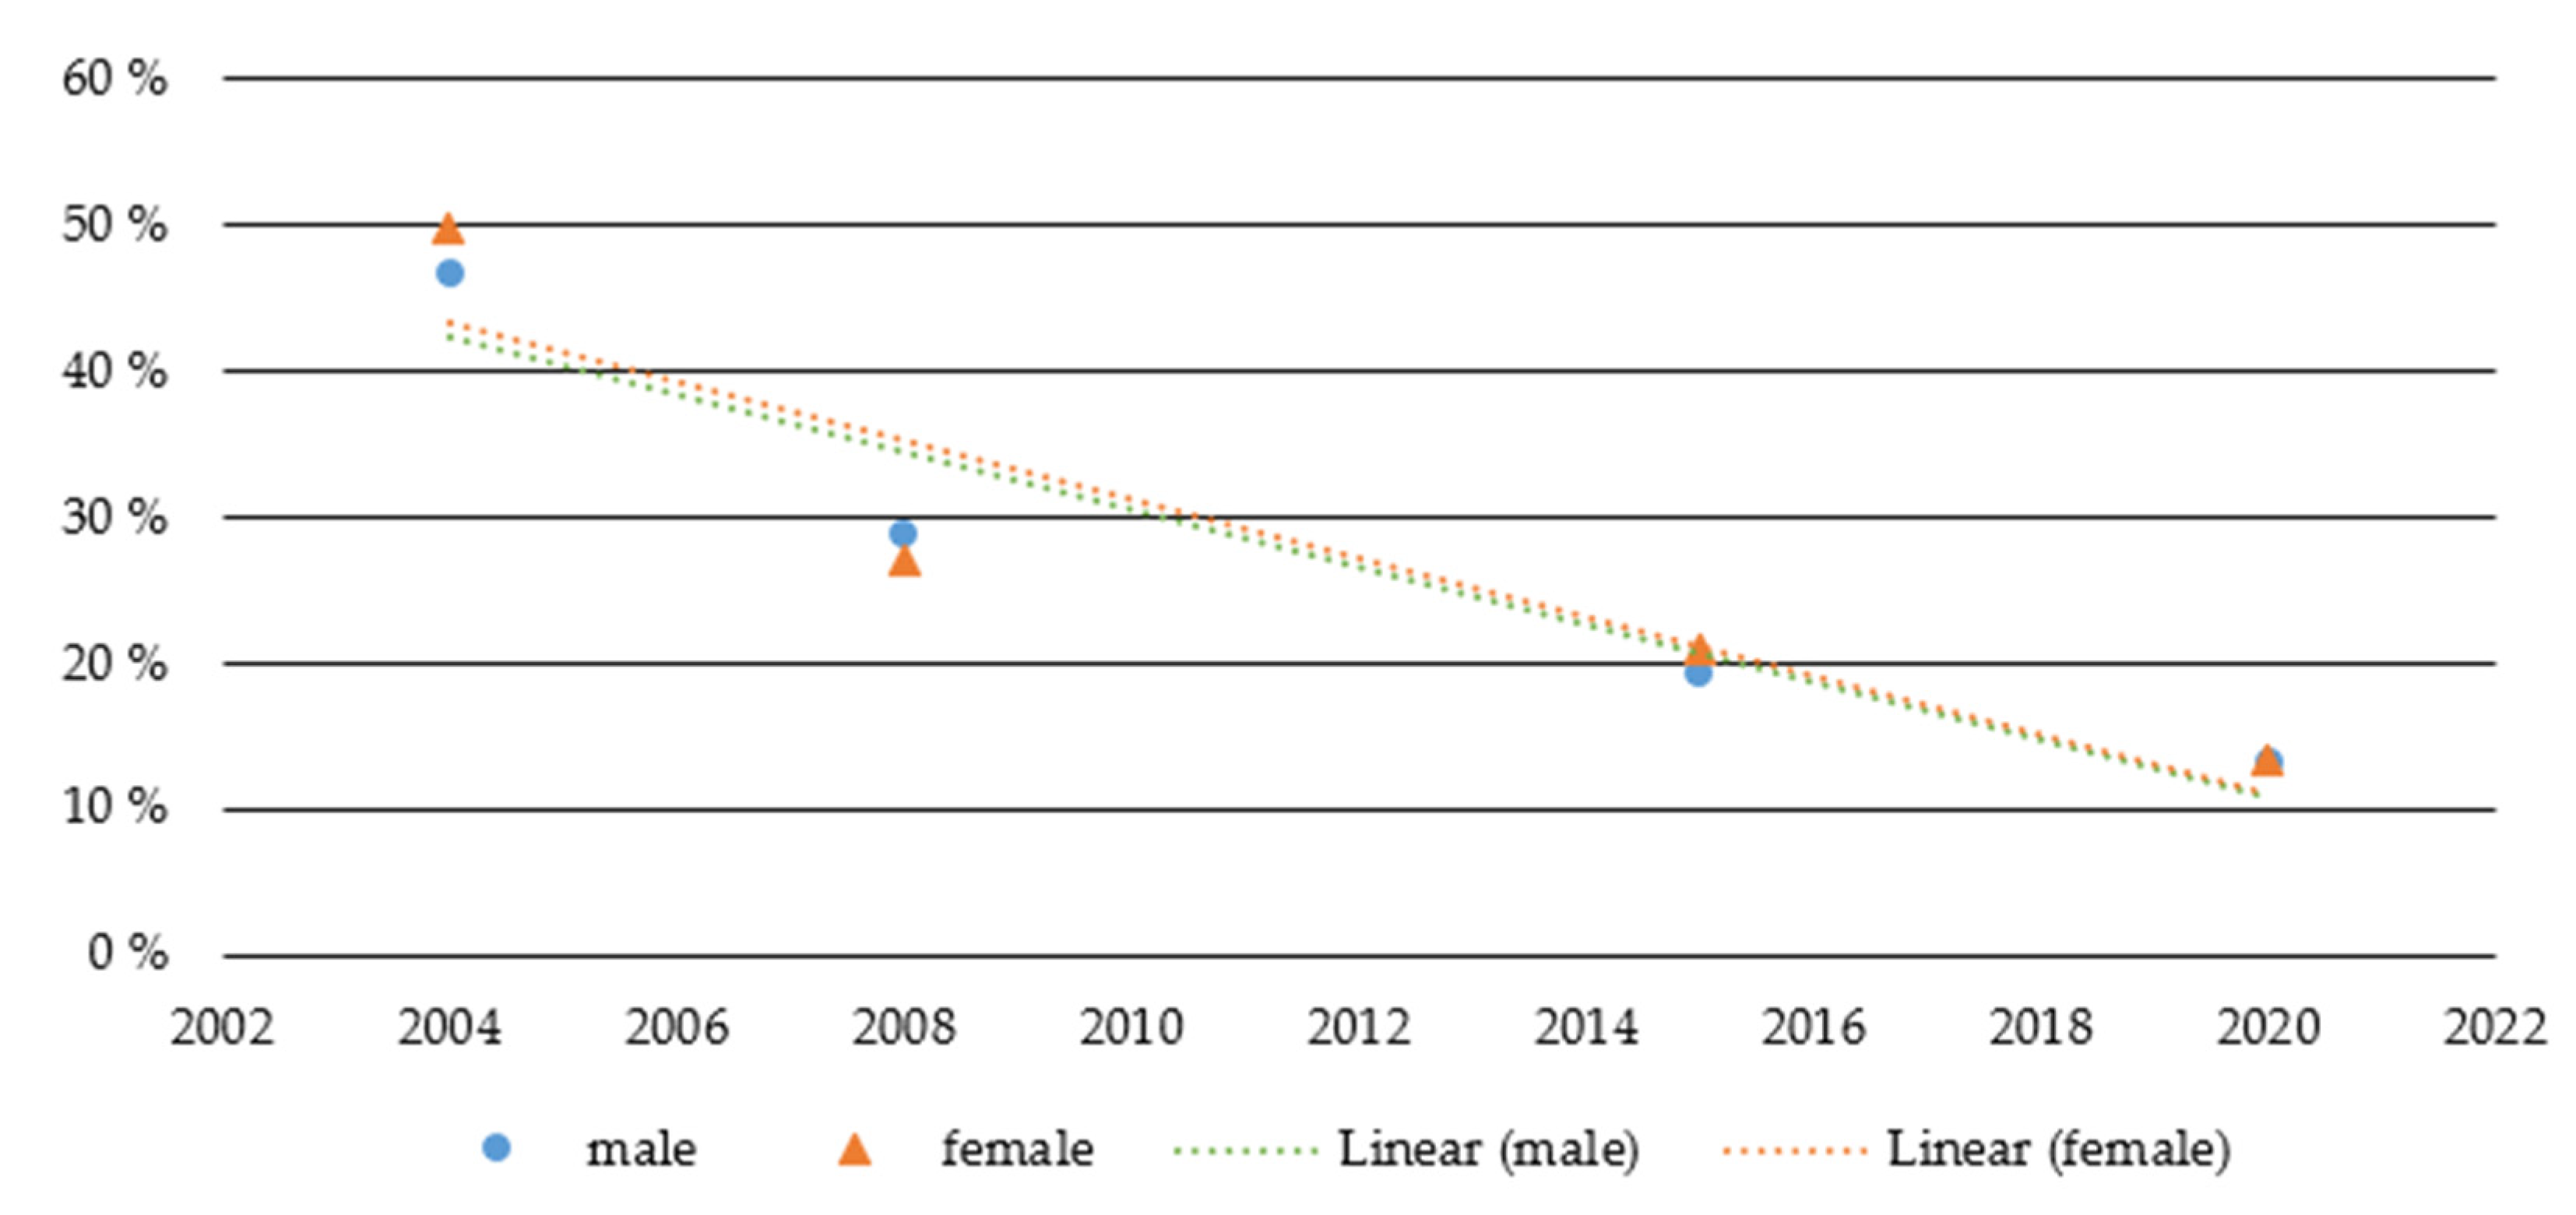
3.1. Changes in Alcohol and Nicotine Consumption between 2004 and 2020

Figure 1 indicates that alcohol per capita consumption among adolescents and young adults in Austria declined by more than 50% (from 27 g/d to 13 g/d) between 2004 and 2020. The decline in per capita consumption among males (from 34 g/d to 15 g/d or −54%) is slightly larger than among females (from 20 g/d to 10 g/d or −51%). Consequently, the gap between males and females narrowed, both in absolute and relative terms. In 2004, males consumed 15 g more alcohol a day on average, which is 75% more than females. By 2020 this divergence between the two sexes had decreased to 6 g a day, with males consuming 60% more than females on average. A two-way ANOVA revealed significant effects for sex (p = 0.000) and survey year (p = 0.000) as independent variables as well as for the sex * survey year interaction term (p = 0.003).
Based on educational level, employment status, and place of residence, all subgroups showed a downward trend in alcohol consumption (Table 1). Young adults with a higher level of education exhibited a steeper decrease than those with a lower level (−60% vs. −45%), as did young adults still in education compared to those who were already working (−62% vs. −51%). Adolescents and young adults in urban settings showed a larger decline compared to adolescents and young adults in rural settings (−53% vs. −47%). Effect sizes for the interaction terms are rather small and, therefore, indicate only very small changes in the association between alcohol per capita consumption and the three selected socioeconomic variables. In fact, the association was only significant for employment status.
In contrast to alcohol use, daily smoking of cigarettes started at similar base levels for males and females and decreased for both sexes to an almost identical degree. Overall, the number of daily smokers among adolescents and young adults declined from 48% to 13% (males from 47% to 13%, −73%; females from 50% to 13%, −72%). A two-way ANOVA revealed a significant effect for survey year (p = 0.000) but no significant effects for sex (p = 0.638) or the interaction term sex * survey year (p = 0.516) (Figure 2).
Based on educational level, employment status, or place of residence, all subgroups showed a decrease in the prevalence of daily smoking. Young adults with a higher level of education showed a steeper decrease (−73%) than those with a lower educational level (−54%) with a similar pattern for young adults still in education (−76%) compared to those already in work (−67%). Adolescents and young adults in rural settings (−77%) exhibited a larger decline compared to those in urban settings (−70%). Effect sizes for the interaction terms are rather small and, therefore, indicate only very small changes in the association between daily smoking and the three selected socioeconomic variables. Again, the association was only significant for employment status (Table 2).

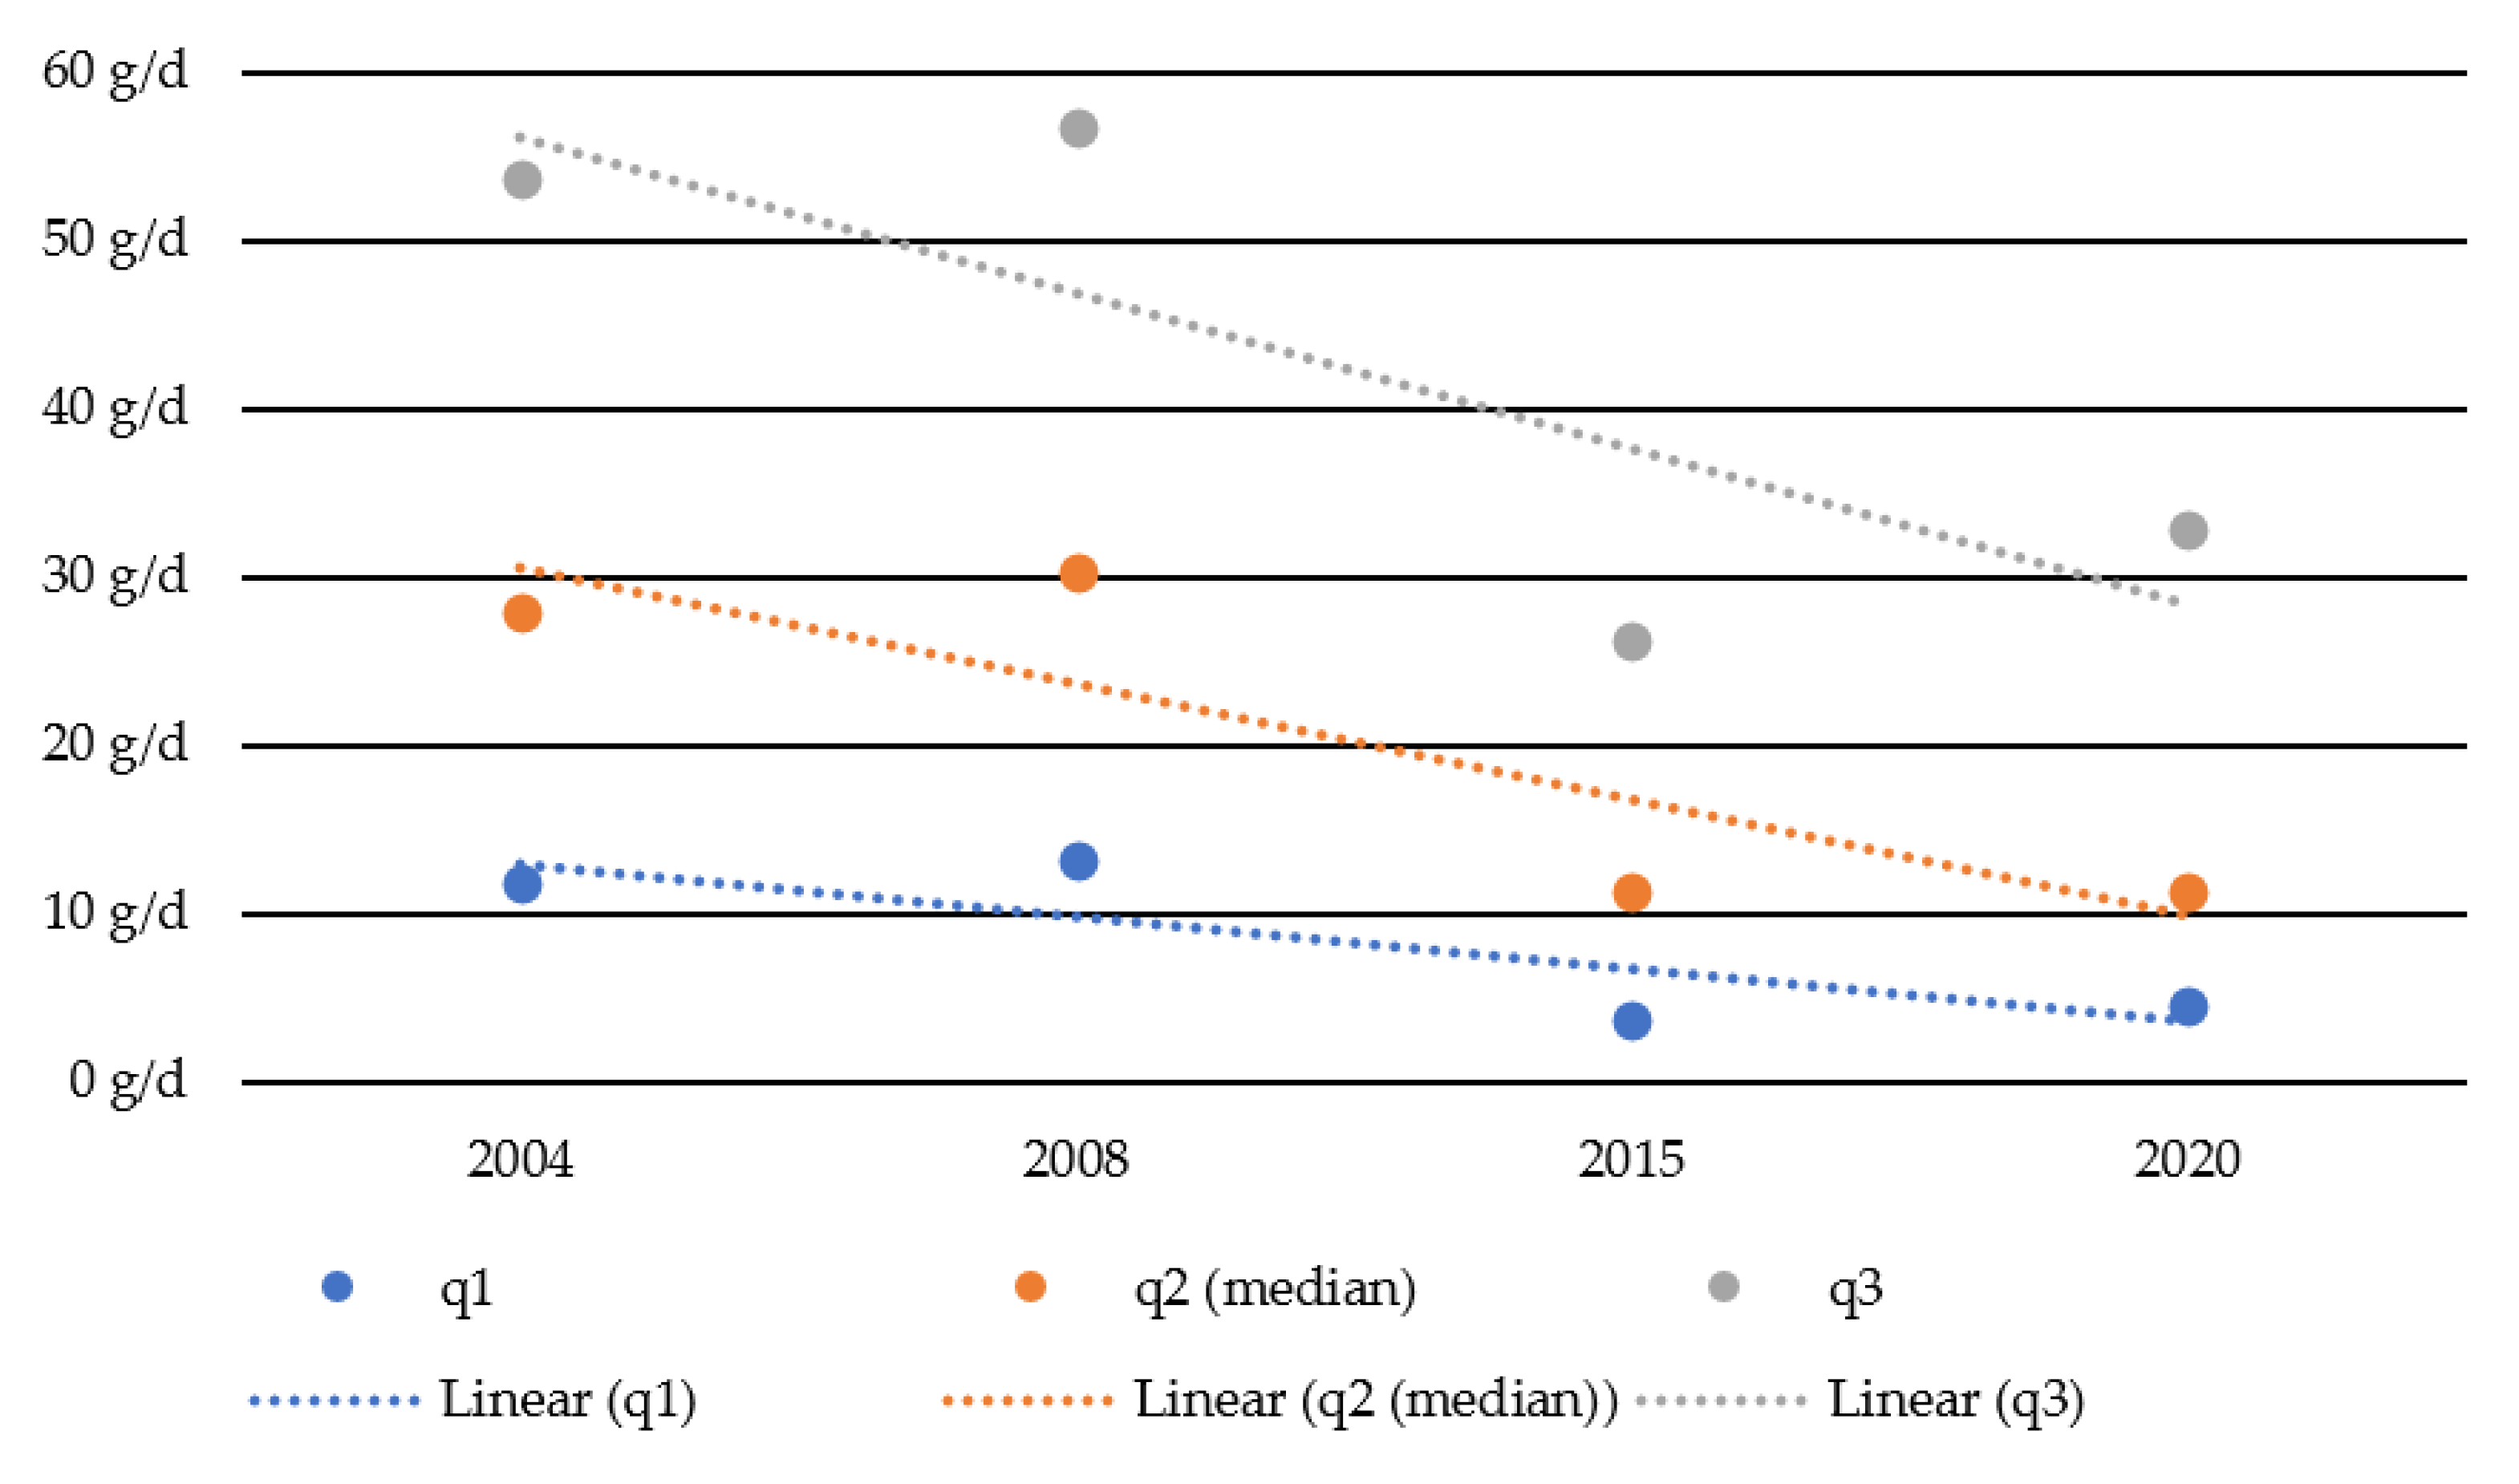
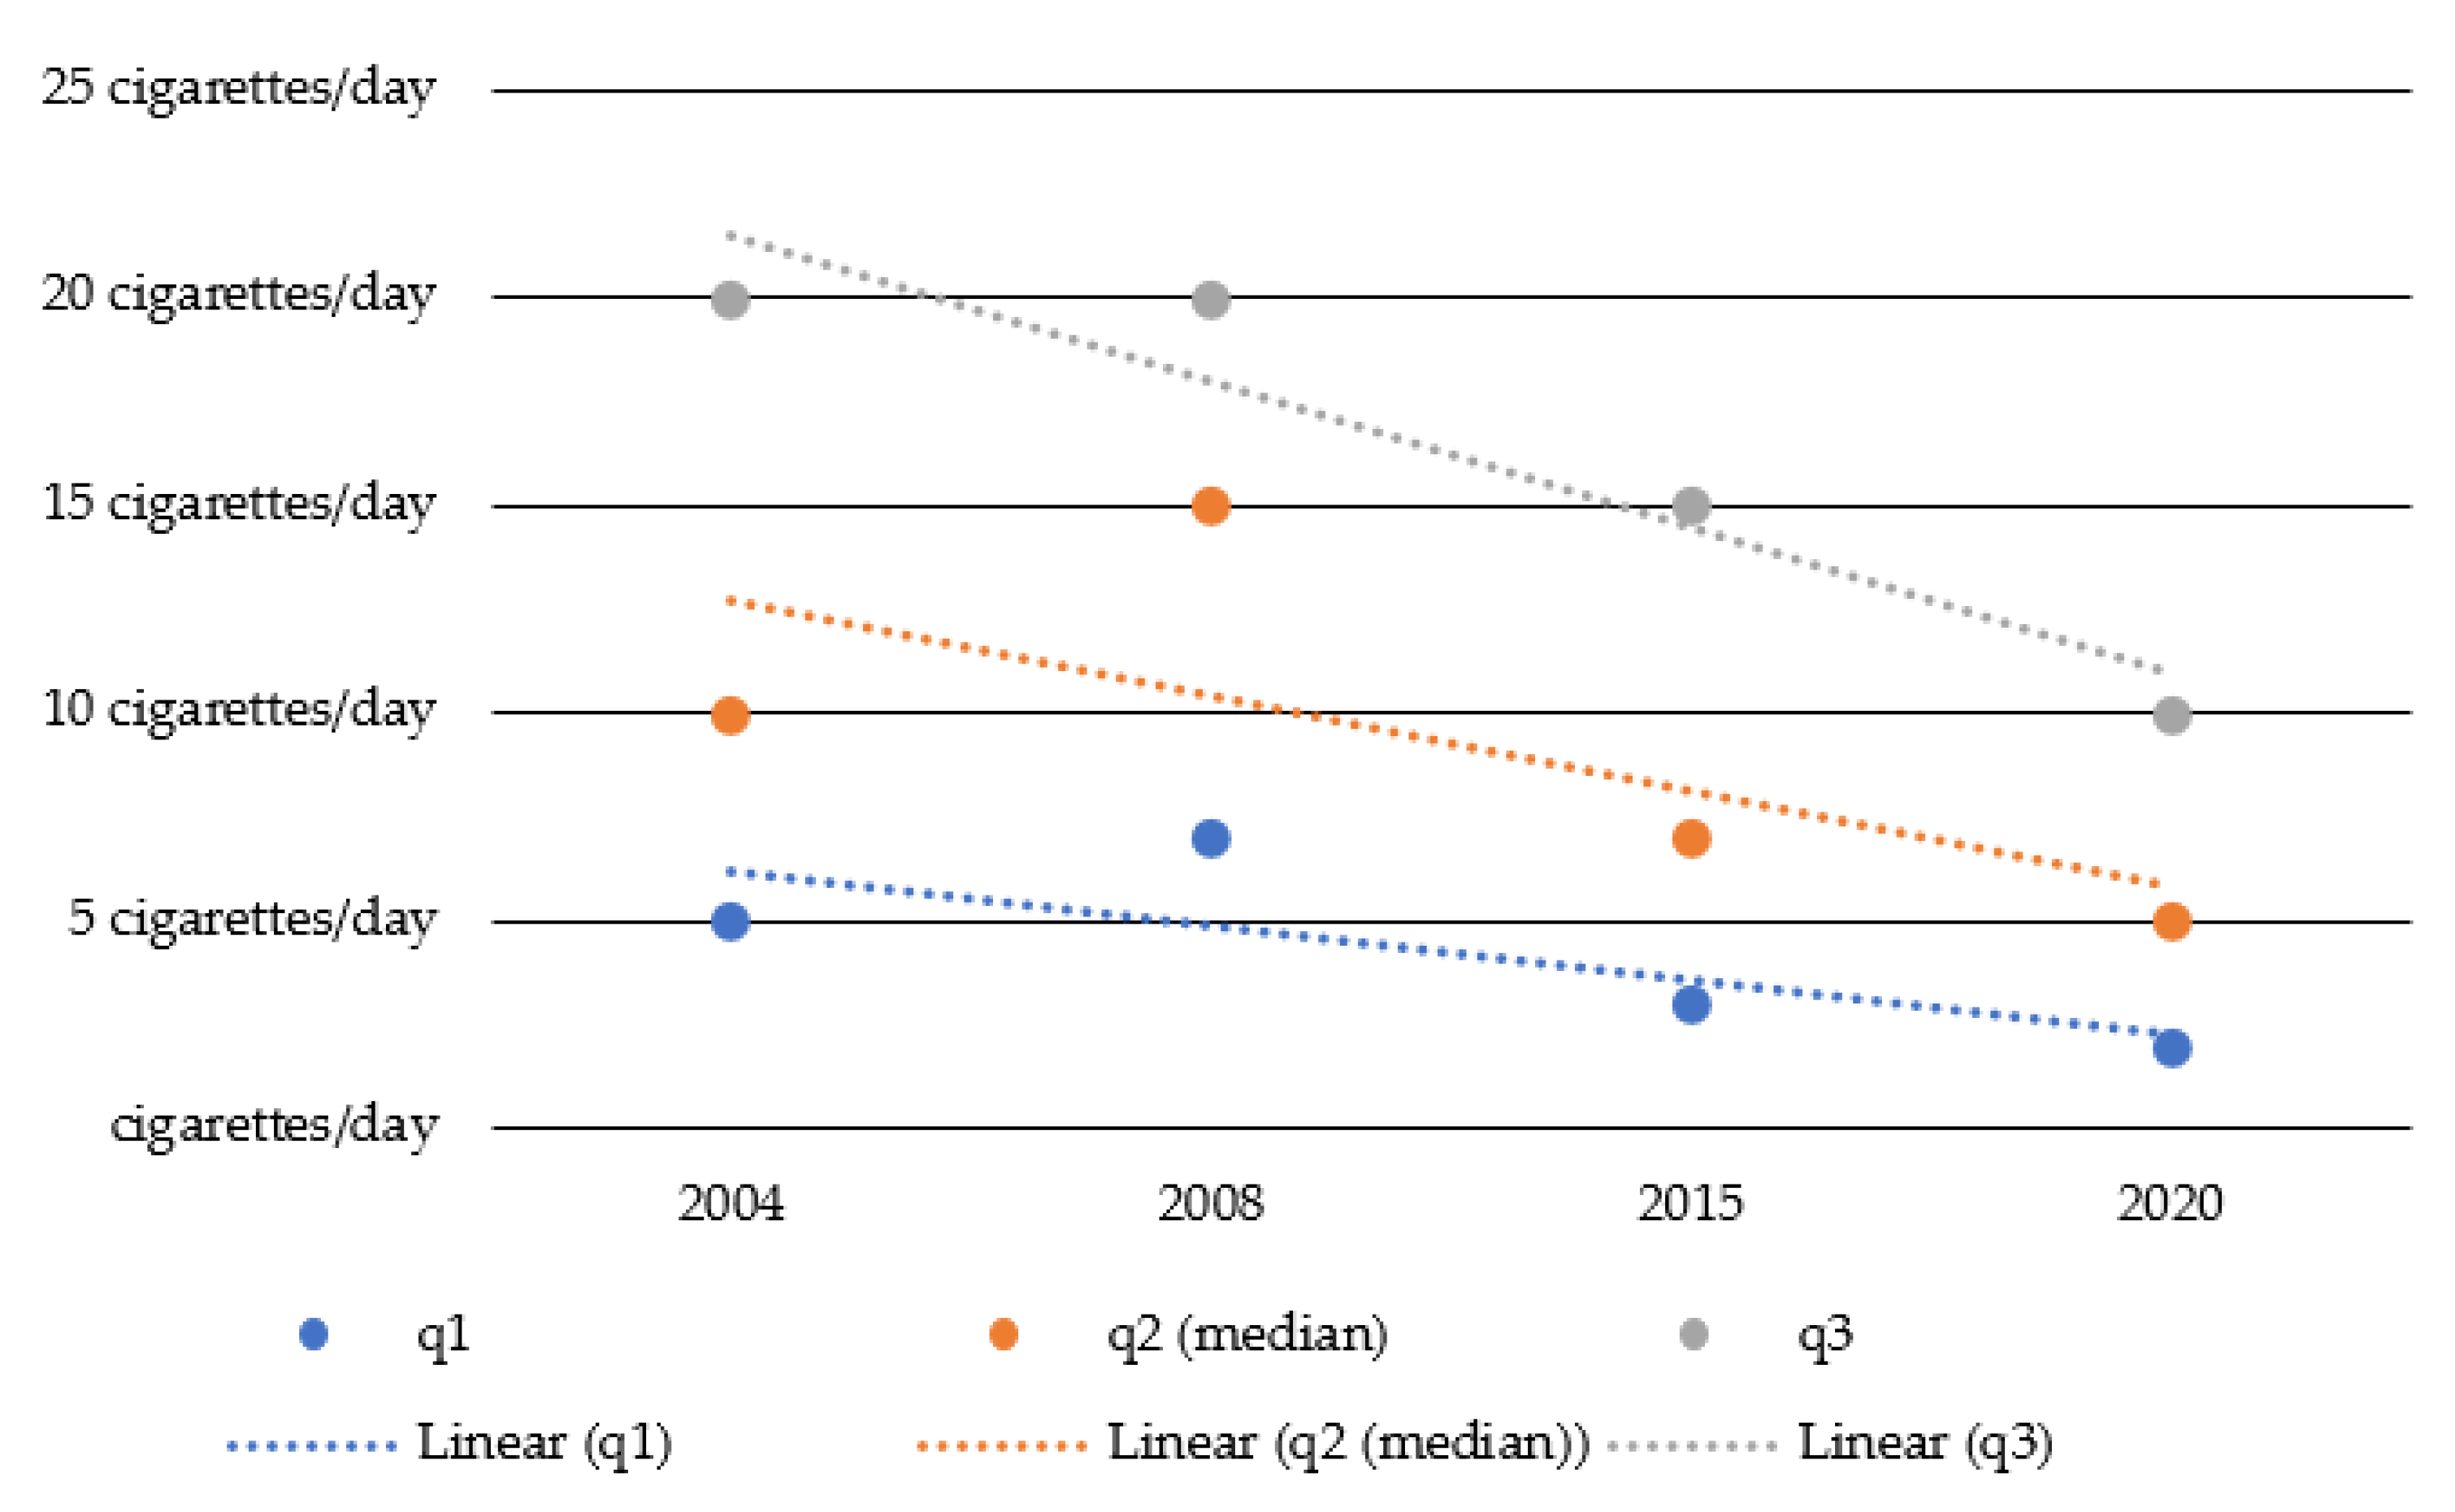
3.2. Trends for Different Levels of Consumption

The quartiles of consumption levels among the drinking population of adolescents and young adults are displayed in Figure 3. Compared to 2004, the value for the upper quartile (q3) dropped from 54 g/d to 32 g/d (−39%), the value for the median (q2) fell from 28 g/d to 11 g/d (−59%), and the lowest quartile (q1) dropped from 12 g/d to 5 g/d (−62%). Accordingly, the gap between high- and low-level drinkers narrowed in absolute terms from 42 g in 2004 to 28 g in 2020. The decrease in alcohol consumption can be observed at all levels of consumption.
The quartiles of the number of cigarettes a day among the smoking population of adolescents and young adults are illustrated in Figure 4. Compared to 2004, the value for the upper quartile (q3) dropped from 20 to 10 cigarettes (a reduction of 50%), the value for the median (q2) dropped from 10 to 5 cigarettes (a reduction of 50%), and the lower quartile (q1) dropped from 5 to 2 cigarettes (a reduction of 60%).
Similar to alcohol consumption, the gap between high- and low-level smokers narrowed in terms of absolute numbers (from 15 cigarettes difference in 2004 to 8 cigarettes difference in 2020). The decrease in tobacco consumption can be observed at all levels of consumption as well.

3.3. Associations between Socieconomic Variables and Alcohol per Capita Consumption or Daily Smoking

In a final step, two multivariate models were set up to assess whether sex, educational level, employment status, or place of residence are significantly associated with alcohol per capita consumption or daily smoking.
Survey years were used as indicator variables in Model 1, with sex, educational level, employment status, and place of residence used as additional variables in Model 2. Adding the four additional variables increases the predictive values (R2) for the level of alcohol per capita consumption and daily smoking (Table 3).
Sex and place of residence significantly predict the level of alcohol per capita consumption. Being male and living in rural areas is associated with a higher level of alcohol consumption in the pooled sample of young adults (20–24 years). In contrast, the level of education and employment status do not significantly predict alcohol per capita consumption (Table 4).
According to the logistic regression model, young adults with a higher level of education and young adults who are still in education are less likely to smoke on a daily basis. In contrast, sex and place of residence do not predict whether young adults smoke cigarettes on a daily basis or not (Table 5).

4. Discussion

While most studies focus either on alcohol or tobacco consumption, our analyses help to highlight the similarities and differences between the two substances based on the same data set covering a period of 16 years. Our results provide empirical evidence that the decline in both alcohol and tobacco consumption among adolescents and young adults is also reflected in the latest survey data. These results are in line with most results from the ESPAD study [5], according to which Austria belongs to the group of countries where alcohol use has declined to date. Using broader age groups than in the school surveys, our results support the idea that the decrease in drinking and smoking is not limited to student populations but is also passed on to subsequent age cohorts.
Both males and females show a downward trend for alcohol and tobacco consumption, but the trends differ in detail: whereas daily smoking for both sexes started at the same level and dropped to a similar extent for both sexes, male alcohol consumption started at a higher level but showed a steeper decline than female alcohol consumption. Despite the convergence of drinking levels between men and women [45], being male is still associated with higher levels of alcohol per capita consumption. Furthermore, a qualitative study on adolescents who abstain indicate that gender roles are more flexible but that males and females still face different normative expectations with regard to drinking behaviors [15]. In contrast, levels of cigarette smoking do not show any differences between males and females at all. These results are in contrast to international statistics provided by the WHO which indicate a much higher rate of smoking in males than in females both for Europe and on a global level [26].
Based on the different levels of consumption for the respondents in our sample, our analyses do not fuel concerns that the general decline in legal substance use may lead to a polarization of consumption cultures (meaning that the decrease can be explained only by a growing number of abstainers, with active consumers not showing any reduction). Instead, both high- and low-level consumers of alcohol and tobacco show a reduction, resulting in a convergence of consumption patterns. This result is important and requires further observation with regard to recent concerns that in the course of the COVID-19 pandemic, health disparities in general, as well as health problems in relation to problems due to substance use in particular, may have grown [46,47]. In this context, our subgroup analyses based on data before the pandemic revealed consistent trends for educational level and employment status over the period of 16 years: declines are observed in all subgroups but are more pronounced among young adults still in education. Therefore, further research is required to ascertain whether this trend will continue after the pandemic and whether the social gradient of substance-related problems will steepen. Holstein et al. [37] stress in this context that studies of changes in socioeconomic differences over time should address both absolute and relative socioeconomic differences as they may lead to different conclusions.
Despite the similarities in decreasing consumption, alcohol and cigarette use differs in terms of their associations with socioeconomic variables. Sex and place of residence are significantly associated with the level of alcohol consumption, whereas socioeconomic status (educational level, employment status) does not show any significant effect on per capita consumption. Exactly the opposite can be observed for cigarette use. Educational levels and employment status are significantly associated with daily smoking, whereas the prevalence rates for daily smoking do not show any significant difference between the two sexes or between rural and urban areas.

5. Limitations

Several limitations should be considered when interpreting the results presented in this paper. First, our results are based on self-reported data. Changes in attitudes toward alcohol or tobacco consumption may influence the likelihood of truly reporting the magnitude of consumption, although this effect is expected to be smaller compared to survey research on illegal substance use. Second, any conclusion as to a polarization of consumption patterns is limited by the fact that marginalized people are under-represented or even excluded (e.g., homeless people) in surveys. Third, our analyses were limited to indicators covered in all survey waves. For example, there is growing evidence [1] that the detrimental health effects of alcohol consumption are not only caused by the amount of per capita consumption but also by patterns of alcohol consumption (e.g., the likelihood of injury increases when large amounts of alcohol are consumed in a short time). However, patterns of consumption were not assessed in all survey waves and, therefore, could not be included in our analyses. Finally, the data collection in 2020 coincided with the first wave of the COVID-19 pandemic in Austria. The vast majority of respondents reported that they had not notably changed their alcohol or cigarette consumption due to the pandemic. Still, it is not possible to separate effects specific to circumstances caused by the pandemic from the continued decline in consumption.

6. Conclusions

The convergence of male and female alcohol consumption levels among young adults is one of the most relevant changes in substance use in the 16-year period. Differences in the prevalence of smoking between males and females already vanished two decades ago. However, similar levels of consumption should not hide the fact that more specific prevention measures might be required for both sexes separately and for different substances. The associations with socioeconomic variables are rather stable over the 16-year period, and preventive measures should consider that different subgroups of adolescents and young adults show higher levels of alcohol use compared to tobacco consumption. Regarding alcohol use, specific interventions for young males living in rural areas might be necessary to complement existing interventions. Regarding smoking, more targeted interventions may be required for young adults with lower levels of education and who have already started to work. Our data do not provide evidence for a polarization of drinking or smoking patterns. However, this issue should not be neglected due to the potential consequences of the COVID-19 pandemic on the social gradient of substance use.

Author Contributions

Conceptualization, J.S., D.M., A.U.; methodology, J.S., D.M., A.U.; M.S.; formal analysis, J.S.; writing—original draft preparation, J.S., D.M., A.U.; review and editing, J.S., D.M., A.U., M.S. All authors have read and agreed to the published version of the manuscript.

Funding

This research was funded by a publication grant provided by Gesundheit Österreich GmbH (Austrian Public Health Institute).

Institutional Review Board Statement

Ethical review and approval were waived for this study due to the lack of ethical review boards for survey research conducted by non-university research institutes. All survey waves were commissioned and funded by the Austrian Ministry of Health and were subject to internal review in terms of data privacy ethical appropriateness. The surveys were conducted by Gesundheit Österreich GmbH (Austrian Public Health Institute) following the guidelines for general population surveys issued by the EMCDDA and the WHO.

Informed Consent Statement

Informed consent was obtained from all subjects involved in the studies. Participation in all surveys was completely voluntary and anonymous.

Data Availability Statement

All data and SPSS syntax used for the analyses in this paper can be made available upon request.

Conflicts of Interest

The authors declare no conflict of interest.

References

  1. Rehm, J.; Gmel, G.E., Sr.; Gmel, G.; Hasan, O.S.M.; Imtiaz, S.; Popova, S.; Probst, C.; Roerecke, M.; Room, R.; Samokhvalov, A.V.; et al. The relationship between different dimensions of alcohol use and the burden of disease—An update. Addiction 2017, 112, 968–1001. [Google Scholar] [CrossRef] [Green Version]
  2. Olusanya, B.O.; Ştefan, S.; Kim, Y.; Alcalde-Rabanal, J.E.; Akinyemiju, T.; Koyanagi, A.; Cohen, A.J.; Wondmieneh, A.B.; De Leo, D.; Ippolito, H.; et al. Global burden of 87 risk factors in 204 countries and territories, 1990–2019: A systematic analysis for the Global Burden of Disease Study 2019. Lancet 2019, 396, 1223–1249. [Google Scholar]
  3. Bühler, A.; Thrul, J. Prevention of Addictive Behaviours: Updated and Expanded Edition of Prevention of Substance Abuse; EMCDDA Insights No 7; Publications Office of the European Union: Luxembourg, 2015. [Google Scholar]
  4. Suchtvorbeugung, A. Österreichische ARGE Suchtvorbeugung. 2021. Available online: https://www.suchtvorbeugung.net/ (accessed on 5 December 2021).
  5. ESPAD Group. ESPAD Report 2019: Results from the European School Survey Project on Alcohol and Other Drugs; European School Survey Project on Alcohol and Other Drugs: Lisbon, Portugal, 2020. [Google Scholar]
  6. Inchley, J.C.; Currie, D.B.; Vieno, A.; Torsheim, T.; Ferreira-Borges, C.; Weber, M.; Barnekow, V.; Breda, J. Adolescent Alcohol-Related Behaviours: Trends and Inequalities in the WHO European Region, 2002–2014; WHO Regional Office for Europe: København, Denmark, 2018. [Google Scholar]
  7. Looze, M.D.; Raaijmakers, Q.; Bogt, T.T.; Bendtsen, P.; Farhat, T.; Ferreira, M.; Godeau, E.; Kuntsche, E.; Molcho, M.; Pförtner, T.K.; et al. Decreases in adolescent weekly alcohol use in Europe and North America: Evidence from 28 countries from 2002 to 2010. Eur. J. Public Health 2015, 25 (Suppl. S2), 69–72. [Google Scholar] [CrossRef] [PubMed]
  8. Kraus, L.; Seitz, N.N.; Piontek, D.; Molinaro, S.; Siciliano, V.; Guttormsson, U.; Arpa, S.; Monshouwer, K.; Leifman, H.; Vicente, J.; et al. ‘Are the times A-changin’? Trends in adolescent substance use in Europe. Addiction 2018, 113, 1317–1332. [Google Scholar] [CrossRef]
  9. Pennay, A.; Holmes, J.; Törrönen, J.; Livingston, M.; Kraus, L.; Room, R. Researching the decline in adolescent drinking: The need for a global and generational approach. Drug Alcohol Rev. 2018, 37, S115–S119. [Google Scholar] [CrossRef] [PubMed]
  10. Pape, H.; Rossow, I.; Brunborg, G.S. Adolescents drink less: How, who and why? A review of the recent research literature. Drug Alcohol Rev. 2018, 37, S98–S114. [Google Scholar] [CrossRef]
  11. Hojni, M.; Delcour, J.; Strizek, J.; Uhl, A. ESPAD Österreich; Forschungsbericht; Gesundheit Österreich: Vienna, Austria, 2019. [Google Scholar]
  12. Bachmayer, S.; Strizek, J.; Uhl, A. Handbuch Alkohol—Österreich: Band 1—Statistiken und Berechnungsgrundlagen; Gesundheit Österreich GmbH: Vienna, Austria, 2020. [Google Scholar]
  13. Twenge, J.M.; Park, H. The decline in adult activities among US adolescents, 1976–2016. Child Dev. 2019, 90, 638–654. [Google Scholar] [CrossRef]
  14. Kraus, L.; Room, R.; Livingston, M.; Pennay, A.; Holmes, J.; Törrönen, J. Long waves of consumption or a unique social generation? Exploring recent declines in youth drinking. Addict. Res. Theory 2019, 28, 183–193. [Google Scholar] [CrossRef]
  15. Törrönen, J.; Roumeliotis, F.; Samuelsson, E.; Kraus, L.; Room, R. Why are young people drinking less than earlier? Identifying and specifying social mechanisms with a pragmatist approach. Int. J. Drug Policy 2019, 64, 13–20. [Google Scholar] [CrossRef]
  16. Månsson, J.; Samuelsson, E.; Törrönen, J. Doing adulthood—Doing alcohol: What happens when the ‘sober generation’ grows up? J. Youth Stud. 2020. [Google Scholar] [CrossRef]
  17. Gale, M.S.; Lenardson, M.H.S.; Lambert, J.D.; Hartley, M.H.A. Adolescent Alcohol Use: Do Risk and Protective Factors Explain Rural-Urban Differences? Maine Rural Health Research Center: Portland, ME, USA, 2012. [Google Scholar]
  18. Martin, G.; Inchley, J.; Marshall, A.; Shortt, N.; Currie, C. The neighbourhood social environment and alcohol use among urban and rural Scottish adolescents. Int. J. Public Health 2018, 64, 95–105. [Google Scholar] [CrossRef] [Green Version]
  19. Cronk, C.E.; Sarvela, P.D. Alcohol, tobacco, and other drug use among rural/small town and urban youth: A secondary analysis of the monitoring the future data set. Am. J. Public Health 1997, 87, 760–764. [Google Scholar] [CrossRef] [PubMed] [Green Version]
  20. DeHaan, L.; Boljevac, T. Alcohol prevalence and attitudes among adults and adolescents: Their relation to early adolescent alcohol use in rural communities. J. Child Adolesc. Subst. Abuse 2010, 19, 223–243. [Google Scholar] [CrossRef] [PubMed] [Green Version]
  21. Donath, C.; Gräßel, E.; Baier, D.; Pfeiffer, C.; Karagülle, D.; Bleich, S.; Hillemacher, T. Alcohol consumption and binge drinking in adolescents: Comparison of different migration backgrounds and rural vs. urban residence—A representative study. BMC Public Health 2011, 11, 84. [Google Scholar] [CrossRef] [PubMed] [Green Version]
  22. Warren, J.C.; Smalley, K.B.; Barefoot, K.N. Recent alcohol, tobacco, and substance use variations between rural and urban middle and high school students. J. Child Adolesc. Subst. Abuse 2017, 26, 60–65. [Google Scholar] [CrossRef] [Green Version]
  23. Skog, O.J. The collectivity of drinking cultures: A theory of the distribution of alcohol consumption. Br. J. Addict. 1985, 80, 83–99. [Google Scholar] [CrossRef]
  24. Hallgren, M.; Leifman, H.; Andréasson, S. Drinking less but greater harm: Could polarized drinking habits explain the divergence between alcohol consumption and harms among youth? Alcohol Alcohol. 2012, 47, 581–590. [Google Scholar] [CrossRef] [Green Version]
  25. Loy, J.K.; Seitz, N.-N.; Bye, E.K.; Raitasalo, K.; Soellner, R.; Törrönen, J.; Kraus, L. Trends in alcohol consumption among adolescents in Europe: Do changes occur in concert? Drug Alcohol Depend. 2021, 228, 109020. [Google Scholar] [CrossRef] [PubMed]
  26. WHO. WHO Global Report on Trends in Prevalence of Tobacco Use 2000–2025; World Health Organization: Geneva, Switzerland, 2019. [Google Scholar]
  27. Feliu, A.; Filippidis, F.T.; Joossens, L.; Fong, G.T.; Vardavas, C.; Baena, A.; Castellano, Y.; Martinez, C.; Fernández, E. Impact of tobacco control policies on smoking prevalence and quit ratios in 27 European Union countries from 2006 to 2014. Tob. Control 2018, 28, 101–109. [Google Scholar]
  28. Currie, L.M.; Blackman, K.; Clancy, L.; Levy, D.T. The effect of tobacco control policies on smoking prevalence and smoking-attributable deaths in Ireland using the IrelandSS simulation model. Tob. Control 2013, 22, e25–e32. [Google Scholar] [CrossRef] [PubMed]
  29. Schmutterer, I. Tabak- und Verwandte Erzeugnisse: Zahlen und Fakten 2020; Gesundheit Österreich: Vienna, Austria, 2020. [Google Scholar]
  30. Pförtner, T.-K.; Hublet, A.; Schnohr, C.W.; Rathmann, K.; Moor, I.; de Looze, M.; Baška, T.; Molcho, M.; Kannas, L.; Kunst, A.E.; et al. Socioeconomic inequalities in the impact of tobacco control policies on adolescent smoking. A multilevel study in 29 European countries. Addict. Behav. 2016, 53, 58–66. [Google Scholar] [CrossRef]
  31. Hublet, A.; Schmid, H.; Clays, E.; Godeau, E.; Nic Gabhainn, S.; Joossens, L.; Maes, L.; The HBSC Research Network. Association between tobacco control policies and smoking behaviour among adolescents in 29 European countries. Addiction 2009, 104, 1918–1926. [Google Scholar] [CrossRef]
  32. Fadus, M.C.; Smith, T.T.; Squeglia, L.M. The rise of e-cigarettes, pod mod devices, and JUUL among youth: Factors influencing use, health implications, and downstream effects. Drug Alcohol Depend. 2019, 201, 85–93. [Google Scholar] [CrossRef]
  33. Hallingberg, B.; Maynard, O.M.; Bauld, L.; Brown, R.; Gray, L.; Lowthian, E.; MacKintosh, A.-M.; Moore, L.; Munafo, M.R.; Moore, G. Have e-cigarettes renormalised or displaced youth smoking? Results of a segmented regression analysis of repeated cross sectional survey data in England, Scotland and Wales. Tob. Control 2019, 29, 207–216. [Google Scholar] [CrossRef]
  34. Hiscock, R.; Bauld, L.; Amos, A.; Fidler, J.A.; Munafo, M. Socioeconomic status and smoking: A review. Ann. N. Y. Acad. Sci. 2011, 1248, 107–123. [Google Scholar] [CrossRef]
  35. Thirlway, F. Explaining the social gradient in smoking and cessation: The peril and promise of social mobility. Sociol. Health Illn. 2019, 42, 565–578. [Google Scholar] [CrossRef]
  36. Klimont, J.; Prammer-Waldhör, M. Soziodemographische und Sozioökonomische Determinanten von Gesundheit; Statistik: Vienna, Austria, 2020. [Google Scholar]
  37. Holstein, B.; Andersen, A.; Damsgaard, M.T.; Due, P.; Bast, L.S.; Rasmussen, M. Trends in socioeconomic differences in daily smoking among 15-year-old Danes 1991–2014. Scand. J. Public Health 2019, 48, 667–673. [Google Scholar] [CrossRef] [PubMed]
  38. Urban, M.; Burghuber, O.; Dereci, C.; Aydogan, M.; Selimovic, E.; Catic, S.; Funk, G.-C. Tobacco addiction and smoking cessation in Austrian migrants: A cross-sectional study. BMJ Open 2015, 5, e006510. [Google Scholar] [CrossRef] [Green Version]
  39. Uhl, A.; Strizek, J. Österreichweite Repräsentativerhebung zu Substanzgebrauch. Erhebung 2004. Bericht; Bundesministerium für Gesundheit und Frauen: Vienna, Austria, 2005; p. 169. [Google Scholar]
  40. Uhl, A.; Strizek, J.; Puhm, A.; Kobrna, U.; Springer, A. Österreichweite Repräsentativerhebung zu Substanzgebrauch. Band 1: Forschungsbericht; Bundesministerium für Gesundheit: Vienna, Austria, 2009; p. 71. [Google Scholar]
  41. Strizek, J.; Uhl, A. Bevölkerungserhebung zu Substanzgebrauch. Band 1: Forschungsbericht; Gesundheit Österreich: Vienna, Austria, 2016. [Google Scholar]
  42. EMCDDA. Handbook for Surveys on Drug Use Among the General Population; EMCDDA project CT.99.EP.08 B.; EMCDDA: Lisbon, Portugal, 2002. [Google Scholar]
  43. Moskalewicz, J.; Room, R.; Thom, B. (Eds.) Comparative Monitoring of Alcohol Epidemiology Across the EU. Baseline Assessment and Suggestions for Future Action—Synthesis Report; PARPA—The State Agency for Prevention of Alcohol Related Problems: Warsaw, Poland, 2016; p. 368. [Google Scholar]
  44. Kalinowski, A.; Humphreys, K. Governmental standard drink definitions and low-risk alcohol consumption guidelines in 37 countries. Addiction 2016, 111, 1293–1298. [Google Scholar] [CrossRef] [PubMed] [Green Version]
  45. Uhl, A.; Strizek, J.; Hojni, M. Handbuch Alkohol Österreich. Band 3: Ausgewählte Themen; Gesundheit Österreich: Vienna, Austria, 2020. [Google Scholar]
  46. Das, A.; Singh, P.; Bruckner, T.A. State lockdown policies, mental health symptoms, and using substances. Addict. Behav. 2021, 124, 107084. [Google Scholar] [CrossRef] [PubMed]
  47. Bambra, C.; Riordan, R.; Ford, J.; Matthews, F. The COVID-19 pandemic and health inequalities. J. Epidemiol. Commun. Health 2020, 74, 964–968. [Google Scholar] [CrossRef] [PubMed]
Figure 1. Change in alcohol per capita consumption for male and female adolescents and young adults between 2004 and 2020. Note: g/d = gram/day.
Ijerph 18 13080 g001
Figure 2. Daily smoking among adolescents and young adults between 2004 and 2020.
Ijerph 18 13080 g002
Figure 3. Quartiles of alcohol per capita consumption (g/d) among the drinking population from 2004–2020.
Ijerph 18 13080 g003
Figure 4. Quartiles of cigarettes a day among the smoking population between 2004 and 2020.
Ijerph 18 13080 g004
Table 1. Change in mean per capita consumption (g/d) for different subgroups of adolescents and young adults between 2004 and 2020.
Subgroup2004200820152020Change Rate 2004–2020 1Interaction Term
(Eta Square)
Total27232213−54%-
Sex
 Males34302615−55%0.003 **
 Females20151710−51%
Educational level *
 Lower level of education32232817−45%0.001
 Higher level of education34232214−60%
Employment status *
 Working34232816−51%0.003 **
 In education35302213−62%
Place of residence
 Rural29242816−47%0.001
 Urban26211912−53%
1 formula used for change rate: 1—mean2020/mean2004; * based on respondents aged 20–24; ** significant.
Table 2. Prevalence of daily smoking in different subgroups of adolescents and young adults between 2004 and 2020.
Subgroup2004200820152020Change Rate 2004–2020 1Interaction Term (Eta Square)
Total48.2%28.0%20.1%13.3%−72.5%
Sex
 Male46.8%28.9%19.3%13.3%−71.6%0.000
 Female49.7%27.1%20.9%13.3%−73.2%
Educational level *
 Lower level of education64.5%38.0%37.0%29.6%−54.1%0.001
 Higher level of education39.6%21.6%15.5%10.6%−73.2%
Employment status *
 Working57.1%32.9%26.5%18.9%−67.0%0.005 **
 In education31.4%14.1%17.7%7.4%−76.3%
Place of residence
 Rural50.8%27.8%21.5%11.7%−77.1%0.001
 Urban46.3%28.2%19.2%13.8%−70.3%
1 formula used for change rate: 1 − mean2020/mean2004; * based on respondents aged 20–24; ** significant.
Table 3. Model summaries.
Independent VariableModelRR2Change in R2 Change in FSig. Change in F
Alcohol per capita consumptionModel 10.1510.0210.02317.9890.000
Model 20.2390.0540.03421.1530.000
−2 Log-LikelihoodCox & Snell R2Nagelkerkes R2
Daily smokingModel 12653.50.0640.091
Model 22528.00.1130.161
Table 4. Regression parameters for predictors of per capita consumption (young adults between 2004 and 2020).
ModelPredictorsBStand. ErrorBetaTsig.
Model 1Constant34.141.84 18.520.00
Survey year 2008−9.842.30−0.12−4.270.00
Survey year 2015−8.672.70−0.08−3.220.00
Survey year 2020−18.842.57−0.19−7.330.00
Model 2Constant61.834.90 12.610.00
Survey year 2008−10.342.29−0.12−4.520.00
Survey year 2015−8.172.66−0.08−3.080.00
Survey year 2020−17.552.56−0.18−6.870.00
Sex−14.861.69−0.18−8.810.00
Educational level−1.131.92−0.01−0.590.56
Employment status1.451.990.020.730.46
Place of residence−3.801.75−0.05−2.170.03
Table 5. Regression parameters for predictors of daily smoking (young adults between 2004 and 2020).
ModelPredictorsBStand. ErrorWalddfsig.exp(B)
Model 1Constant3.710.26211.610.0040.84
Survey year 2008−0.770.1244.610.000.46
Survey year 2015−1.140.1462.210.000.32
Survey year 2020−1.710.15125.710.000.18
Model 2Constant4.530.29238.810.0092.54
Survey year 2008−0.990.1264.710.000.37
Survey year 2015−1.150.1559.110.000.32
Survey year 2020−1.650.16109.510.000.19
Sex0.080.100.710.391.09
Educational level−0.790.1154.010.000.45
Employment status−0.640.1325.210.000.53
Place of residence0.040.100.210.681.04
Publisher’s Note: MDPI stays neutral with regard to jurisdictional claims in published maps and institutional affiliations.

