
Improving the Indoor Air Quality in Nursery Buildings in United Arab Emirates


Abstract
1. Introduction
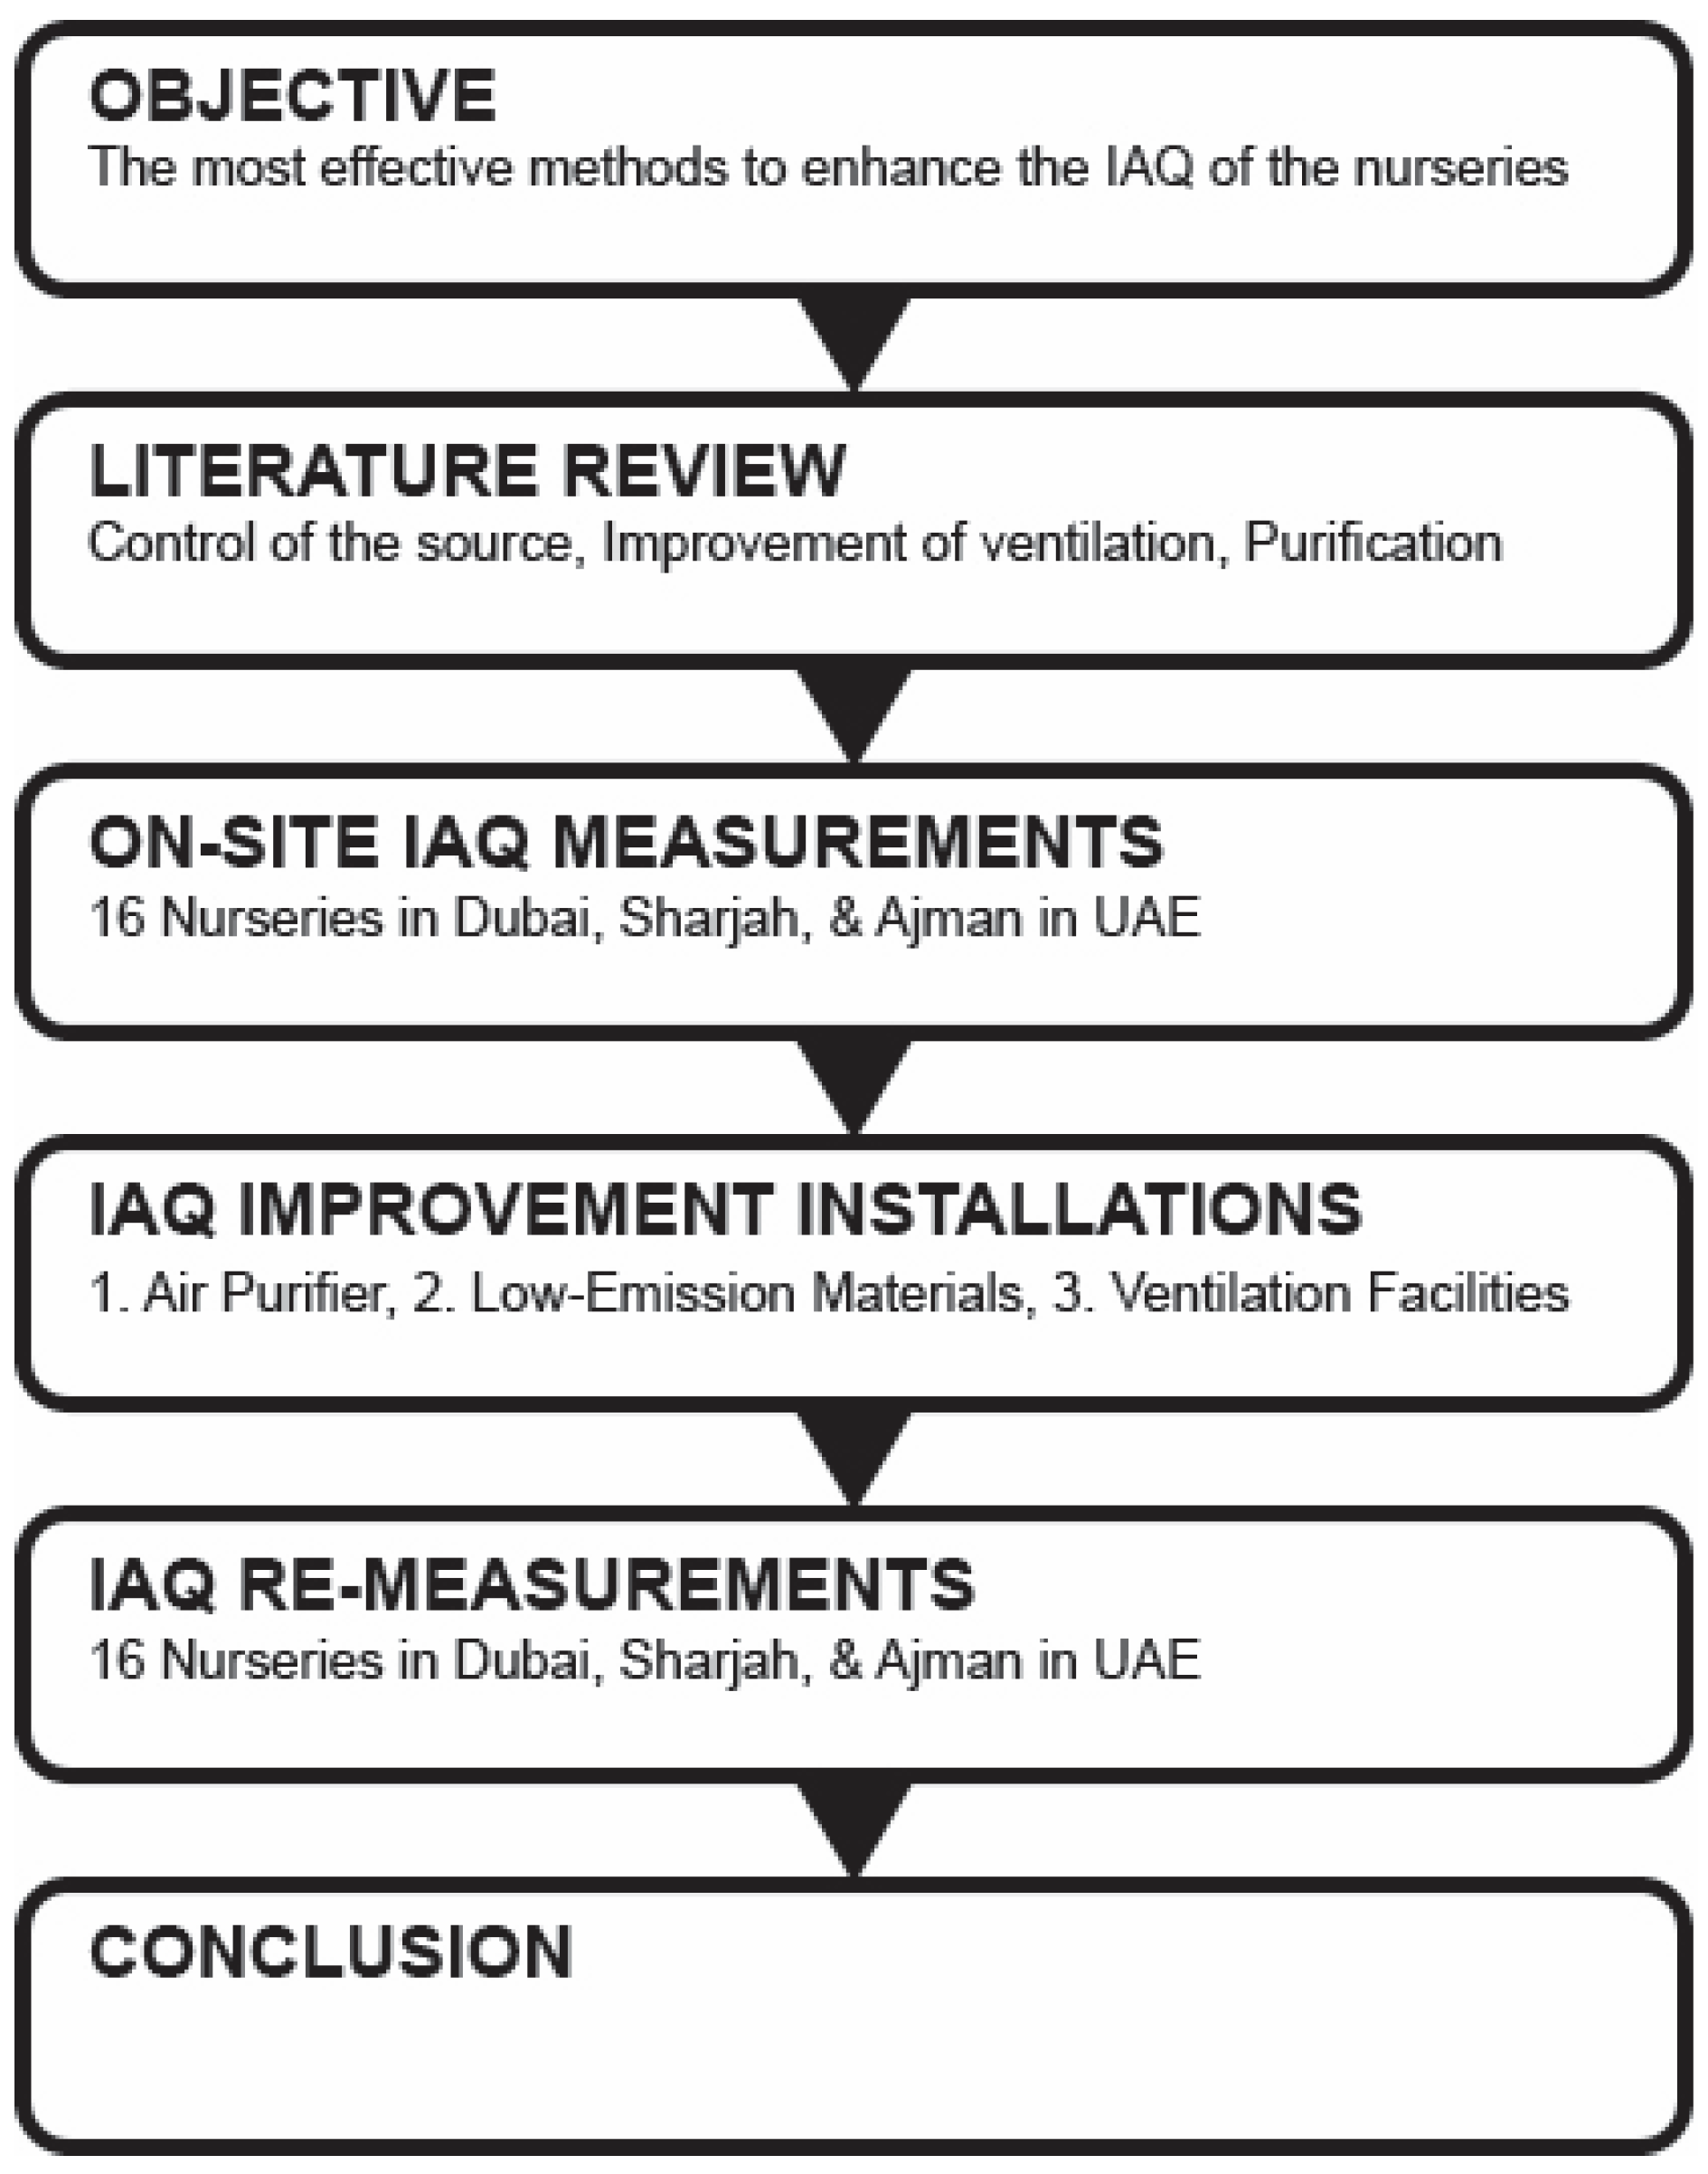
2. Materials and Methods
3. Results
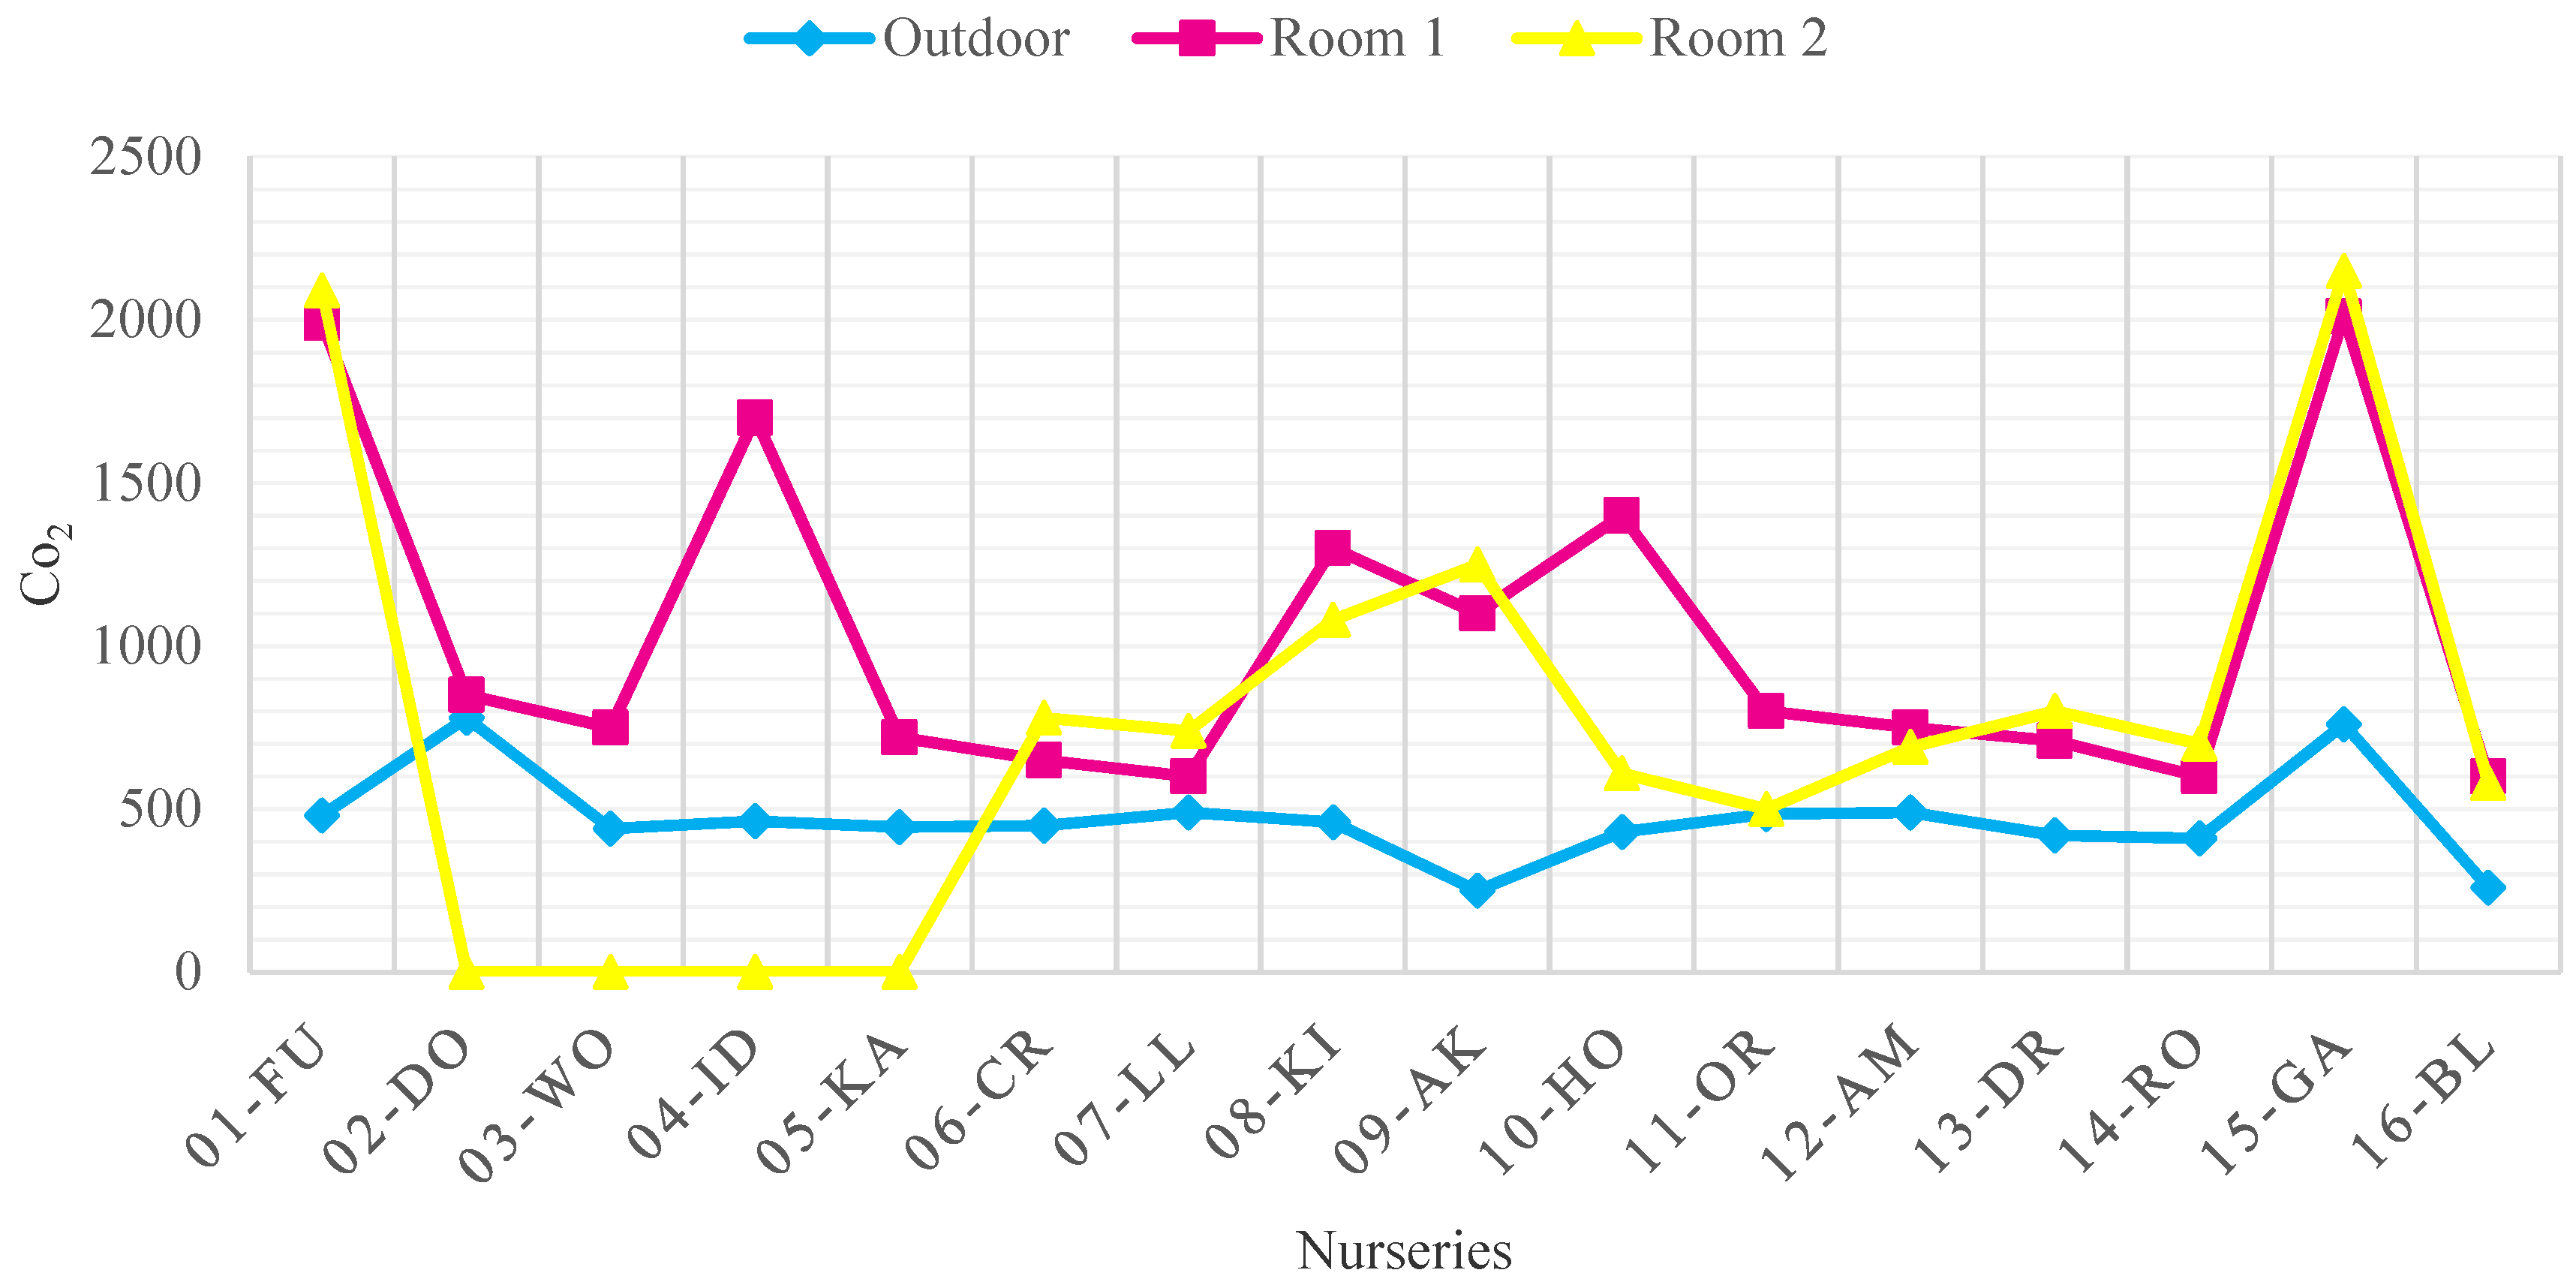
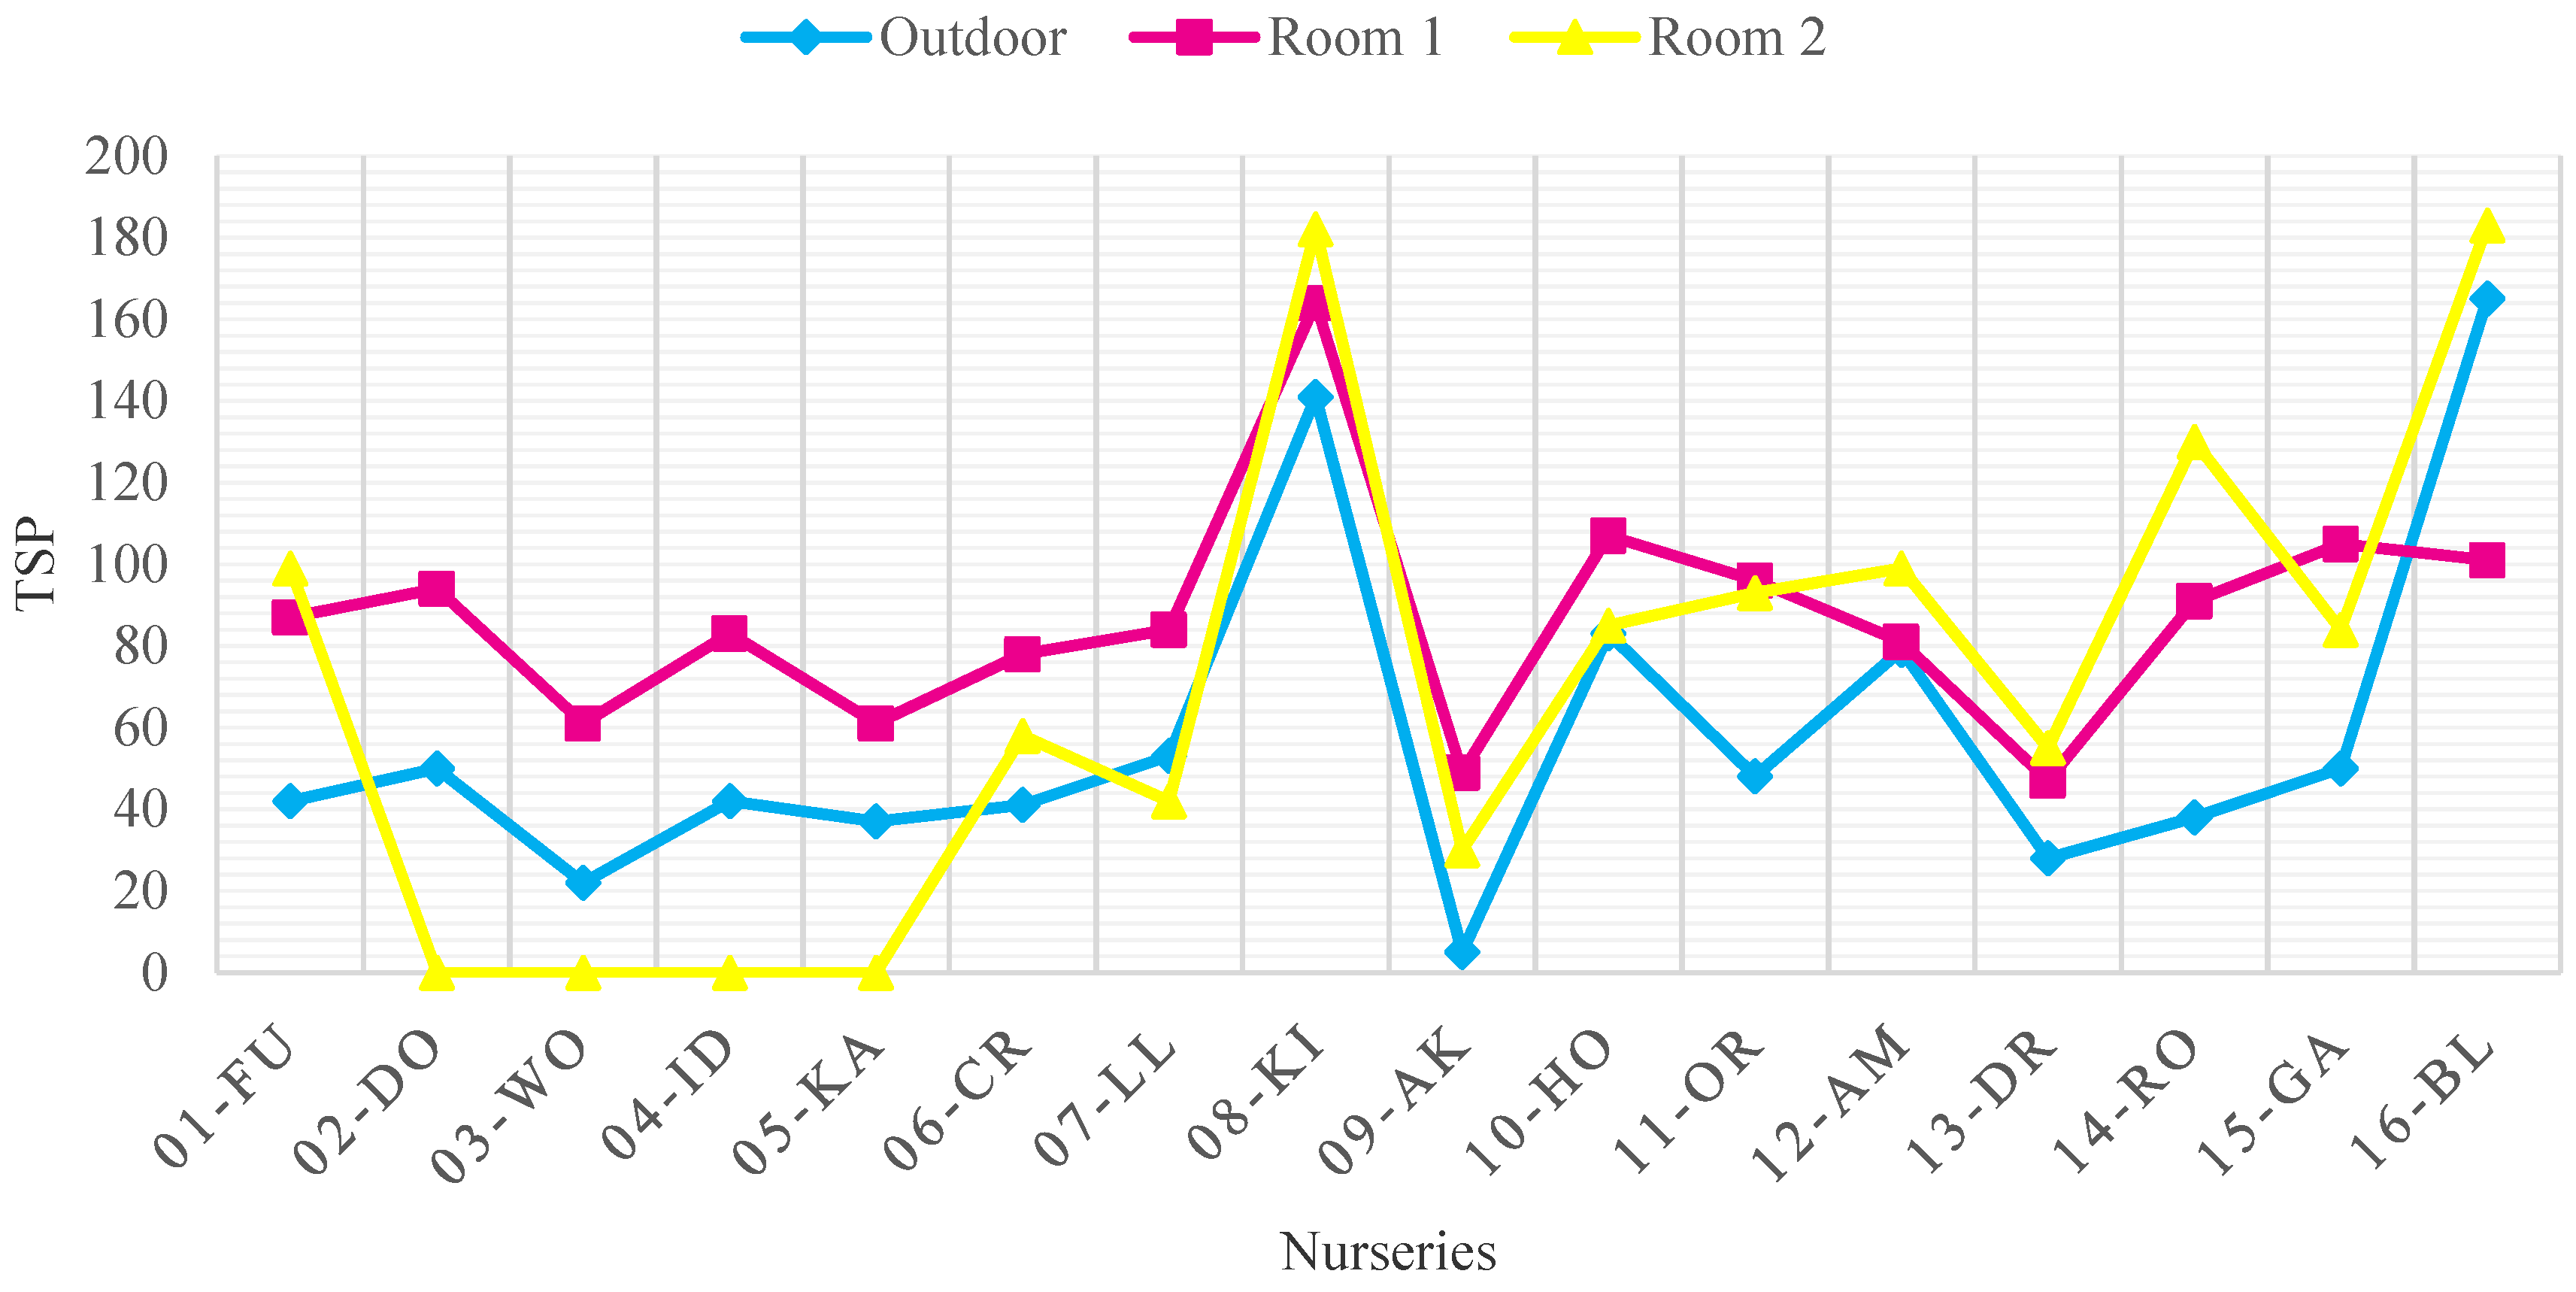
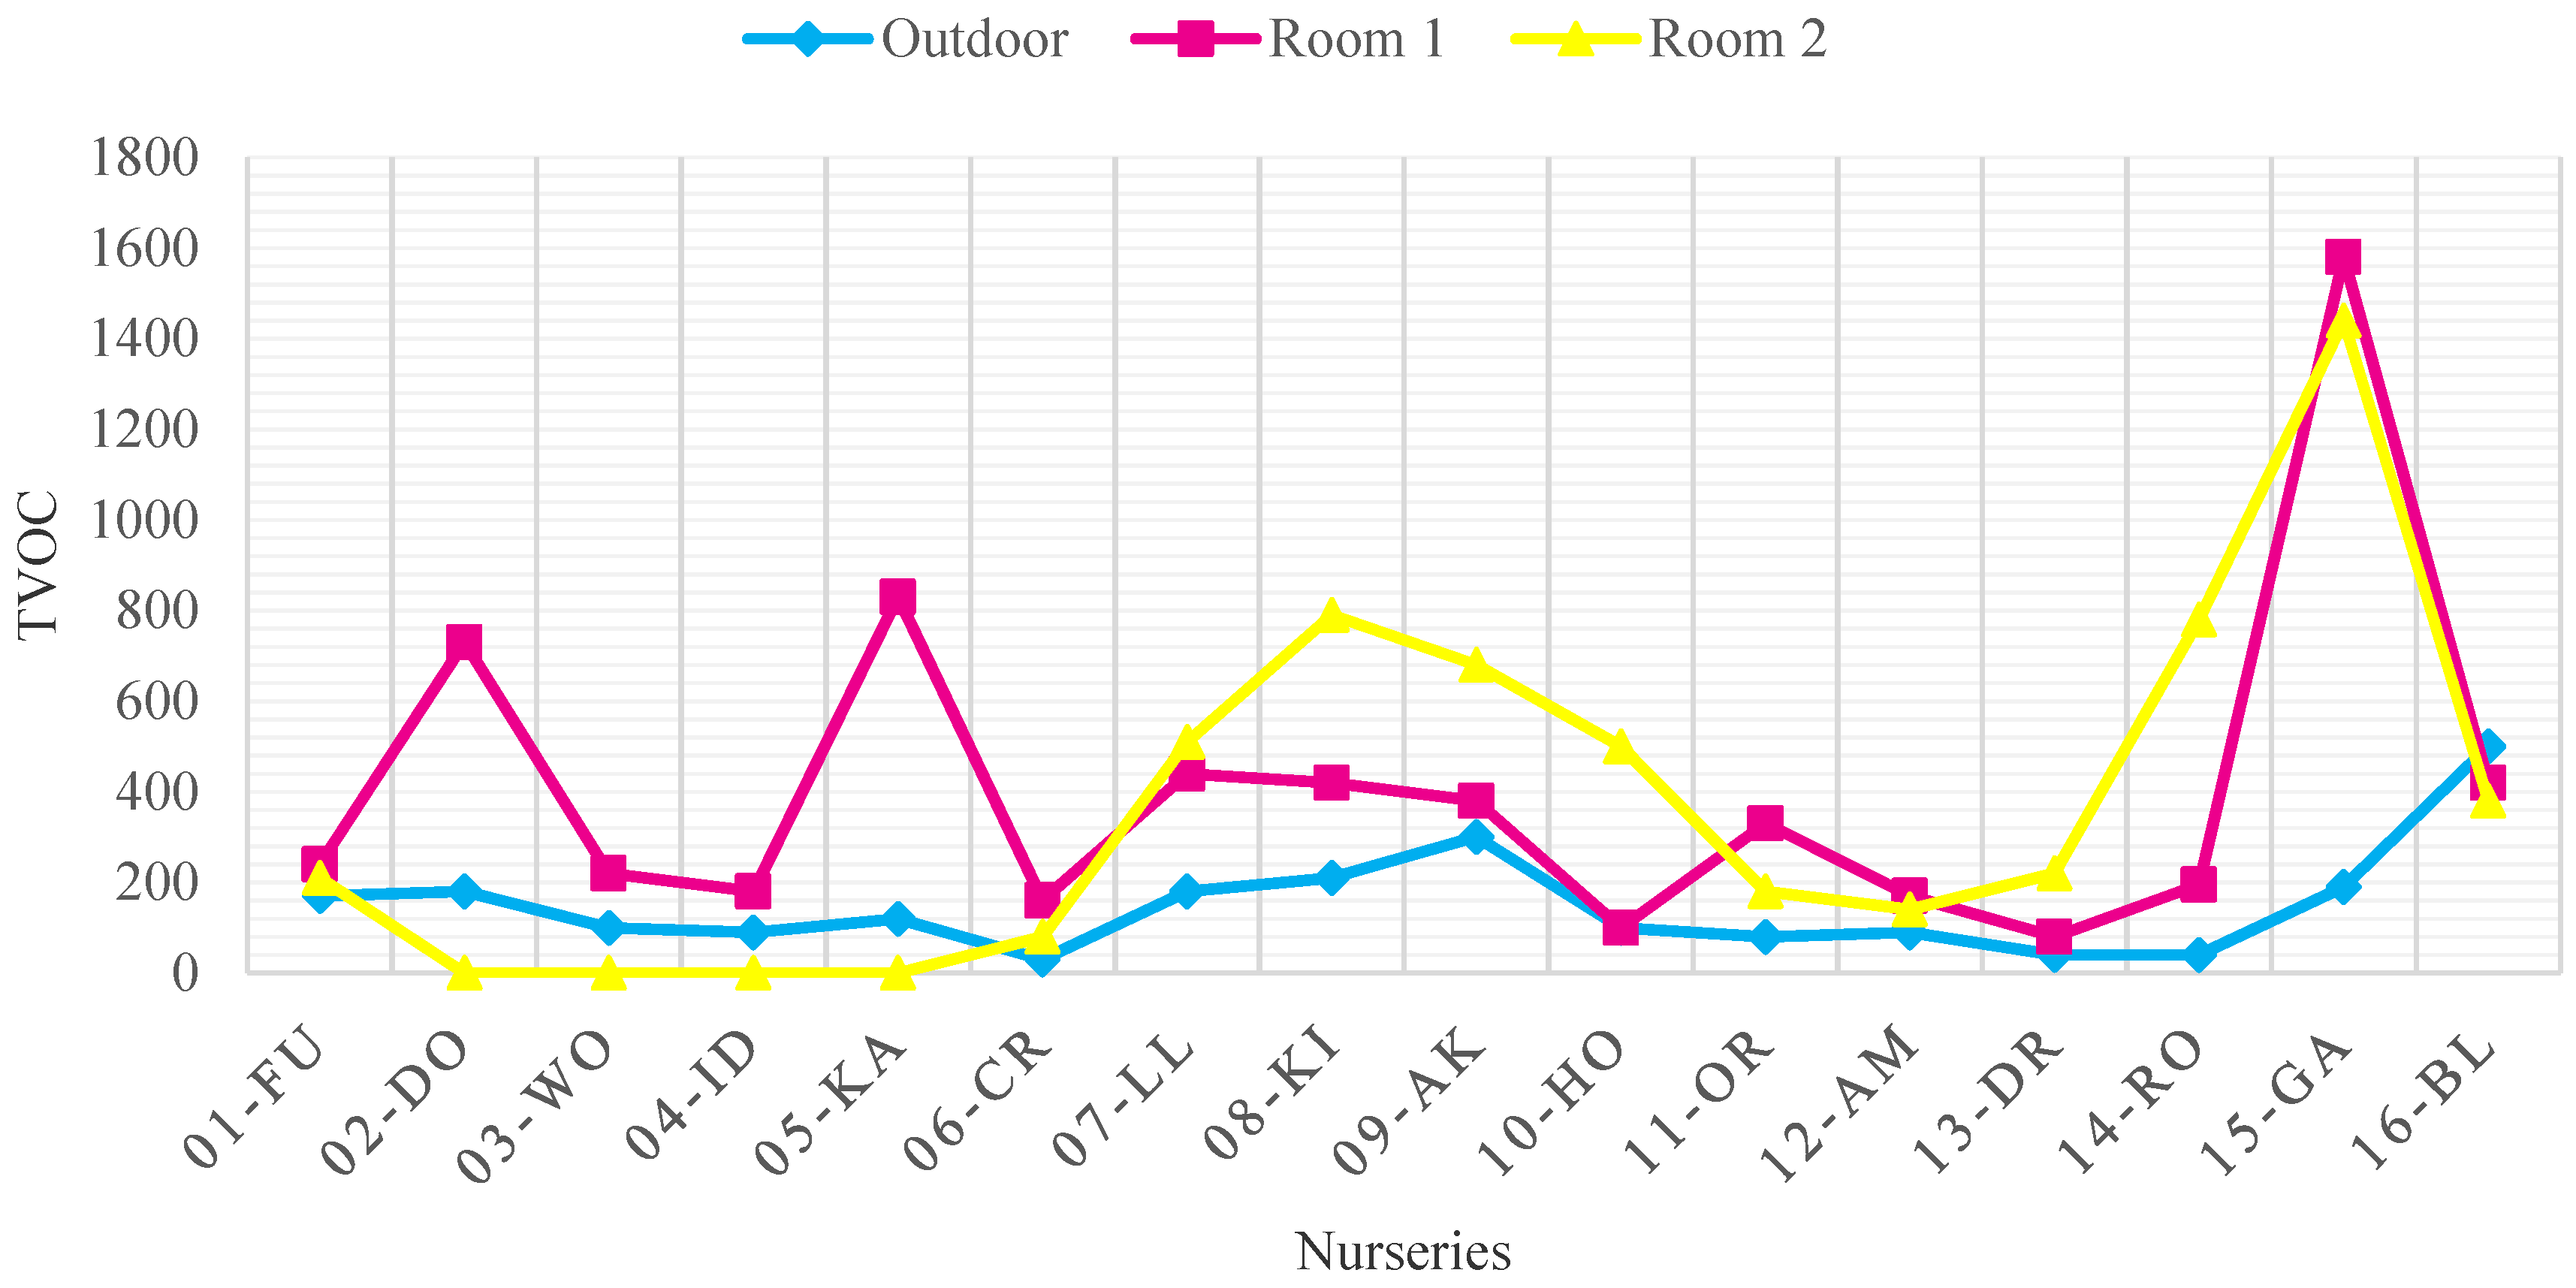
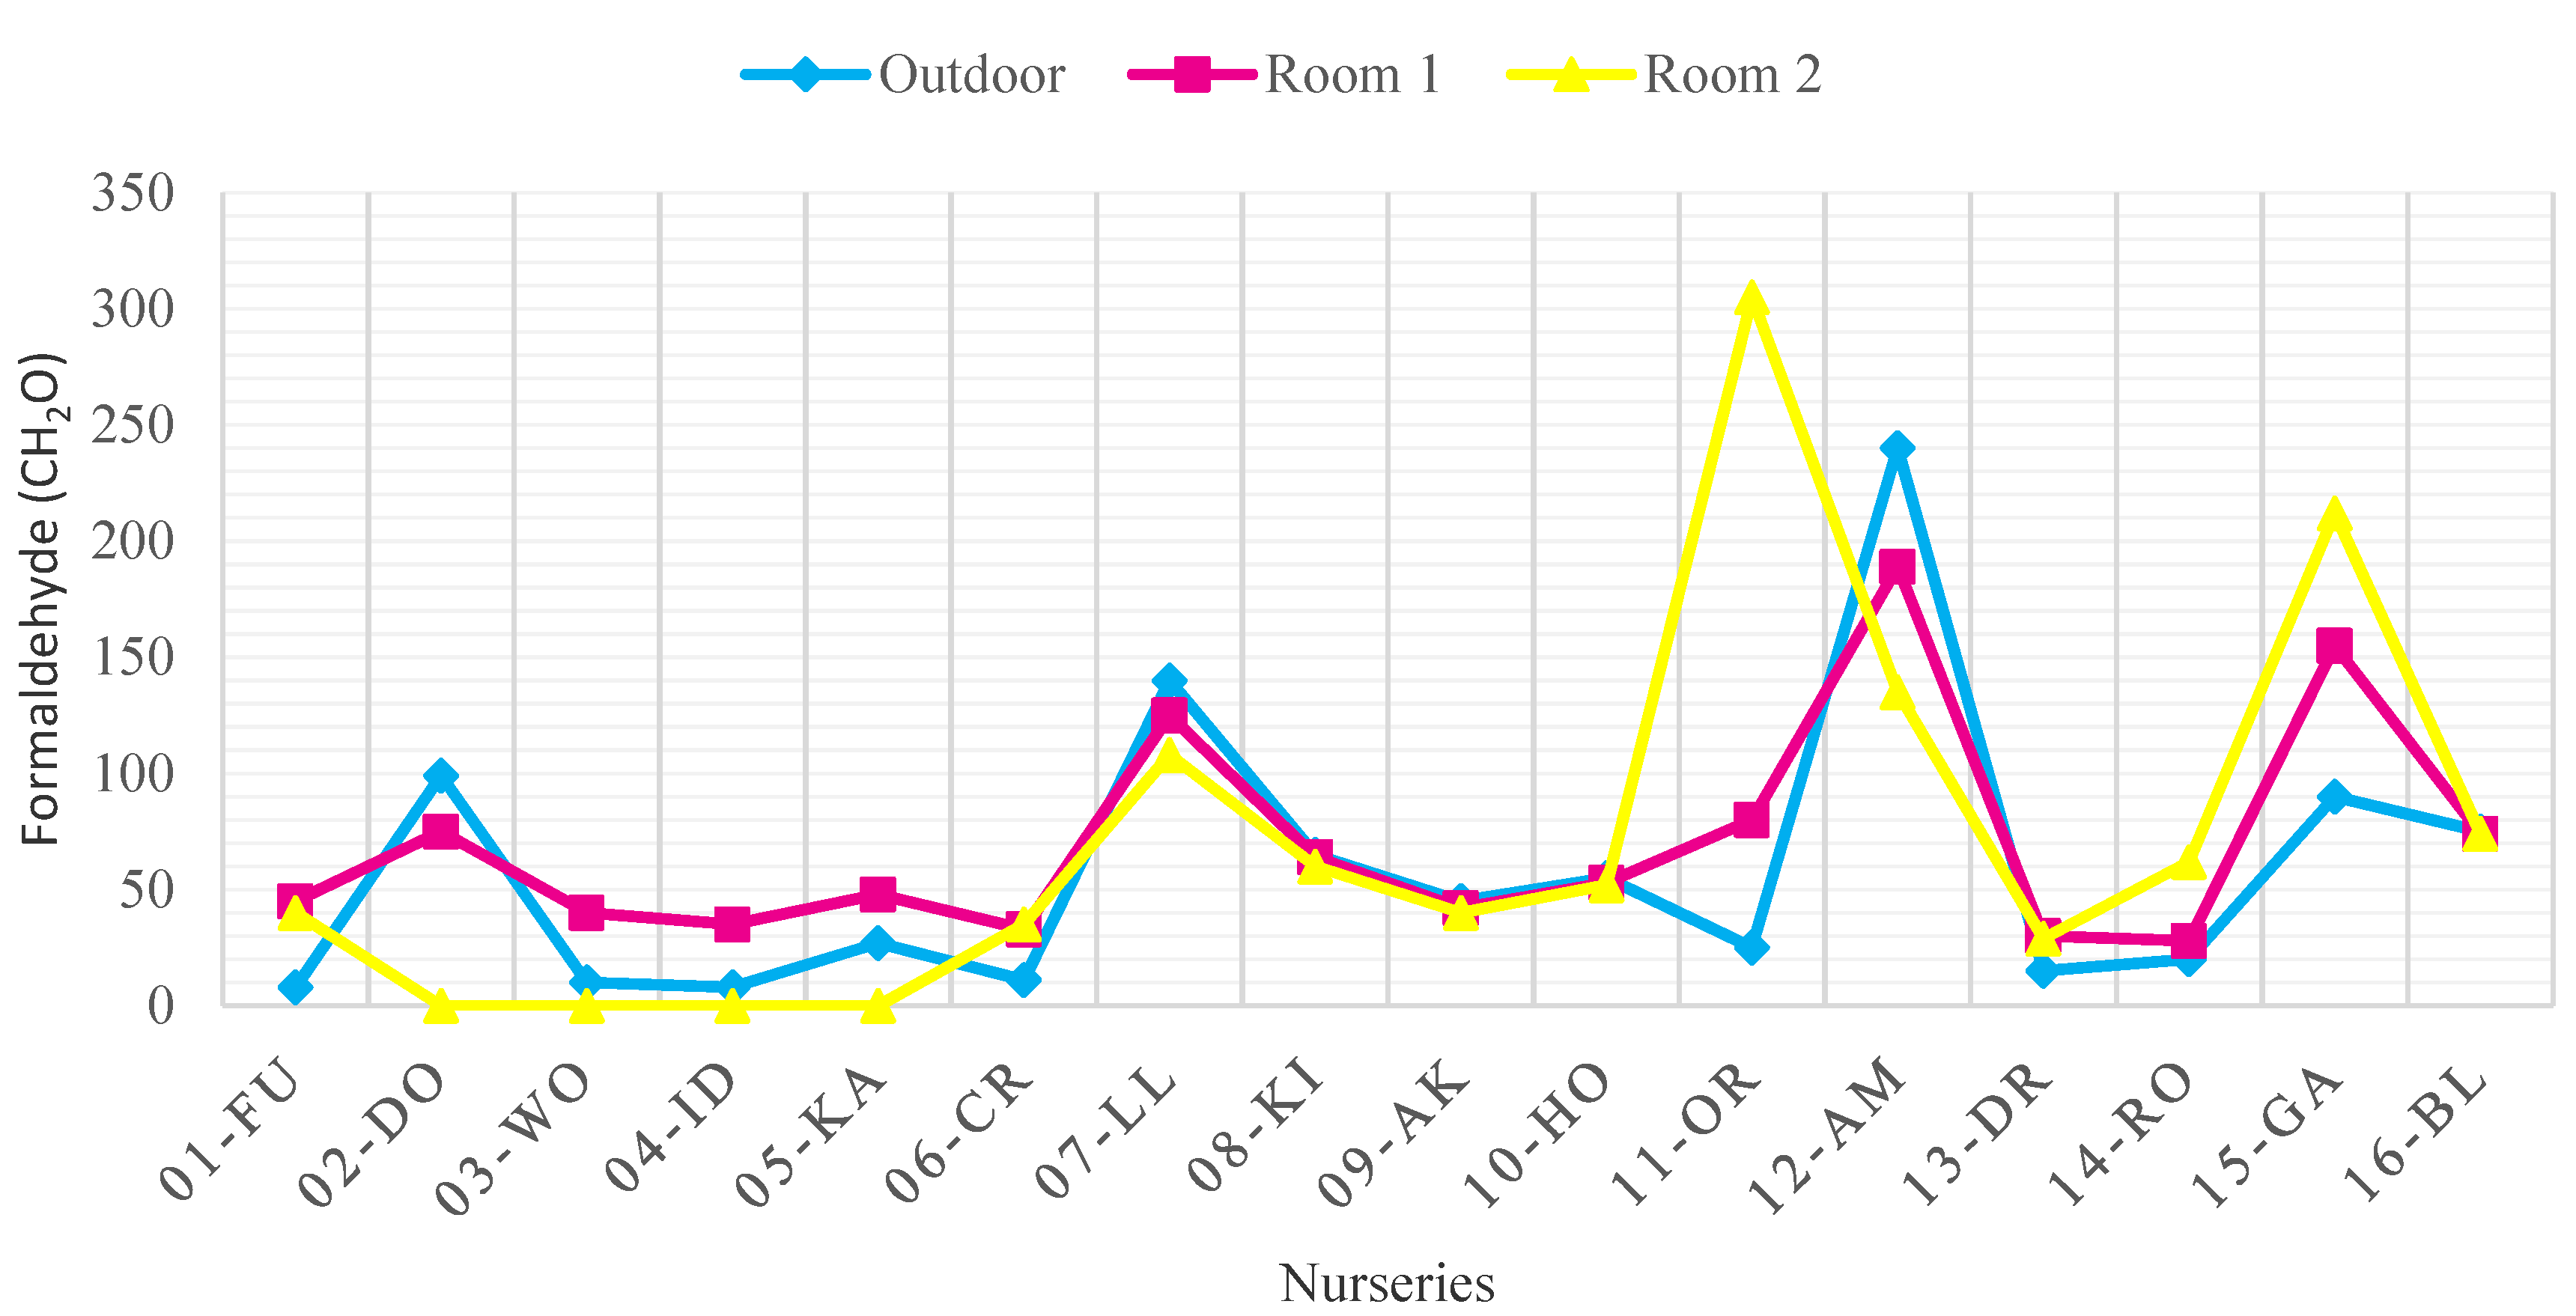
3.1. Indoor Air Quality Measurement Results by Pollutants before Improvement
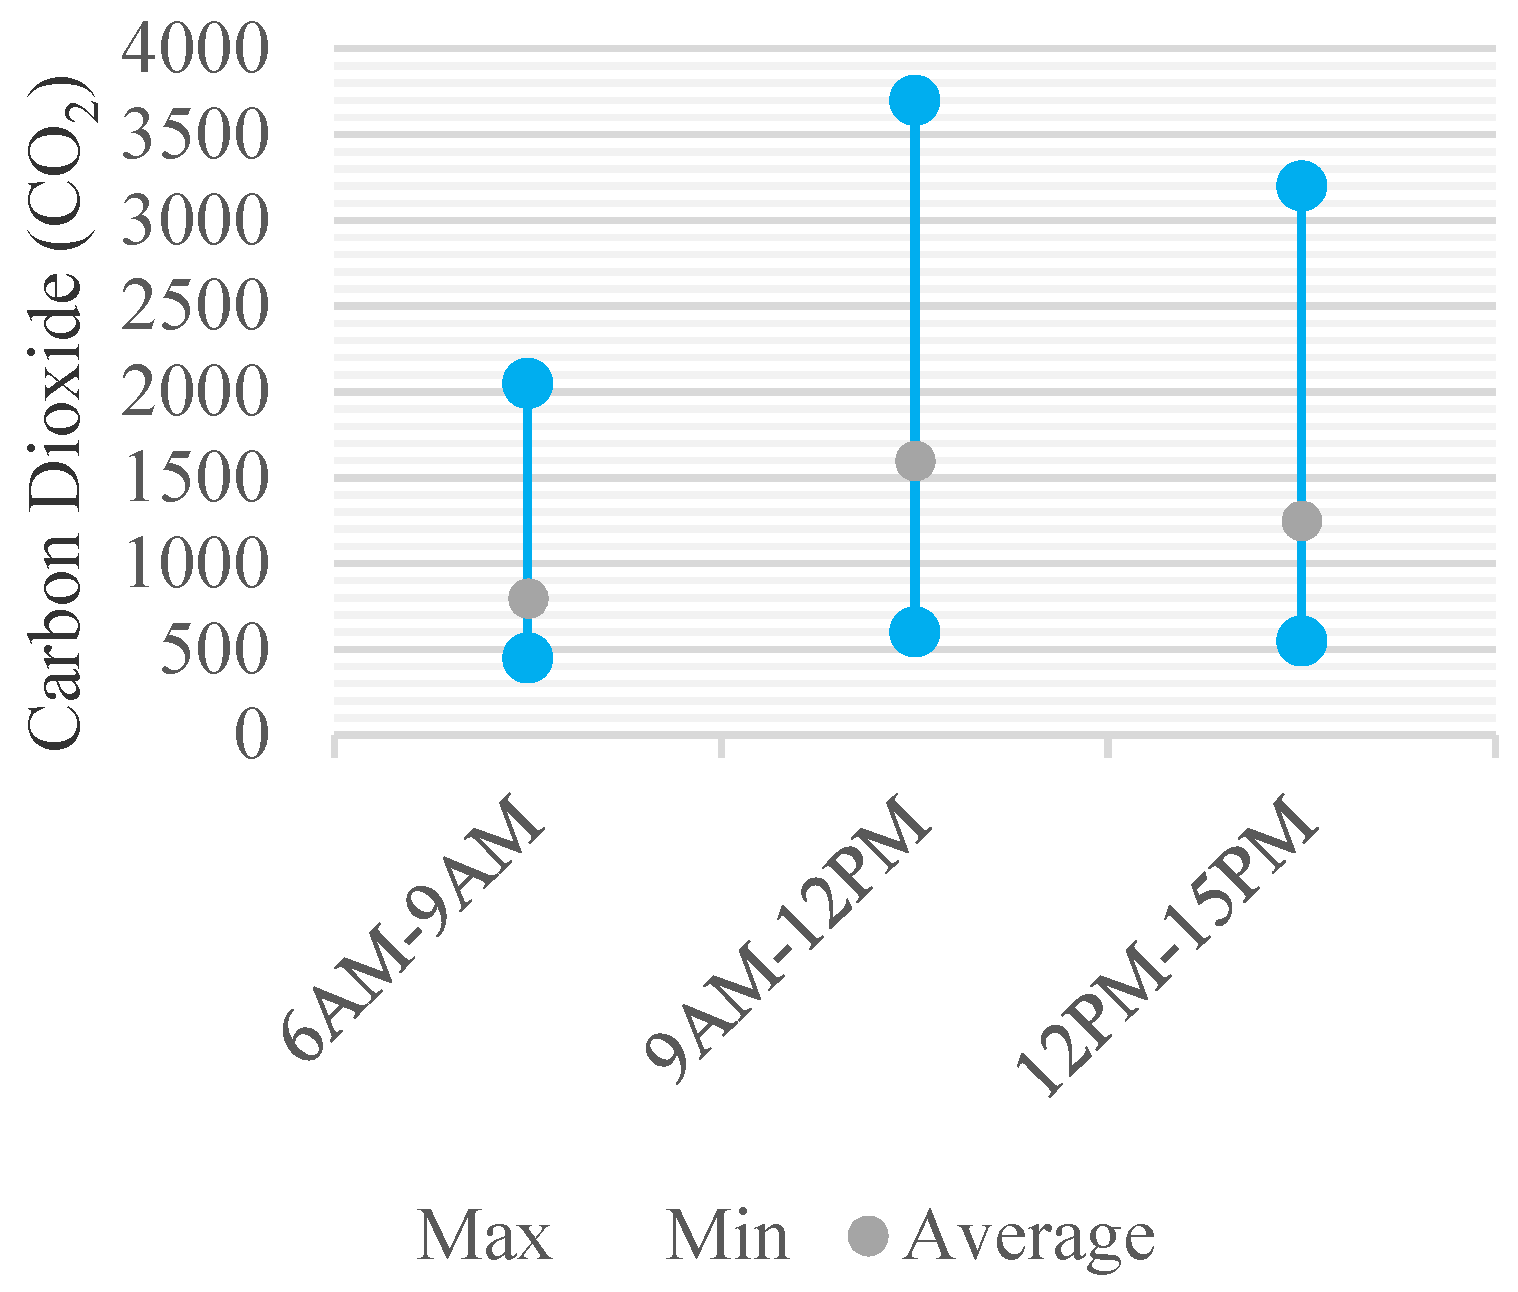
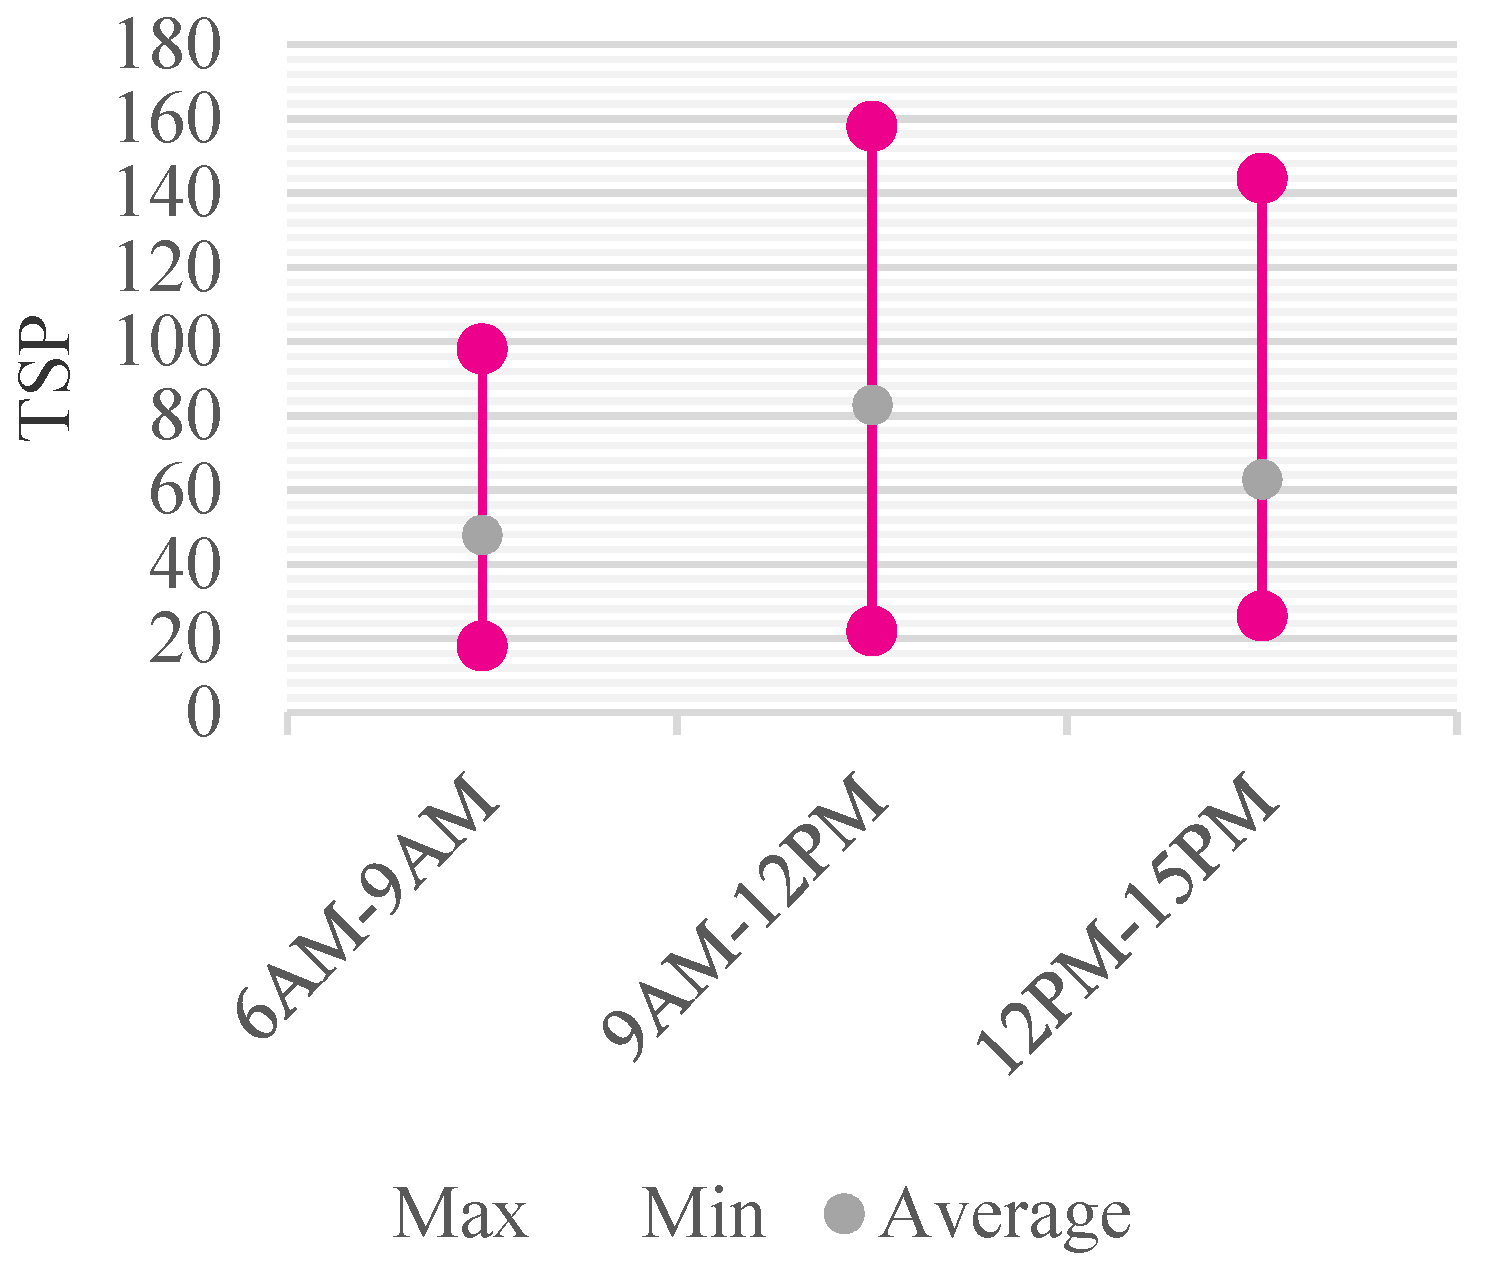
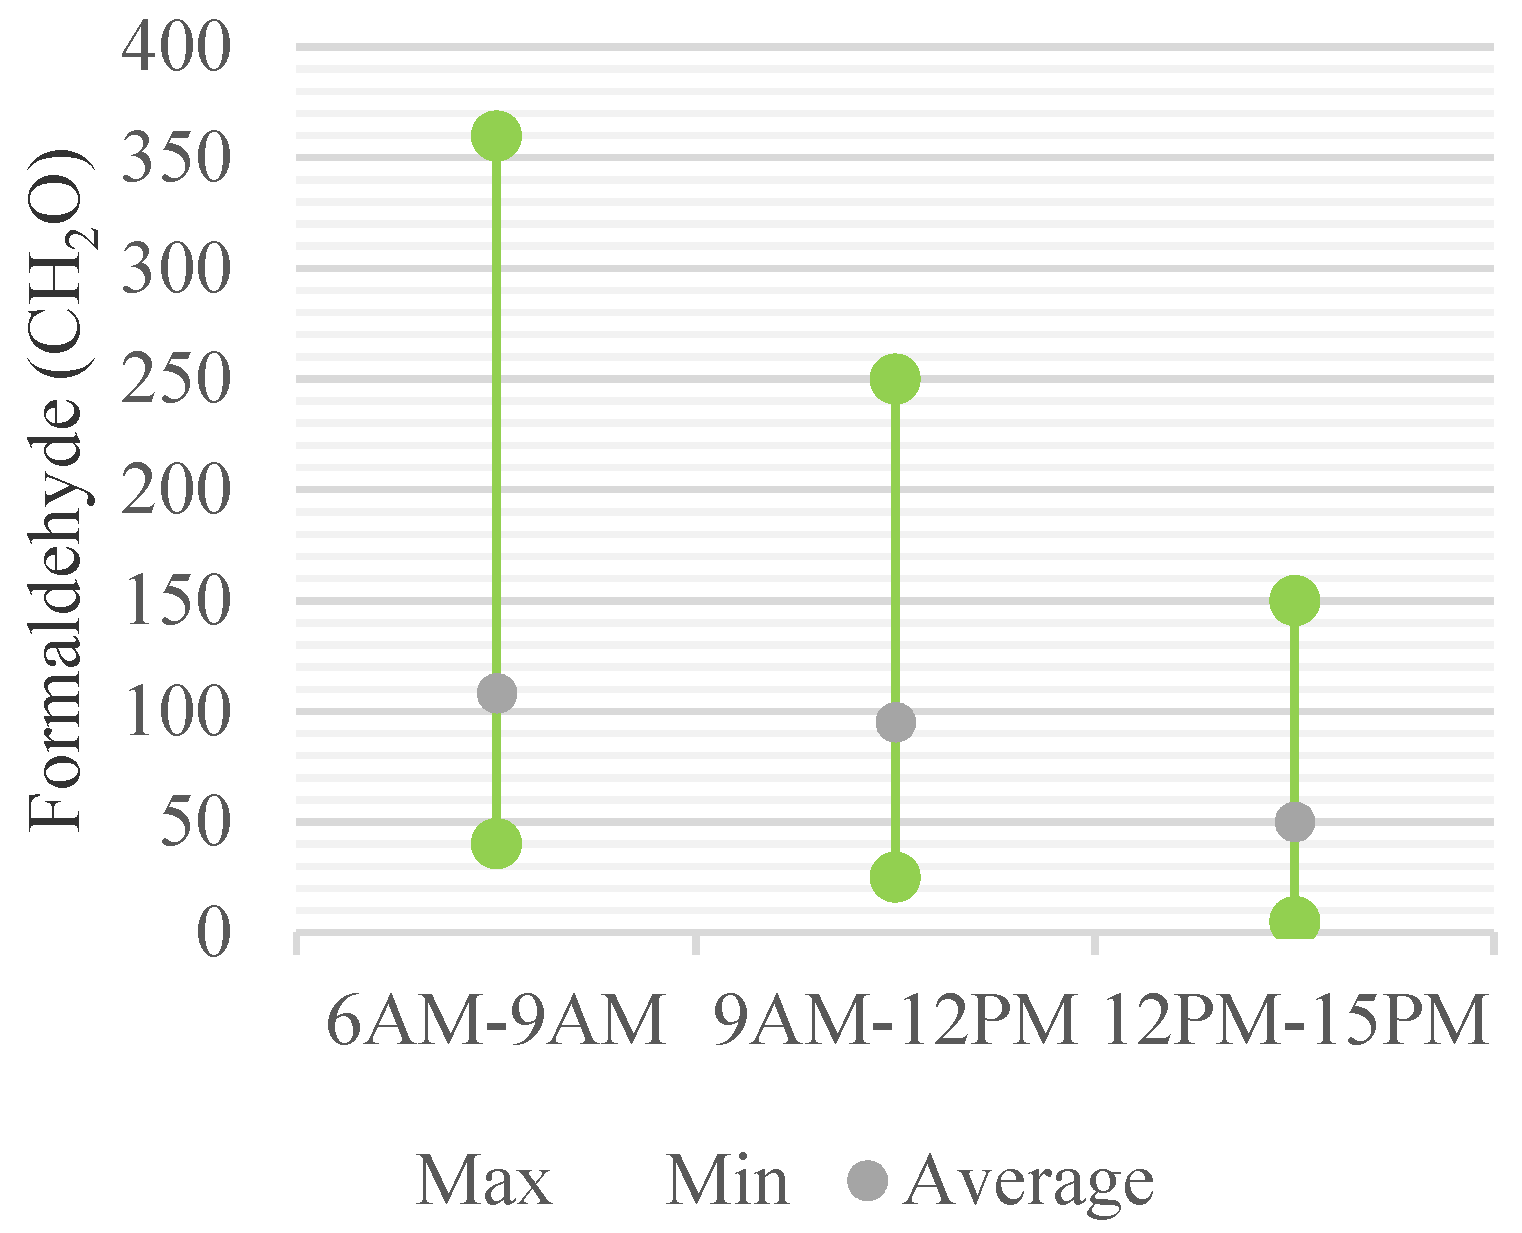
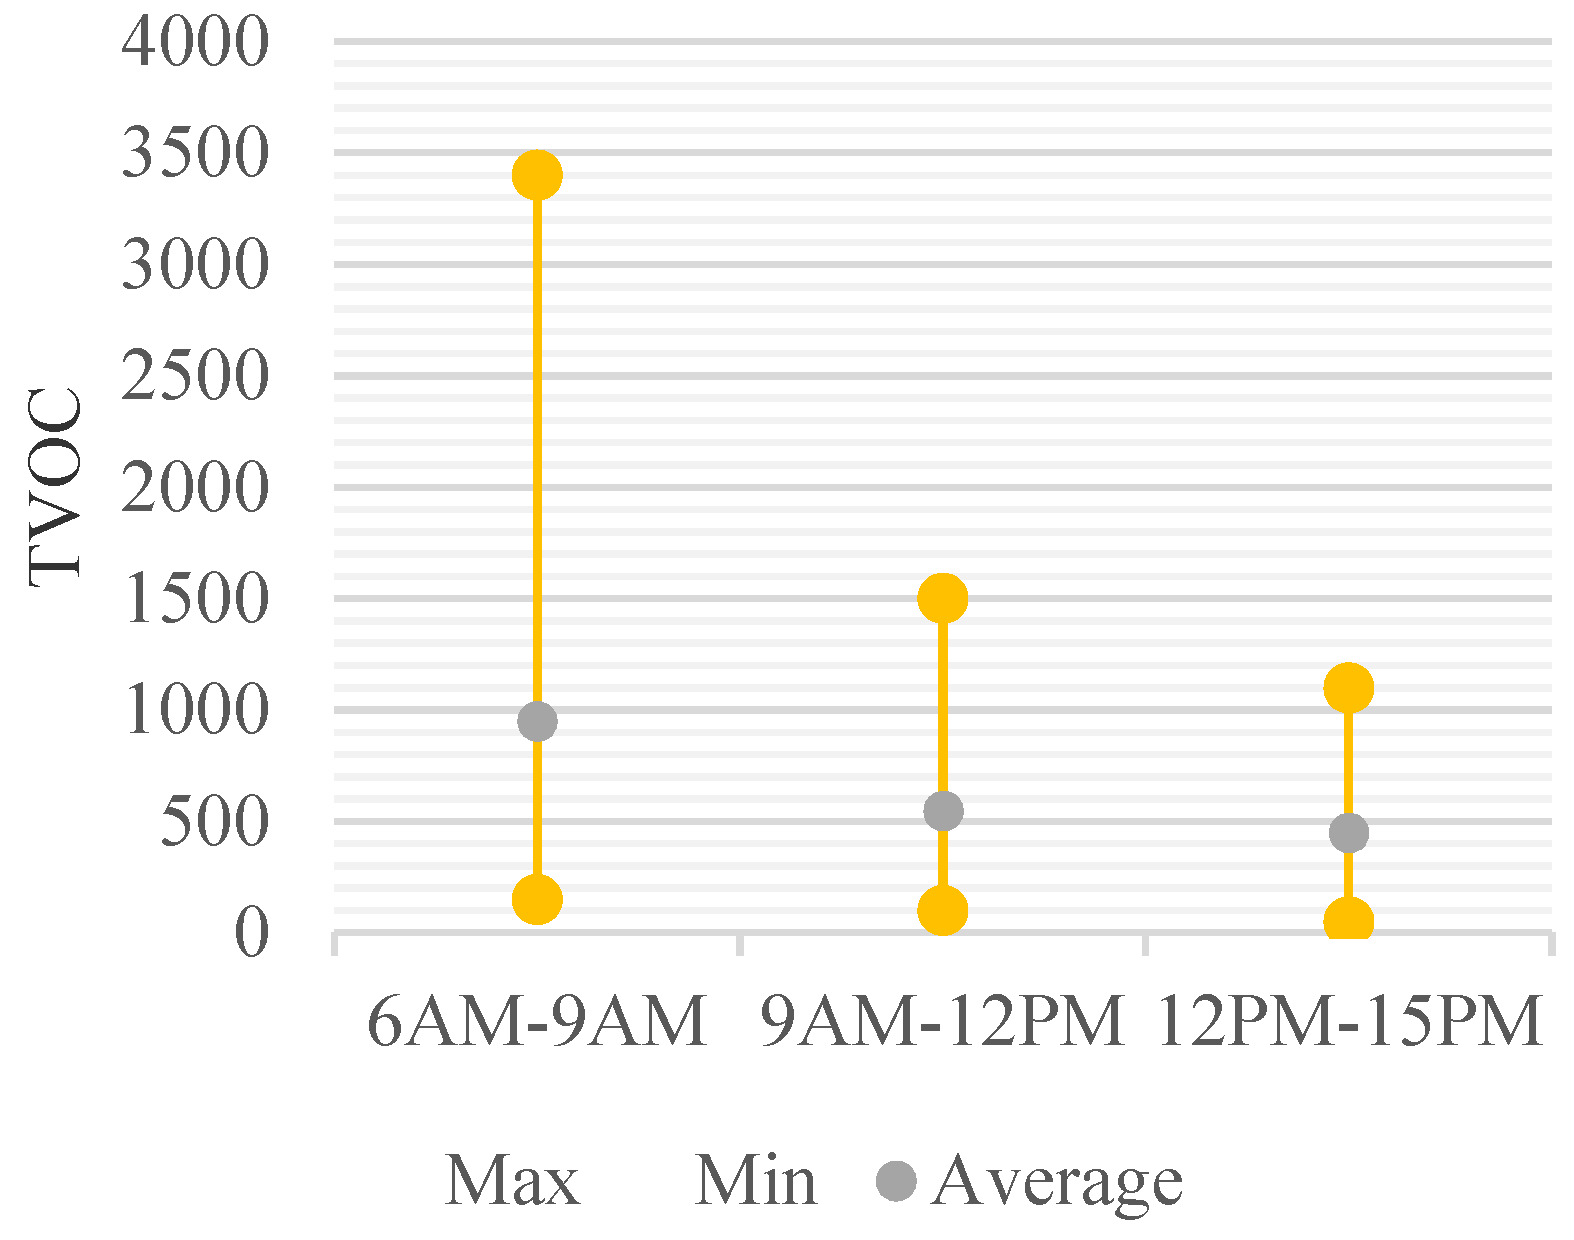
3.2. Changes in Indoor Air Pollutants Concentration over Time
3.3. Improvements for Each Nurseries
3.4. Comparison of IAQ According to Improvement Methods
- ma: Measurement Results after Improvement
- mb: Measurement Results before Improvement
3.4.1. Nurseries with the Installation of Air Purifier
3.4.2. Nurseries with Building Material Change
3.4.3. Nurseries with New Ventilation Installation
4. Discussion
5. Conclusions
Author Contributions
Funding
Institutional Review Board Statement
Informed Consent Statement
Data Availability Statement
Acknowledgments
Conflicts of Interest
References
- Steinemann, A.; Wargocki, P.; Rismanchi, B. Ten questions concerning green buildings and indoor air quality. Build. Environ. 2017, 112, 351–358. [Google Scholar] [CrossRef]
- Wei, W.; Ramalho, O.; Mandin, C. Indoor air quality requirements in green building certifications. Build. Environ. 2015, 92, 10–19. [Google Scholar] [CrossRef]
- Yu, C.W.; Kim, J.T. Building environmental assessment schemes for rating of IAQ in sustainable buildings. Indoor Built Environ. 2011, 20, 5–15. [Google Scholar] [CrossRef]
- Branco, P.T.; Alvim-Ferraz, M.C.M.; Martins, F.G.; Sousa, S.I. Quantifying indoor air quality determinants in urban and rural nursery and primary schools. Environ. Res. 2019, 176, 108534. [Google Scholar] [CrossRef] [PubMed]
- Canha, N.; Mandin, C.; Ramalho, O.; Wyart, G.; Ribéron, J.; Dassonville, C.; Hänninen, O.; Almeida, S.M.; Derbez, M. Assessment of ventilation and indoor air pollutants in nursery and elementary schools in France. Indoor Air 2016, 26, 350–365. [Google Scholar] [CrossRef]
- Mainka, A.; Brągoszewska, E.; Kozielska, B.; Pastuszka, J.S.; Zajusz-Zubek, E. Indoor air quality in urban nursery schools in Gliwice, Poland: Analysis of the case study. Atmos. Pollut. Res. 2015, 6, 1098–1104. [Google Scholar] [CrossRef]
- Zhang, S.; Mumovic, D.; Stamp, S.; Curran, K.; Cooper, E. What do we know about indoor air quality of nurseries? A review of the literature. Build. Serv. Eng. Res. Technol. 2021, 42, 603–632. [Google Scholar] [CrossRef]
- Wei, W.; Boumier, J.; Wyart, G.; Ramalho, O.; Mandin, C. Cleaning practices and cleaning products in nurseries and schools: To what extent can they impact indoor air quality? Indoor Air 2015, 26, 517–525. [Google Scholar] [CrossRef]
- Basińska, M.; Michałkiewicz, M.; Ratajczak, K. Impact of physical and microbiological parameters on proper indoor air quality in nursery. Environ. Int. 2019, 132, 105098. [Google Scholar] [CrossRef]
- Hwang, S.H.; Seo, S.; Yoo, Y.; Kim, K.Y.; Choung, J.T.; Park, W.M. Indoor air quality of daycare centers in Seoul, Korea. Build. Environ. 2017, 124, 186–193. [Google Scholar] [CrossRef]
- Stamatelopoulou, A.; Pyrri, I.; Asimakopoulos, D.; Maggos, T. Indoor air quality and dustborne biocontaminants in bedrooms of toddlers in Athens, Greece. Build. Environ. 2020, 173, 106756. [Google Scholar] [CrossRef]
- Oh, H.-J.; Nam, I.-S.; Yun, H.; Kim, J.; Yang, J.; Sohn, J.-R. Characterization of indoor air quality and efficiency of air purifier in childcare centers, Korea. Build. Environ. 2014, 82, 203–214. [Google Scholar] [CrossRef]
- Van Tran, V.; Park, D.; Lee, Y.-C. Indoor Air Pollution, Related Human Diseases, and Recent Trends in the Control and Improvement of Indoor Air Quality. Int. J. Environ. Res. Public Health 2020, 17, 2927. [Google Scholar] [CrossRef]
- Carreiro-Martins, P.; Papoila, A.L.; Caires, I.; Azevedo, S.; Cano, M.M.; Virella, D.; Leiria-Pinto, P.; Teixeira, J.P.; Rosado-Pinto, J.; Annesi-Maesano, I.; et al. Effect of indoor air quality of day care centers in children with different predisposition for asthma. Pediatr. Allergy Immunol. 2016, 27, 299–306. [Google Scholar] [CrossRef]
- Cho, Y.M.; Ryu, S.H.; Choi, M.S.; Tinyami, E.T.; Seo, S.; Choung, J.T.; Choi, J.W. Asthma and allergic diseases in preschool children in Korea: Findings from the pilot study of the Korean Surveillance System for Childhood Asthma. J. Asthma 2014, 51, 373–379. [Google Scholar] [CrossRef]
- Carrer, P.; Wolkoff, P. Assessment of Indoor Air Quality Problems in Office-Like Environments: Role of Occupational Health Services. Int. J. Environ. Res. Public Health 2018, 15, 741. [Google Scholar] [CrossRef]
- Jung, C.; Awad, J. The Improvement of Indoor Air Quality in Residential Buildings in Dubai, UAE. Buildings 2021, 11, 250. [Google Scholar] [CrossRef]
- Khaleej Times. Dubai Municipality to Assess Quality of Indoor Air in Public Buildings. 2013. Available online: https://www.khaleejtimes.com/nation/general/dubai-municipality-to-assess-quality-of-indoor-air-in-public-buildings (accessed on 12 August 2021).
- Awad, J.; Jung, C. Evaluating the Indoor Air Quality after Renovation at the Greens in Dubai, United Arab Emirates. Buildings 2021, 11, 353. [Google Scholar] [CrossRef]
- DEWA. Green Building Regulations & Specifications. 2021. Available online: https://www.dewa.gov.ae/~/media/Files/Consultants%20and%20Contractors/Green%20Building/Greenbuilding_Eng.ashx (accessed on 16 July 2021).
- Gulf News. Let’s Not Forget Indoor Air Quality as Well. 2020. Available online: https://gulfnews.com/business/analysis/lets-not-forget-indoor-air-quality-as-well-1.1589873286956#:~:text=The%20Dubai%20Municipality%20standard%20for,of%20continuous%20monitoring%20pre-occupancy (accessed on 18 July 2021).
- Mfarrej, M.F.B.; Qafisheh, N.A.; Bahloul, M.M. Investigation of Indoor Air Quality inside Houses from UAE. Air Soil Water Res. 2020, 13, 1–10. [Google Scholar] [CrossRef]
- Fadeyi, M.O.; Taha, R. Provision of Environmentally Responsible Interior Design Solutions: Case Study of an Office Building. J. Arch. Eng. 2013, 19, 58–70. [Google Scholar] [CrossRef]
- Menteşe, S.; Mirici, N.A.; Elbir, T.; Palaz, E.; Mumcuoğlu, D.T.; Çotuker, O.; Bakar, C.; Oymak, S.; Otkun, M.T. A long-term multi-parametric monitoring study: Indoor air quality (IAQ) and the sources of the pollutants, prevalence of sick building syndrome (SBS) symptoms, and respiratory health indicators. Atmos. Pollut. Res. 2020, 11, 2270–2281. [Google Scholar] [CrossRef]
- Fadeyi, M.O.; Alkhaja, K.; Bin Sulayem, M.; Abu-Hijleh, B. Evaluation of indoor environmental quality conditions in elementary schools’ classrooms in the United Arab Emirates. Front. Arch. Res. 2014, 3, 166–177. [Google Scholar] [CrossRef]
- Kelly, F.J.; Fussell, J.C. Improving indoor air quality, health and performance within environments where people live, travel, learn and work. Atmos. Environ. 2018, 200, 90–109. [Google Scholar] [CrossRef]
- Ruan, T.; Rim, D. Indoor air pollution in office buildings in mega-cities: Effects of filtration efficiency and outdoor air ventilation rates. Sustain. Cities Soc. 2019, 49, 101609. [Google Scholar] [CrossRef]
- Kolarik, B.; Wargocki, P.; Skorek-Osikowska, A.; Wisthaler, A. The effect of a photocatalytic air purifier on indoor air quality quantified using different measuring methods. Build. Environ. 2010, 45, 1434–1440. [Google Scholar] [CrossRef]
- Megahed, N.A.; Ghoneim, E.M. Indoor Air Quality: Rethinking rules of building design strategies in post-pandemic architecture. Environ. Res. 2020, 193, 110471. [Google Scholar] [CrossRef]
- Ciuzas, D.; Prasauskas, T.; Krugly, E.; Jurelionis, A.; Seduikyte, L.; Martuzevicius, D. Indoor air quality management by combined ventilation and air cleaning: An experimental study. Aerosol Air Qual. Res. 2016, 16, 2550–2559. [Google Scholar] [CrossRef]
- Kim, C.; Choi, D.; Lee, Y.; Kim, K. Diagnosis of indoor air contaminants in a daycare center using a long-term monitoring. Build. Environ. 2021, 204, 108124. [Google Scholar] [CrossRef]
- Yang, J.; Seo, J.H.; Jeong, N.N.; Sohn, J.R. Effects of Legal Regulation on Indoor Air Quality in Facilities for Sensitive Populations—A Field Study in Seoul, Korea. Environ. Manag. 2019, 64, 344–352. [Google Scholar] [CrossRef]
- Oh, S.; Song, S. Detailed Analysis of Thermal Comfort and Indoor Air Quality Using Real-Time Multiple Environmental Monitoring Data for a Childcare Center. Energies 2021, 14, 643. [Google Scholar] [CrossRef]
- Anand, P.; Sekhar, C.; Cheong, D.; Santamouris, M.; Kondepudi, S. Occupancy-based zone-level VAV system control implications on thermal comfort, ventilation, indoor air quality and building energy efficiency. Energy Build. 2019, 204, 109473. [Google Scholar] [CrossRef]
- Buliński, A.; Popiolek, Z.; Buliński, Z. Experimentally validated CFD analysis on sampling region determination of average indoor carbon dioxide concentration in occupied space. Build. Environ. 2014, 72, 319–331. [Google Scholar] [CrossRef]
- Tian, X.; Zhang, S.; Awbi, H.B.; Liao, C.; Cheng, Y.; Lin, Z. Multi-indicator evaluation on ventilation effectiveness of three ventilation methods: An experimental study. Build. Environ. 2020, 180, 107015. [Google Scholar] [CrossRef]
- Moreno-Rangel, A.; Sharpe, T.; McGill, G.; Musau, F. Indoor air quality in Passivhaus dwellings: A literature review. Int. J. Environ. Res. Public Health 2020, 17, 4749. [Google Scholar] [CrossRef]
- Wong, L.-T.; Mui, K.-W.; Tsang, T.-W. Evaluation of Indoor Air Quality Screening Strategies: A Step-Wise Approach for IAQ Screening. Int. J. Environ. Res. Public Health 2016, 13, 1240. [Google Scholar] [CrossRef]
- Park, S.; Seo, J. Bake-Out Strategy Considering Energy Consumption for Improvement of Indoor Air Quality in Floor Heating Environments. Int. J. Environ. Res. Public Health 2018, 15, 2720. [Google Scholar] [CrossRef]
- Fesanghary, M.; Asadi, S.; Geem, Z.W. Design of low-emission and energy-efficient residential buildings using a multi-objective optimization algorithm. Build. Environ. 2012, 49, 245–250. [Google Scholar] [CrossRef]
- Korsavi, S.S.; Montazami, A.; Mumovic, D. Indoor air quality (IAQ) in naturally-ventilated primary schools in the UK: Occupant-related factors. Build. Environ. 2020, 180, 106992. [Google Scholar] [CrossRef]
- Heiselberg, P.; Perino, M. Short-term airing by natural ventilation—Implication on IAQ and thermal comfort. Indoor Air 2010, 20, 126–140. [Google Scholar] [CrossRef]
- Zhao, L.; Liu, J.; Ren, J. Impact of various ventilation modes on IAQ and energy consumption in Chinese dwellings: First long-term monitoring study in Tianjin, China. Build. Environ. 2018, 143, 99–106. [Google Scholar] [CrossRef]
- Hart, J.F.; Ward, T.J.; Spear, T.M.; Rossi, R.J.; Holland, N.N.; Loushin, B.G. Evaluating the Effectiveness of a Commercial Portable Air Purifier in Homes with Wood Burning Stoves: A Preliminary Study. J. Environ. Public Health 2011, 2011, 324809. [Google Scholar] [CrossRef][Green Version]
- Jung, C.; Awad, J. Improving the IAQ for Learning Efficiency with Indoor Plants in University Classrooms in Ajman, United Arab Emirates. Buildings 2021, 11, 289. [Google Scholar] [CrossRef]
- Lu, Y.; Liu, J.; Yoshino, H.; Lu, B.; Jiang, A.; Li, F. Use of Biotechnology Coupled with Bake-Out Exhaust to Remove Indoor VOCs. Indoor Built Environ. 2011, 21, 741–748. [Google Scholar] [CrossRef]
- Kang, D.H.; Choi, D.H.; Lee, S.M.; Yeo, M.S.; Kim, K.W. Effect of bake-out on reducing VOC emissions and concentrations in a residential housing unit with a radiant floor heating system. Build. Environ. 2010, 45, 1816–1825. [Google Scholar] [CrossRef]
- Lee, J.H.; Jeong, S.G.; Kim, S. Performance Evaluation of Infrared Bake-Out for Reducing VOCs and Formaldehyde Emission in MDF Panels. BioResources 2016, 11, 1214–1223. [Google Scholar] [CrossRef]
- Lu, Y.; Liu, J.; Wei, S.; Wang, H. Experimental and simulation study on bake-out with dilution ventilation technology for building materials. J. Air Waste Manag. Assoc. 2016, 66, 1098–1108. [Google Scholar]
- Wei, W.; Ramalho, O.; Malingre, L.; Sivanantham, S.; Little, J.C.; Mandin, C. Machine learning and statistical models for predicting indoor air quality. Indoor Air 2019, 29, 704–726. [Google Scholar] [CrossRef]
- D’Ambrosio Alfano, F.R.; Dell’Isola, M.; Ficco, G.; Palella, B.I.; Riccio, G. Experimental Air-Tightness Analysis in Mediterranean Buildings after Windows Retrofit. Sustainability 2016, 8, 991. [Google Scholar] [CrossRef]
- Shin, S.-H.; Jo, W.-K. Volatile organic compound concentrations in newly built apartment buildings during pre- and post-occupancy stages. Int. J. Environ. Anal. Chem. 2013, 94, 356–369. [Google Scholar] [CrossRef]
- Lim, S.; Lee, K.; Seo, S.; Jang, S. Impact of regulation on indoor volatile organic compounds in new unoccupied apartment in Korea. Atmos. Environ. 2011, 45, 1994–2000. [Google Scholar] [CrossRef]
- Villafruela, J.M.; Castro, F.; San José, J.F.; Saint-Martin, J. Comparison of air change efficiency, contaminant removal effectiveness and infection risk as IAQ indices in isolation rooms. Energy Build. 2013, 57, 210–219. [Google Scholar] [CrossRef]
- Johnson, D.L.; Lynch, R.A.; Floyd, E.L.; Wang, J.; Bartels, J.N. Indoor air quality in classrooms: Environmental measures and effective ventilation rate modeling in urban elementary schools. Build. Environ. 2018, 136, 185–197. [Google Scholar] [CrossRef]
- Chatzidiakou, L.; Mumovic, D.; Summerfield, A.J. What do we know about indoor air quality in school classrooms? A critical review of the literature. Intell. Build. Int. 2012, 4, 228–259. [Google Scholar] [CrossRef]
- Hormigos-Jimenez, S.; Padilla-Marcos, M.A.; Meiss, A.; Gonzalez-Lezcano, R.A.; Feijó-Muñoz, J. Experimental validation of the age-of-the-air CFD analysis: A case study. Sci. Technol. Built Environ. 2018, 24, 994–1003. [Google Scholar] [CrossRef]
- Hou, Y.; Liu, J.; Li, J. Investigation of Indoor Air Quality in Primary School Classrooms. Procedia Eng. 2015, 121, 830–837. [Google Scholar] [CrossRef]
- Brilli, F.; Fares, S.; Ghirardo, A.; de Visser, P.; Calatayud, V.; Muñoz, A.; Annesi-Maesano, I.; Sebastiani, F.; Alivernini, A.; Varriale, V. Plants for sustainable improvement of indoor air quality. Trends Plant Sci. 2018, 23, 507–512. [Google Scholar] [CrossRef]
- Pegas, P.N.; Alves, C.; Nunes, T.; Bate-Epey, E.F.; Evtyugina, M.; Pio, C. Could Houseplants Improve Indoor air Quality in Schools? J. Toxicol. Environ. Health Part A 2012, 75, 1371–1380. [Google Scholar] [CrossRef]
- Chen, L.Y.; Lin, M.W.; Chuah, Y.K. Investigation of a potted plant (Hedera helix) with photo-regulation to remove volatile formaldehyde for improving indoor air quality. Aerosol Air Qual. Res. 2017, 17, 2543–2554. [Google Scholar]
- Aydogan, A.; Montoya, L.D. Formaldehyde removal by common indoor plant species and various growing media. Atmos. Environ. 2011, 45, 2675–2682. [Google Scholar] [CrossRef]
- Maggos, T.; Binas, V.; Siaperas, V.; Terzopoulos, A.; Panagopoulos, P.; Kiriakidis, G. A Promising Technological Approach to Improve Indoor Air Quality. Appl. Sci. 2019, 9, 4837. [Google Scholar] [CrossRef]
- Zhong, L.; Haghighat, F.; Lee, C.-S.; Lakdawala, N. Performance of ultraviolet photocatalytic oxidation for indoor air applications: Systematic experimental evaluation. J. Hazard. Mater. 2013, 261, 130–138. [Google Scholar] [CrossRef] [PubMed]
- Shayegan, Z.; Haghighat, F.; Lee, C.S. Photocatalytic oxidation of volatile organic compounds for indoor environment applications: Three different scaled setups. Chem. Eng. J. 2019, 357, 533–546. [Google Scholar] [CrossRef]
- Huang, Y.; Ho, S.S.H.; Lu, Y.; Niu, R.; Xu, L.; Cao, J.; Lee, S. Removal of Indoor Volatile Organic Compounds via Photocatalytic Oxidation: A Short Review and Prospect. Molecules 2016, 21, 56. [Google Scholar] [CrossRef]
- Lee, H.; Lee, Y.J.; Park, S.Y.; Kim, Y.W.; Lee, Y. The improvement of ventilation behaviours in kitchens of residential buildings. Indoor Built Environ. 2012, 21, 48–61. [Google Scholar] [CrossRef]
- Zheng, Q.; Lee, D.; Lee, S.; Kim, J.T.; Kim, S. A Health Performance Evaluation Model of Apartment Building Indoor Air Quality. Indoor Built Environ. 2011, 20, 26–35. [Google Scholar] [CrossRef]
- Zhao, H.; Chan, W.R.; Cohn, S.; Delp, W.W.; Walker, I.S.; Singer, B.C. Indoor air quality in new and renovated low-income apartments with mechanical ventilation and natural gas cooking in California. Indoor Air 2020, 31, 717–729. [Google Scholar] [CrossRef]
- Tsai, W.-T. Overview of Green Building Material (GBM) Policies and Guidelines with Relevance to Indoor Air Quality Management in Taiwan. Environments 2017, 5, 4. [Google Scholar] [CrossRef]
- Merabtine, A.; Maalouf, C.; Hawila, A.A.W.; Martaj, N.; Polidori, G. Building energy audit, thermal comfort, and IAQ assessment of a school building: A case study. Build. Environ. 2018, 145, 62–76. [Google Scholar] [CrossRef]
- Cheng, L.; Li, B.; Baldwin, A.N.; Ding, Y.; Yu, W.; Hong, L. Optimized ventilation control for IAQ in partial renovation and non-renovated commercial buildings during the summer period in Chongqing, South West China. Int. J. Vent. 2015, 14, 219–230. [Google Scholar] [CrossRef]
- Lee, S.; Kwon, G.; Joo, J.; Kim, J.T.; Kim, S. A finish material management system for indoor air quality of apartment buildings (FinIAQ). Energy Build. 2012, 46, 68–79. [Google Scholar] [CrossRef]
- Branco, P.T.B.S.; Alvim-Ferraz, M.C.M.; Martins, F.G.; Sousa, S.I.V. Indoor air quality in urban nurseries at Porto city: Particulate matter assessment. Atmos. Environ. 2014, 84, 133–143. [Google Scholar] [CrossRef]
- Theodosiou, T.; Ordoumpozanis, K. Energy, comfort and indoor air quality in nursery and elementary school buildings in the cold climatic zone of Greece. Energy Build. 2008, 40, 2207–2214. [Google Scholar] [CrossRef]
- EdArabia. 25 Best Nurseries in Dubai—Top Ratings (2021 Fees). 2021. Available online: https://www.edarabia.com/nurseries/dubai/ (accessed on 10 October 2021).
- Hormigos-Jimenez, S.; Padilla-Marcos, M.; Meiss, A.; Gonzalez-Lezcano, R.A.; Feijó-Muñoz, J. Ventilation rate determination method for residential buildings according to TVOC emissions from building materials. Build. Environ. 2017, 123, 555–563. [Google Scholar] [CrossRef]
- Shehzad, K.; Sarfraz, M.; Shah, S.G.M. The impact of COVID-19 as a necessary evil on air pollution in India during the lockdown. Environ. Pollut. 2020, 266, 115080. [Google Scholar] [CrossRef] [PubMed]
- Setti, L.; Passarini, F.; De Gennaro, G.; Barbieri, P.; Perrone, M.G.; Borelli, M.; Palmisani, J.; Di Gilio, A.; Piscitelli, P.; Miani, A. Airborne Transmission Route of COVID-19: Why 2 Meters/6 Feet of Inter-Personal Distance Could Not Be Enough. Int. J. Environ. Res. Public Health 2020, 17, 2932. [Google Scholar] [CrossRef]
- Comunian, S.; Dongo, D.; Milani, C.; Palestini, P. Air Pollution and COVID-19: The Role of Particulate Matter in the Spread and Increase of COVID-19′s Morbidity and Mortality. Int. J. Environ. Res. Public Health 2020, 17, 4487. [Google Scholar] [CrossRef]
- Travaglio, M.; Yu, Y.; Popovic, R.; Selley, L.; Leal, N.S.; Martins, L.M. Links between air pollution and COVID-19 in England. Environ. Pollut. 2020, 268, 115859. [Google Scholar] [CrossRef]


| Nursery Name | Facility Basic Information | Management Status | Improvements | |||||||
|---|---|---|---|---|---|---|---|---|---|---|
| City | Area (m2) | Number of Children | Number of Employees | Construction Date | MEP | Natural Ventilation | Daily Cleaning | Annual Sanitization | ||
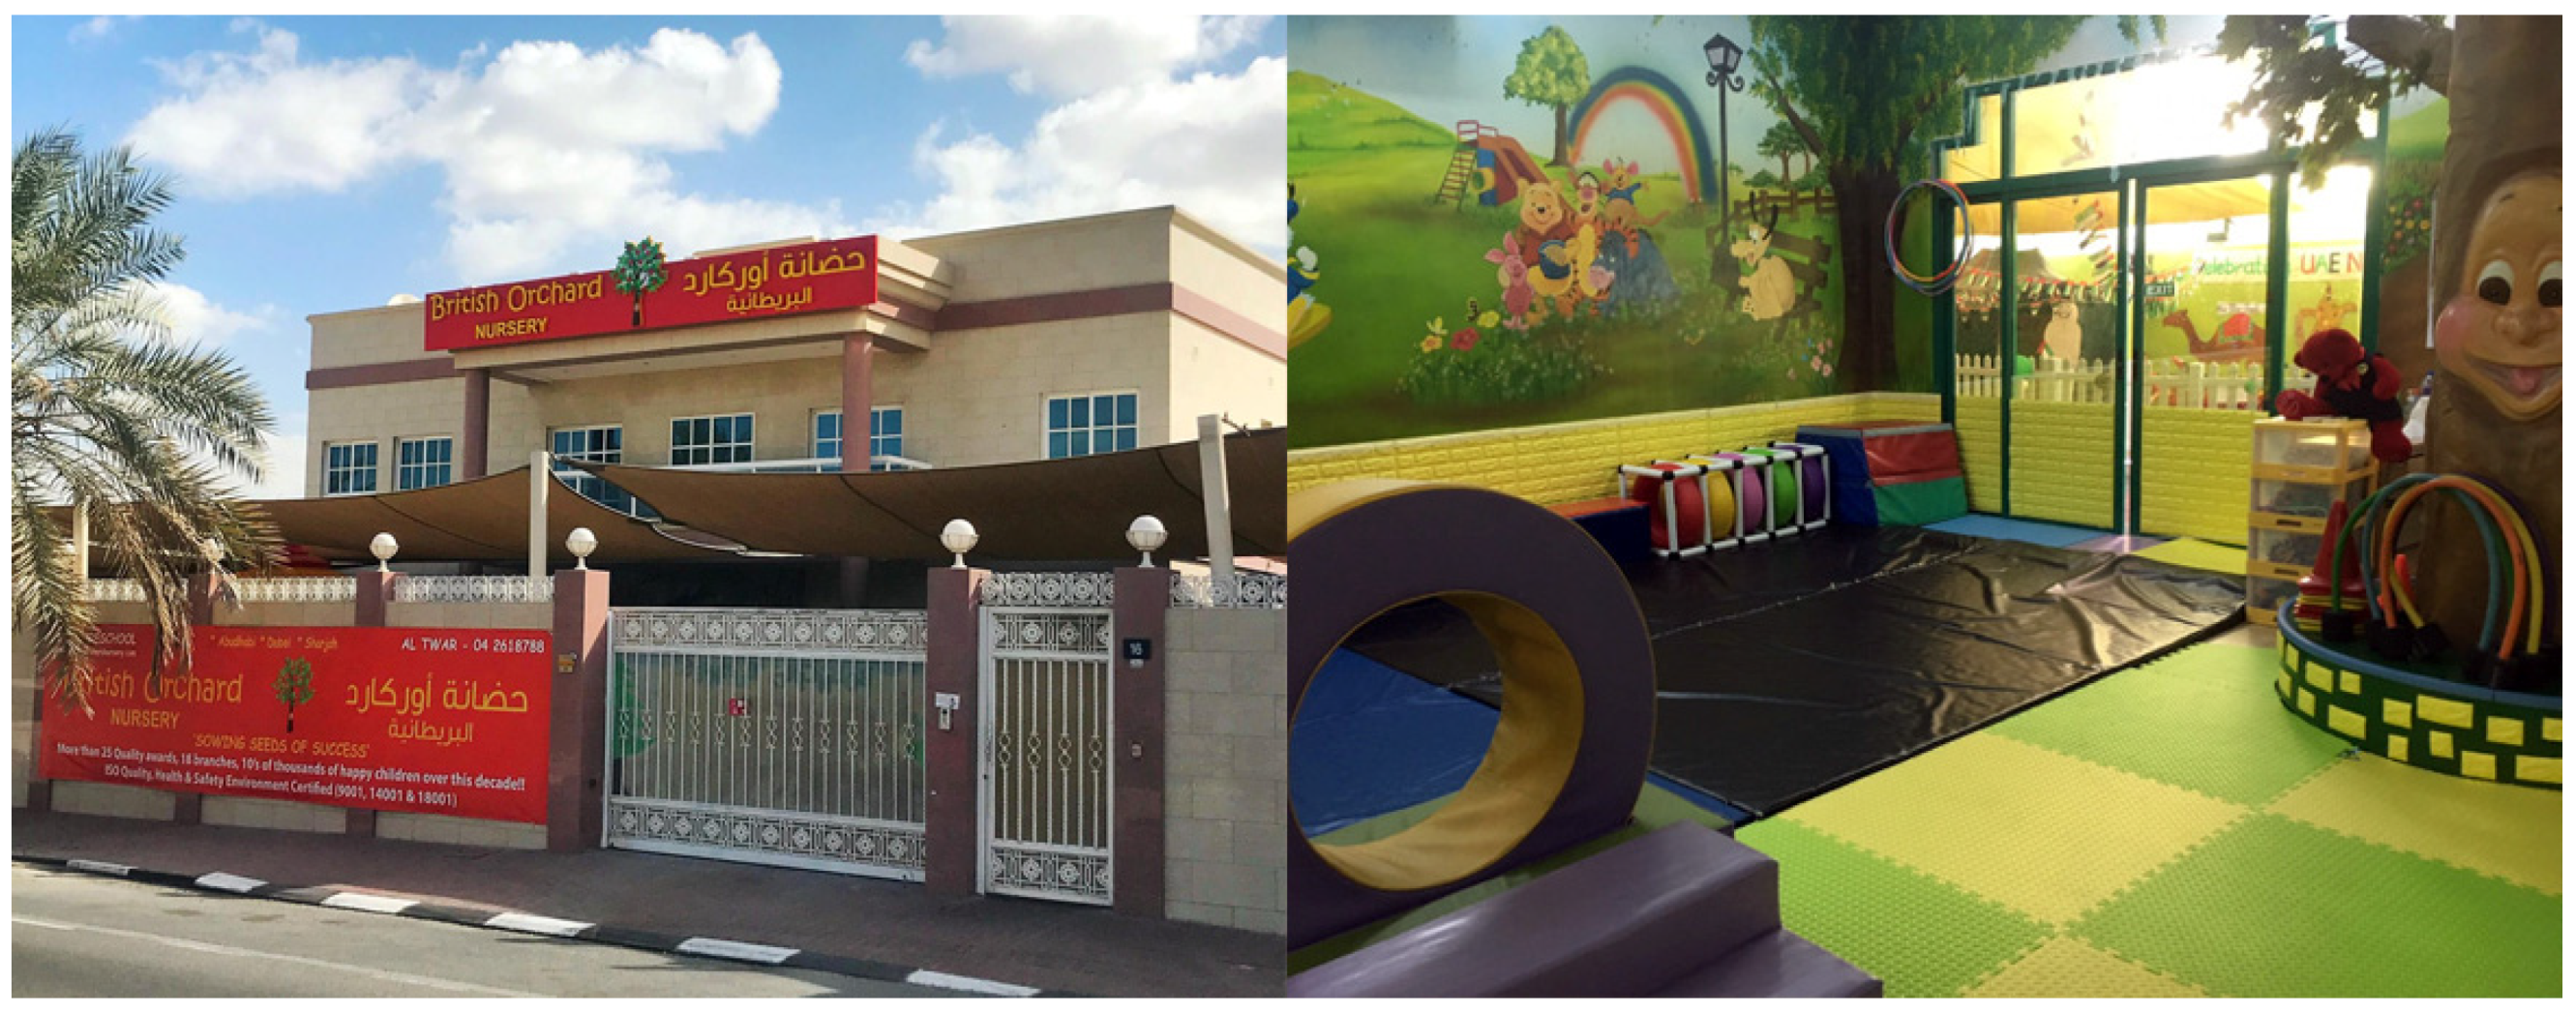
| 01-FU (Figure 2) | Dubai | 1120 | 68 | 14 | 2010 | Yes | 1 | 3 | 12 | Air Purifier Installation |
| 02-DO | Dubai | 708 | 54 | 11 | 2014 | Yes | 3 | 3 | 24 | |
| 03-WO | Dubai | 810 | 56 | 14 | 2006 | Yes | 2 | 1 | 12 | |
| 04-ID | Dubai | 1300 | 104 | 22 | 2005 | Yes | 3 | 1 | 1212 | |
| 05-KA | Dubai | 598 | 38 | 10 | 2010 | Yes | 3 | 1 | 4 | |
| 06-CR | Dubai | 580 | 30 | 8 | 2012 | Yes | 4 | 2 | 12 | |
| 07-LL | Dubai | 462 | 32 | 6 | 2016 | Yes | 3 | 2 | 12 | |
| 08-KI | Dubai | 780 | 28 | 9 | 2008 | Yes | 4 | 1 | 6 | |
| 09-AK | Dubai | 900 | 35 | 10 | 2006 | Yes | 2 | 1 | 12 | |
| 10-HO | Dubai | 1200 | 97 | 14 | 2014 | Yes | 2 | 1 | 6 | |
| 11-OR (Figure 3) | Sharjah | 1310 | 102 | 12 | 2008 | Yes | 4 | 4 | 4 | Changing Finish Material |
| 12-AM | Sharjah | 588 | 44 | 6 | 2009 | Yes | 2 | 1 | 12 | |
| 13-DR | Sharjah | 970 | 83 | 8 | 2004 | Yes | 3 | 2 | 12 | |
| 14-RO | Sharjah | 680 | 72 | 7 | 2008 | Yes | 3 | 2 | 12 | New Ventilation Installation |
| 15-GA | Ajman | 784 | 32 | 6 | 2014 | Yes | 4 | 1 | 12 | |
| 16-BL | Ajman | 476 | 38 | 4 | 2016 | Yes | 2 | 4 | 12 | |
| Measurement Item | Measuring & Analysis Equipment | Measurement (Sampling) Time |
|---|---|---|
| Temperature (°C) Humidity (%) | Electronic Data logger SATO SK-L200TH II | 30 Times per Min/Average |
| Carbon Dioxide (CO2) | Indoor Air Quality Meter TSI 7545 IAQ-CALC | 30 Times per Min/Average |
| Formaldehyde (CH2O) | Formaldehyde Meter HFX205-100, HPLC | Flow rate: 500 mL/min Collection time: 30 min Collection amount: 15 L 2 times/Average |
| TVOC | VOC Environmental Meter PCE-VOC 1, Varian-SATURN2200/Shimadzu-QP2010 | Flow rate: 100 mL/min Collection time: 30 min Collection amount: 3 L 2 times/Average |
| TSP | Airmetrics Minivol Portable Air Sampler PAS-201 | 10 Times per 3 Min/Average |
| Group | Improvement Methods | Target Nurseries | Numbers (Nurseries/Rooms) |
|---|---|---|---|
| AP Group | Installation of Air Purifier | 01-FU, 02-DO, 03-WO, 04-ID, 05-KA, 06-CR, 07-LL, 08-KI, 09-AK, 10-HO | 10/16 |
| BM Group | Change of Building Materials | 11-OR, 12-AM, 13-DR | 3/6 |
| NV Group | Installation of New Ventilation | 14-RO, 15-GA, 16-BL | 3/6 |
| 16 Rooms | CO2 (ppm) | TSP (μg/m3) | CH2O (μg/m3) | TVOC (μg/m3) | ||||||||
|---|---|---|---|---|---|---|---|---|---|---|---|---|
| Before | After | % | Before | After | % | Before | After | % | Before | After | % | |
| 01-FU-1 | 1962.0 | 756.0 | 61.40 | 88.31 | 76.46 | 13.39 | 46.02 | 51.66 | −12.2 | 266.42 | 94.86 | 64.39 |
| 01-FU-2 | 2114.0 | 888.0 | 57.92 | 98.73 | 81.12 | 17.81 | 41.08 | 62.68 | −52.6 | 211.36 | 241.85 | −14.41 |
| 02-DO-1 | 858.0 | 618.6 | 28.06 | 94.44 | 58.98 | 37.55 | 71.84 | 81.02 | −12.8 | 723.93 | 379.50 | 47.56 |
| 03-WO-1 | 816.0 | 557.0 | 31.50 | 61.03 | 58.54 | 4.05 | 41.72 | 63.60 | −52.5 | 229.24 | 56.55 | 75.30 |
| 04-ID-1 | 1725.0 | 1468.0 | 14.88 | 84.36 | 63.81 | 24.33 | 35.38 | 26.04 | 26.41 | 174.82 | 98.14 | 43.84 |
| 05-KA-1 | 762.0 | 1477.0 | −93.5 | 61.94 | 51.55 | 16.77 | 47.12 | 79.74 | −69.2 | 842.63 | 108.22 | 87.15 |
| 06-CR-1 | 646.0 | 694.0 | −7.56 | 78.34 | 70.45 | 10.10 | 31.66 | 40.86 | −29.0 | 151.42 | 262.02 | −73.02 |
| 06-CR-2 | 714.0 | 652.0 | 8.78 | 57.27 | 58.76 | −2.60 | 36.32 | 54.16 | −49.1 | 69.92 | 30.64 | 56.15 |
| 07-LL-1 | 564.0 | 545.0 | 3.52 | 84.15 | 55.20 | 34.42 | 121.27 | 92.48 | 27.26 | 489.54 | 98.28 | 79.92 |
| 07-LL-2 | 705.0 | 620.0 | 12.04 | 44.17 | 45.20 | −2.78 | 10.09 | 63.02 | 42.74 | 503.43 | 62.03 | 87.67 |
| 08-KI-1 | 1256.0 | 676.0 | 46.22 | 166.60 | 46.48 | 72.10 | 6278 | 35.15 | 44.05 | 467.00 | 200.53 | 57.06 |
| 08-KI-2 | 1084.0 | 1042.0 | 3.78 | 182.01 | 151.80 | 16.52 | 62.10 | 31.68 | 48.98 | 781.23 | 148.98 | 80.92 |
| 09-AK-1 | 1106.0 | 431.0 | 60.92 | 48.79 | 35.10 | 29.50 | 41.62 | 62.6 | 84.94 | 371.02 | 50.42 | 86.38 |
| 09-AK-2 | 1258.0 | 448.0 | 64.27 | 31.02 | 24.60 | 20.42 | 39.98 | 3.58 | 91.06 | 565.01 | 18.60 | 96.68 |
| 10-HO-1 | 1366.0 | 519.0 | 61.90 | 103.74 | 90.50 | 12.75 | 57.02 | 21.45 | 62.42 | 108.22 | 174.55 | −61.28 |
| 10-HO-2 | 598.0 | 978.0 | −63.6 | 85.81 | 48.88 | 43.01 | 55.48 | 16.74 | 69.84 | 199.60 | 146.55 | 26.58 |
| Maximum | 2114.0 | 1477.0 | 64.27 | 182.01 | 151.80 | 72.10 | 127.27 | 92.48 | 91.06 | 842.63 | 379.50 | 96.68 |
| Minimum | 564.0 | 431.0 | −93.5 | 31.02 | 24.60 | −2.78 | 31.66 | 3.58 | −69.2 | 69.92 | 18.60 | −73.02 |
| Mean | 1097.3 | 774.65 | 18.15 | 85.73 | 63.60 | 21.70 | 56.71 | 45.64 | 13.75 | 384.67 | 135.73 | 46.30 |
| Increase | N/A | N/A | 3 | N/A | N/A | 2 | N/A | N/A | 7 | N/A | N/A | 3 |
| 16 Rooms | CO2 (ppm) | TSP (μg/m3) | CH2O (μg/m3) | TVOC (μg/m3) | ||||||||
|---|---|---|---|---|---|---|---|---|---|---|---|---|
| Before | After | % | Before | After | % | Before | After | % | Before | After | % | |
| 11-OR-1 | 770.8 | 711.2 | 7.78 | 97.50 | 71.60 | 26.56 | 80.12 | 479.3 | −498 | 325.46 | 910.36 | −179.8 |
| 11-OR-2 | 512.8 | 590.8 | −15.2 | 90.81 | 89.80 | 1.02 | 309.41 | 434.3 | −40.4 | 168.21 | 715.87 | −326.1 |
| 12-AM-1 | 712.8 | 534.4 | 24.82 | 81.24 | 61.60 | 24.18 | 193.12 | 425.3 | −120 | 148.41 | 633.58 | −326.6 |
| 12-AM-1 | 614.6 | 1974.5 | −221 | 96.62 | 66.80 | 30.98 | 136.82 | 231.8 | −69.3 | 98.31 | 896.41 | −812.9 |
| 13-DR-1 | 682.0 | 593.4 | 12.90 | 47.24 | 40.42 | 14.48 | 31.41 | 112.6 | −258 | 74.31 | 500.54 | −574.1 |
| 13-DR-2 | 816.8 | 513.2 | 37.12 | 55.23 | 58.43 | −5.68 | 29.54 | 54.7 | −85.1 | 249.42 | 412.24 | −65.3 |
| Maximum | 816.8 | 1974.5 | 36.12 | 97.50 | 89.80 | 30.98 | 309.41 | 479.3 | −40.4 | 325.46 | 910.36 | −65.3 |
| Minimum | 512.8 | 513.2 | −221 | 47.24 | 40.42 | −5.68 | 29.54 | 54.7 | −498 | 74.31 | 412.24 | −812.9 |
| Mean | 685.8 | 820.4 | −25.6 | 78.12 | 64.76 | 12.24 | 130.04 | 238.7 | −178 | 177.32 | 678.14 | −380.7 |
| Increase | N/A | N/A | 2 | N/A | N/A | 1 | N/A | N/A | 6 | N/A | N/A | 6 |
| 16 Rooms | CO2 (ppm) | TSP (μg/m3) | CH2O (μg/m3) | TVOC (μg/m3) | ||||||||
|---|---|---|---|---|---|---|---|---|---|---|---|---|
| Before | After | % | Before | After | % | Before | After | % | Before | After | % | |
| 14-RO-1 | 616.7 | 436.1 | 29.3 | 91.67 | 25.42 | 72.27 | 28.48 | 7.24 | 74.57 | 192.42 | 189.12 | 1.72 |
| 14-RO-2 | 636.7 | 749.3 | −17.7 | 129.17 | 83.54 | 35.29 | 67.98 | 20.57 | 69.73 | 756.32 | 958.60 | −26.72 |
| 15-GA-1 | 2013.3 | 637.3 | 68.4 | 105.56 | 75.46 | 28.52 | 156.86 | 79.48 | 49.32 | 1583.2 | 875.26 | 44.52 |
| 15-GA-2 | 2606.7 | 646.1 | 75.2 | 83.33 | 64.80 | 22.22 | 216.08 | 43.68 | 79.76 | 1473.7 | 690.12 | 53.12 |
| 16-BL-1 | 586.1 | 734.8 | −25.4 | 104.27 | 71.51 | 31.34 | 74.54 | 61.52 | 17.46 | 435.46 | 61.54 | 86.86 |
| 16-BL-2 | 561.0 | 991.1 | −76.6 | 184.17 | 77.44 | 57.96 | 73.20 | 58.70 | 19.81 | 389.46 | 40.94 | 89.48 |
| Maximum | 2606.7 | 991.1 | 75.2 | 184.17 | 83.54 | 72.27 | 216.08 | 79.48 | 79.48 | 1583.2 | 958.60 | 89.48 |
| Minimum | 561.0 | 436.1 | −76.6 | 83.33 | 25.42 | 22.22 | 28.48 | 7.24 | 17.46 | 192.42 | 40.94 | −26.72 |
| Mean | 1113.1 | 644.5 | 17.04 | 108.46 | 66.04 | 36.74 | 91.94 | 40.01 | 53.49 | 688.48 | 362.26 | 52.92 |
| Increase | N/A | N/A | 3 | N/A | N/A | 0 | N/A | N/A | 0 | N/A | N/A | 1 |
Publisher’s Note: MDPI stays neutral with regard to jurisdictional claims in published maps and institutional affiliations. |
© 2021 by the authors. Licensee MDPI, Basel, Switzerland. This article is an open access article distributed under the terms and conditions of the Creative Commons Attribution (CC BY) license (https://creativecommons.org/licenses/by/4.0/).
Share and Cite
Arar, M.; Jung, C. Improving the Indoor Air Quality in Nursery Buildings in United Arab Emirates. Int. J. Environ. Res. Public Health 2021, 18, 12091. https://doi.org/10.3390/ijerph182212091
Arar M, Jung C. Improving the Indoor Air Quality in Nursery Buildings in United Arab Emirates. International Journal of Environmental Research and Public Health. 2021; 18(22):12091. https://doi.org/10.3390/ijerph182212091
Chicago/Turabian StyleArar, Mohammad, and Chuloh Jung. 2021. "Improving the Indoor Air Quality in Nursery Buildings in United Arab Emirates" International Journal of Environmental Research and Public Health 18, no. 22: 12091. https://doi.org/10.3390/ijerph182212091
APA StyleArar, M., & Jung, C. (2021). Improving the Indoor Air Quality in Nursery Buildings in United Arab Emirates. International Journal of Environmental Research and Public Health, 18(22), 12091. https://doi.org/10.3390/ijerph182212091