
Assessing the Potential Impact of Land Use on Carbon Storage Driven by Economic Growth: A Case Study in Yangtze River Delta Urban Agglomeration

Abstract
:1. Introduction
2. Methodology and Data
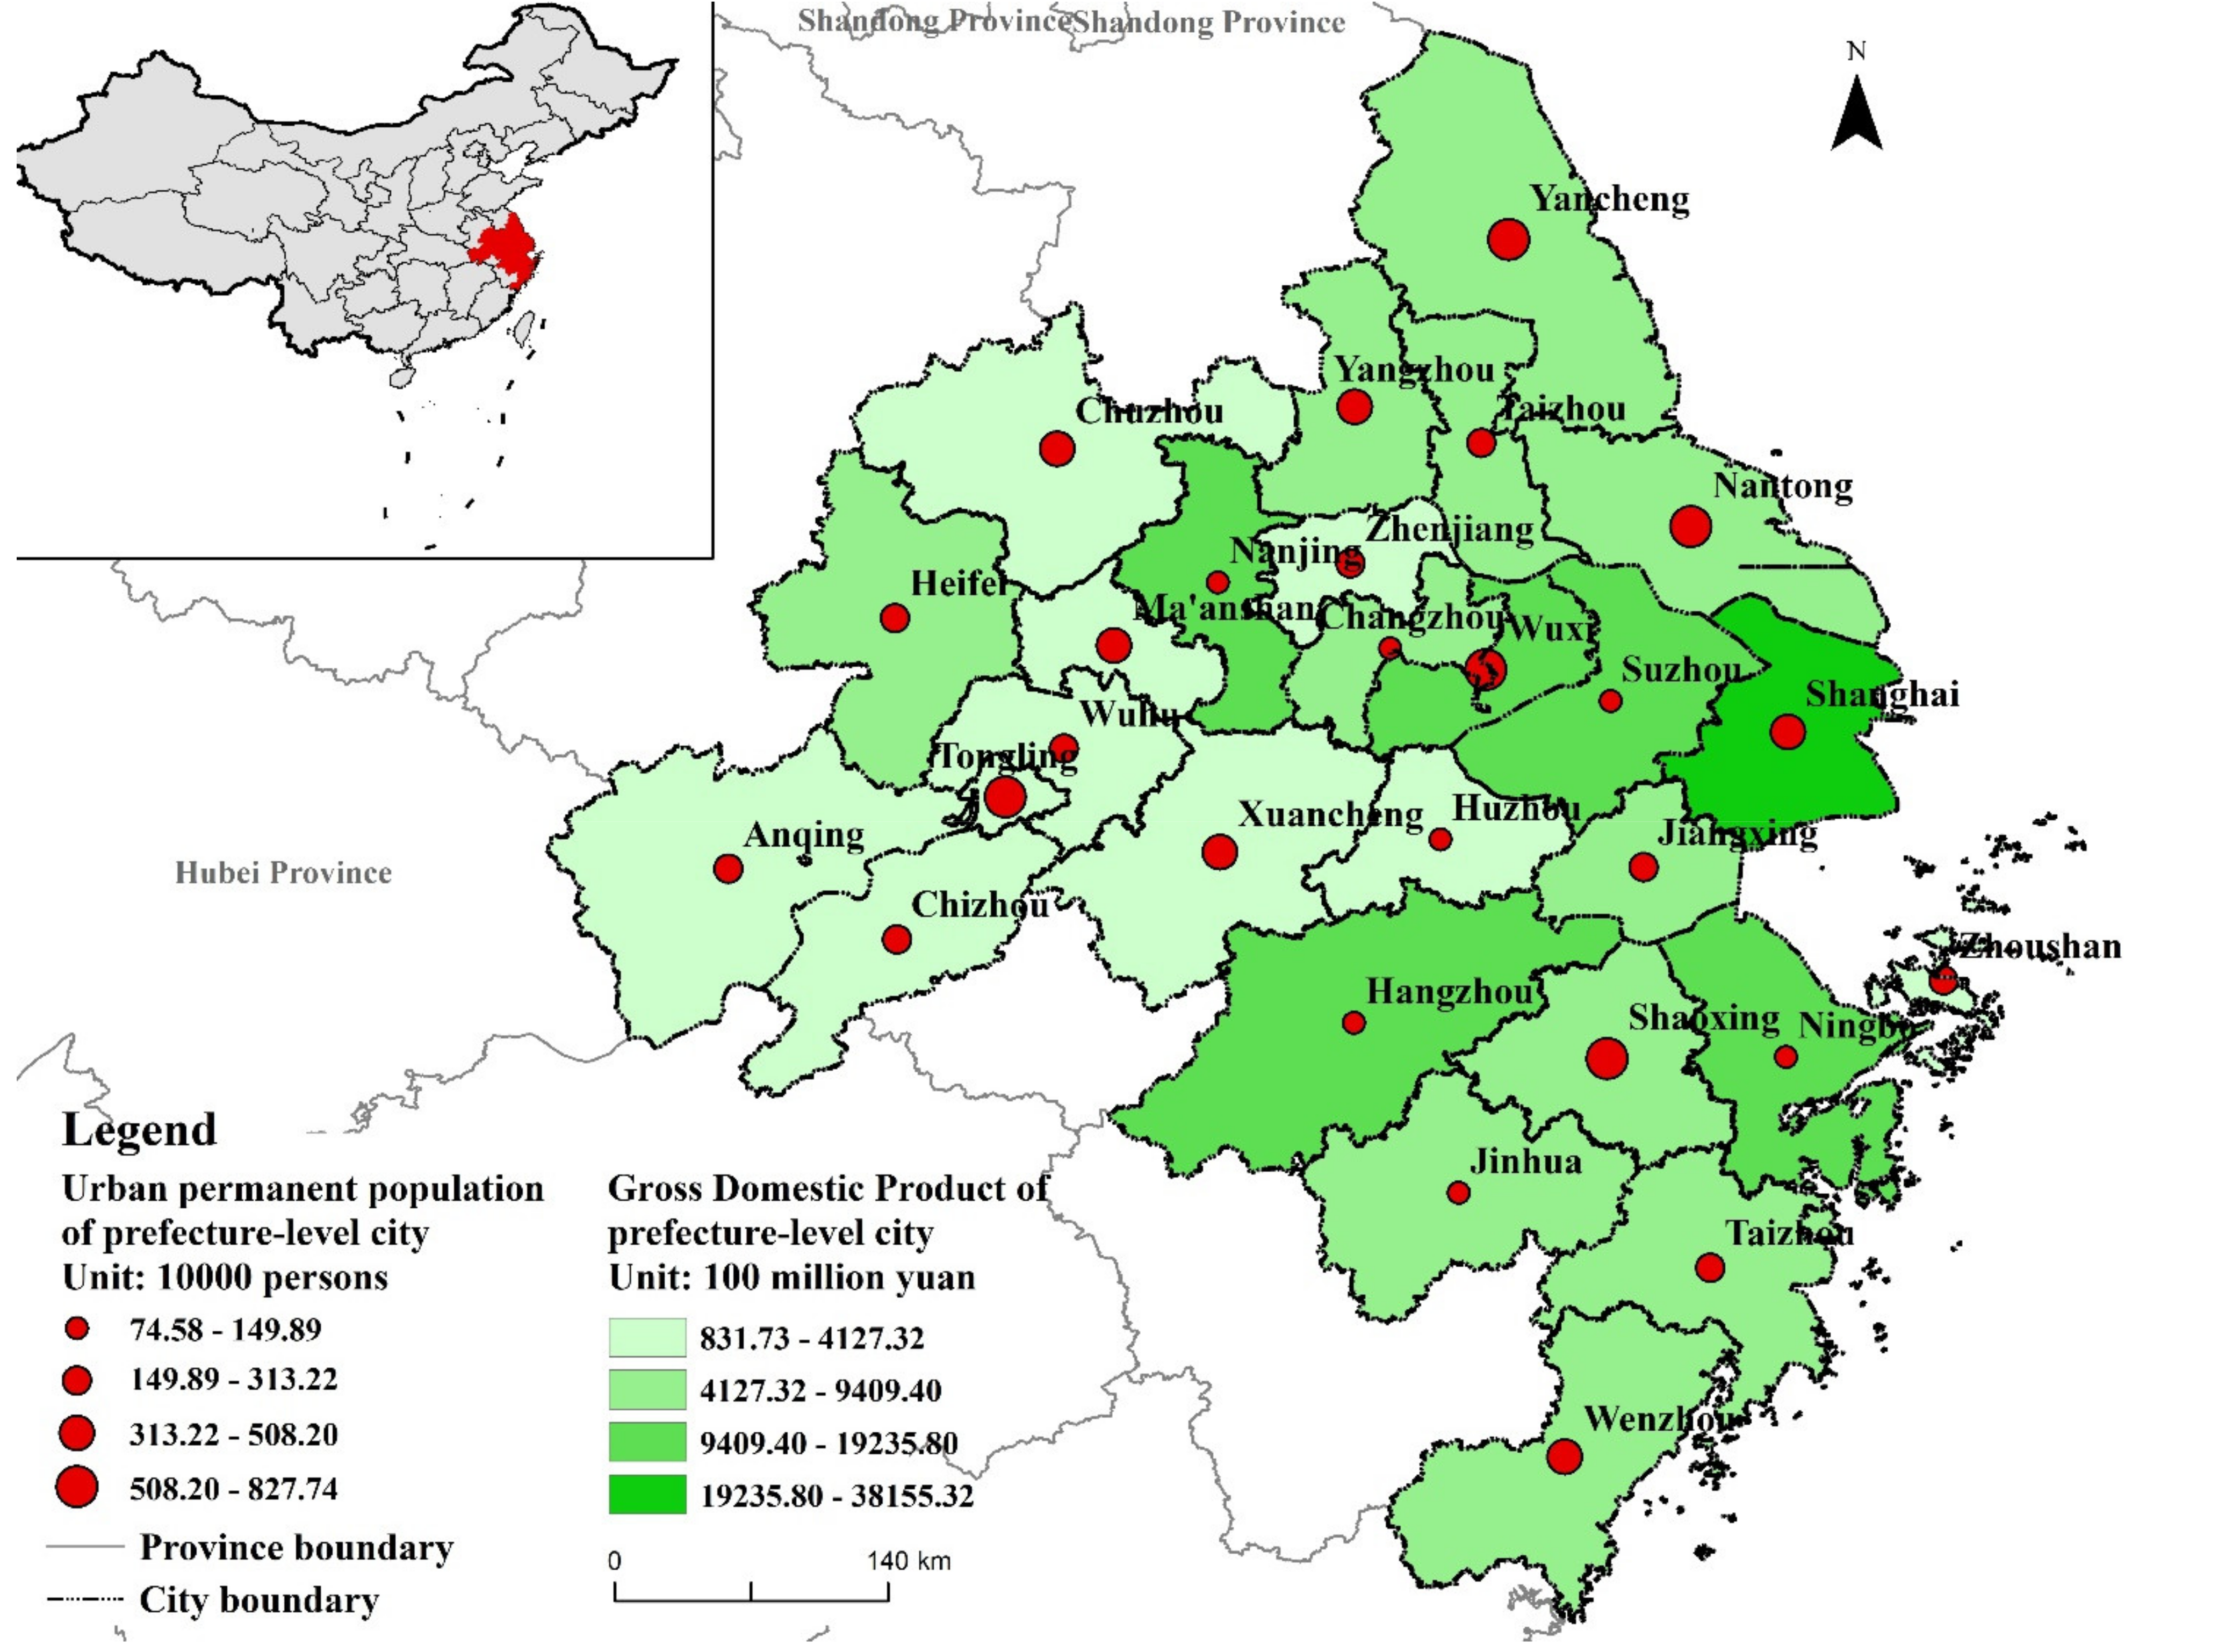
2.1. Study Area
2.2. Data
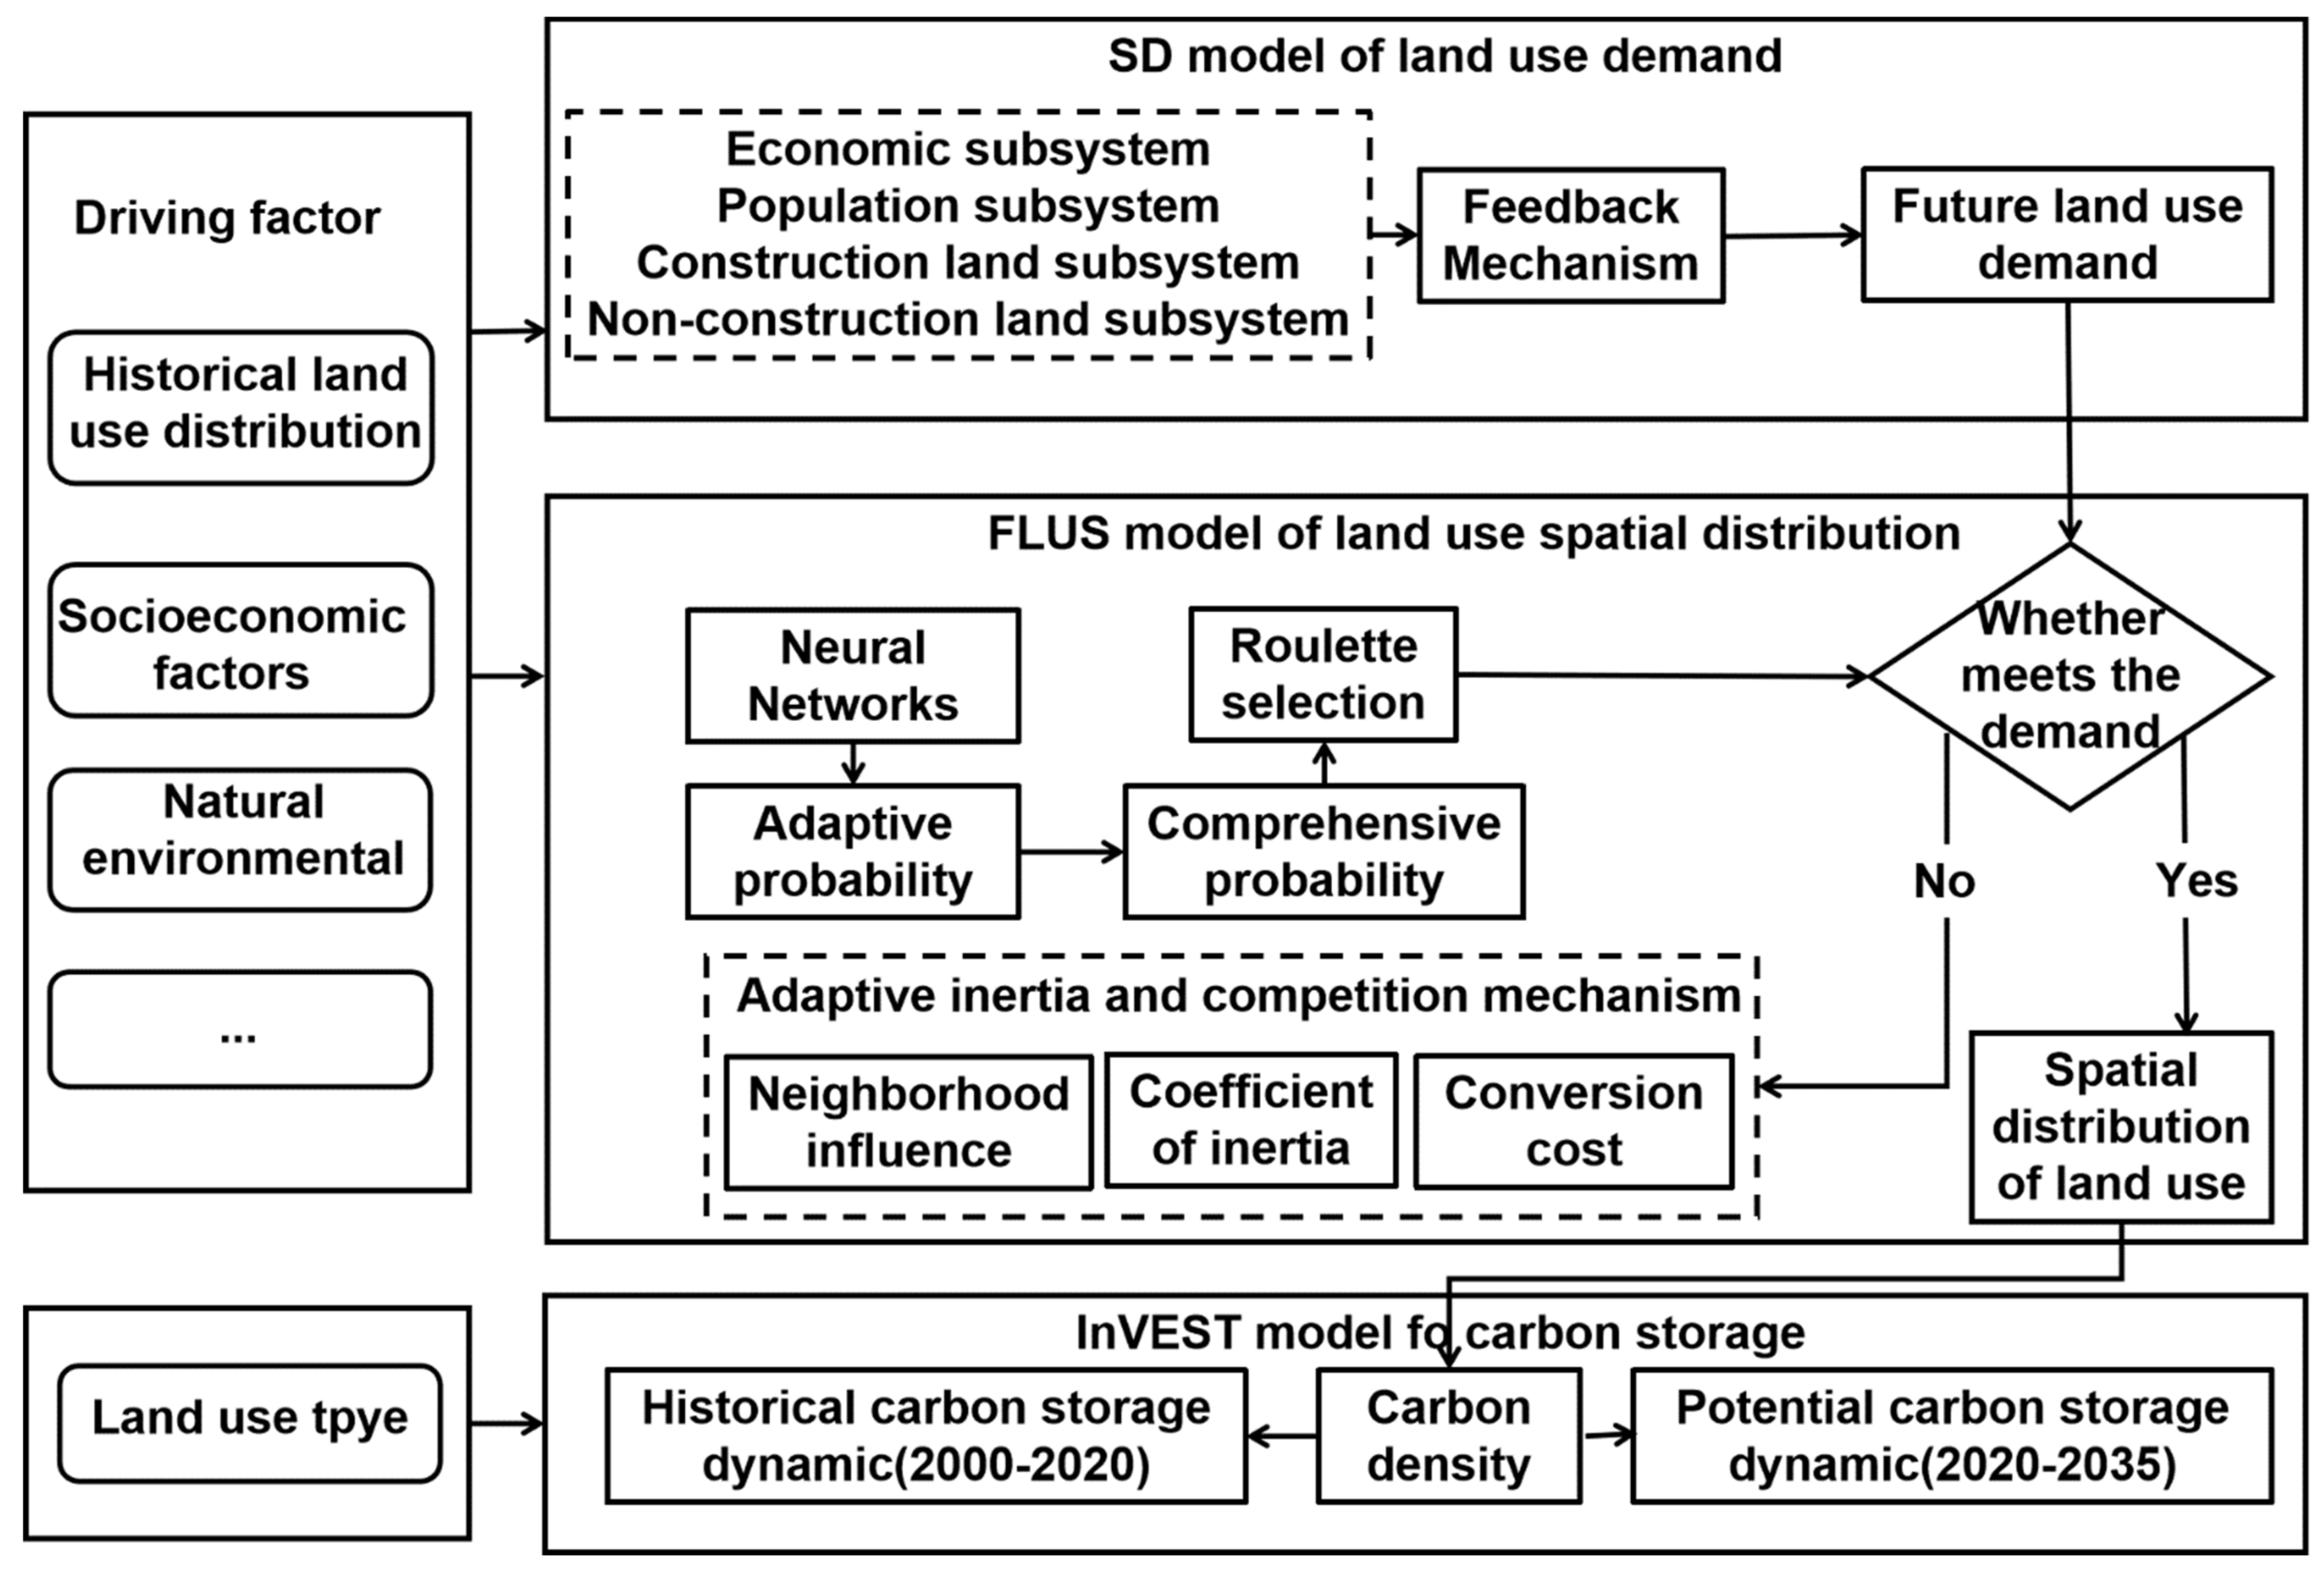
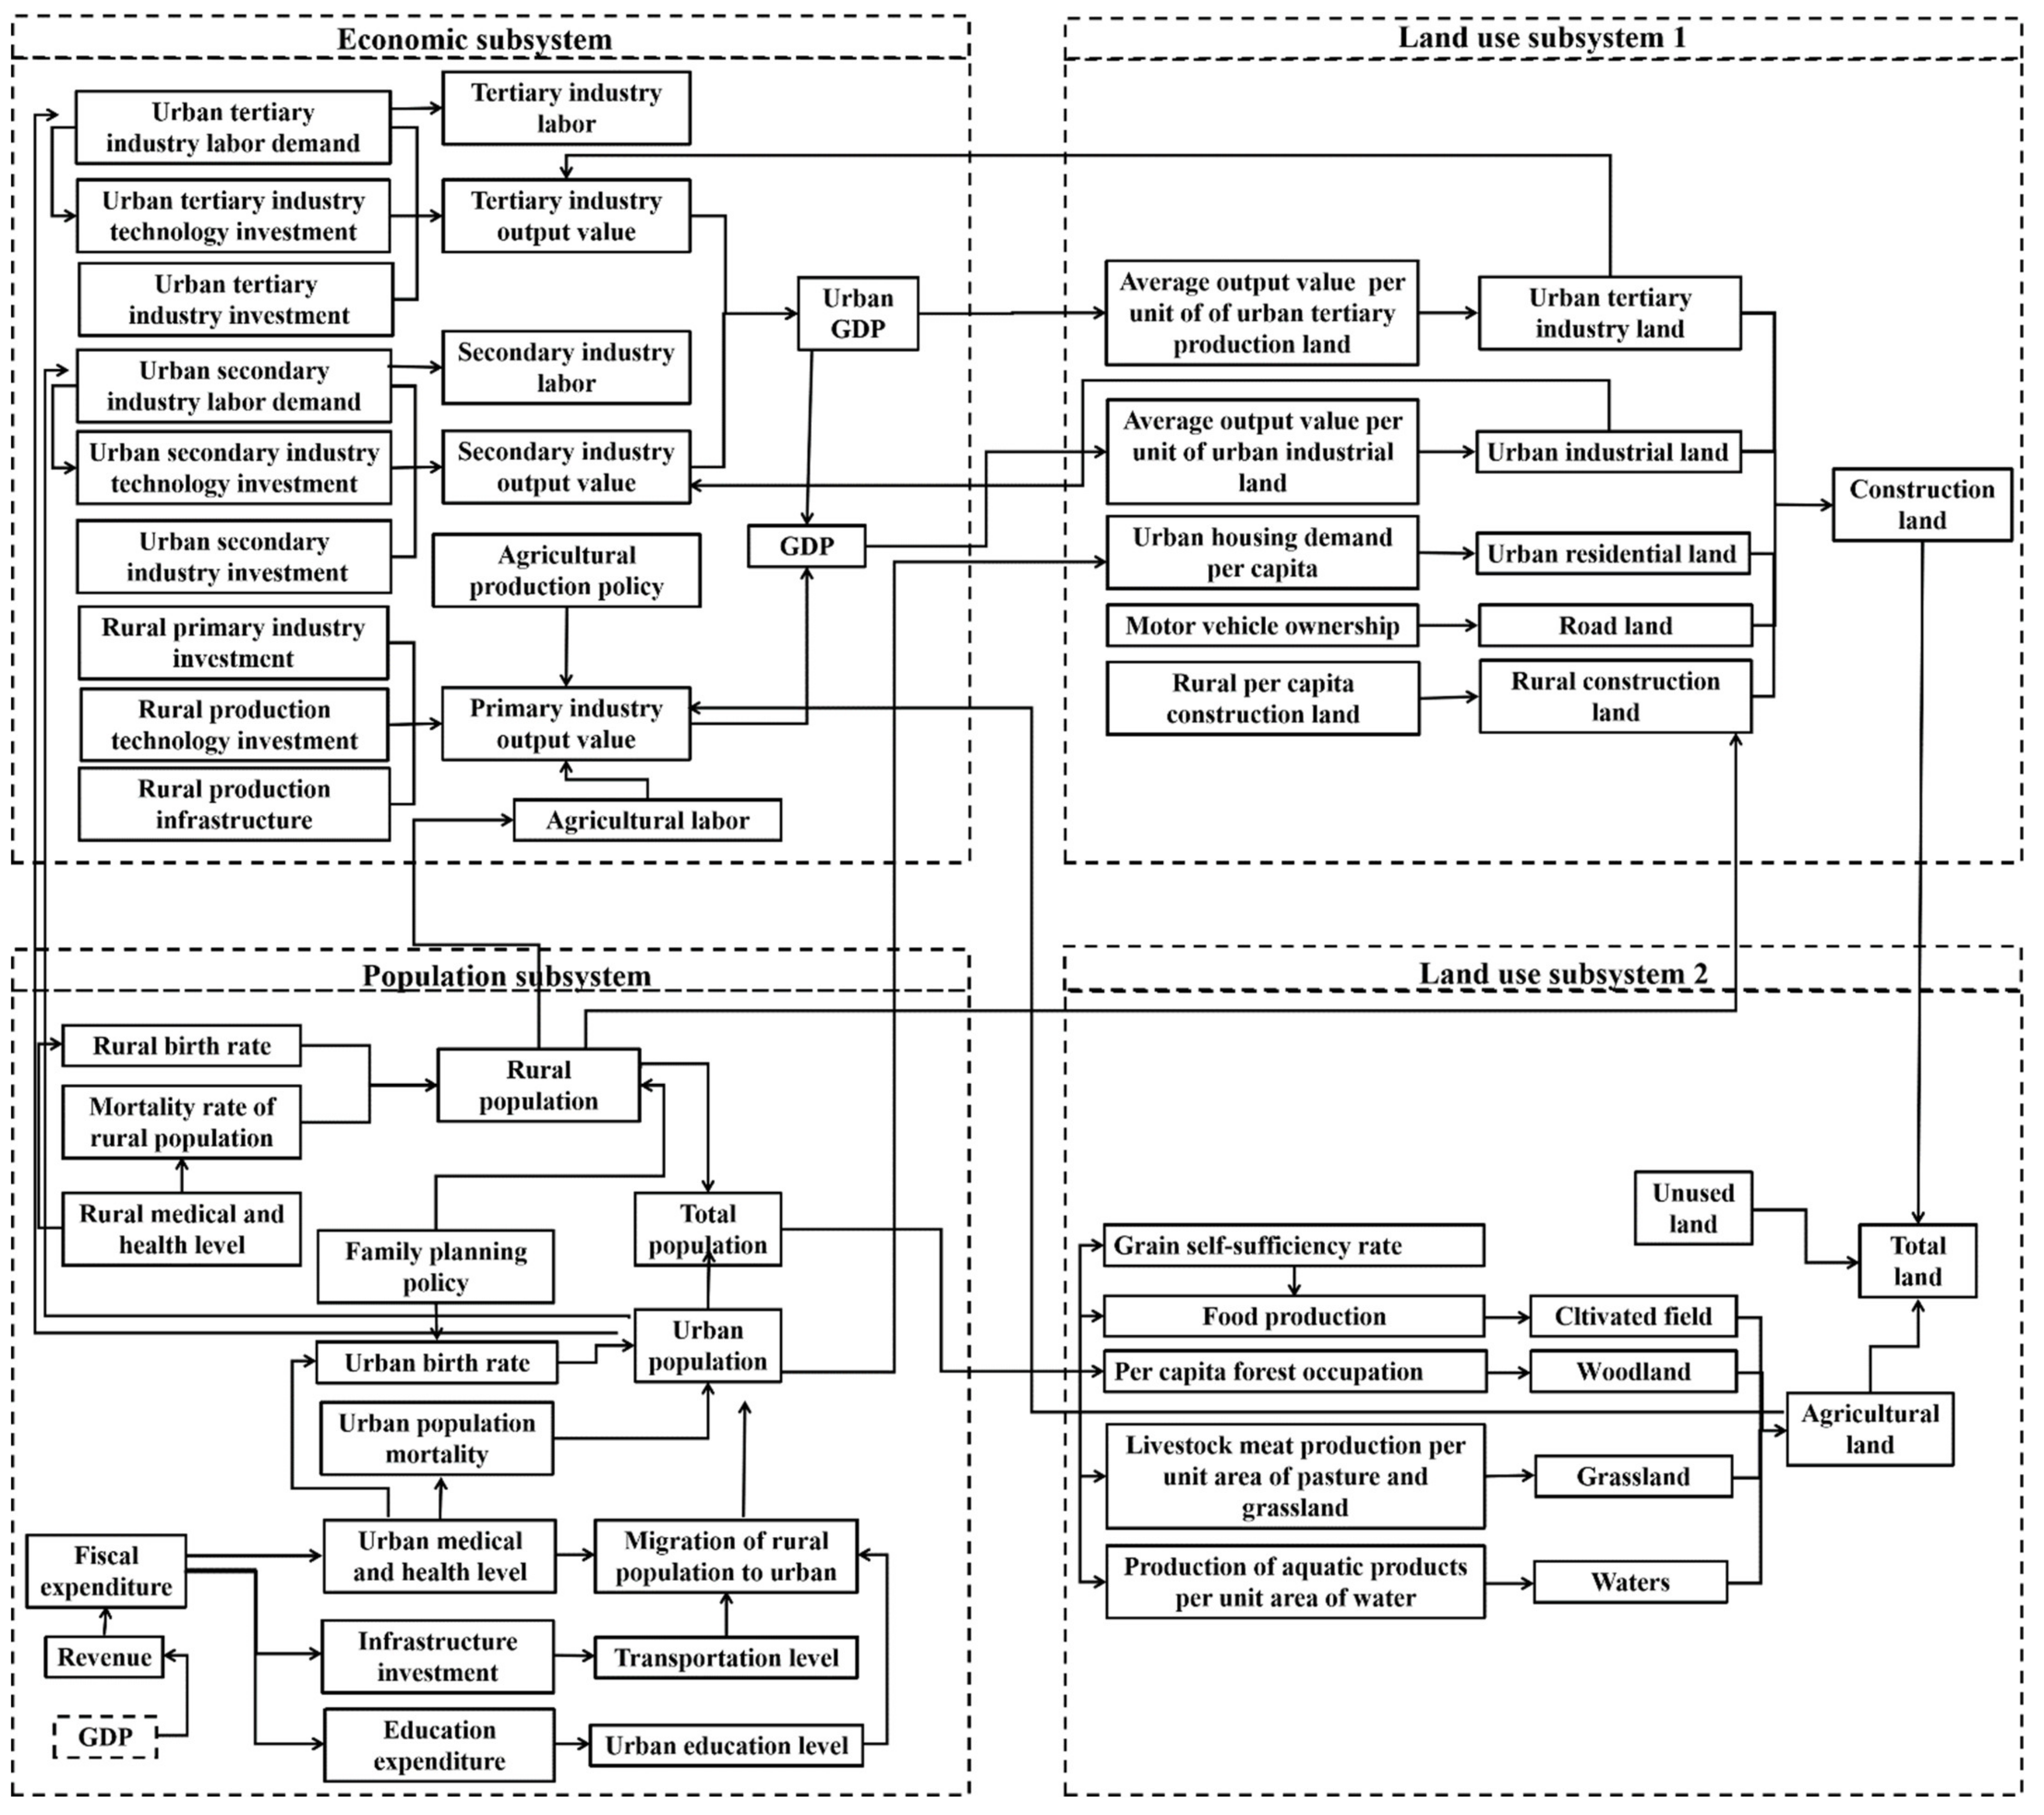
2.3. Methods
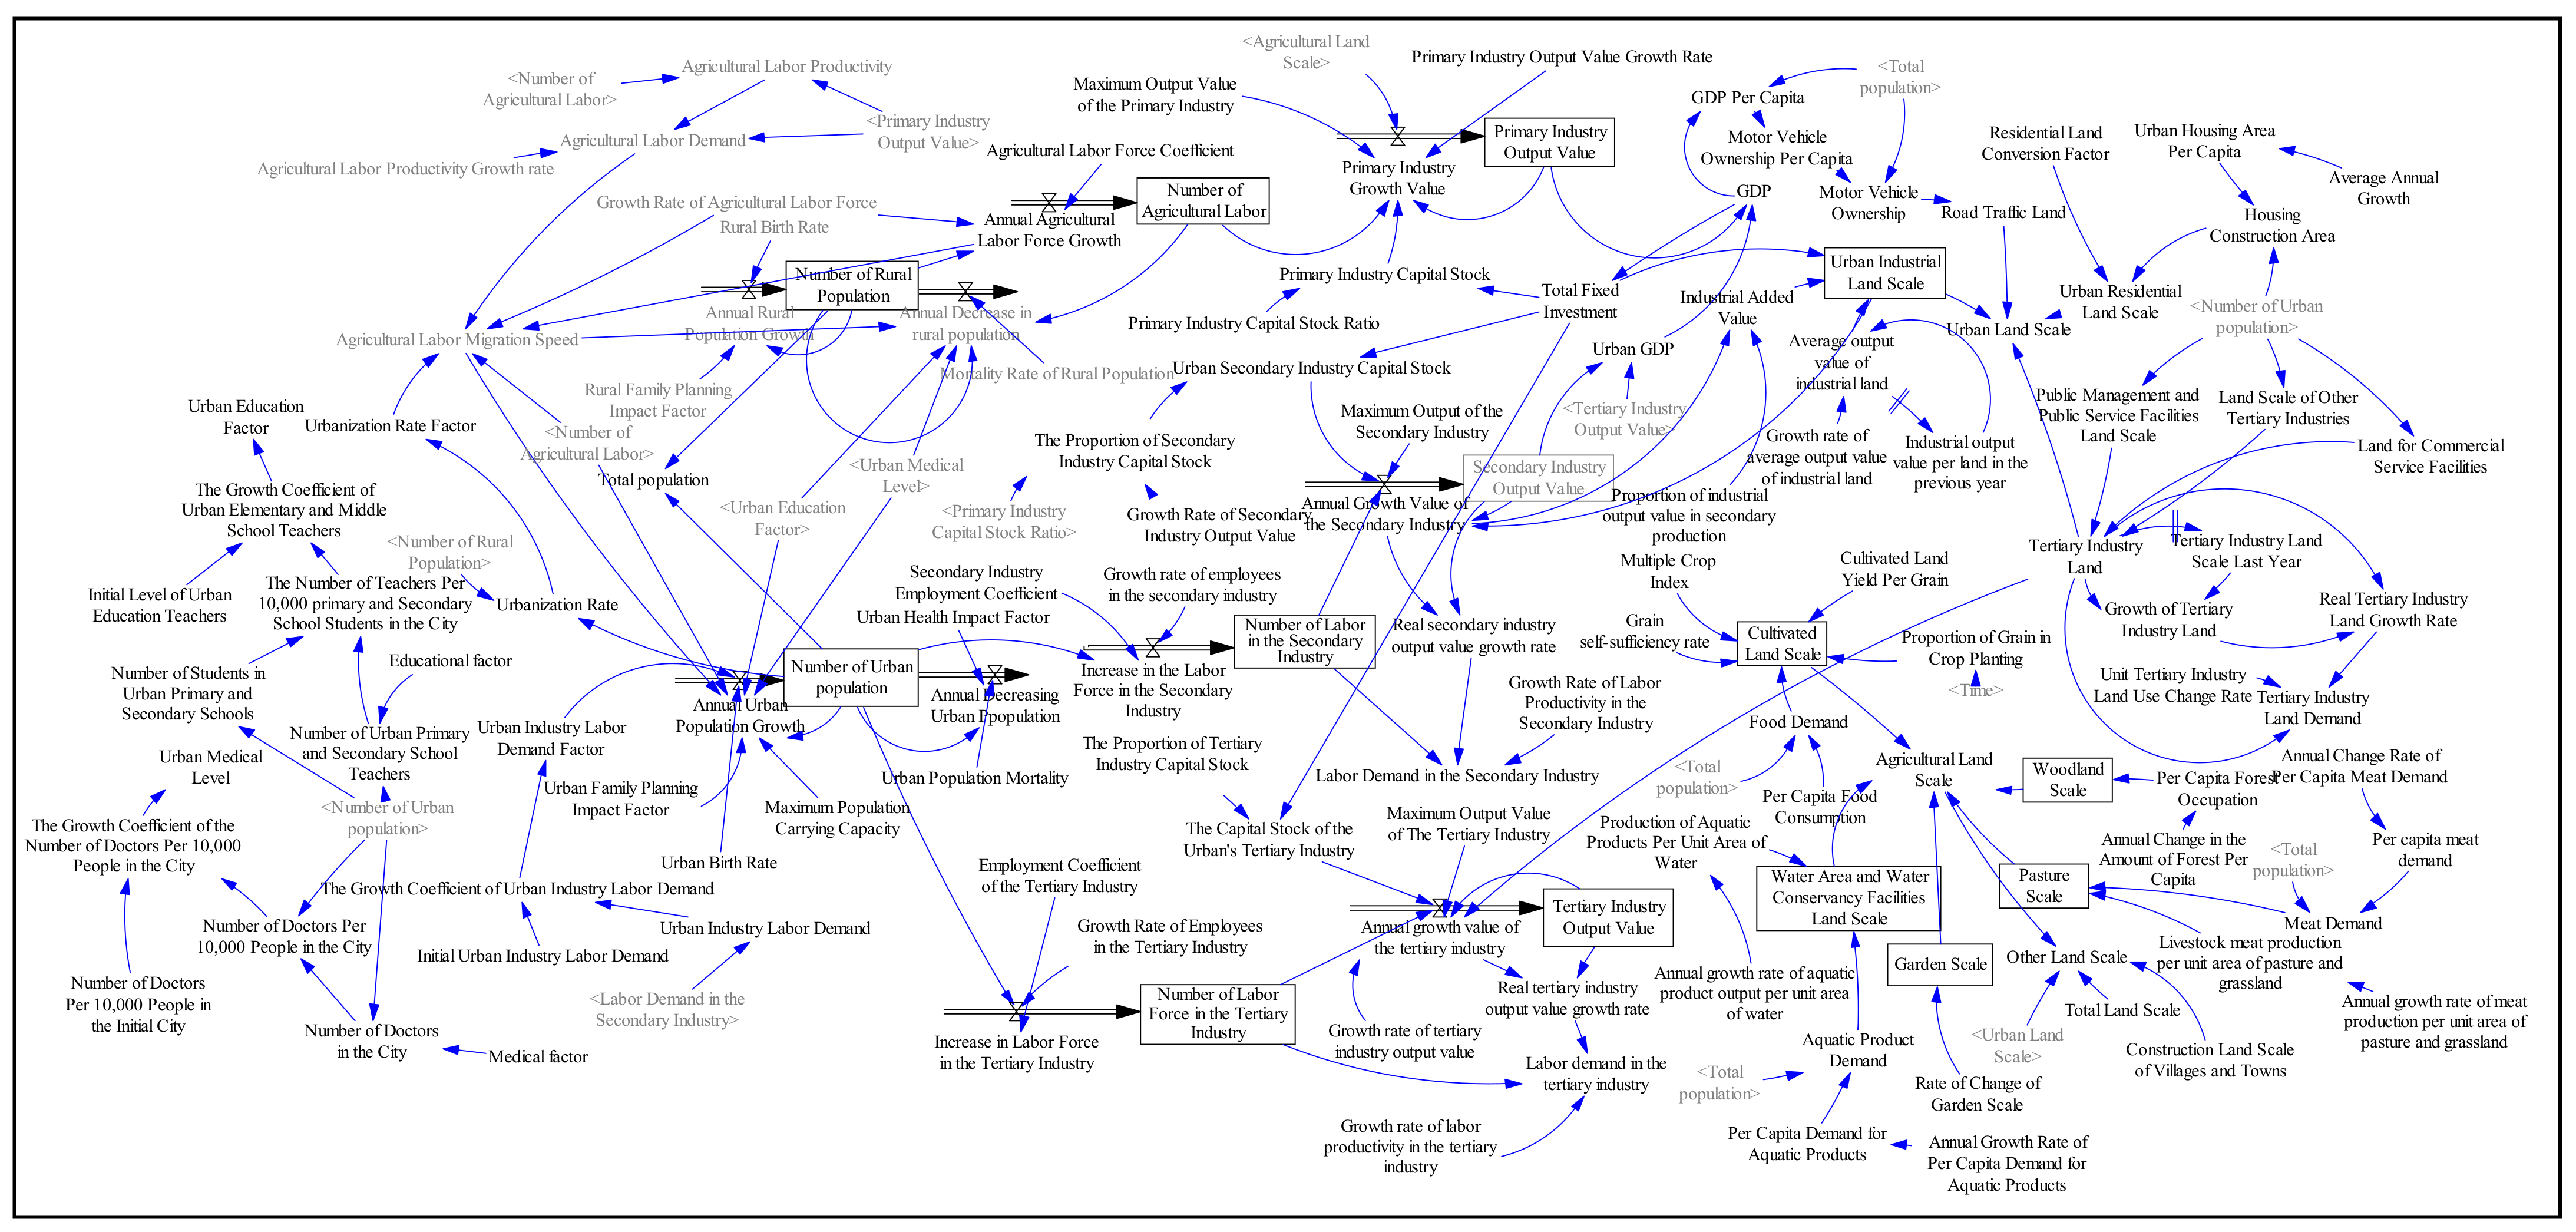
2.3.1. Prediction of Future Land Use Demand
2.3.2. Simulation of Spatial Land-Use Patterns
2.3.3. Assessment of Carbon Storage Change
2.4. Scenario Setting
2.4.1. Economic Growth Rate
2.4.2. Family Planning Changes
2.4.3. Demand for Non-Construction Land
2.4.4. Demand for Construction Land
3. Results
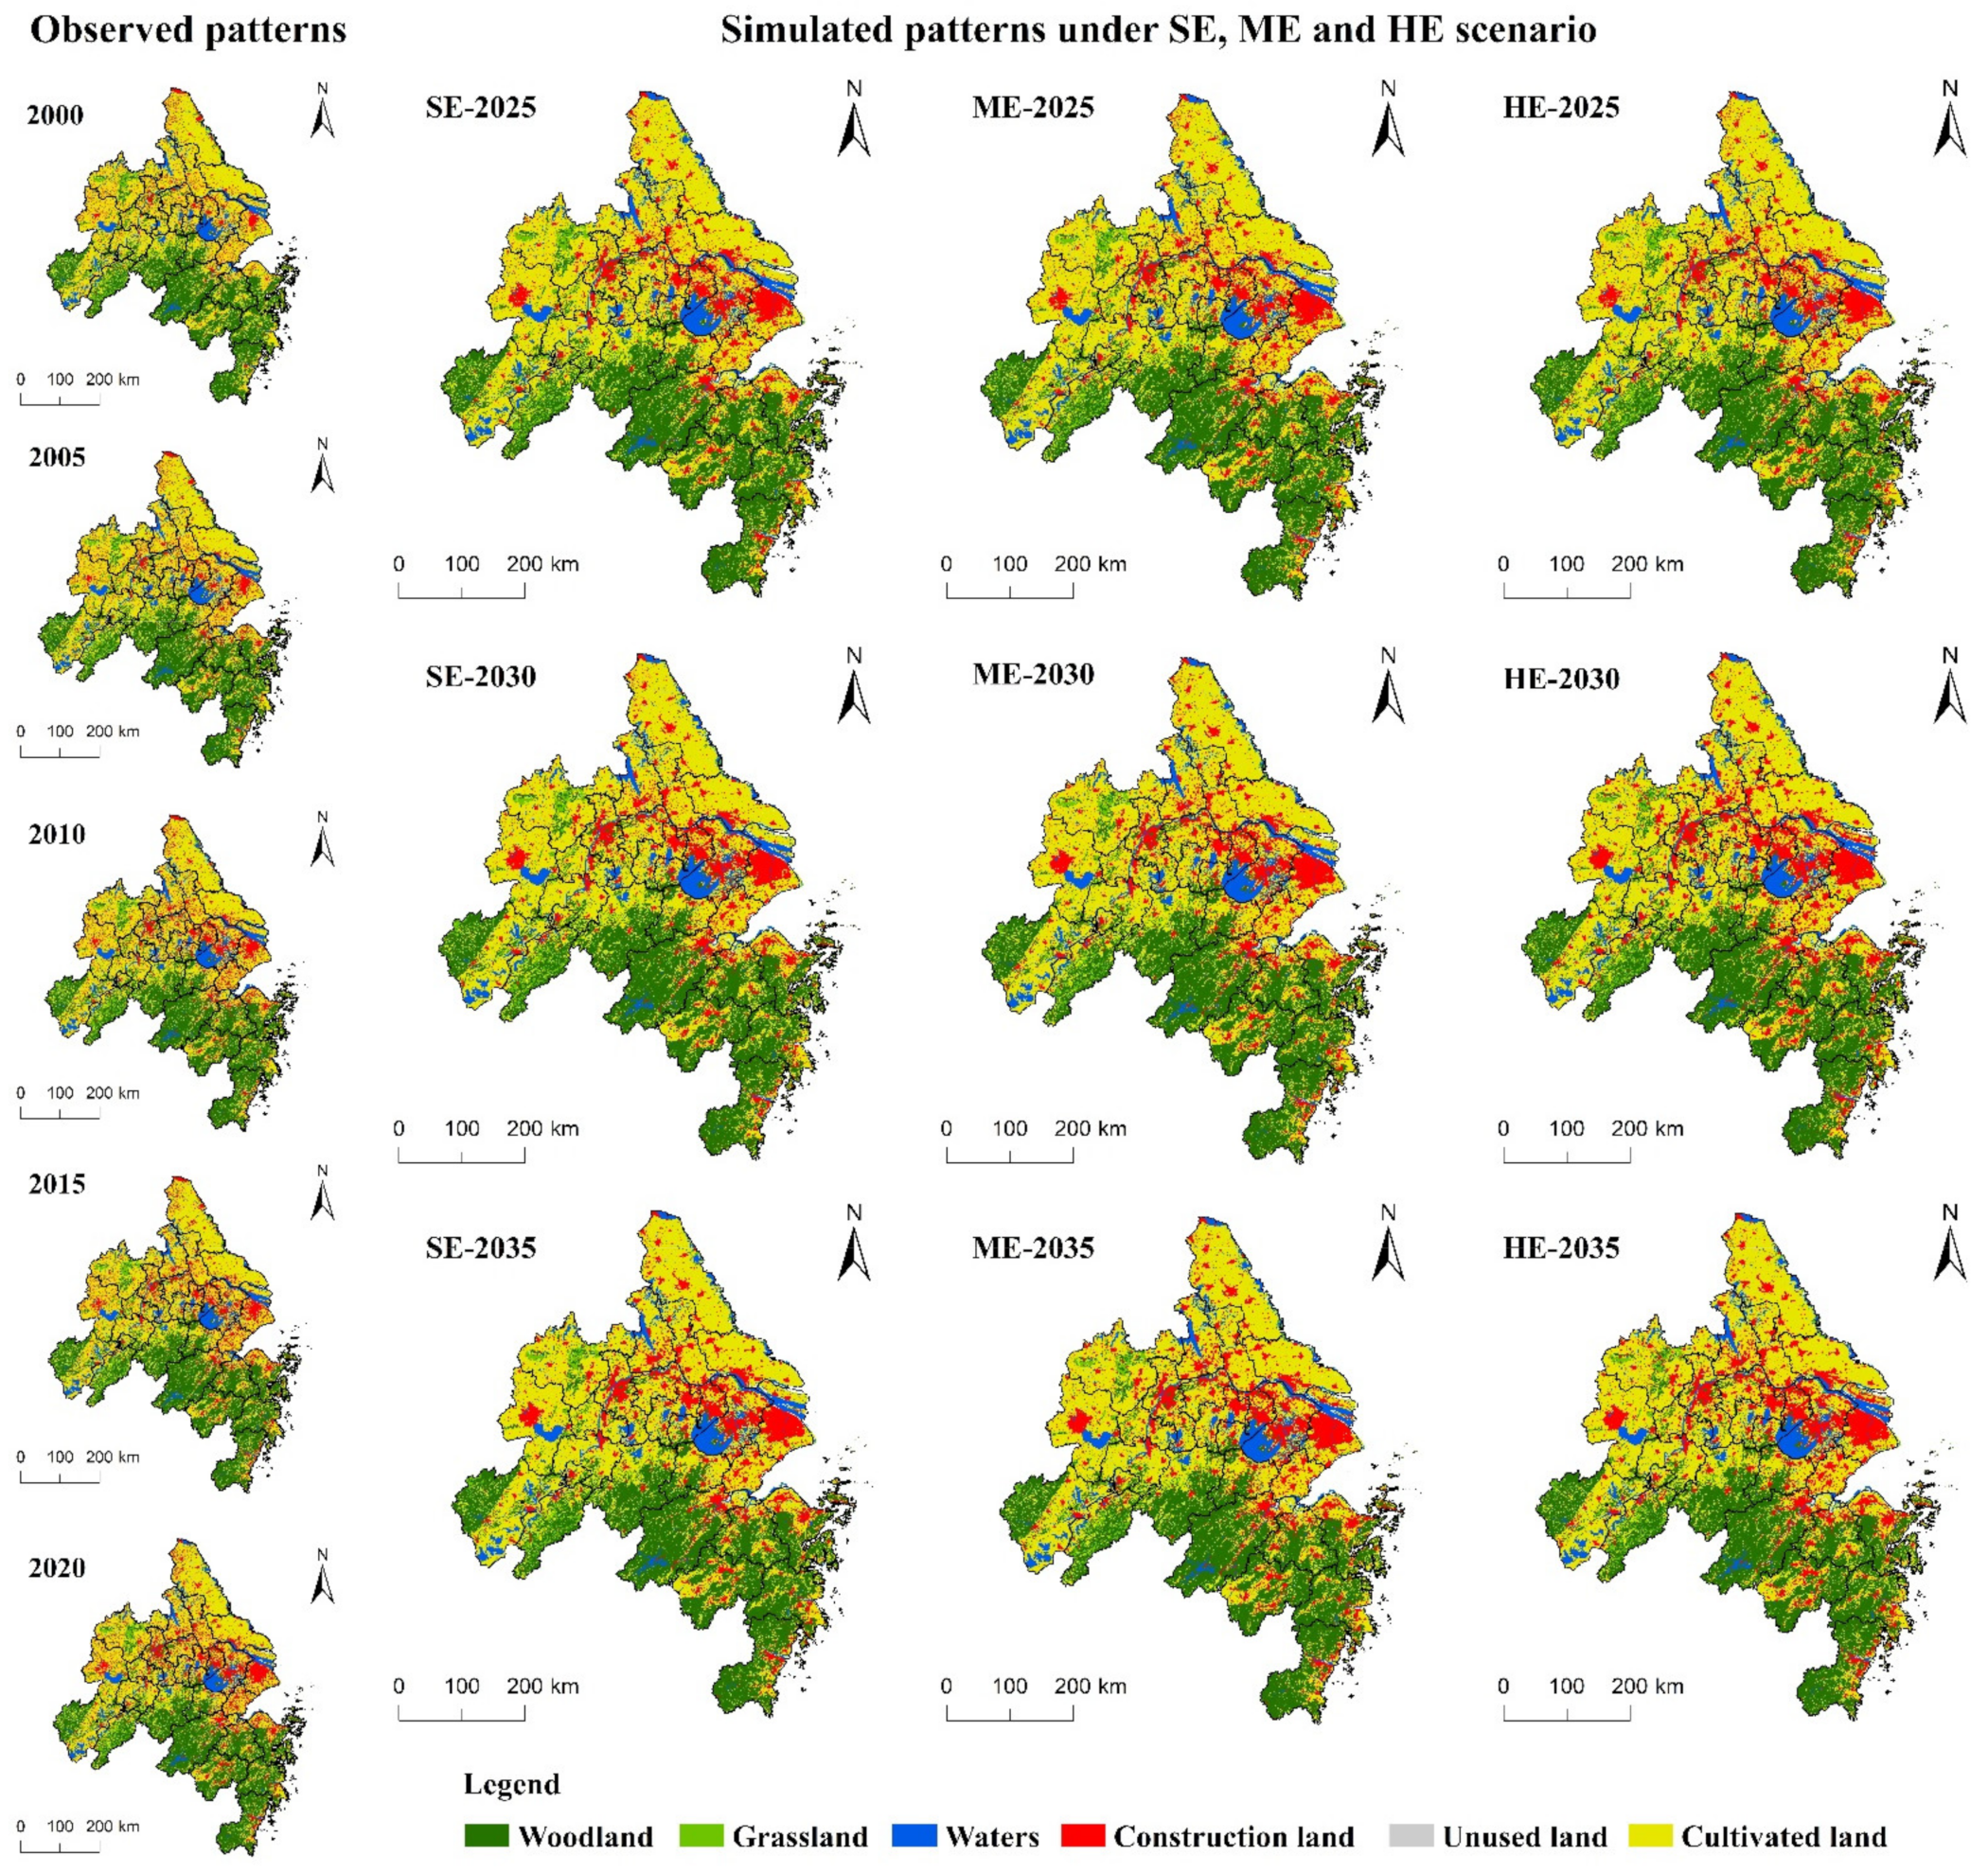
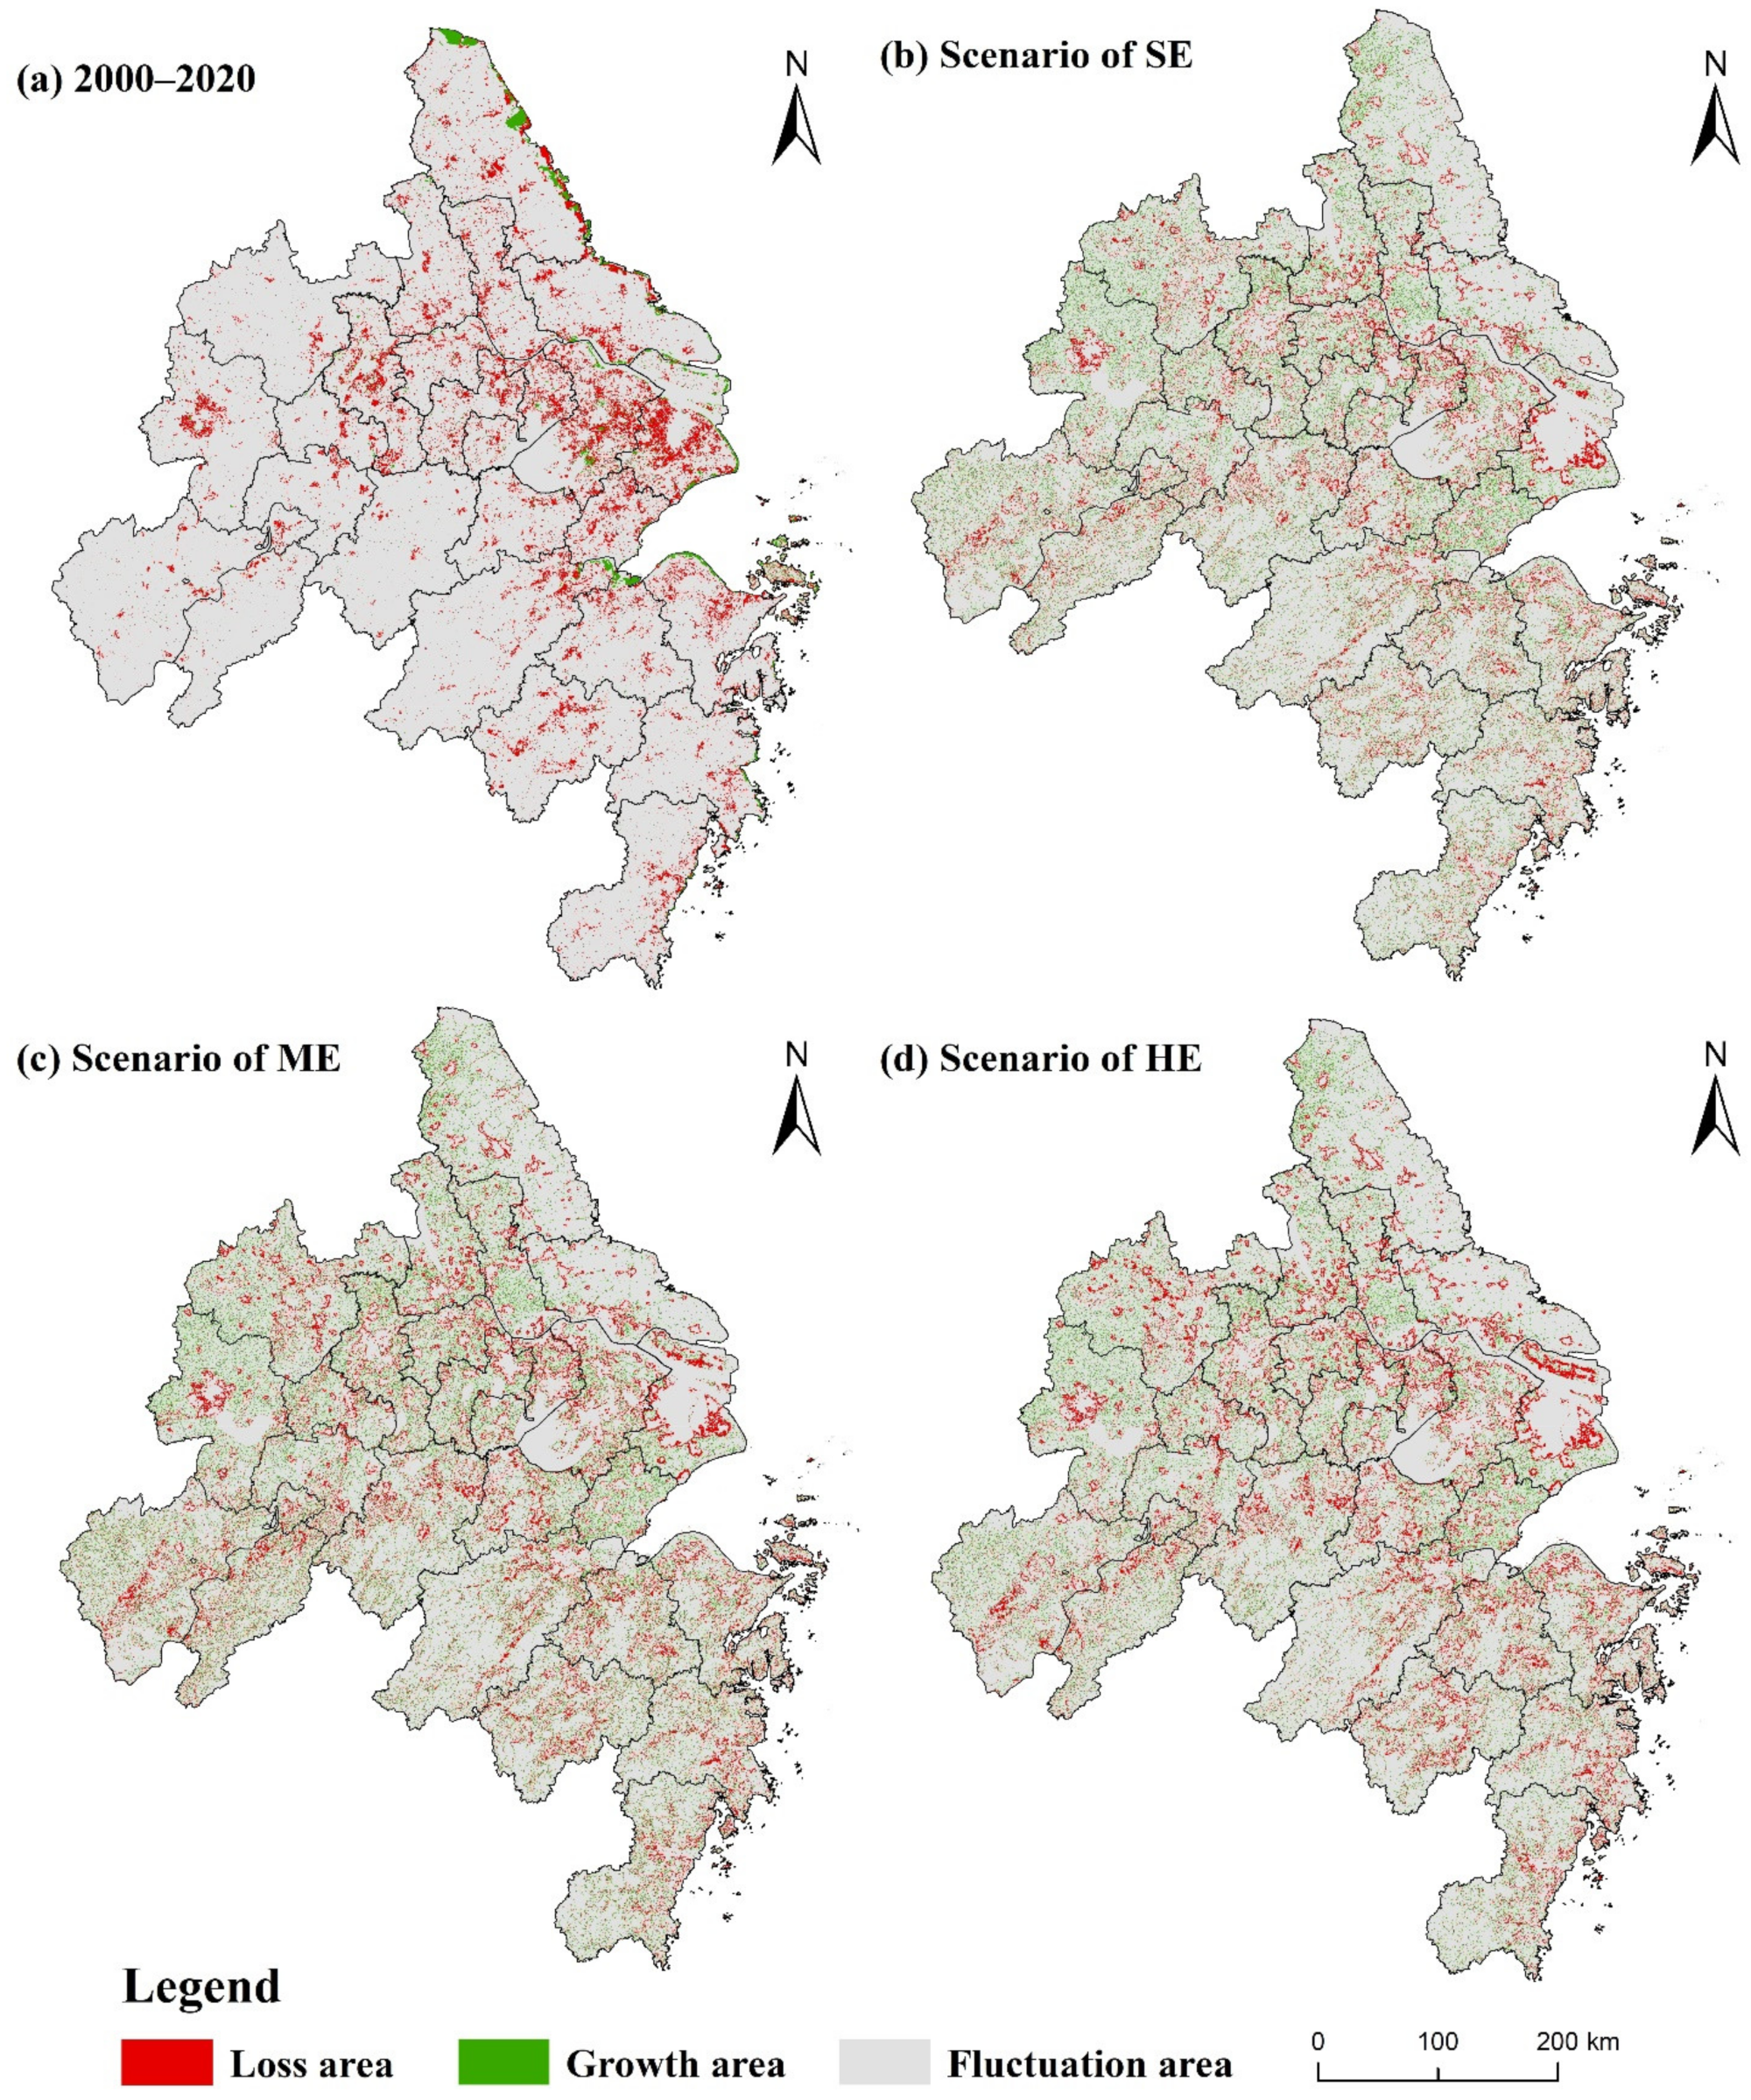
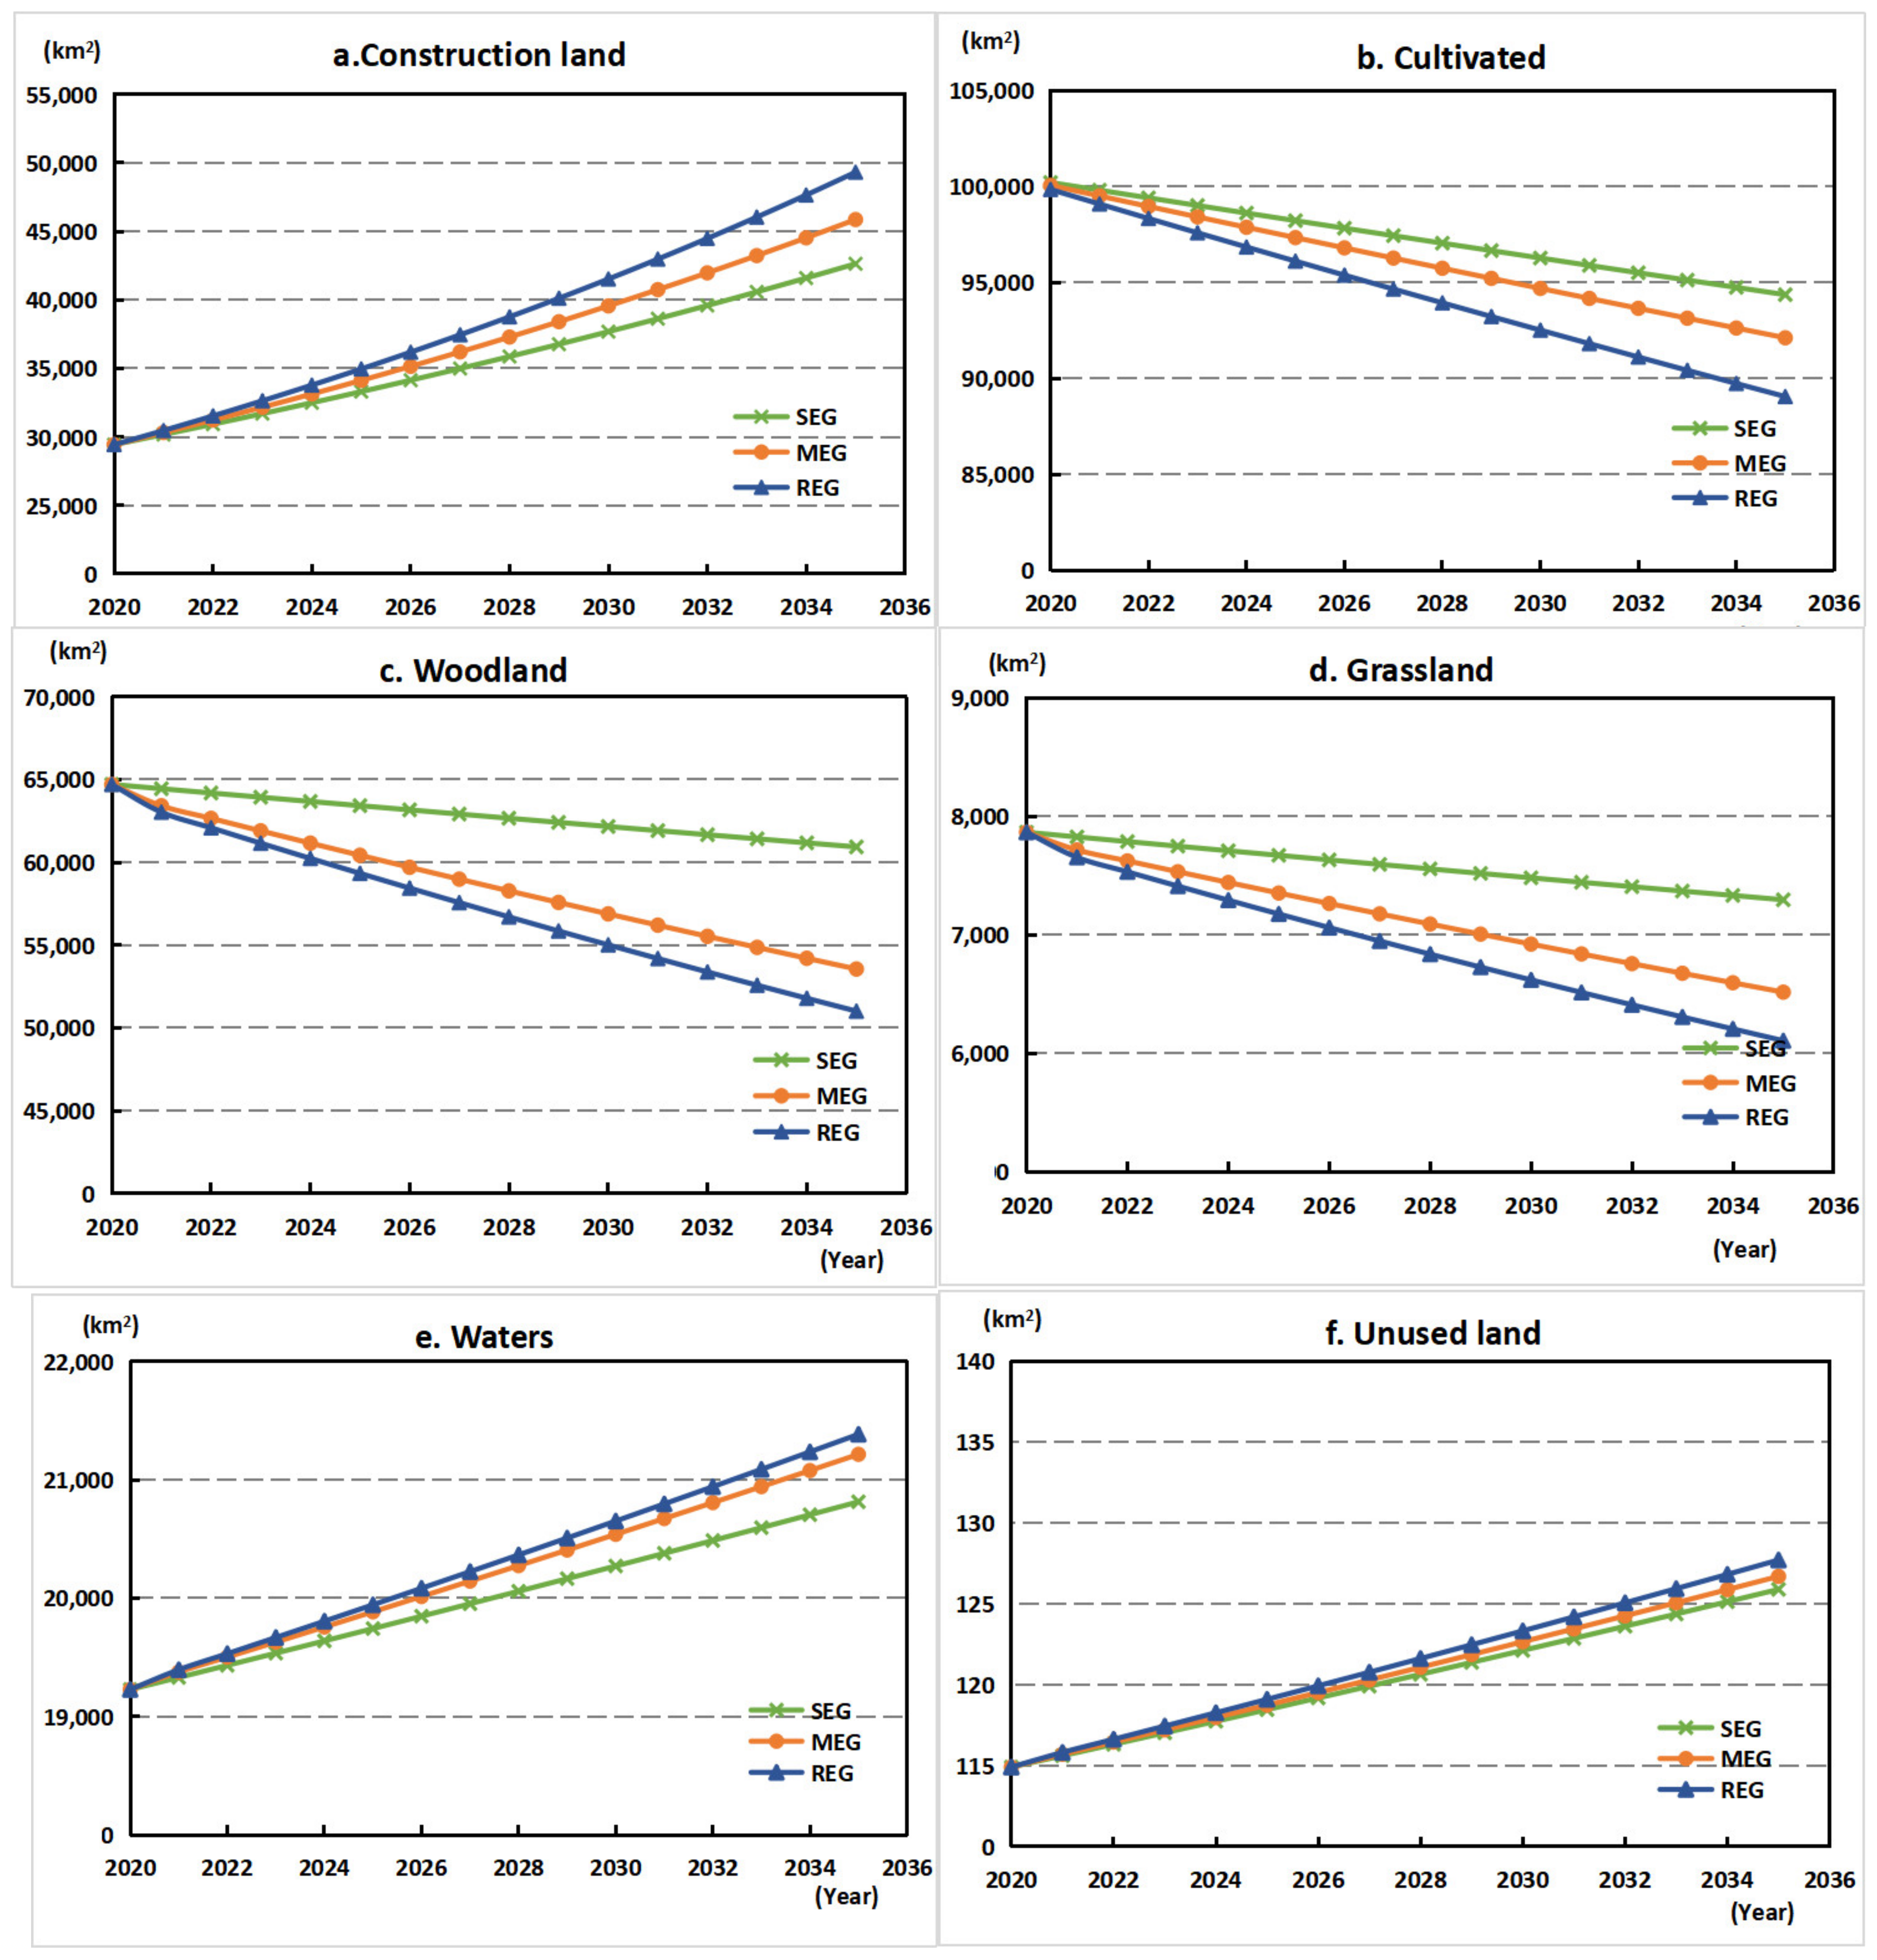
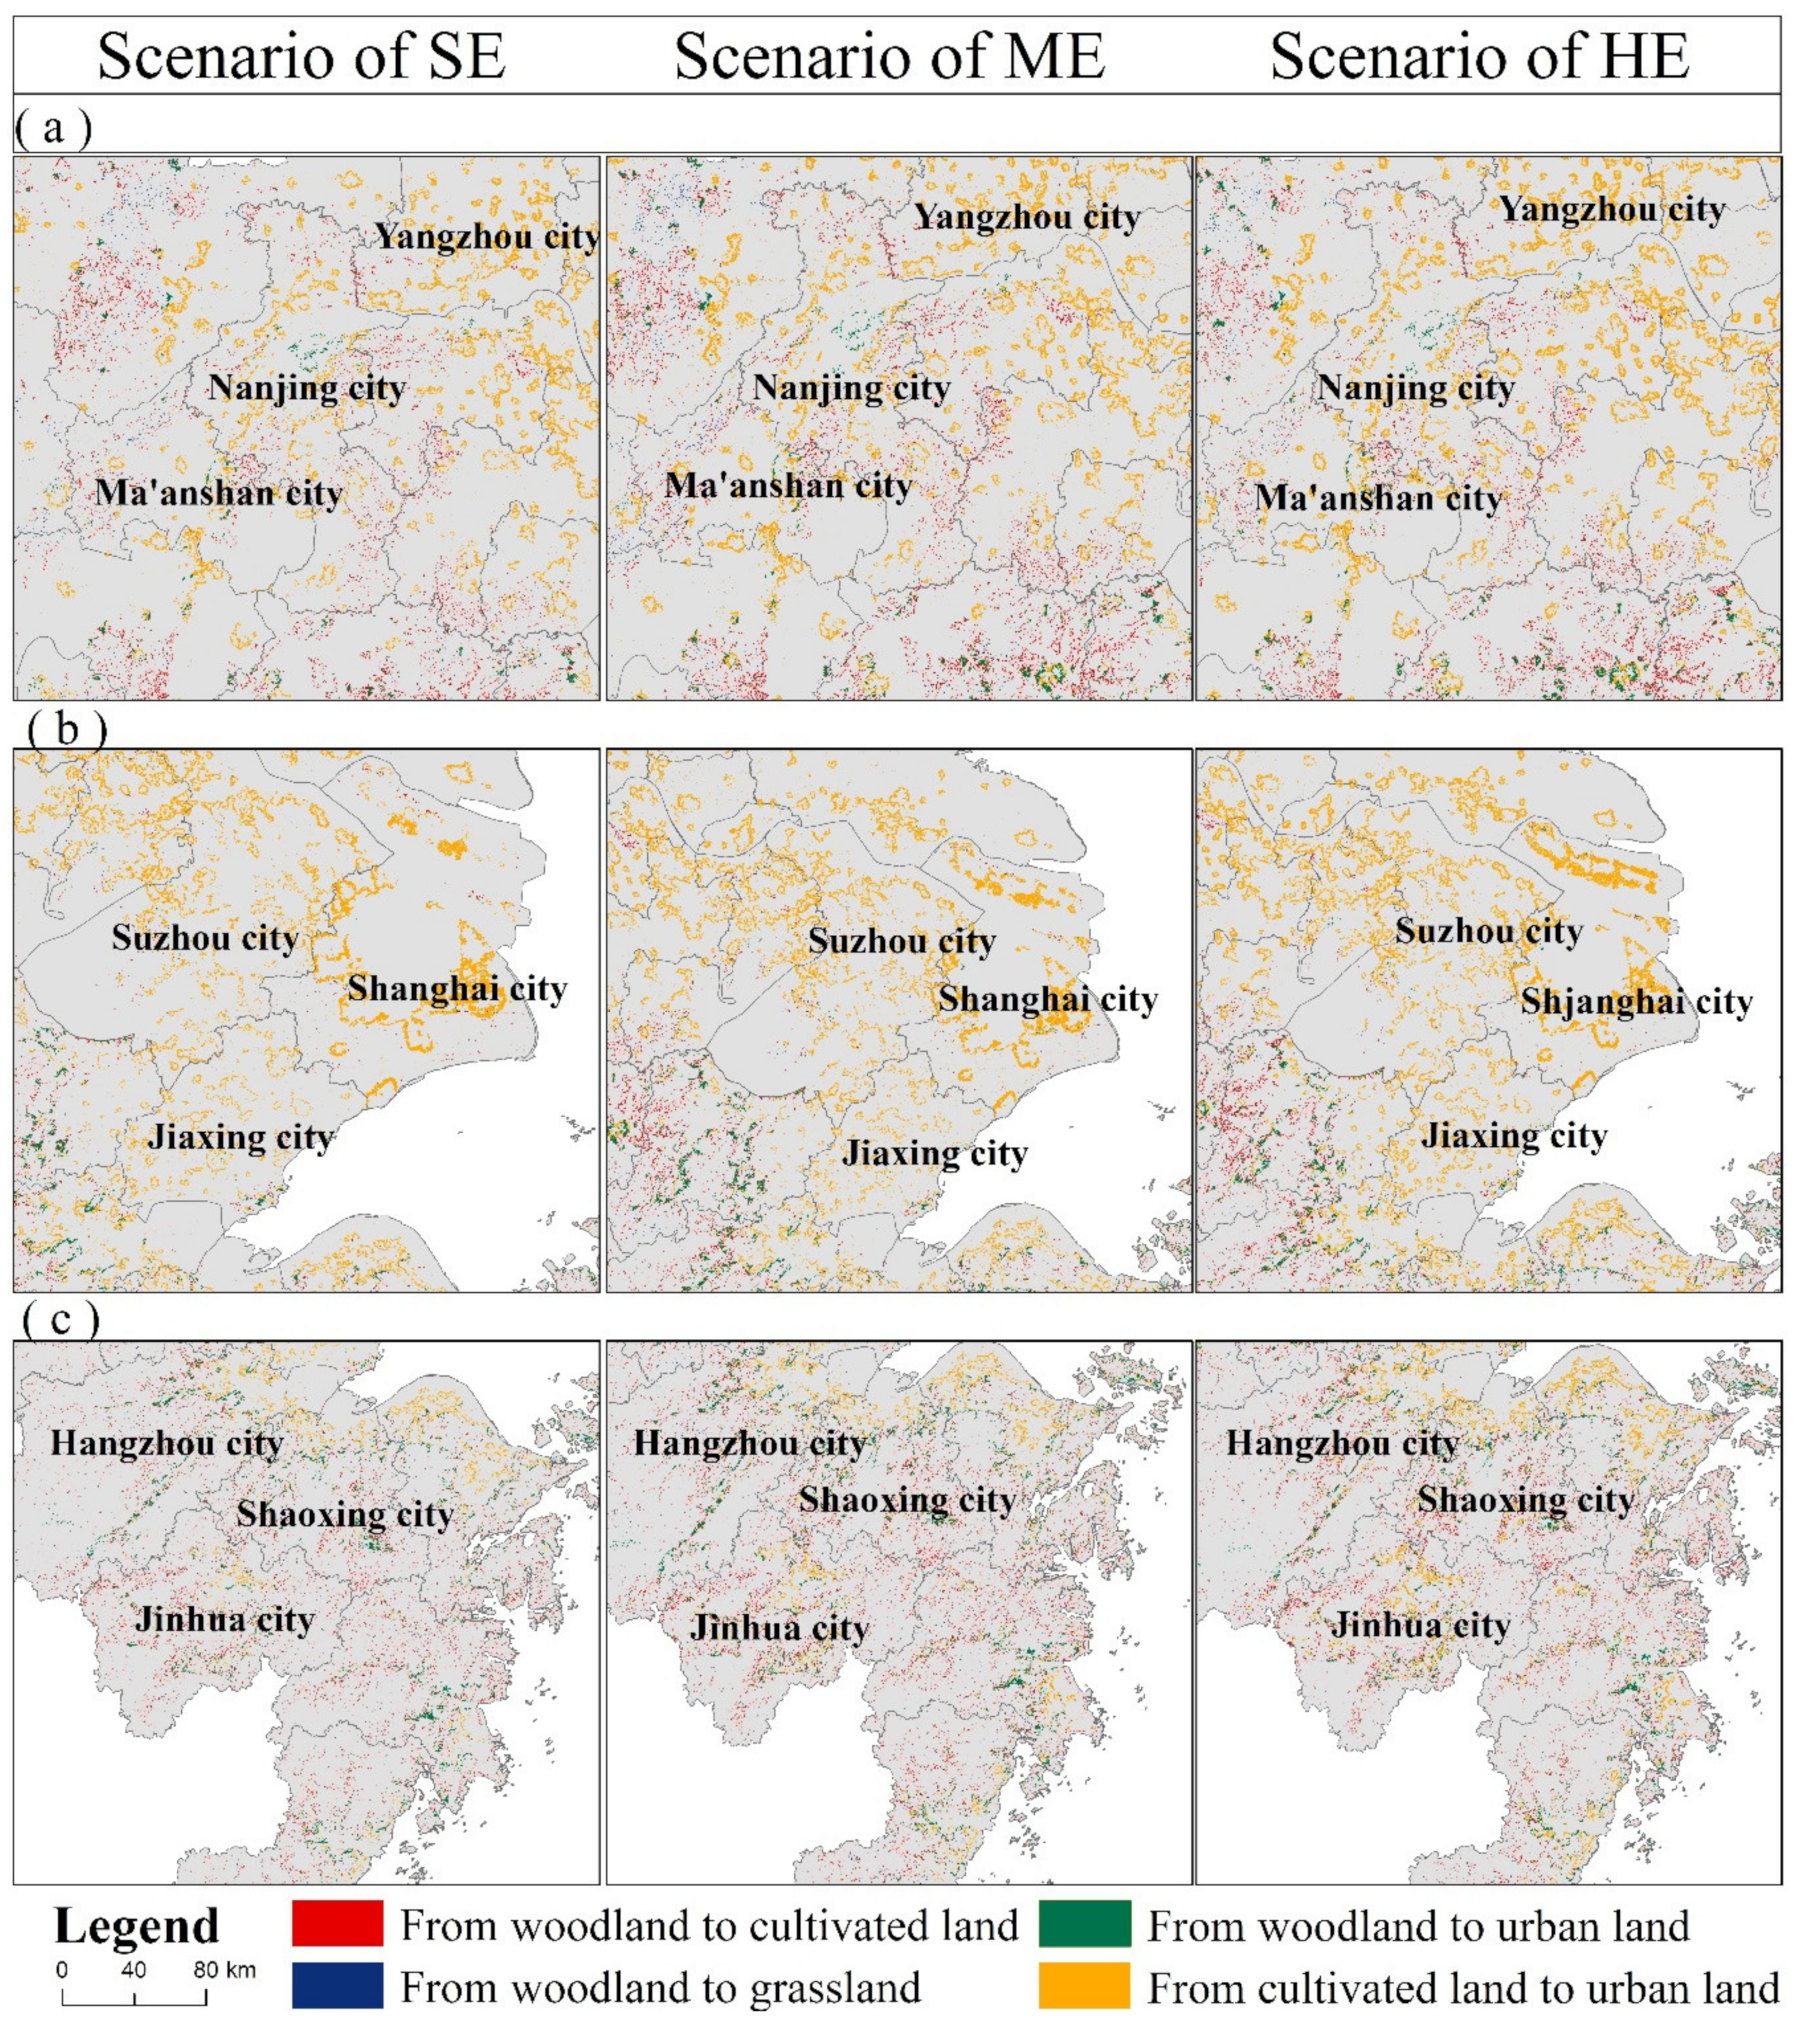
3.1. Changes in Land Use
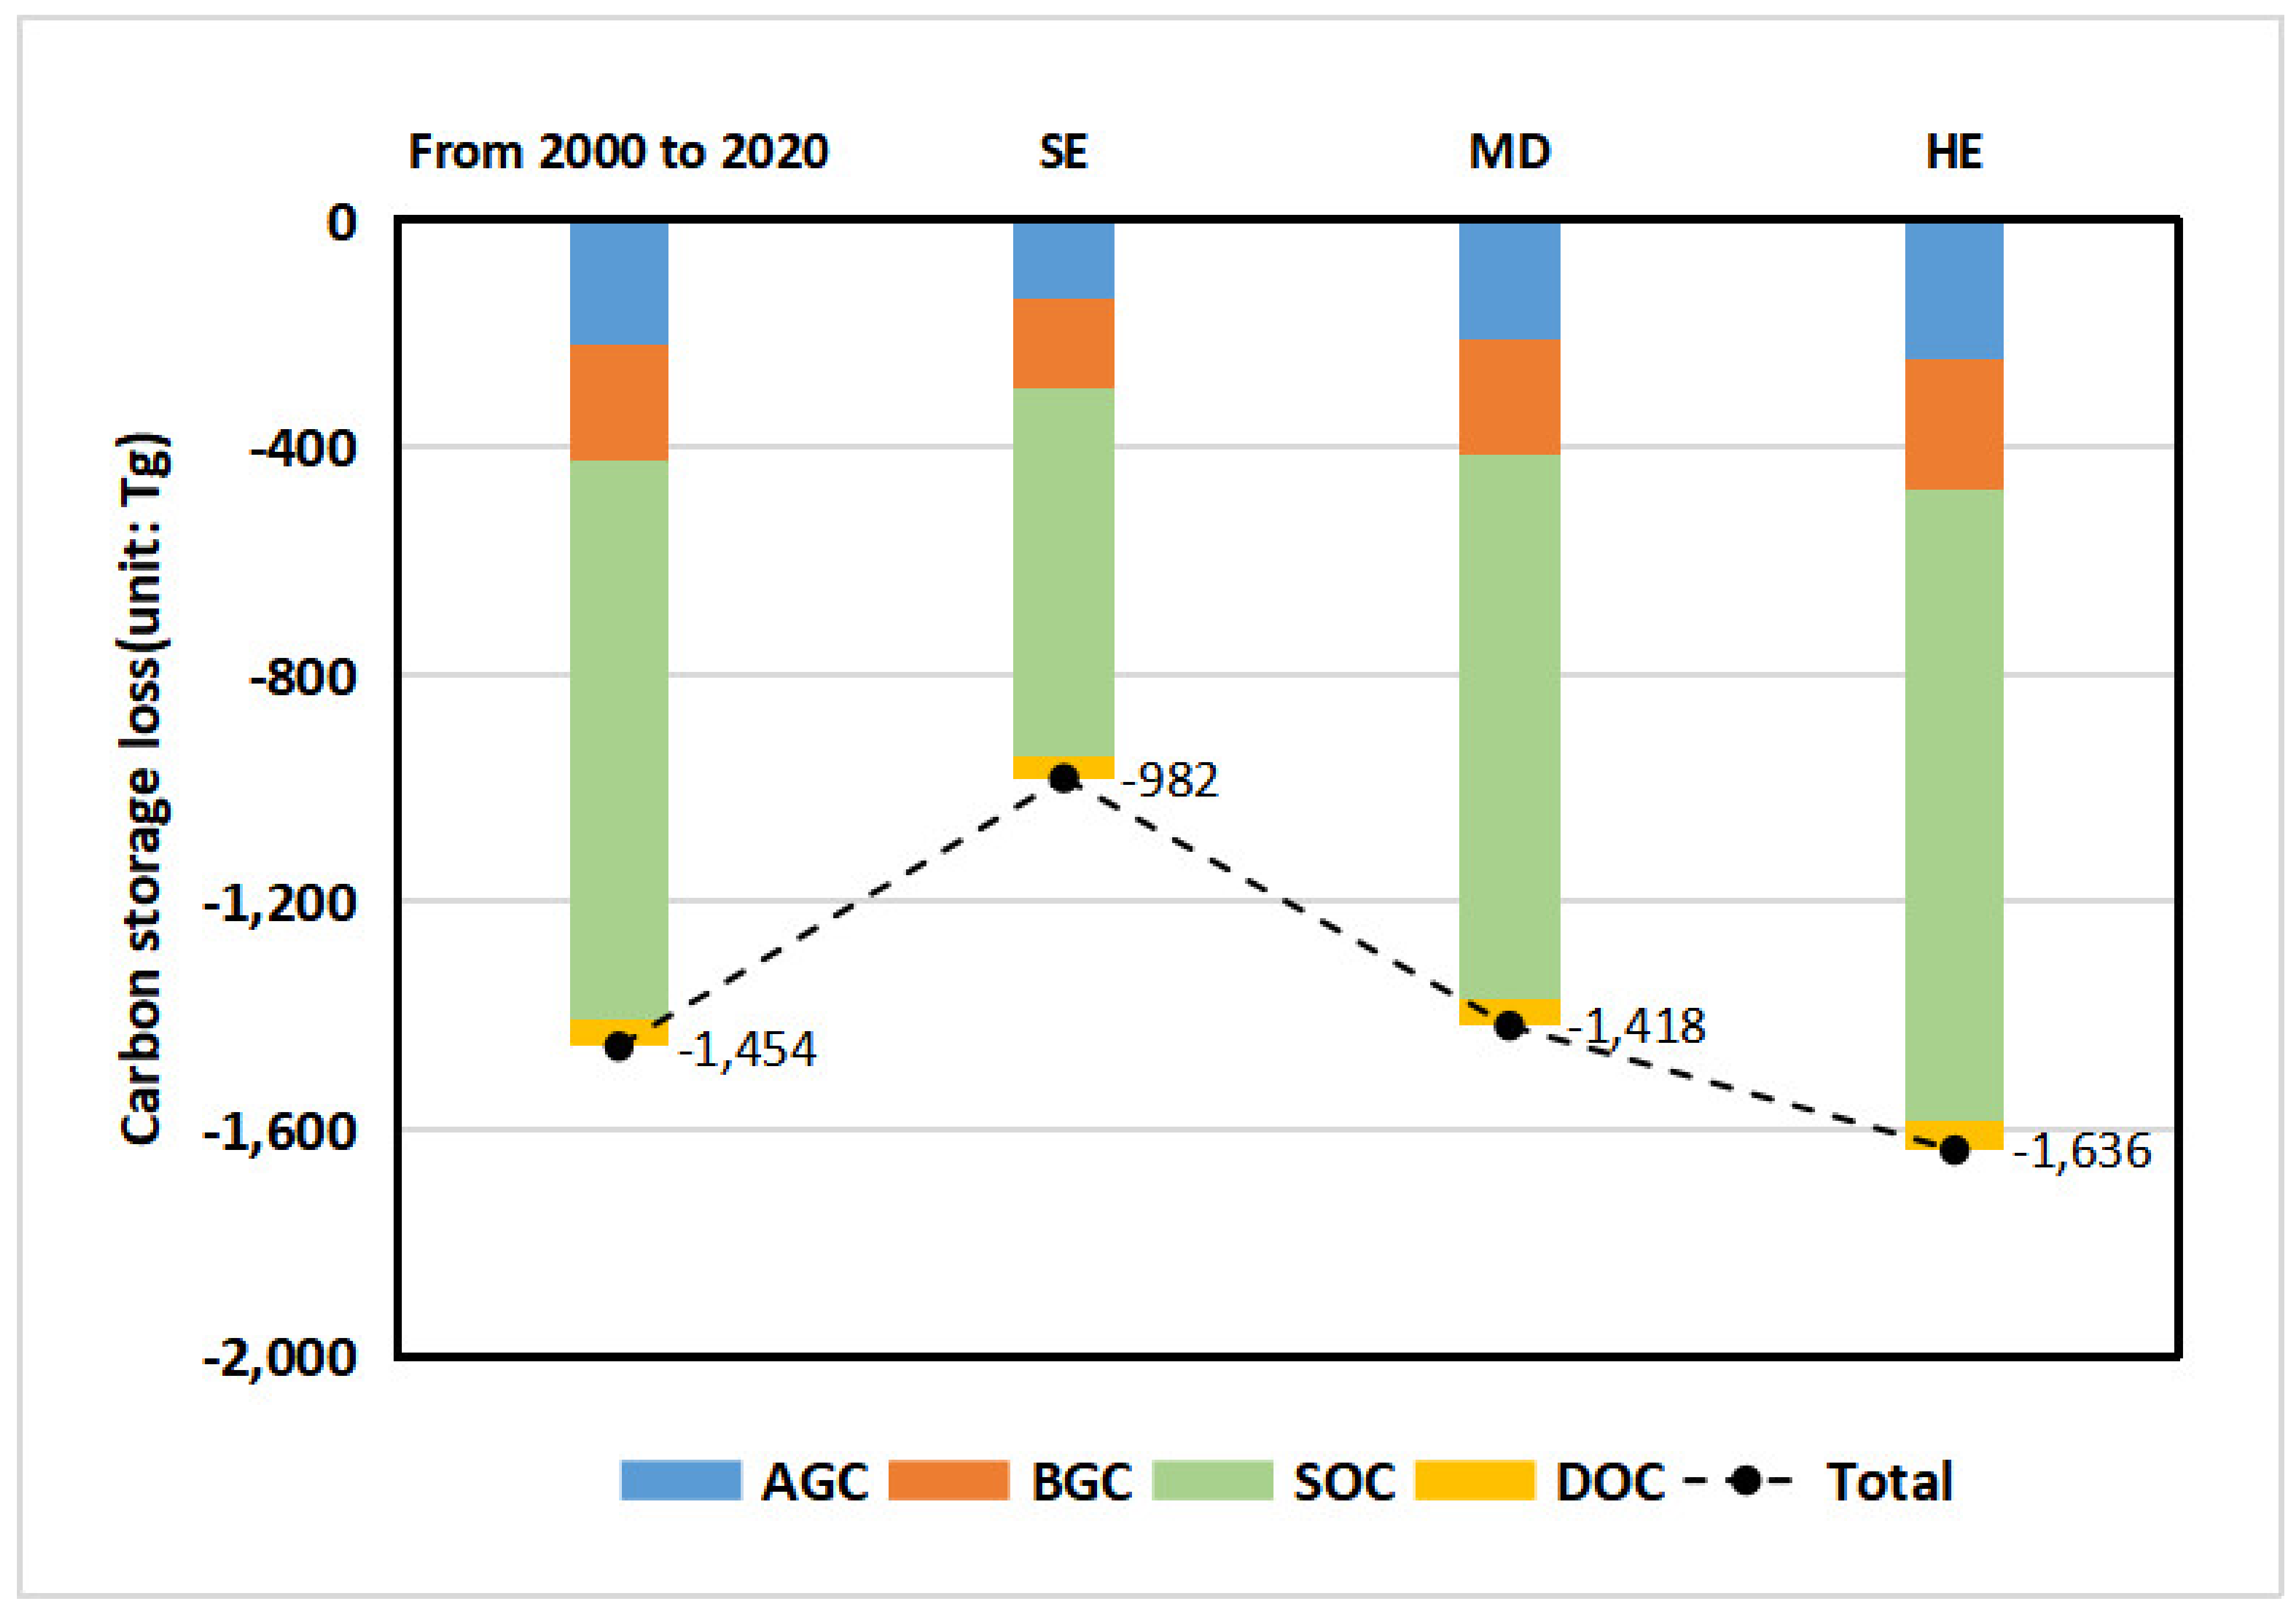
3.2. Potential Impact on Carbon Storage
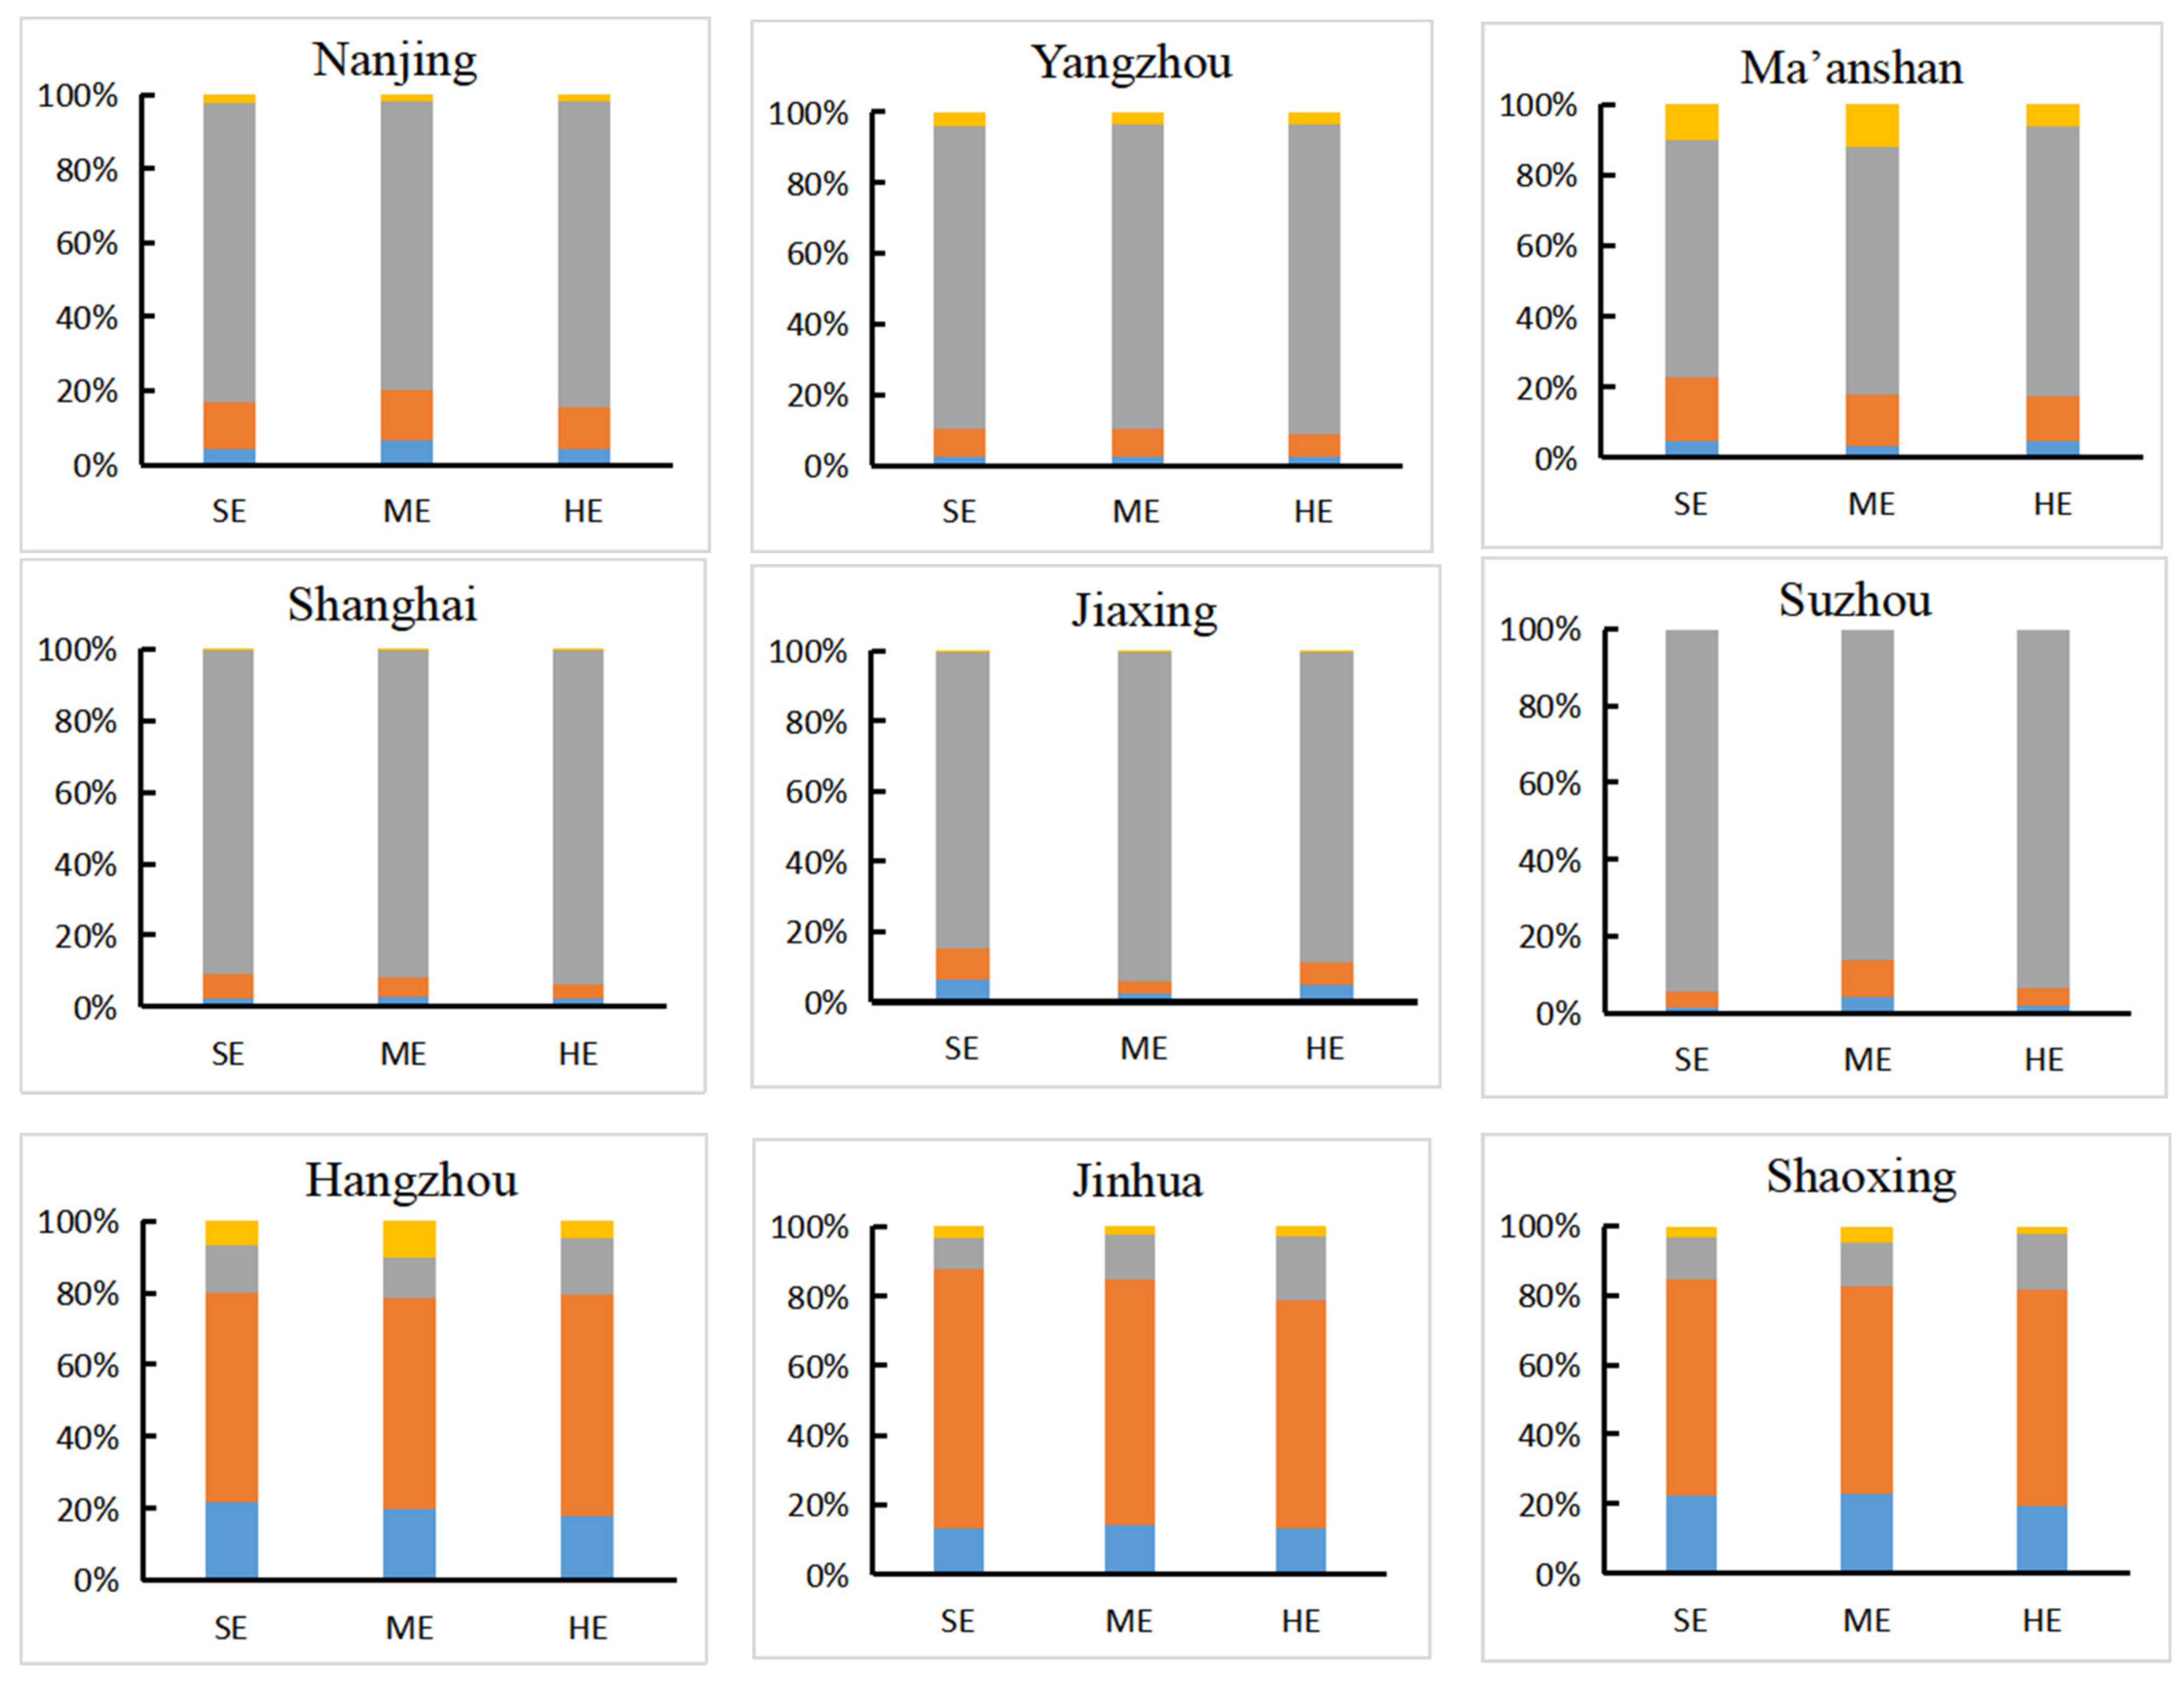
3.3. Divergent Causes of Carbon Loss
4. Discussion
4.1. Land-Use Change and Carbon Storage State
4.2. The Comprehensive Influence on Carbon Storage
4.3. Strengths and Limitations
5. Conclusions
Author Contributions
Funding
Institutional Review Board Statement
Informed Consent Statement
Data Availability Statement
Acknowledgments
Conflicts of Interest
References
- Dybala, K.E.; Steger, K.; Walsh, R.G.; Smart, D.R.; Gardali, T.; Seavy, N.E. Optimizing carbon storage and biodiversity co-benefits in reforested riparian zones. J. Appl. Ecol. 2019, 56, 343–353. [Google Scholar] [CrossRef]
- Molotoks, A.; Stehfest, E.; Doelman, J.; Albanito, F.; Fitton, N.; Dawson, T.P.; Smith, P. Global projections of future cropland expansion to 2050 and direct impacts on biodiversity and carbon storage. Glob. Chang. Biol. 2018, 24, 5895–5908. [Google Scholar] [CrossRef] [Green Version]
- Intergovernmental Panel on Climate Change. Land Use, Land-Use Change and Forestry; Cambridge University Press: Cambridge, UK, 2000; p. 375. [Google Scholar]
- Liu, Y.S.; Fang, F.; Li, Y.H. Key issues of land use in China and implications for policy making. Land Use Policy 2014, 40, 6–12. [Google Scholar] [CrossRef]
- Liu, Y.; Yang, S.; Chen, J.N. Modeling environmental impacts of urban expansion: A systematic method for dealing with uncertainties. Environ. Sci. Technol. 2012, 46, 8236–8243. [Google Scholar] [CrossRef]
- Liu, X.; Pei, F.; Wen, Y.; Li, X.; Wang, S.; Wu, C.; Cai, Y.; Wu, J.; Chen, J.; Feng, K.; et al. Global urban expansion offsets climate-driven increases in terrestrial net primary productivity. Nat. Commun. 2019, 10, 5558. [Google Scholar] [CrossRef] [PubMed] [Green Version]
- Liu, W.; Zhan, J.; Zhao, F.; Yan, H.; Zhang, F.; Wei, X. Impacts of urbanization-induced land-use changes on ecosystem services: A case study of the Pearl River Delta metropolitan Region, China. Ecol. Indic. 2019, 98, 228–238. [Google Scholar] [CrossRef]
- Wu, P.J.; Liu, X.P.; Li, X.; Chen, Y.M. Impact of urban expansion on carbon storage in terrestrial ecosystems based on InVEST model and CA: A case study of Guangdong Province, China. Geogr. Geo-Inf. Sci. 2016, 32, 22–28. [Google Scholar]
- De Carvalho, R.M.; Szlafsztein, C.F. Urban vegetation loss and ecosystem services: The influence on climate regulation and noise and air pollution. Environ. Pollut. 2019, 245, 844–852. [Google Scholar] [CrossRef] [PubMed]
- Chuai, X.; Huang, X.; Wang, W.; Wu, C.; Zhao, R. Spatial simulation of land use based on terrestrial ecosystem carbon storage in Coastal Jiangsu, China. Sci. Rep. 2014, 4, 5667. [Google Scholar] [CrossRef] [Green Version]
- Castillo, J.A.A.; Apan, A.A.; Maraseni, T.N.; Salmo, S.G., III. Estimation and mapping of above-ground biomass of mangrove forests and their replacement land uses in the Philippines using Sentinel imagery. ISPRS-J. Photogramm. Remote Sens. 2017, 134, 70–85. [Google Scholar] [CrossRef]
- Apan, A.; Suarez, L.A.; Maraseni, T.; Castillo, J.A. The rate, extent and spatial predictors of forest loss (2000–2012) in the terrestrial protected areas of the Philippines. Appl. Geogr. 2017, 81, 32–42. [Google Scholar] [CrossRef]
- Cao, Q.W.; Gu, C.L.; Guan, W.H. China’s urbanization SD modeling and simulation based on land use. J. Nat. Resour. 2020, 4, 1062–1084. [Google Scholar]
- Verburg, P.H.; Schot, P.P.; Dijst, M.J.; Veldkamp, A. Land use change modelling: Current practice and research priorities. GeoJournal 2004, 61, 309–324. [Google Scholar] [CrossRef]
- Geng, B.; Zheng, X.Q.; Fu, M.C. Scenario analysis of sustainable intensive land use based on SD model. Sustain. Cities Soc. 2017, 29, 193–202. [Google Scholar] [CrossRef]
- Wu, M.; Ren, X.; Che, Y.; Yang, K. A Coupled SD and CLUE-S Model for Exploring the Impact of Land Use Change on Ecosystem Service Value: A Case Study in Baoshan District, Shanghai, China. Environ. Manag. 2015, 56, 402–409. [Google Scholar] [CrossRef]
- Liu, X.; Liang, X.; Li, X.; Xu, X.; Ou, J.; Chen, Y.; Li, S.; Wang, S.; Pei, F. A future land use simulation model (FLUS) for simulating multiple land use scenarios by coupling human and natural effects. Landsc. Urban Plan. 2017, 168, 94–116. [Google Scholar] [CrossRef]
- Xing, L.; Xue, M.; Hu, M. Dynamic simulation and assessment of the coupling coordination degree of the economy–resource–environment system: Case of Wuhan City in China. J. Environ. Manag. 2019, 230, 474–487. [Google Scholar] [CrossRef] [PubMed]
- Liu, X.; Li, T.; Zhang, S.; Jia, Y.; Li, Y.; Xu, X. The role of land use, construction and road on terrestrial carbon stocks in a newly urbanized area of western Chengdu, China. Landsc. Urban Plan. 2016, 147, 88–95. [Google Scholar] [CrossRef]
- Lawler, J.J.; Lewis, D.J.; Nelson, E.; Plantinga, A.J.; Polasky, S.; Withey, J.C.; Helmers, D.P.; Martinuzzi, S.; Pennington, D.; Radeloff, V.C. Projected land-use change impacts on ecosystem services in the United States. Proc. Natl. Acad. Sci. USA 2014, 111, 7492–7497. [Google Scholar] [CrossRef] [Green Version]
- Jiang, W.; Deng, Y.; Tang, Z.; Lei, X.; Chen, Z. Modelling the potential impacts of urban ecosystem changes on carbon storage under different scenarios by linking the CLUE-S and the InVEST models. Ecol. Model. 2017, 324, 30–40. [Google Scholar] [CrossRef]
- Yang, H.; Huang, J.L.; Liu, D.F. Linking climate change and socioeconomic development to urban land use simulation: Analysis of their concurrent effects on carbon storage. Appl. Geogr. 2020, 15, 102135. [Google Scholar] [CrossRef]
- Tian, G.; Jiang, J.; Yang, Z.; Zhang, Y. The urban growth, size distribution and spatio-temporal dynamic pattern of the Yangtze River Delta megalopolitan region, China. Ecol. Model. 2011, 222, 865–878. [Google Scholar] [CrossRef]
- Li, J.; Guo, X.; Chuai, X.; Xie, F.; Yang, F.; Gao, R.; Ji, X. Reexamine China’s terrestrial ecosystem carbon balance under land use-type and climate change. Land Use Policy 2021, 102, 105275. [Google Scholar] [CrossRef]
- Frank, D.; Reichstein, M.; Bahn, M.; Thonicke, K.; Frank, D.; Mahecha, M.D.; Smith, P.; Van der Velde, M.; Vicca, S.; Babst, F.; et al. Effects of climate extremes on the terrestrial carbon cycle: Concepts, processes and potential future impacts. Glob. Chang. Biol. 2015, 21, 2861–2880. [Google Scholar] [CrossRef] [Green Version]
- Helbig, M.; Chasmer, L.E.; Desai, A.R.; Kljun, N.; Quinton, W.L.; Sonnentag, O. Direct and indirect climate change effects on carbon dioxide fluxes in a thawing boreal forest–wetland landscape. Glob. Chang. Biol. 2017, 23, 3231–3248. [Google Scholar] [CrossRef] [PubMed] [Green Version]
- Schwalm, C.R.; Williams, C.A.; Schaefer, K.; Baldocchi, D.; Black, T.A.; Goldstein, A.H.; Law, B.E.; Oechel, W.C.; Scott, R.L. Reduction in carbon uptake during turn of the century drought in western North America. Nat. Geosci. 2012, 5, 551. [Google Scholar] [CrossRef] [Green Version]
- Forrester, J.W. Urban Dynamics; M.I.T Press: Cambridge, MA, USA, 1969. [Google Scholar]
- Zhou, L.; Chen, G.Y. China’s total grain demand will peak in 2030. China Economic Times, 1 December 2016. [Google Scholar]
- Li, X.; Chen, G.Z.; Liu, X.P.; Liang, X.; Wang, S.J.; Chen, Y.M.; Pei, F.S.; Xu, X.C. A new global land-use and land-cover change product at a 1-km resolution for 2010 to 2100 based on human–environment interactions. Ann. Assoc. Am. Geogr. 2017, 107, 1040–1059. [Google Scholar] [CrossRef]
- Turner, D.P.; Koerper, G.J.; Harmon, M.E.; Lee, J.J. A carbon budget for forests of the conterminous United States. Ecol. Appl. 1995, 5, 421–436. [Google Scholar] [CrossRef]
- Fang, J.; Chen, A.; Peng, C.; Zhao, S.; Ci, L. Changes in forest biomass carbon storage in China between 1949 and 1998. Science 2001, 292, 2320–2322. [Google Scholar] [CrossRef]
- Jian, N. Carbon storage in terrestrial ecosystems of China: Estimates at different spatial resolutions and their responses to climate change. Clim. Chang. 2001, 49, 339–340. [Google Scholar]
- Wang, S.Q.; Zhou, C.H.; Li, K.R.; Zhu, S.L.; Huang, F.H. Estimation of soil organic carbon reservoir in China. J. Geogr. Sci. 2001, 11, 3–13. [Google Scholar]
- Chuai, X.; Huang, X.; Lai, L.; Wang, W.; Peng, J.; Zhao, R. Land use structure optimization based on carbon storage in several regional terrestrial ecosystems across China. Environ. Sci. Policy 2013, 25, 50–61. [Google Scholar] [CrossRef]
- Fan, J.; Zhong, H.; Harris, W.; Yu, G.; Wang, S.; Hu, Z.; Yue, Y. Carbon storage in the grasslands of China based on field measurements of above- and below-ground biomass. Clim. Chang. 2008, 86, 375–396. [Google Scholar] [CrossRef]
- Zhang, F.; Zhan, J.; Zhang, Q.; Yao, L.; Liu, W. Impacts of land use/cover change on terrestrial carbon stocks in Uganda. Phys. Chem. Earth Parts A/B/C 2017, 101, 195–203. [Google Scholar] [CrossRef]
- Bai, C.; Zhang, Q. Research on China’s Economic Growth Potential; Routledger: Oxford, UK, 2017; pp. 4–29. [Google Scholar]
- Lu, Y.; Cai, F. From demographic dividend to reform dividend: A simulation based on China’s potential growth rate. World Econ. 2016, 39, 3–23. [Google Scholar]
- Cai, F.; Lu, Y. Take-off, persistence and sustainability: The demographic factor in Chinese growth. Asia Pac. Policy Stud. 2016, 3, 203–225. [Google Scholar] [CrossRef]
- Zuang, J.; Vandenberg, P.; Huang, Y. Growing beyond the Low-Cost Advantage: How the People’s Republic of China Can Avoid the Middle-Income Trap; Asian Development Bank: Mandaluyong City, Philippines, 2012. [Google Scholar]
- United Nations. Department of Economic and Social Affairs, Population Division. In World Population Prospects 2019; United Nations: New York, NY, USA, 2019. [Google Scholar]
- World Bank Population Estimates and Projections. Available online: https://databank.worldbankorg/source/population-estimates-and-projections (accessed on 5 January 2019).
- Tang, H. China’s grain self-sufficiency strategy in the new situation. Issues Agric. Econ. 2014, 35, 4–10. [Google Scholar]
- Chen, B.M.; Zhou, X.P. Analysis on the grain self-sufficient ratio and the safe baseline of cultivated land in China. Econ. Geogr. 2005, 25, 145–148. [Google Scholar]
- Huang, J.K. Forty years of China’s agricultural development and reform and the way forward in the future. J. Agrotech. Econ. 2018, 3, 4–15. [Google Scholar]
- Ren, Z.P.; Xiong, C.; Bai, X.S. China’s Housing Stock Report: 2019. Available online: https://mp.weixin.qq.com/s/8eFysYdiqXpMAIuC2rIqw (accessed on 16 August 2019).
- Wang, Q.; Zhang, F. The effects of trade openness on decoupling carbon emissions from economic growth-evidence from 182 countries. J. Clean. Prod. 2020, 279, 123838. [Google Scholar] [CrossRef] [PubMed]
- Yao, H. Characterizing land use changes in 1990–2010 in the coastal zone of Nantong, Jiangsu province, China. Ocean. Coast Manag. 2013, 71, 108–115. [Google Scholar] [CrossRef]
- Ellis, J.T.; Spruce, J.P.; Swann, R.A.; Smoot, J.C.; Hilbert, K.W. An assessment of coastal land-use and land-cover change from 1974–2008 in the vicinity of Mobile Bay, Alabama. J. Coast. Conserv. 2011, 15, 139–149. [Google Scholar] [CrossRef]
- He, J.; Huang, J.; Li, C. The evaluation for the impact of land use change on habitat quality: A joint contribution of cellular automata scenario simulation and habitat quality assessment model. Research paper. Ecol. Model. 2017, 366, 58–67. [Google Scholar] [CrossRef]
- Sharp, R.; Tallis, H.T.; Ricketts, T.; Guerry, A.D.; Wood, S.A.; Chapin-Kramer, R.; Nelson, E.; Ennaanay, D.; Wolny, S.; Olwero, N.; et al. InVEST3.2.0 User’s Guide; The Natural Capital Project: Stanford, CA, USA, 2015. [Google Scholar]
- Chuai, X.W.; Huang, X.J.; Qi, X.; Li, J.B.; Zuo, T.H.; Lu, Q.L.; Li, J.S.; Wu, C.Y.; Zhao, R.Q. A preliminary study of the carbon emissions reduction effects of land use control. Sci. Rep. 2016, 6, 1–8. [Google Scholar]


| Main Variable | Average Error Rate |
|---|---|
| Urban population scale | 1.27% |
| Rural population scale | 1.36% |
| Urban land Scale | 5.04% |
| Urban industrial land scale | 0.00% |
| Urban residential land scale | 3.55% |
| Land for other tertiary industries | 2.48% |
| Cultivated land scale | −0.18% |
| Woodland scale | 0.09% |
| Grassland scale | 2.22% |
| Waters | 0.16% |
| Types | AGC | BGC | SOC | DOC | Source |
|---|---|---|---|---|---|
| Cultivated land | 17.55 | 11.59 | 80.70 | 2.24 | Fang et al. (2001) [32]; Jian (2001) et al. [33]; Wang et al. 2001 [34]; Chuai et al. (2013) [35] |
| Woodland | 31.83 | 6.37 | 105.77 | 2.94 | |
| Grassland | 14.45 | 17.35 | 88.06 | 2.45 | Fan et al. (2008) [36]; Chuai et al. (2013) [35] |
| Waters | 0 | 0 | 0 | 0 | Jian (2001) [33]; Zhang et al. (2017) [37]; |
| Construction land | 7.61 | 1.52 | 34.33 | 0 | |
| Unused land | 10.36 | 2.07 | 34.42 | 0.96 |
| Control Variable | SE | ME | HE |
|---|---|---|---|
| Primary industry growth rate | 4% | 4.5% | 5% |
| Secondary industry growth rate | 6% | 6.5% | 7% |
| Tertiary industry growth rate | 11% | 11.5% | 12% |
| Family planning impact factor | 1.4 | 1.5 | 1.6 |
| Annual growth of urban housing area per capita | 1.3% | 1.4% | 1.5% |
| Change rate of industrial output value per area (increasing year by year) | 0.10% | 0.11% | 0.12% |
| Grain self-sufficiency rate | 100% | 95% | 90% |
| Annual change rate of per capita forest occupancy | 0.45% | 0.30% | 0.15% |
| Annual growth rate of aquatic product output per unit area of water | 3.00% | 3.20% | 3.40% |
| Annual growth rate of livestock meat production per unit of pasture | 1.20% | 1.40% | 1.60% |
Publisher’s Note: MDPI stays neutral with regard to jurisdictional claims in published maps and institutional affiliations. |
© 2021 by the authors. Licensee MDPI, Basel, Switzerland. This article is an open access article distributed under the terms and conditions of the Creative Commons Attribution (CC BY) license (https://creativecommons.org/licenses/by/4.0/).
Share and Cite
Qiao, W.; Guan, W.; Huang, X. Assessing the Potential Impact of Land Use on Carbon Storage Driven by Economic Growth: A Case Study in Yangtze River Delta Urban Agglomeration. Int. J. Environ. Res. Public Health 2021, 18, 11924. https://doi.org/10.3390/ijerph182211924
Qiao W, Guan W, Huang X. Assessing the Potential Impact of Land Use on Carbon Storage Driven by Economic Growth: A Case Study in Yangtze River Delta Urban Agglomeration. International Journal of Environmental Research and Public Health. 2021; 18(22):11924. https://doi.org/10.3390/ijerph182211924
Chicago/Turabian StyleQiao, Wenyi, Weihua Guan, and Xianjin Huang. 2021. "Assessing the Potential Impact of Land Use on Carbon Storage Driven by Economic Growth: A Case Study in Yangtze River Delta Urban Agglomeration" International Journal of Environmental Research and Public Health 18, no. 22: 11924. https://doi.org/10.3390/ijerph182211924
APA StyleQiao, W., Guan, W., & Huang, X. (2021). Assessing the Potential Impact of Land Use on Carbon Storage Driven by Economic Growth: A Case Study in Yangtze River Delta Urban Agglomeration. International Journal of Environmental Research and Public Health, 18(22), 11924. https://doi.org/10.3390/ijerph182211924