
Caregiver Perceptions of Environmental Facilitators and Barriers to Healthy Eating and Active Living during the Summer: Results from the Project SWEAT Sub-Study

 ,
,
Abstract
1. Introduction
2. Materials and Methods
2.1. Study Design
2.2. Participants and Recruitment
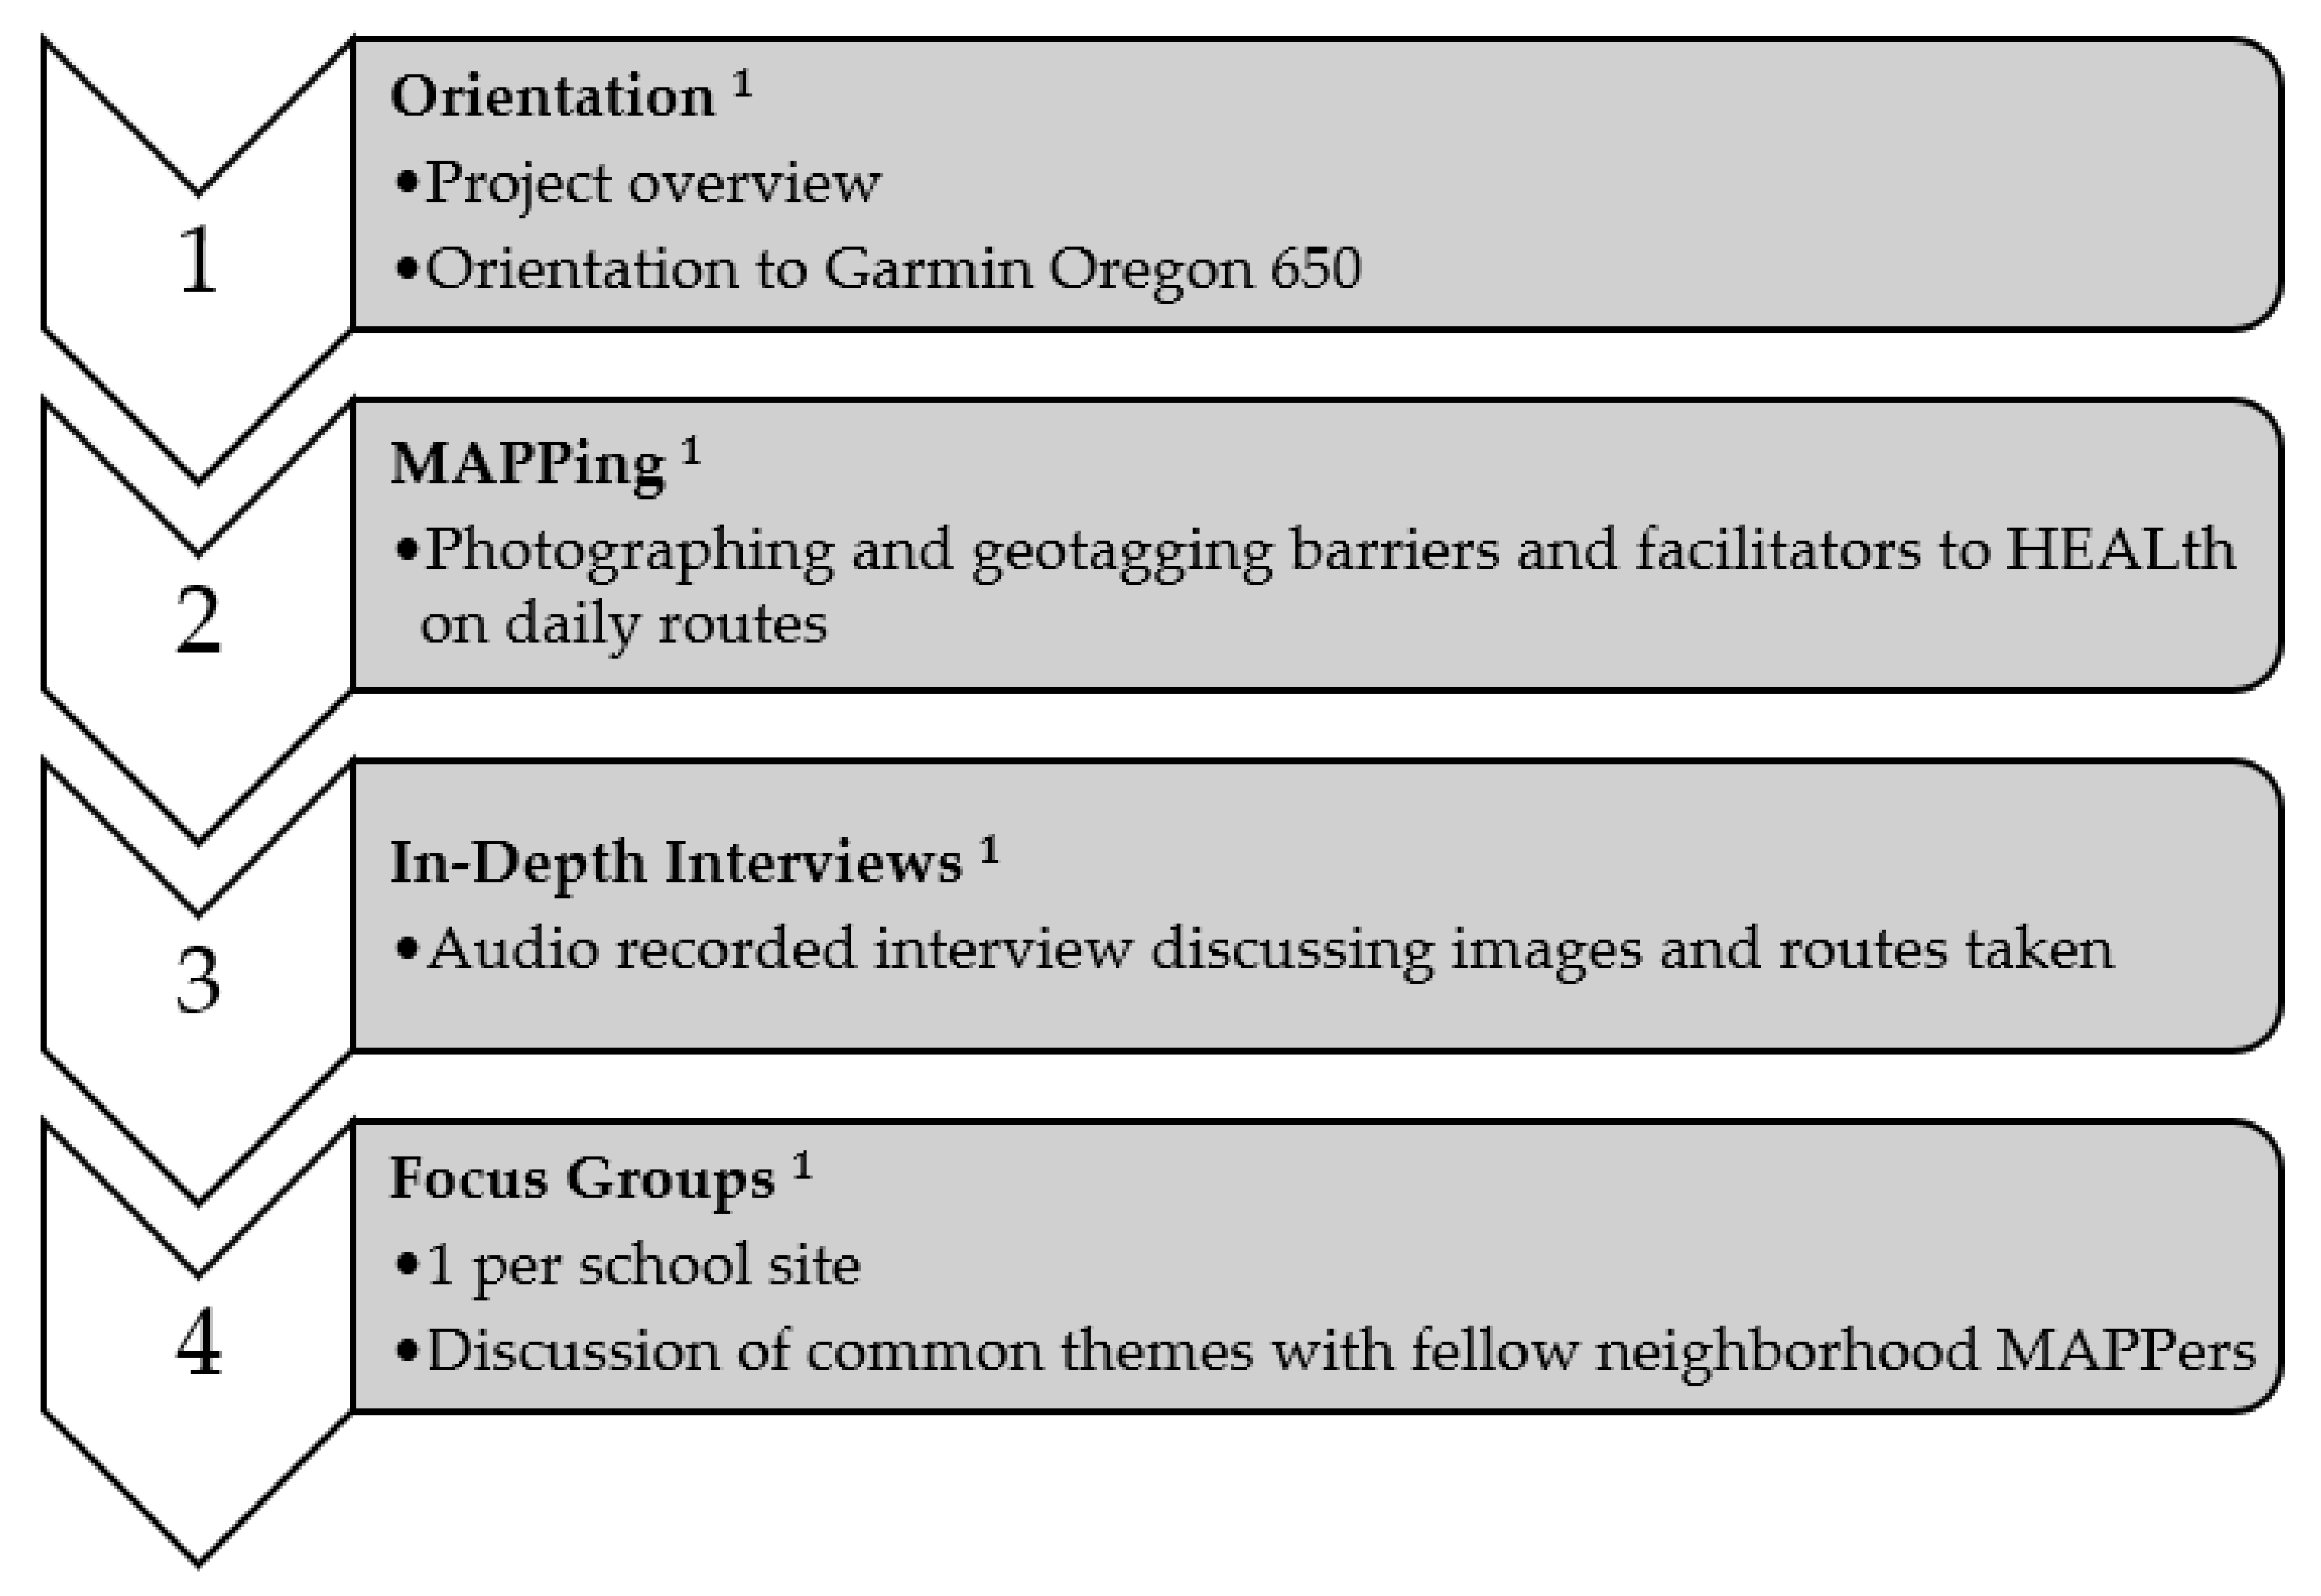
2.3. Data Collection
2.4. Outcome Measures
2.4.1. Household Demographics
2.4.2. Neighborhood-Level Food and Physical Activity Environment
2.5. Data Analysis
3. Results
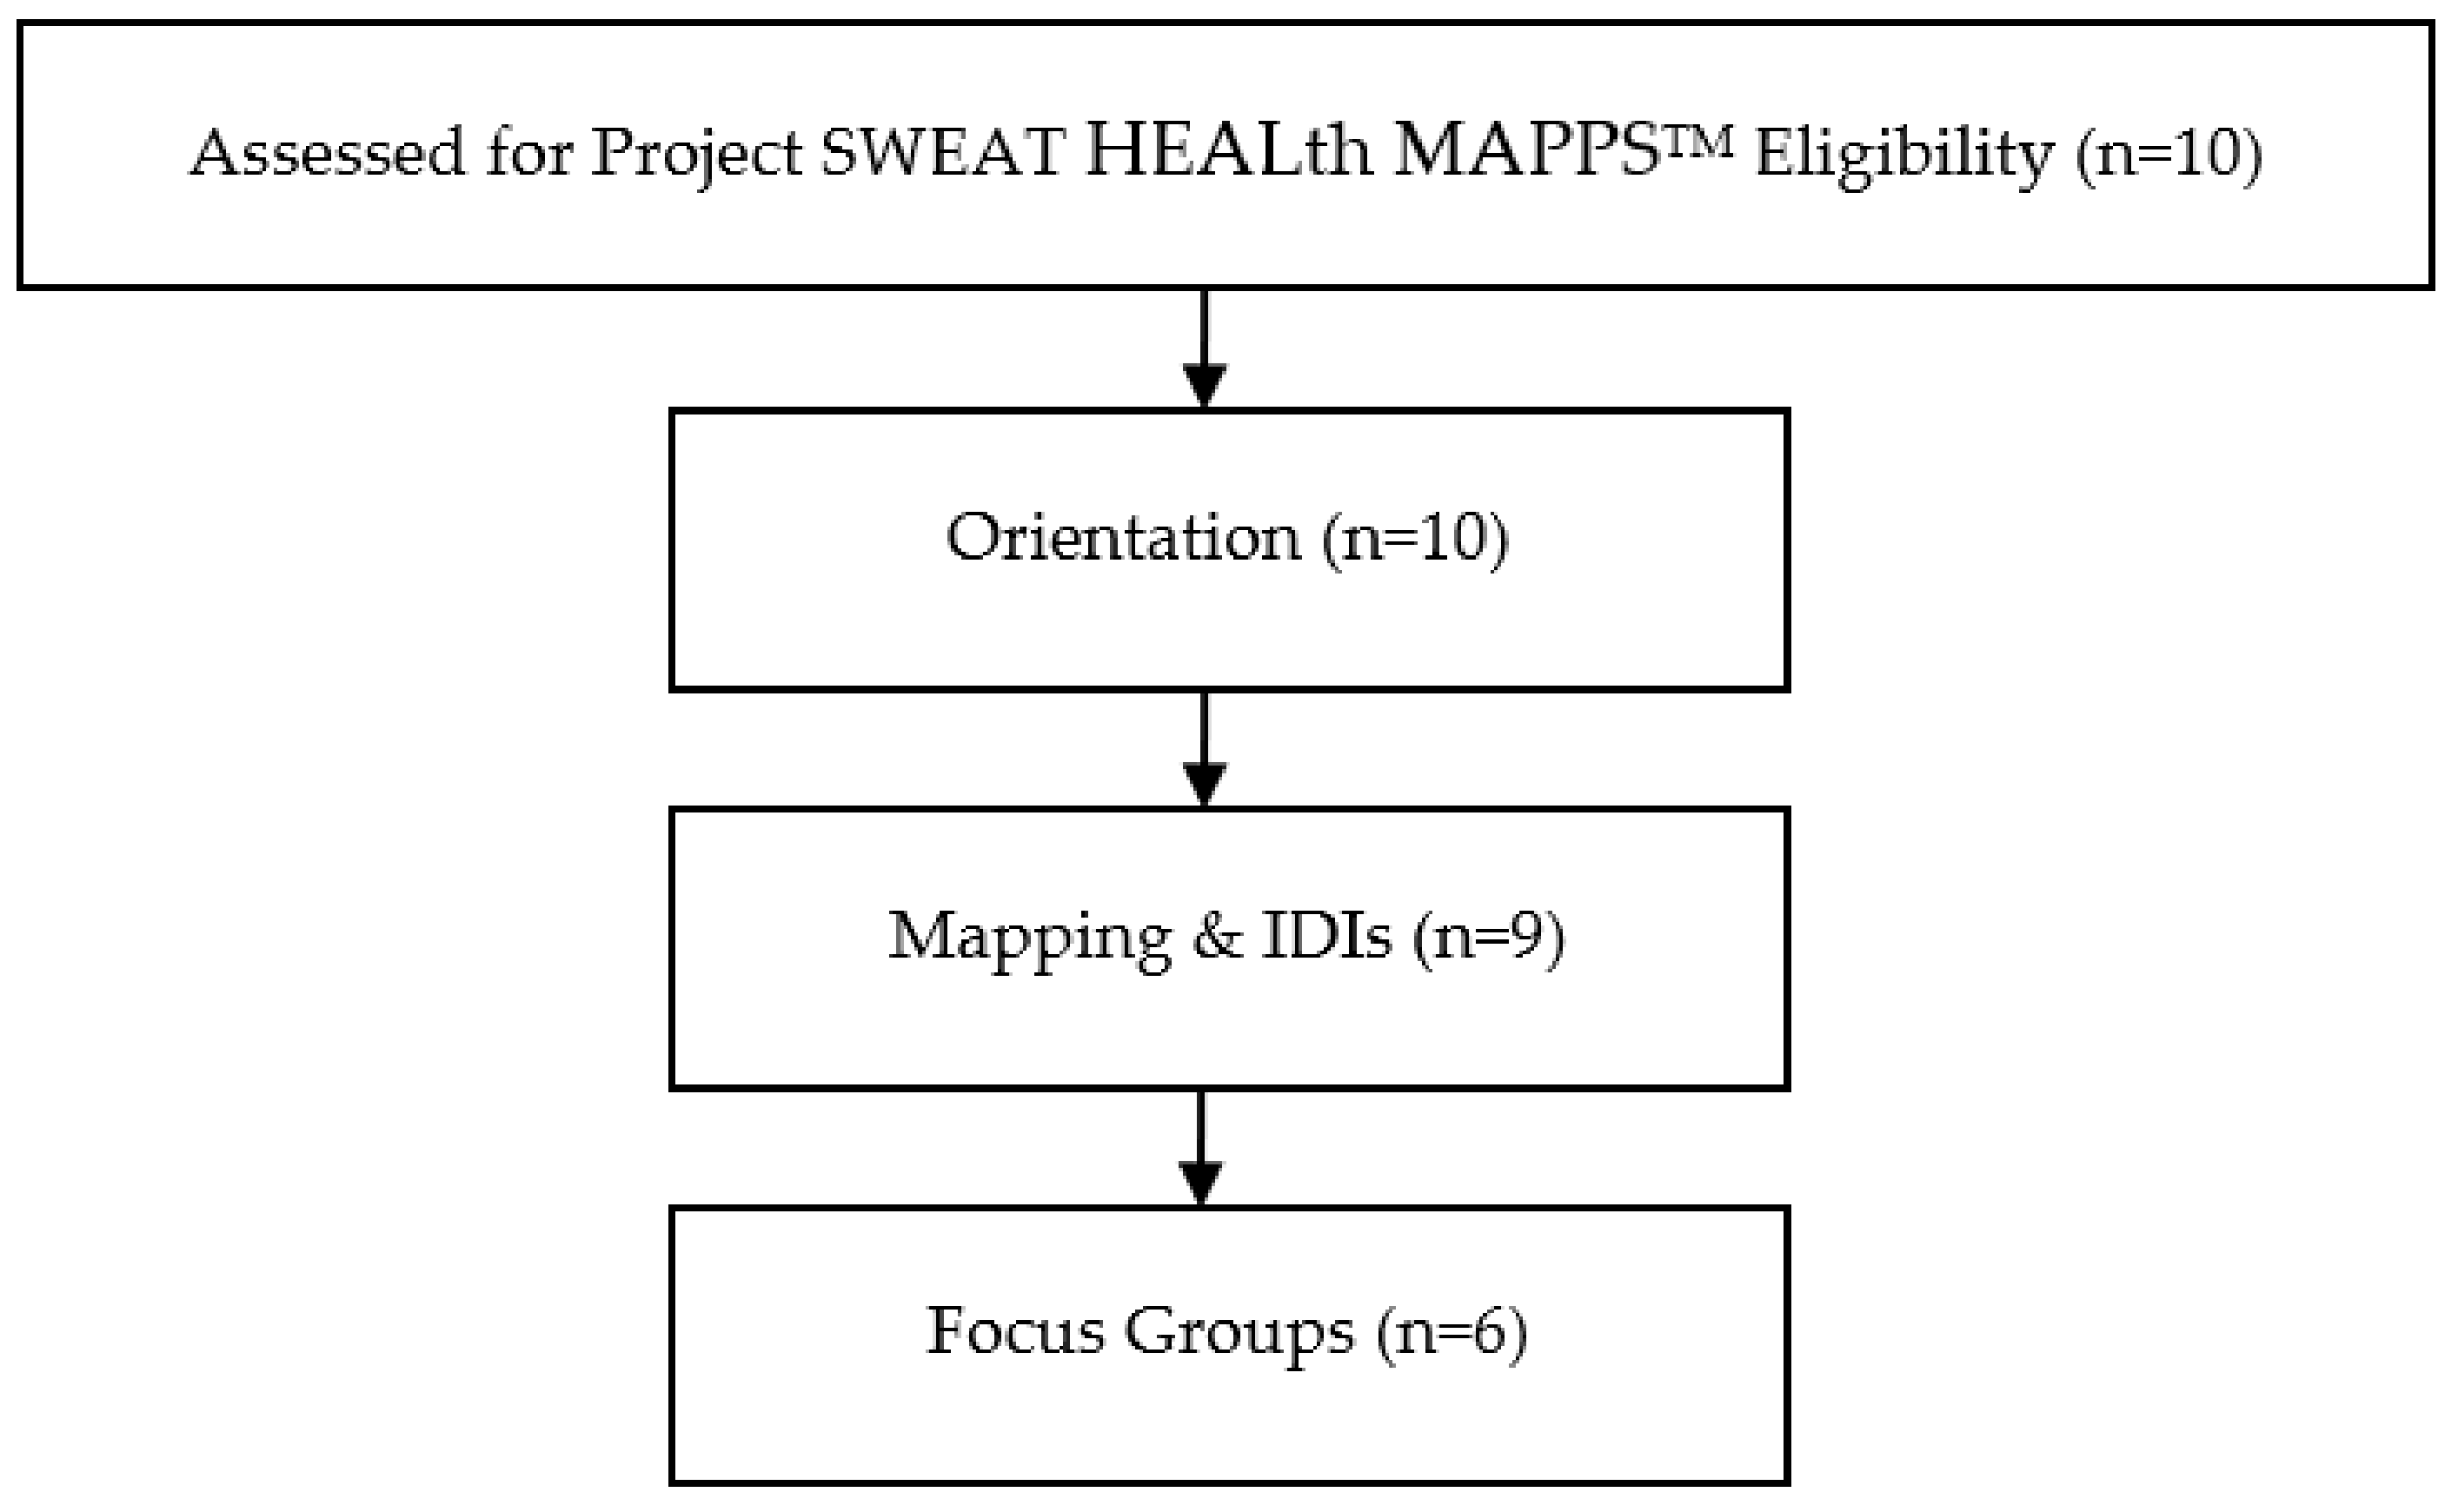
3.1. Participants
3.2. HEALth MAPPSTM Themes
- Community Resources as HEALth Facilitators: Within the neighborhood, participants mentioned in IDIs and FGs that food support available at local schools and community centers improved access to healthy foods during the summer months. Participants also cited the local community center that provided cooking lessons, programming, and nutrition education allowed them and their neighbors to live healthier lives.
- Personal Motivations for Improving the Community and their Lifestyle are HEALth Facilitators: From the photos taken on their routes, caregivers’ IDIs described that taking ownership in the community was a HEALth facilitator. Caregivers shared that they wanted to improve areas that were abandoned and overgrown with vegetation to replace them with parks and other community resources and were also aware of the gentrification happening in their neighborhoods. In addition to wanting to improve their community as part of their personal motivations, they also wanted to improve their grocery shopping habits, often citing that the nutritionally poor diet they grew up on was not something they wanted to continue to pass down to their children.
- Availability and Access (or lack of) to Safe Physical Activity are HEALth Facilitators/Barriers: When playgrounds and parks were in the area, caregivers shared in their IDIs that they felt it was much easier for their children to have safe physical activity, given that they were well maintained. Outside of the physical activity resources within their neighborhoods, caregivers cited that the cost to belong to a gym, high age admittance to summer camps, and limited time made it difficult to provide for themselves and their children for safe physical activity.
- Lack of Availability of Healthy Food is a HEALth Barrier: Several caregivers in IDIs cited that the foods available to them in their neighborhoods, local fast food establishments, and grocery stores made it difficult for them to eat healthfully. Caregivers also cited a plethora of “junk food” that was available in their community either in grocery or corner stores and that the food offered to them at food banks or grocery stores was often rotten or expired.
- Food Access (Cost) as a HEALth Barrier: Another common barrier to HEALth was food cost, mentioned in both IDIs and FGs. Caregivers cited the difficulty in balancing the costs of daily living with increased grocery budgets to include foods that are both nutrient and calorically dense. They felt that this difficulty was exacerbated during the summer months when children are not receiving meals at school. Inconsistent pricing among stores, increased costs of healthy foods, and budget restraints were the common barriers mentioned that inhibited participants from purchasing healthy foods. Participants noted that the increased costs of healthy foods were present among the stores they frequently shopped at, as well as the internet, and that having to shop around for the best prices made it difficult to stay within their budgeted dollar and time amounts for food shopping.
- Time Constraints as a HEALth Barrier: Another common barrier to HEALth was time constraints, mentioned in both IDIs and FGs. Caregivers cited that in order for them to prepare, serve, and eat balanced meals, they felt that had to give up time toward active living and household errands. Having to drive across town to be able to purchase healthier foods that were not readily available in their neighborhood was also a time constraint in healthy eating in their homes. Within FGs, caregivers mentioned that the timing of the year made it difficult to provide healthy food options for their children, as there were more meals to provide for. Conflicting schedules with children’s sports and family mealtime made it difficult to procure and prepare healthy food during the summer months. Additionally, caregivers cited that in order to prepare a healthy meal, they felt they needed to give up time dedicated toward physical activity and vice versa. One facilitator to preparing a healthy meal was the use of a crockpot, mentioned in the focus group, which helped reduce the time spent in the kitchen.
- Nutrition Knowledge (or lack of) as a Facilitator/Barrier to HEALth: Caregivers also communicated in IDIs and FGs that their limited nutrition and food safety knowledge made it difficult for them to prepare healthy meals and select unspoiled produce. The local community center that provided parenting and cooking classes was a facilitator to HEALth and helped them to increase their nutrition knowledge in preparing healthy family meals. This presence of strong community programming helped in creating self-efficacy for caregivers in the neighborhoods to obtain and prepare healthy meals in their homes.
- Neighborhood Safety as a Barrier to HEALth: Among caregivers, the most mentioned barrier to HEALth was neighborhood safety among IDIs and FGs. Caregivers described the presence of multiple abandoned lots as homes that made themselves and their neighbors uneasy about the safety of walking through their neighborhoods for HEALth. Trash among their neighborhoods on abandoned lots with glass, drug and alcohol paraphernalia, and dead rodents made them uncomfortable about accessing HEALth for themselves and their children.
- A subtheme within the neighborhood safety theme within IDIs and FGs was Poorly Maintained or Absence of Infrastructure as a Barrier to HEALth: Multiple caregivers cited that poorly maintained or absence of sidewalks made it difficult for themselves and their neighbors to access both healthy food and safe physical activity. When adequately maintained sidewalks were present, caregivers stated that it was easier for both physical activity and access to healthy foods. Participants also mentioned that the presence of long-standing construction projects, low electrical wires, and lack of well-maintained sidewalks in their neighborhoods made it difficult for their children to participate in safe physical activity. For physical activity and healthy eating, caregivers cited that playgrounds, sidewalks, and bike lanes were not well maintained or designed for their children to navigate their neighborhood safely with traffic. These dangers were cited as reasons that caregivers felt that they could not allow their children to safely navigate the neighborhood.
- Perception of crime and low safety in neighborhoods inhibited HEALth, presenting the second subtheme within neighborhood safety from the FGs, with Crime as a Barrier to HEALth. Caregivers mentioned that high instances of traffic, abandoned homes, vandalism, and criminals living in the area made caregivers feel uneasy about their children leaving the home for physical activity. These concerns led to perceived decreased amounts of physical activity in their neighborhoods.
- Due to these safety concerns, caregivers within IDIs shared that the Need for Adult Supervision is a Barrier to HEALth. Caregivers wanted to be able to walk their children to and from the community center where they could participate in HEALth, though they did not always have the time to do so. Having the community center supervise the children while they were unable to watch their children was a good resource to provide caregivers with a needed break.
4. Discussion
5. Conclusions
Author Contributions
Funding
Institutional Review Board Statement
Informed Consent Statement
Conflicts of Interest
References
- Von Hippel, P.T.; Powell, B.; Downey, D.B.; Rowland, N.J. The Effect of School on Overweight in Childhood: Gain in Body Mass Index During the School Year and During Summer Vacation. Am. J. Public Heal. 2007, 97, 696–702. [Google Scholar] [CrossRef] [PubMed]
- Moreno, J.P.; Johnston, C.A.; Woehler, D. Changes in Weight Over the School Year and Summer Vacation: Results of a 5-Year Longitudinal Study. J. Sch. Heal. 2013, 83, 473–477. [Google Scholar] [CrossRef] [PubMed]
- Moreno, J.; Johnston, C.A.; Chen, T.-A.; O’Connor, T.A.; Hughes, S.O.; Baranowski, J.; Woehler, D.; Baranowski, T. Seasonal variability in weight change during elementary school. Obesity 2014, 23, 422–428. [Google Scholar] [CrossRef] [PubMed]
- Kobayashi, M. The relationship between obesity and seasonal variation in body weight among elementary school children in Tokyo. Econ. Hum. Biol. 2006, 4, 253–261. [Google Scholar] [CrossRef]
- Smith, D.T.; Bartee, R.T.; Dorozynski, C.M.; Carr, L. Prevalence of Overweight and Influence of Out-of-School Seasonal Periods on Body Mass Index Among American Indian Schoolchildren. Prev. Chronic Dis. 2009, 6, A20. [Google Scholar]
- Chen, T.-A.; Baranowski, T.; Moreno, J.P.; O’Connor, T.M.; Hughes, S.O.; Baranowski, J.; Woehler, D.; Kimbro, R.T.; Johnston, C.A. Obesity status trajectory groups among elementary school children. BMC Public Heal. 2016, 16, 526. [Google Scholar] [CrossRef]
- Rodriguez, A.X.; Olvera, N.; Leung, P.; O’Connor, D.P.; Smith, D.W. Association Between the Summer Season and Body Fatness and Aerobic Fitness Among Hispanic Children. J. Sch. Heal. 2014, 84, 233–238. [Google Scholar] [CrossRef]
- Franckle, R.; Adler, R.; Davison, K. Accelerated Weight Gain Among Children During Summer Versus School Year and Related Racial/Ethnic Disparities: A Systematic Review. Prev. Chronic Dis. 2014, 11, E101. [Google Scholar] [CrossRef]
- Hopkins LGC. Project SWEAT (Summer Weight and Environmental Assessment Trial): An Exploration of the Protective Effect of Participation in Summer Programming on Child Weight Status; Methods for Evaluating Natural Experiments in Obesity, NIH Office of Disease Prevention and the Pathways to Prevention Program; Pathways to Prevention Workshop: Washington, DC, USA, 2017. [Google Scholar]
- Welker, E.; Lott, M.; Story, M. The School Food Environment and Obesity Prevention: Progress Over the Last Decade. Curr. Obes. Rep. 2016, 5, 145–155. [Google Scholar] [CrossRef]
- Campbell, K.J.; Crawford, D.; Salmon, J.; Carver, A.; Garnett, S.; Baur, L. Associations Between the Home Food Environment and Obesity-promoting Eating Behaviors in Adolescence. Obesity 2007, 15, 719–730. [Google Scholar] [CrossRef]
- Couch, S.C.; Glanz, K.; Zhou, C.; Sallis, J.F.; Saelens, B.E. Home Food Environment in Relation to Children’s Diet Quality and Weight Status. J. Acad. Nutr. Diet. 2014, 114, 1569–1579.e1. [Google Scholar] [CrossRef]
- Sallis, J.F.; Floyd, M.F.; Rodriguez, D.A.; Saelens, B.E. Role of Built Environments in Physical Activity, Obesity, and Cardiovascular Disease. Circulation 2012, 125, 729–737. [Google Scholar] [CrossRef]
- Booth, K.M.; Pinkston, M.M.; Poston, W.S.C. Obesity and the Built Environment. J. Am. Diet. Assoc. 2005, 105 (Suppl. 1), S110–S117. [Google Scholar] [CrossRef]
- Fiechtner, L.; Kleinman, K.; Melly, S.J.; Sharifi, M.; Marshall, R.; Block, J.; Cheng, E.R.; Taveras, E.M. Effects of Proximity to Supermarkets on a Randomized Trial Studying Interventions for Obesity. Am. J. Public Heal. 2016, 106, 557–562. [Google Scholar] [CrossRef]
- Armstrong, B.; Lim, C.S.; Janicke, D.M. Park Density Impacts Weight Change in a Behavioral Intervention for Overweight Rural Youth. Behav. Med. 2015, 41, 123–130. [Google Scholar] [CrossRef]
- Hopkins, L.C.; Penicka, C.; Evich, C.; Jones, B.; Gunther, C. Project SWEAT (Summer Weight and Environmental Assessment Trial): Study protocol of an observational study using a multistate, prospective design that examines the weight gain trajectory among a racially and ethnically diverse convenience sample of economically disadvantaged school-age children. BMJ Open 2018, 8, e021168. [Google Scholar] [CrossRef]
- John, D.; Gunter, K. HEALth MAPPSTM Tooklit User Manual; Oregon State University Extention Family and Community Health Program: Corvallis, OR, USA, 2019. [Google Scholar]
- United States Department of Agriculture Economic Research Service. Food Security in the U.S.: Six-Item Short Form of the Food Security Survey Module; United States Department of Agriculture Economic Research Service: Washington, DC, USA, 2012.
- United States Department of Health and Human Services. U.S. Federal Poverty Guidelines Used to Determine Financial Eligibility for Certain Federal Programs; United States Department of Health and Human Services: Washington, DC, USA, 2017.
- Charmez, K. Constructing Grounded Theory, 2nd ed; Sage: Thousand Oaks, CA, USA, 2014. [Google Scholar]
- Fade, S. Using interpretative phenomenological analysis for public health nutrition and dietetic research: A practical guide. Proc. Nutr. Soc. 2004, 63, 647–653. [Google Scholar] [CrossRef]
- Schafft, K.A.; Jensen, E.B.; Hinrichs, C.C. Food Deserts and Overweight Schoolchildren: Evidence from Pennsylvania*. Rural. Sociol. 2009, 74, 153–177. [Google Scholar] [CrossRef]
- Baskin, M.L.; Herbey, I.; Williams, R.; Ard, J.D.; Ivankova, N.; Odoms-Young, A. Caregiver perceptions of the food marketing environment of African-American 3–11-year-olds: A qualitative study. Public Heal. Nutr. 2013, 16, 2231–2239. [Google Scholar] [CrossRef][Green Version]
- van Ansem, W.J.; Schrijvers, C.T.; Rodenburg, G.; van de Mheen, D. Is there an association between the home food environment, the local food shopping environment and children’s fruit and vegetable intake? Results from the Dutch INPACT study. Public Heal. Nutr. 2012, 16, 1206–1214. [Google Scholar] [CrossRef]
- Colón-Ramos, U.; Monge-Rojas, R.; Stevenson, T.R.; Burns, H.; Thurman, S.; Gittelsohn, J.; Gurman, T.A. How Do African-American Caregivers Navigate a Food Desert to Feed Their Children? A Photovoice Narrative. J. Acad. Nutr. Diet. 2018, 118, 2045–2056. [Google Scholar] [CrossRef]
- Ralston, K.; Treen, K.; Coleman-Jensen, A.; Guthrie, J. Children’s Food Security and USDA Child Nutrition Programs; No. 1476-2017-2076; United States Department of Agriculture: Washington, DC, USA, 2017.
- Turner, L.; Calvert, H.G. The Academic, Behavioral, and Health Influence of Summer Child Nutrition Programs: A Narrative Review and Proposed Research and Policy Agenda. J. Acad. Nutr. Diet. 2019, 119, 972–983. [Google Scholar] [CrossRef]
- Gordon-Larsen, P.; Nelson, M.C.; Page, P.; Popkin, B. Inequality in the Built Environment Underlies Key Health Disparities in Physical Activity and Obesity. Pediatrics 2006, 117, 417–424. [Google Scholar] [CrossRef]
- Moore, L.V.; Roux, A.V.D.; Evenson, K.R.; McGinn, A.P.; Brines, S.J. Availability of Recreational Resources in Minority and Low Socioeconomic Status Areas. Am. J. Prev. Med. 2008, 34, 16–22. [Google Scholar] [CrossRef]
- Powell, L.M.; Slater, S.; Chaloupka, F.J.; Harper, D. Availability of Physical Activity–Related Facilities and Neighborhood Demographic and Socioeconomic Characteristics: A National Study. Am. J. Public Heal. 2006, 96, 1676–1680. [Google Scholar] [CrossRef]
- Estabrooks, P.A.; Lee, R.E.; Gyurcsik, N.C. Resources for physical activity participation: Does availability and accessibility differ by neighborhood socioeconomic status? Ann. Behav. Med. 2003, 25, 100–104. [Google Scholar] [CrossRef]
- Franzini, L.; Taylor, W.; Elliott, M.N.; Cuccaro, P.; Tortolero, S.R.; Gilliland, M.J.; Grunbaum, J.; Schuster, M.A. Neighborhood characteristics favorable to outdoor physical activity: Disparities by socioeconomic and racial/ethnic composition. Heal. Place 2010, 16, 267–274. [Google Scholar] [CrossRef]
- Taylor, W.C.; Upchurch, S.L.; Brosnan, C.A.; ScD, B.J.S.; Ms, T.Q.N.; Villagomez, E.T.; Meininger, J.C. Features of the Built Environment Related to Physical Activity Friendliness and Children’s Obesity and Other Risk Factors. Public Heal. Nurs. 2014, 31, 545–555. [Google Scholar] [CrossRef]
- Wilson, D.K.; Kirtland, K.A.; Ainsworth, B.E.; Addy, C.L. Socioeconomic status and perceptions of access and safety for physical activity. Ann. Behav. Med. 2004, 28, 20–28. [Google Scholar] [CrossRef]
- Zhu, X.; Lee, C. Walkability and Safety Around Elementary Schools: Economic and Ethnic Disparities. Am. J. Prev. Med. 2008, 34, 282–290. [Google Scholar] [CrossRef]
- Finkelstein, D.M.; Petersen, D.M.; Schottenfeld, L.S. Promoting Children’s Physical Activity in Low-Income Communities in Colorado: What Are the Barriers and Opportunities? Prev. Chronic Dis. 2017, 14, E134. [Google Scholar] [CrossRef] [PubMed]
- Remly, D.; Zies, S.; Stefura, B.; Leone, R.; Kattelmann, K. Assessing Physical Activity Determinants in Urban Settngs: Comparison of Perceptions and Environmental Audit Findings. J. Natl. Ext. Assoc. Fam. Consum. Sci. 2016, 11, 65. [Google Scholar]
- Burdette, H.L. Neighborhood playgrounds, fast food restaurants, and crime: Relationships to overweight in low-income preschool children. Prev. Med. 2004, 38, 57–63. [Google Scholar] [CrossRef]
- Schulz, A.J.; Zenk, S.; Odoms-Young, A.; Hollis-Neely, T.; Nwankwo, R.; Lockett, M.; Ridella, W.; Kannan, S. Healthy eating and exercising to reduce diabetes: Exploring the potential of so-cial determinants of health frameworks within the context of community-based participatory diabetes prevention. Am. J. Public Health. 2005, 95, 645–651. [Google Scholar] [CrossRef] [PubMed]
- John, D.H.; Winfield, T.; Etuk, L.; Hystad, P.; Langellotto, G.; Manore, M.; Gunter, K. Community-Engaged Attribute Mapping: Exploring Resources and Readiness to Change the Rural Context for Obesity Prevention. Prog. Community Heal. Partnersh. Res. Educ. Action 2017, 11, 183–196. [Google Scholar] [CrossRef] [PubMed]
- Baranowski, T.; O’Connor, T.; Johnston, C.; Hughes, S.; Moreno, J.; Chen, T.-A.; Meltzer, L.; Baranowski, J. School Year Versus Summer Differences in Child Weight Gain: A Narrative Review. Child. Obes. 2014, 10, 18–24. [Google Scholar] [CrossRef] [PubMed]


| Project SWEAT Main Study | HEALth MAPPSTM Sub-Study Sample | P | |
|---|---|---|---|
| Caregiver Age (years), Mean ± SE | 34.69 ± 1.17 | 38.38 ± 2.43 | 0.28 d |
| Caregiver Sex, % (n) Female Male | 83.33 (65) 15.38 (12) | 77.78 (7) 22.22 (2) | 0.79 e |
| Caregiver Race a, % (n) Black Non-Black | 78.21 (61) 21.79 (17) | 77.78 (7) 22.22 (2) | 0.97 e |
| Caregiver Ethnicity. % (n) Non-Hispanic or Latino Hispanic or Latino | 98.63 (72) 1.37 (1) | 100.00 (9) 0.00 (0) | 0.71 e |
| Caregiver Low-Income b, % (n) Low-Income Non-Low-Income | 67.11 (51) 32.89 (25) | 55.56 (5) 44.44 (4) | 0.43 e |
| Caregiver Household Food Security Category c,% (n) Very Low Food Security Low Food Security Marginal or High Food Security | 14.10 (11) 12.82 (10) 73.08 (57) | 11.11 (1) 11.11 (1) 77.78 (7) | 0.94 e |
| Representative Quote(s) from Project SWEAT HEALth MAPPS Participant In-depth Interviews and Focus Groups and Image(s) Captured by Project SWEAT HEALth MAPPS Participants using the Garmin Oregon 650 | |
|---|---|
| Theme 1. Community Resources as HEALth Facilitators | |
| “So, that affects them physically, and as far as eating, you know they’re not getting the, maybe the whole MyPlate uh proportion of their meal, especially if the parent is not focused on, or not educated enough because that facility actually does all that. Educating parents on how to prepare healthy meals and things of that nature but, if you don’t have a safe place to come do that, then that can affect them in all areas.” |  |
| 43-year-old, non-Hispanic Black Female | |
 | “…A lot of them from mid-Ohio, I’ve noticed a lot of the bigger community centers are using that Mid Ohio Foodbank that comes and delivers a lot of that produce. But there is a lot of, in this area, places that do that. Even the school do that, promoting healthy eating…” 45-year-old, non-Hispanic White Female |
| Theme 2. Personal Motivations for Improving the Community and their Lifestyle are HEALth Facilitators | |
| “…But this is another unwanted area that I see is not being used for nothing, that it would be nice to have, you know, I don’t understand why we, it’s just a lot of vacant areas…That could be used for um either like a garden area, or um something um a little park area for the children…” 43-year-old, non-Hispanic Black Female |  |
| Theme 3. Availability and Access (or lack of) to Safe Physical Activity are HEALth Facilitators/Barriers | |
 | “That’s a little park over there in the corner, it’s not even a big park, it’s just an area they built to set down. The people can walk by, people can sit in there, people can get a pizza by it. It’s really small area.” 36-year-old, non-Hispanic Black Female |
| “There’s a balance somewhat because there’s activity at school and in summer. But in the summertime there’s a lot more because there’s active summer camps and swimming and there’s a lot of stuff that in the wintertime it dies down and it just… They have to be interested in something that’s offered in the wintertime or encouraged to participate in something at the rec center and not all families have the funds or availability to get to these different things.” |  |
| 38-year-old, non-Hispanic Black Female | |
| Theme 4. Lack of Availability of Healthy Food is a HEALth Barrier | |
 | “Either that or they’re going to shop at these little convenient markets, where you run across other things, other kinds of foods. Um but I like the fact that you do have the Save-A-Lot in walking distance in the uh community here, in the [zipcode].” 43-year-old, non-Hispanic Black Female |
| “It’s harder cause there’s no uh nowhere to eat that’s healthy over here, unless you know how to cook… Well, not just around there maybe about five miles away, maybe three or four miles away or more but not right in this area here.” 36-year-old, non-Hispanic Black Female |  |
| Theme 5. Food Access (Cost) as a HEALth Barrier | |
| “And the easiest stuff to get to at the store’s always the cheaper stuff which is not as healthy so, you kinda wanna, it’s kinda hard ‘cause then you have to take your time to find all the healthy food, weigh the pros and cons in your head.” 30-year-old, non-Hispanic White Male |  |
 | “In the neighborhood per say there’s really nothing other than a Family Dollar and they don’t have fresh fruit and veggies there. We actually have to go somewhere else to get fruit and veggies which at those grocery stores they do have a good variety. Save A lot is down the road as well but it is down the road. In the neighborhood per say there’s really not a lot of options. You have to go outside of your little neighborhood into the bigger area of the community to get the stuff you need.” 45-year-old, non-Hispanic White Female |
| Theme 6. Time Constraints as a HEALth Barrier | |
| ”It makes it more difficult cause you gotta travel further and then you get frustrated with traffic and...Yeah, so.” 30-year-old, non-Hispanic White Male |  |
 | ”Obviously if you are out doing something with your kids it is easier to go to a fast food place and getting dinner or if you come home and don’t have a lot of time to make dinner you do the fast options again. Or of you don’t wanna be active you have time to stay home and get stuff ready for dinner to prep to actually cook.” 30-year-old, non-Hispanic White Male |
| “Well, I work from home! So it’s easier for me, I can take 10–15 minutes and throw something in the crockpot. I don’t have a problem. After they are out of school we can go… I signed them up for t ball soccer, so we are able to do things and be active after school as well.” 49-year-old, non-Hispanic Black Female |  |
| Theme 7. Nutrition Knowledge (or lack of) as a Facilitator/Barrier to HEALth | |
 | “Some people, some people don’t look at it. I-I-I think a lot of people are are [sic] uneducated on healthy eating….They don’t know how to go in there and look at no meat, or look at this stuff. They’re just buying what they visually see and they think is to buy.” 43-year-old, non-Hispanic Black Female |
| “Salvation Army last year did a cooking class… that engaged the family and the students so everything was hands on…That made me change my ways to look like, hey this is what we can do with this, you can do anything with rice, it all tastes good… You have to get the kids fired up and that makes the parents engaged like OK I see my child very interested in something.” 30-year-old, non-Hispanic Black Female |  |
| Theme 8. Neighborhood Safety as a Barrier to HEALth | |
 | “Um just vacant areas, open areas or open areas that’s just been vandalized. People don’t want to walk to their local grocery stores, or their um neighborhood places because of some of these things.” 43-year-old, non-Hispanic Black Female |
| Subtheme: Poorly Maintained or Absence of Infrastructure as a Barrier to HEALth | |
| “No, yeah there is a crosswalk, but that’s only there really during, because that’s right where the school is... But it doesn’t cross over to another sidewalk. It crosses over into the grass, so you still have to walk on the edge of the road if you don’t want to walk in the grass.” 30-year-old, non-Hispanic White Male |  |
 | “Where they’re playing… like you said the sidewalks, I wouldn’t let [participant name redacted] ride at a distance by herself because most of the… in our route alone we had to go around trash cans and uneven pavement or absent sidewalks… there’s glass... I hate to see areas that go unattended rather than people with that property or just areas that are just grassy and not maintained.” 45-year-old, non-Hispanic White Female |
| Subtheme: Crime as a Barrier to HEALth | |
| “They’re actually doing that, I showed you what it looks like now in that little play area. That play area is not on the outside it’s actually on the inside and it’s open. But they have broken ground and they are redoing that whole parking lot area because it had been vandalized and fences had been torn down.” 43-year-old, non-Hispanic Black Female |  |
| Subtheme: Need for Adult Supervision is a Barrier to HEALth | |
 | “They’re afraid someone’s going to snatch them up they’ll be in it-you know in the-in the these bushes or in these high weed area. They feel unsafe uh you know allowing them to go there because of some of these concerns.” 43-year-old, non-Hispanic Black Female |
Publisher’s Note: MDPI stays neutral with regard to jurisdictional claims in published maps and institutional affiliations. |
© 2021 by the authors. Licensee MDPI, Basel, Switzerland. This article is an open access article distributed under the terms and conditions of the Creative Commons Attribution (CC BY) license (https://creativecommons.org/licenses/by/4.0/).
Share and Cite
Hopkins, L.C.; Sharn, A.R.; Remley, D.; Schier, H.; Olak, R.; Drakeford, D.; Pannell, C.; Gunther, C. Caregiver Perceptions of Environmental Facilitators and Barriers to Healthy Eating and Active Living during the Summer: Results from the Project SWEAT Sub-Study. Int. J. Environ. Res. Public Health 2021, 18, 11396. https://doi.org/10.3390/ijerph182111396
Hopkins LC, Sharn AR, Remley D, Schier H, Olak R, Drakeford D, Pannell C, Gunther C. Caregiver Perceptions of Environmental Facilitators and Barriers to Healthy Eating and Active Living during the Summer: Results from the Project SWEAT Sub-Study. International Journal of Environmental Research and Public Health. 2021; 18(21):11396. https://doi.org/10.3390/ijerph182111396
Chicago/Turabian StyleHopkins, Laura C., Amy R. Sharn, Daniel Remley, Heather Schier, Regan Olak, Dorsena Drakeford, Cara Pannell, and Carolyn Gunther. 2021. "Caregiver Perceptions of Environmental Facilitators and Barriers to Healthy Eating and Active Living during the Summer: Results from the Project SWEAT Sub-Study" International Journal of Environmental Research and Public Health 18, no. 21: 11396. https://doi.org/10.3390/ijerph182111396
APA StyleHopkins, L. C., Sharn, A. R., Remley, D., Schier, H., Olak, R., Drakeford, D., Pannell, C., & Gunther, C. (2021). Caregiver Perceptions of Environmental Facilitators and Barriers to Healthy Eating and Active Living during the Summer: Results from the Project SWEAT Sub-Study. International Journal of Environmental Research and Public Health, 18(21), 11396. https://doi.org/10.3390/ijerph182111396