
Reliability of Isokinetic Hip Flexor and Extensor Strength Measurements in Healthy Subjects and Athletes: A Systematic Review and Meta-Analysis

 ,
,  ,
,  ,
,  and
and
Abstract
1. Introduction
2. Methods
2.1. Study Design
2.2. Search Strategy
2.3. Eligibility Criteria
2.4. Evaluation of the Methodological Quality of the Studies Included
2.5. Data Collection Process
3. Results
3.1. Study Selection
3.2. Characteristics of the Studies
3.3. Risk of Bias in Studies
3.4. Anatomical Plane and Motion
3.5. Muscle Contraction
3.6. Position
3.7. Velocity
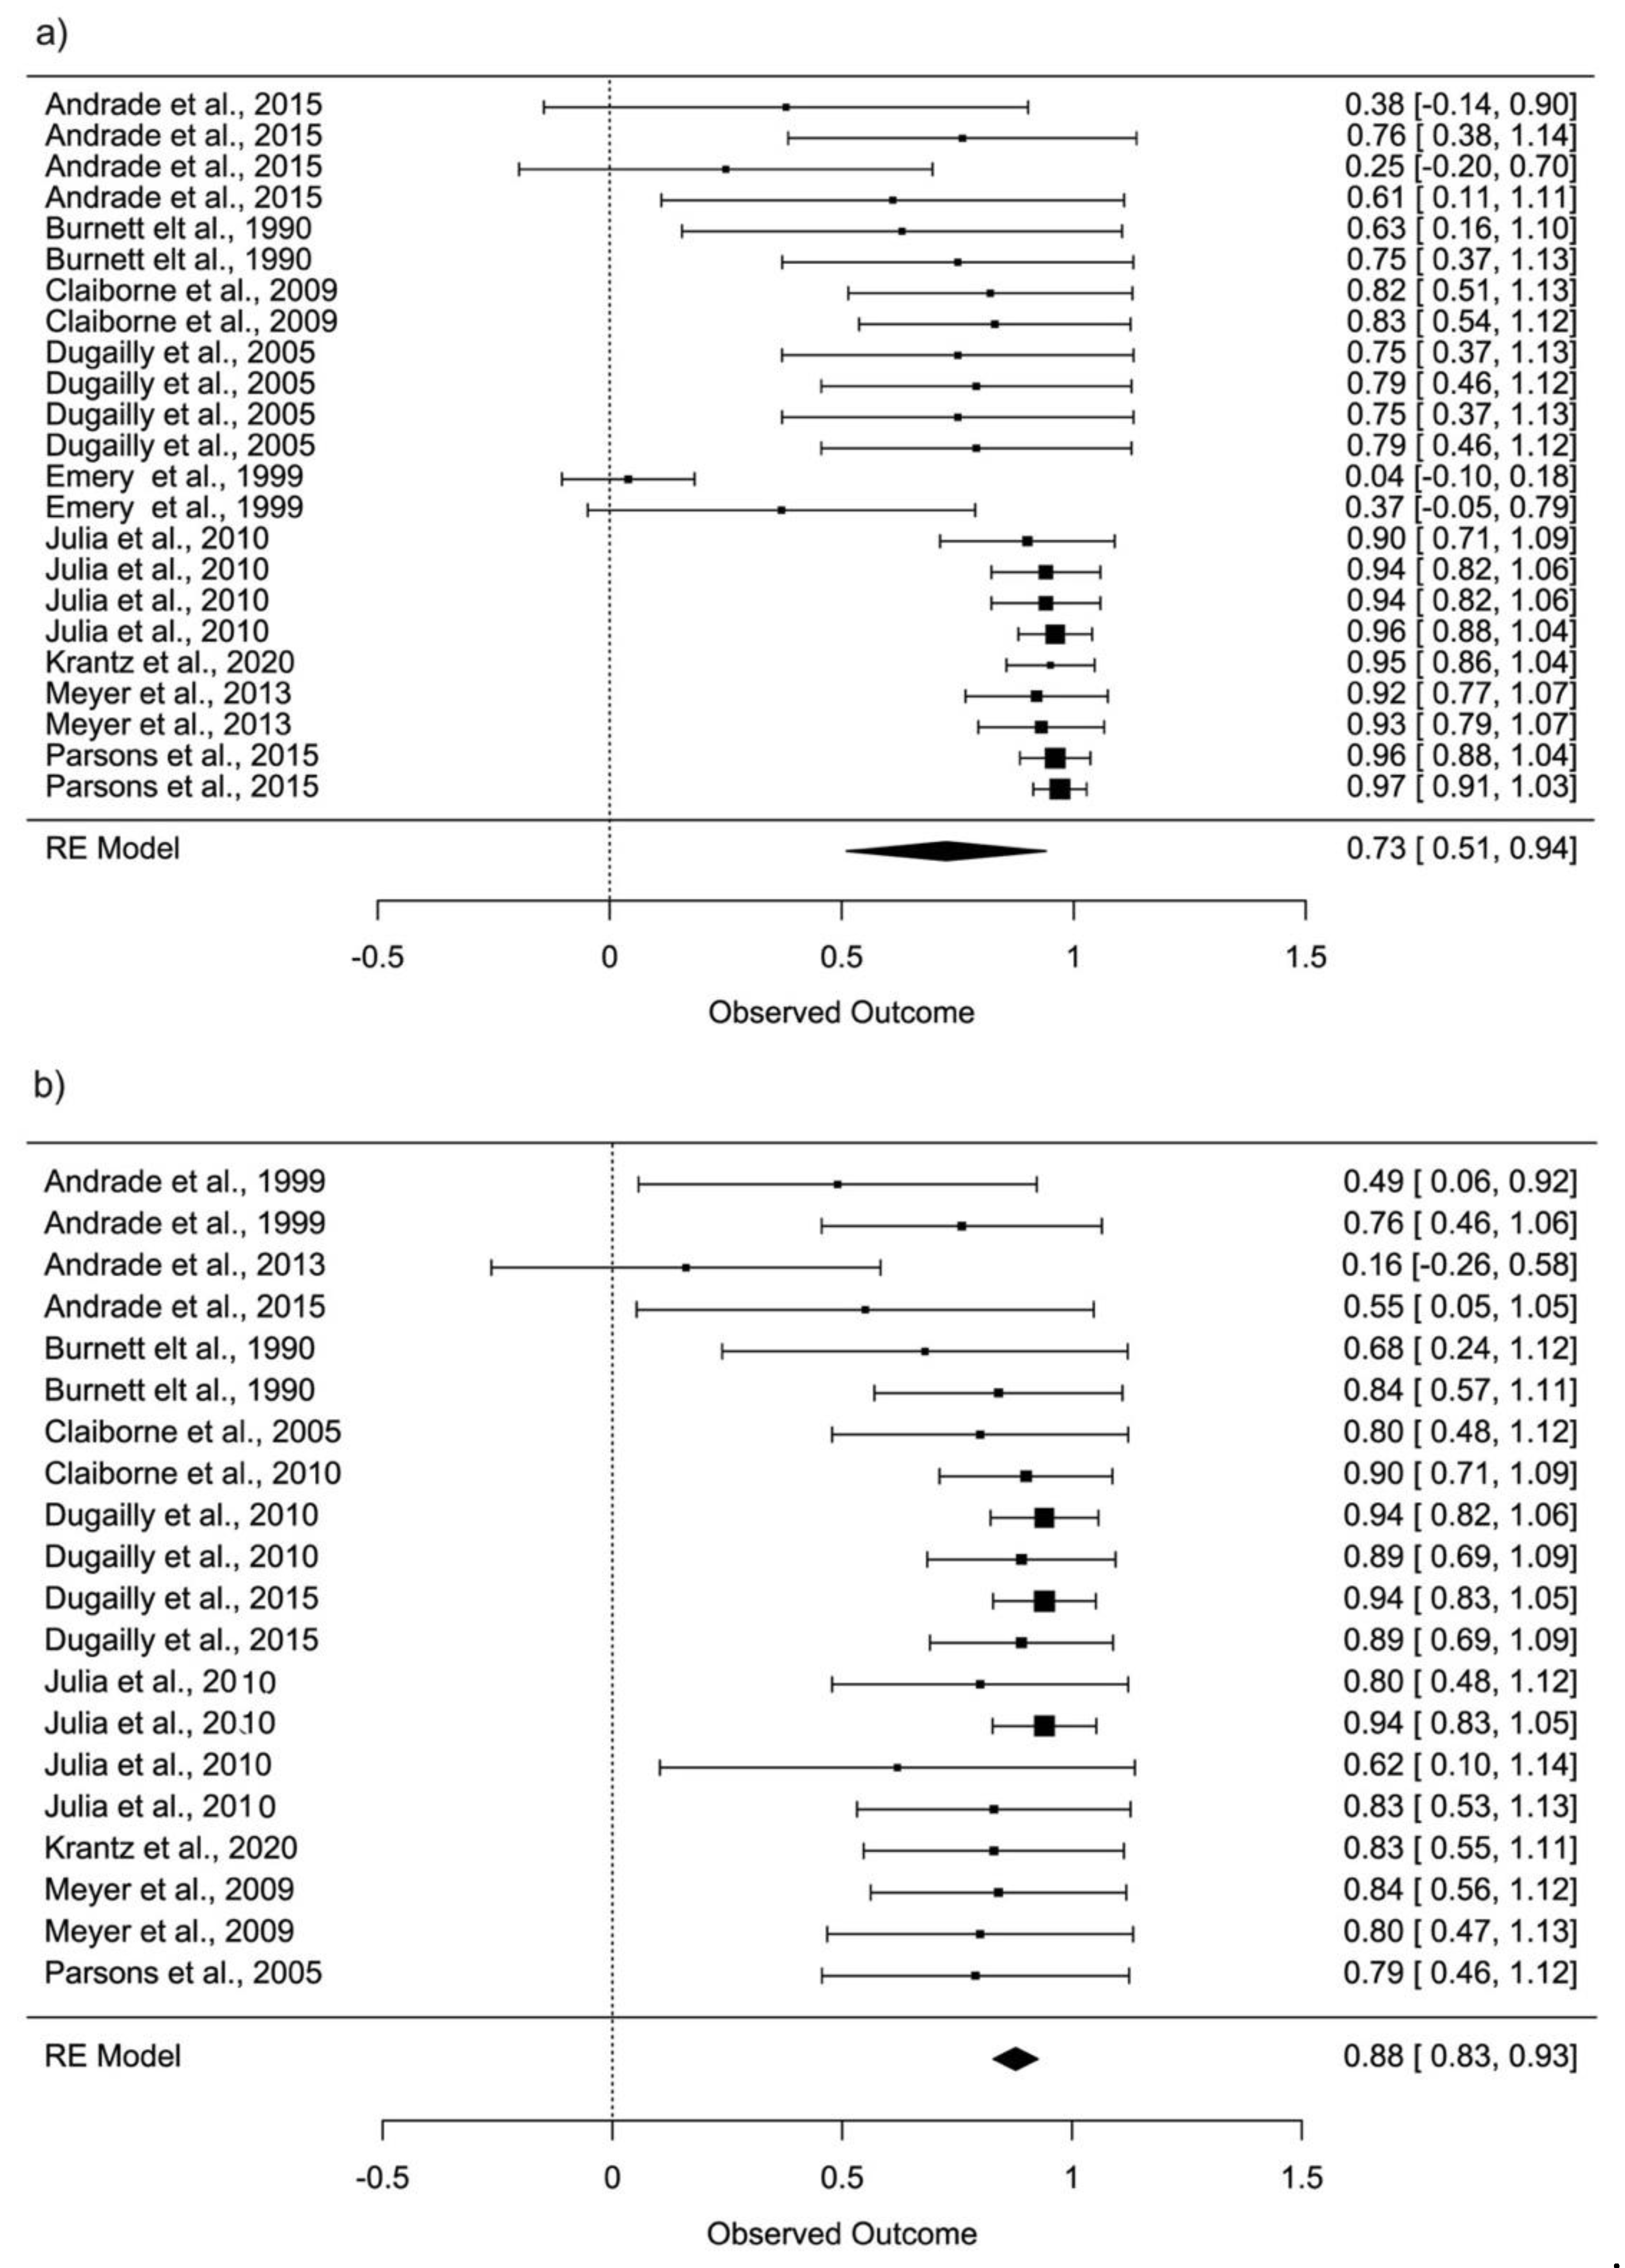
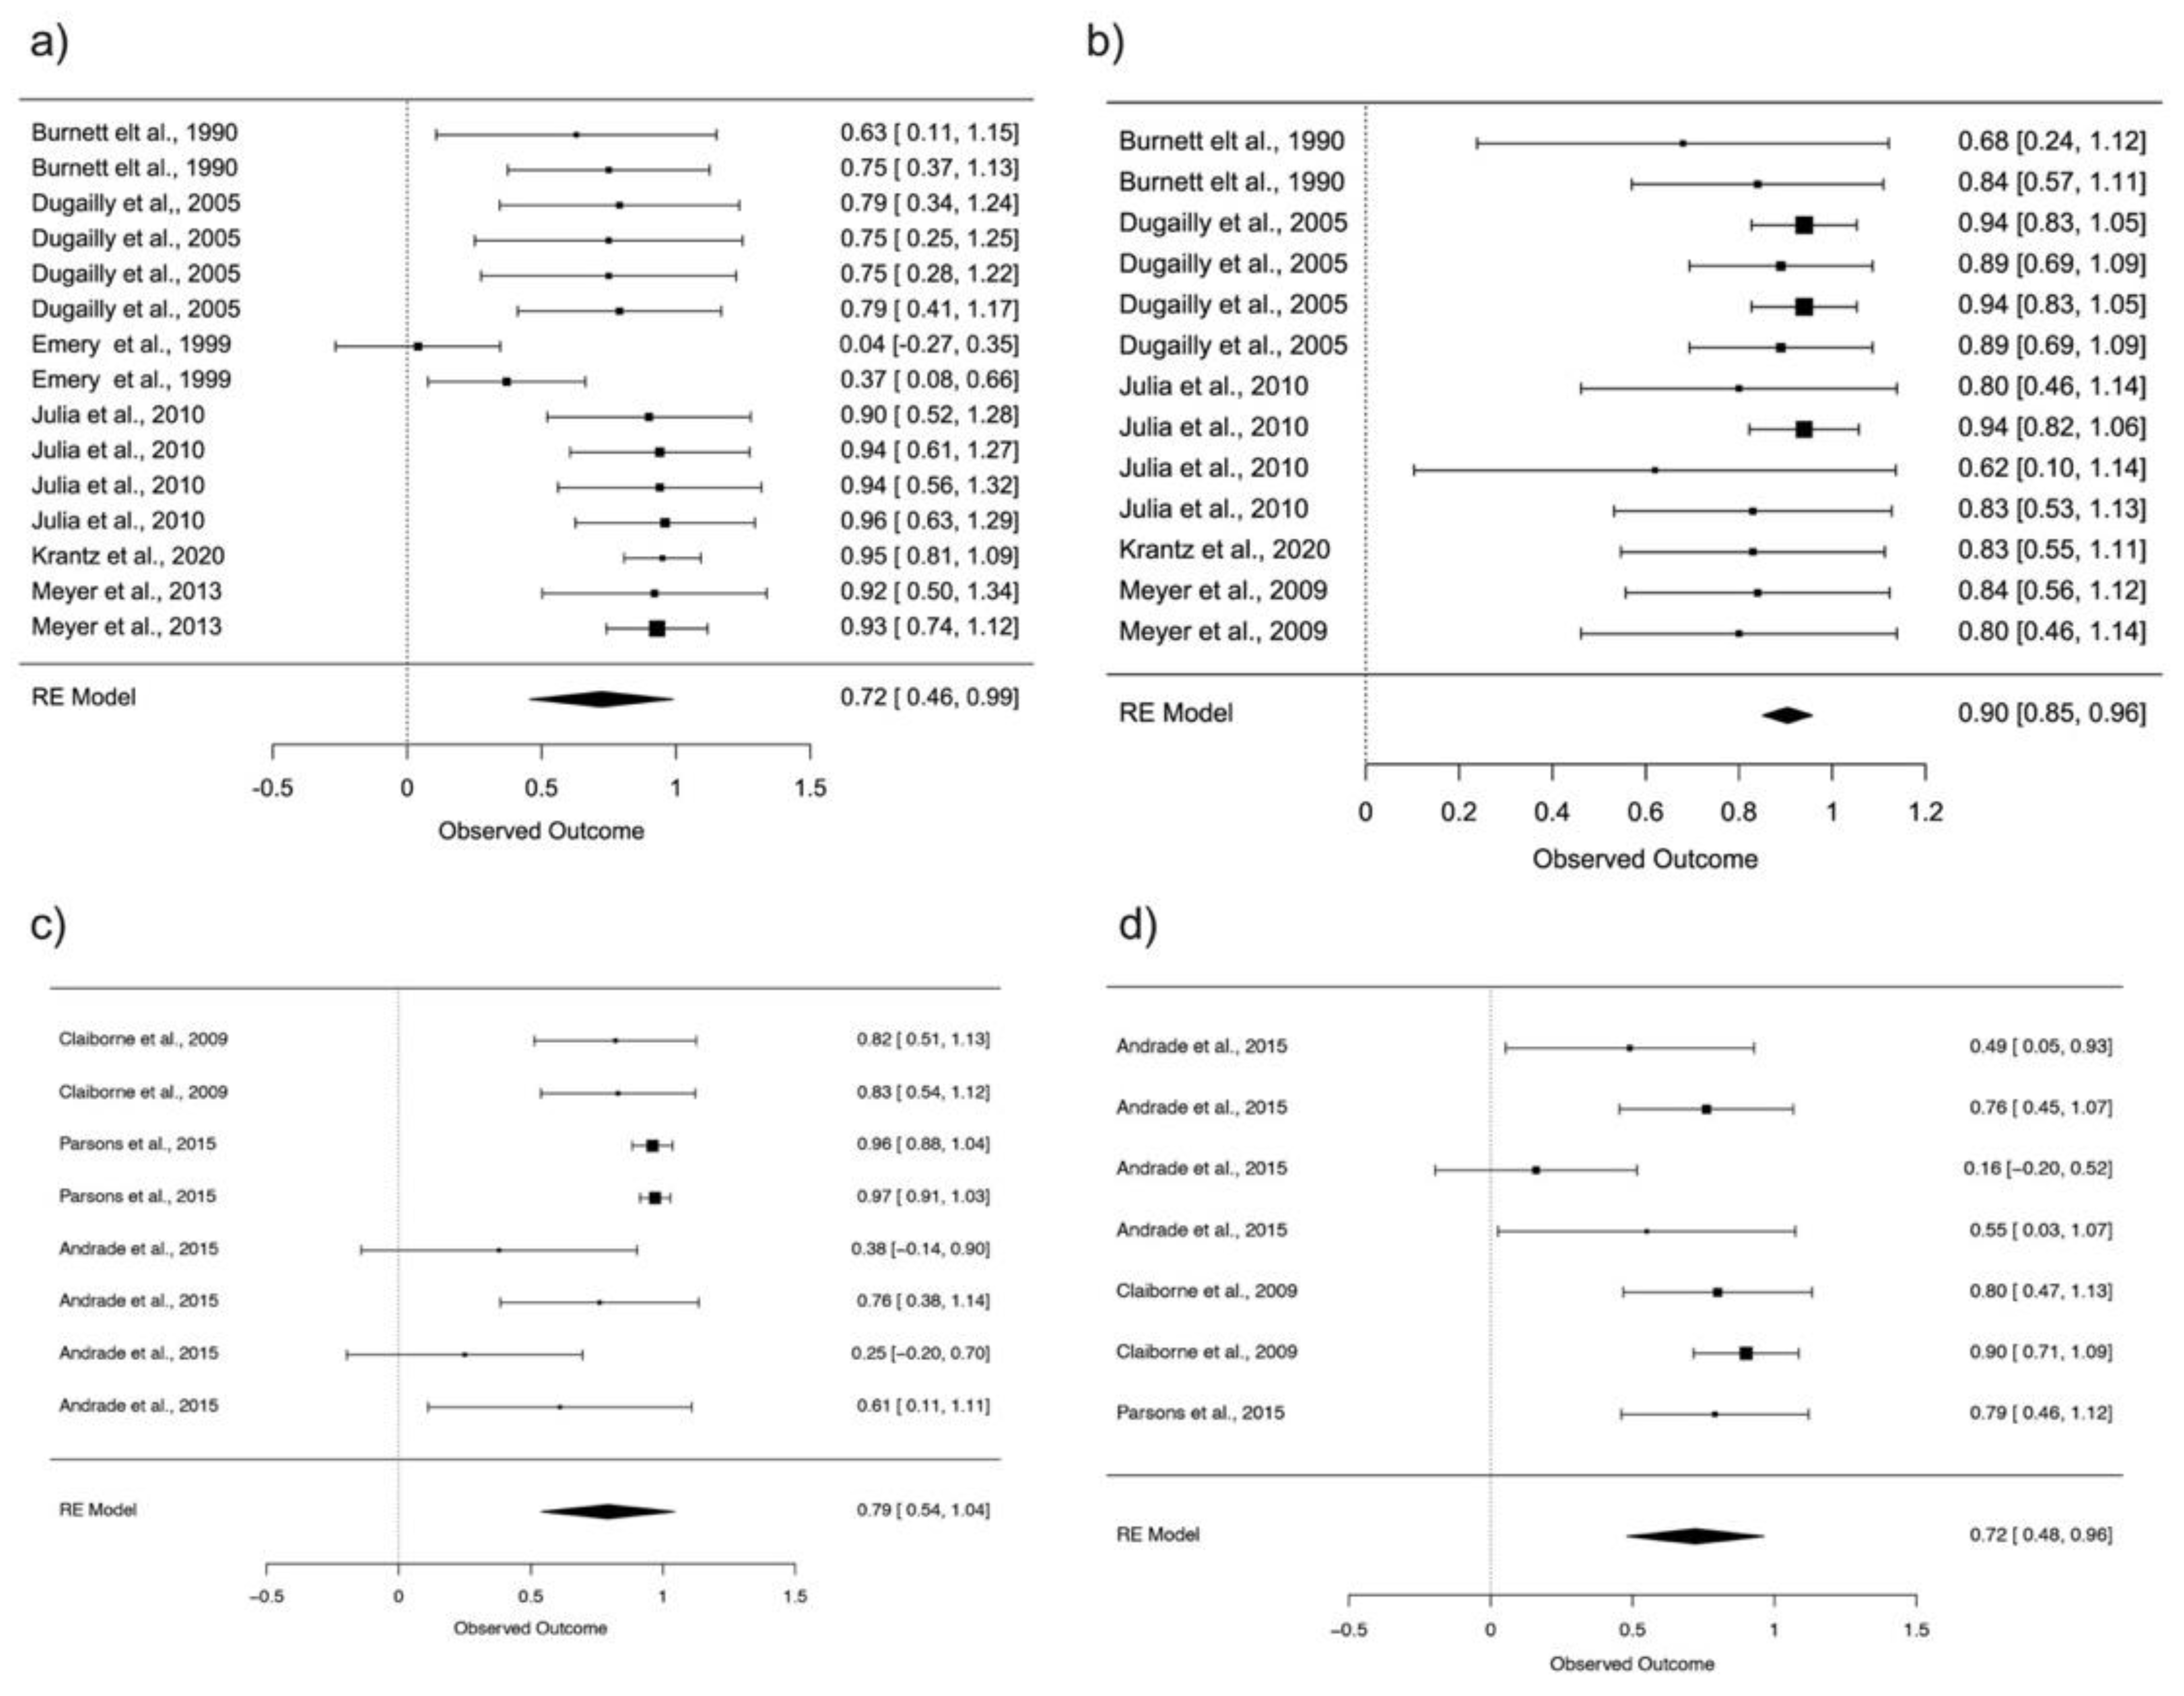
3.8. Reliability
4. Discussion
4.1. Movement and Position
4.2. Velocity
5. Conclusions
- Hip flexion shows good reliability in the standing position (ICC = 0.79; 95% CI: 0.54–1.04).
- Hip extension shows excellent reliability in supine position (ICC = 0.90; 95% CI: 0.85–0.96).
- Hip flexion at 120°/s and 180°/s shows excellent reliability (ICC = 0.93; 95% CI: 0.85–1.00), (ICC = 0.96; 95% CI: 0.92–1.01).
- Hip extension at 60°/s and 120°/s show good reliability (ICC = 0.90; 95% CI: 0.82–0.98), (ICC = 0.87; 95% CI: 0.75–0.99) and excellent reliability at 180°/sond (ICC = 0.93; 95% CI: 0.82–1.03).
Author Contributions
Funding
Institutional Review Board Statement
Informed Consent Statement
Acknowledgments
Conflicts of Interest
References
- Lorenz, D.S.; Reiman, M.P.; Walker, J.C. Periodization: Current review and suggested implementation for athletic rehabilitation. Sports Health 2010, 2, 509–518. [Google Scholar] [CrossRef] [PubMed]
- Teng, H.L.; Powers, C.M. Hip-extensor strength, trunk posture, and use of the knee-extensor muscles during running. J. Athl. Train. 2016, 51, 519–524. [Google Scholar] [CrossRef] [PubMed]
- Kotsifaki, A.; Korakakis, V.; Graham-Smith, P.; Sideris, V.; Whiteley, R. Vertical and Horizontal Hop Performance: Contributions of the Hip, Knee, and Ankle. Sports Health 2021, 13, 128–135. [Google Scholar] [CrossRef]
- Tottori, N.; Suga, T.; Miyake, Y.; Tsuchikane, R.; Otsuka, M.; Nagano, A.; Fujita, S.; Isaka, T. Hip flexor and knee extensor muscularity are associated with sprint performance in sprint-trained preadolescent boys. Pediatr. Exerc. Sci. 2018, 30, 117–125. [Google Scholar] [CrossRef]
- Tottori, N.; Suga, T.; Miyake, Y.; Tsuchikane, R.; Tanaka, T.; Terada, M.; Otsuka, M.; Nagano, A.; Fujita, S.; Isaka, T. Trunk and lower limb muscularity in sprinters: What are the specific muscles for superior sprint performance? BMC Res. Notes 2021, 14, 10–15. [Google Scholar] [CrossRef]
- Ema, R.; Sakaguchi, M.; Kawakami, Y. Thigh and Psoas Major Muscularity and Its Relation to Running Mechanics in Sprinters. Med. Sci. Sports Exerc. 2018, 50, 2085–2091. [Google Scholar] [CrossRef] [PubMed]
- Nadler, S.F.; Malanga, G.A.; Deprince, M.; Stitik, T.P.; Feinberg, J.H. The Relationship between Lower Extremity Injury, Low Back Pain, and Hip Muscle Strength in Male and Female Collegiate Athletes. Clin. J. Sport Med. 2000, 10, 89–97. [Google Scholar] [CrossRef]
- Casartelli, N.C.; Maf, N.A.; Staehli, S.; Bizzini, M.; Impellizzeri, F.M.; Leunig, M. Hip muscle weakness in patients with symptomatic femoroacetabular impingement. Osteoarthr. Cartil. 2011, 19, 816–821. [Google Scholar] [CrossRef] [PubMed]
- Mouzopoulos, G.; Siebold, R.; Tzurbakis, M. Hip flexion strength remains decreased in anterior cruciate ligament reconstructed patients at one-year follow up compared to healthy controls. Int. Orthop. 2015, 39, 1427–1432. [Google Scholar] [CrossRef]
- Van Cant, J.; Pineux, C.; Pitance, L.; Feipel, V. Hip muscle strength and endurance in females with patellofemoral pain: A systematic review with meta-analysis. Int. J. Sports Phys. Ther. 2014, 9, 564–582. [Google Scholar] [PubMed]
- Habets, B.; Smits, H.W.; Backx, F.J.G.; van Cingel, R.E.H.; Huisstede, B.M.A. Hip muscle strength is decreased in middle-aged recreational male athletes with midportion Achilles tendinopathy: A cross-sectional study. Phys. Ther. Sport 2017, 25, 55–61. [Google Scholar] [CrossRef] [PubMed]
- Brown, L.E.; Stone, M.H. Isokinetic Exercise and Human Performance. Strength Cond. J. 2000, 22, 53. [Google Scholar] [CrossRef]
- Dvir, Z.; Müller, S. Multiple-Joint Isokinetic Dynamometry: A Critical Review. J. Strenght Cond. Res. 2019, 00, 1–15. [Google Scholar] [CrossRef] [PubMed]
- Busby, K.E.; Malone, T.R. Sports Injury Management. In Evaluation of Isokinetic Equipment; Nr. 1 March 1988; Williams & Wilkins: Philadelphia, PA, USA, 1988; Volume 1, ISBN 9780683078602. [Google Scholar]
- Caruso, J.F.; Brown, L.E.; Tufano, J.J. The reproducibility of isokinetic dynamometry data. Isokinet. Exerc. Sci. 2012, 20, 239–253. [Google Scholar] [CrossRef]
- Drouin, J.M.; Valovich-McLeod, T.C.; Shultz, S.J.; Gansneder, B.M.; Perrin, D.H. Reliability and validity of the Biodex system 3 pro isokinetic dynamometer velocity, torque and position measurements. Eur. J. Appl. Physiol. 2004, 91, 22–29. [Google Scholar] [CrossRef] [PubMed]
- Plotnikoff, N.A.; MacIntyre, D.L. Test-retest reliability of glenohumeral internal and external rotator strength. Clin. J. Sport Med. 2002, 12, 367–372. [Google Scholar] [CrossRef]
- Duarte, J.P.; Valente-dos-Santos, J.; Coelho-e-Silva, M.J.; Couto, P.; Costa, D.; Martinho, D.; Seabra, A.; Cyrino, E.S.; Conde, J.; Rosado, J.; et al. Reproducibility of isokinetic strength assessment of knee muscle actions in adult athletes: Torques and antagonist-agonist ratios derived at the same angle position. PLoS ONE 2018, 13, e0202261. [Google Scholar] [CrossRef] [PubMed]
- Guilhem, G.; Giroux, C.; Couturier, A.; Maffiuletti, N.A. Validity of trunk extensor and flexor torque measurements using isokinetic dynamometry. J. Electromyogr. Kinesiol. 2014, 14, 986–993. [Google Scholar] [CrossRef]
- Dvir, Z. Clinical applicability of isokinetics: A review. Clin. Biomech. 1991, 6, 133–144. [Google Scholar] [CrossRef]
- Shamseer, L.; Moher, D.; Clarke, M.; Ghersi, D.; Liberati, A.; Petticrew, M.; Shekelle, P.; Stewart, L.A.; Altman, D.G.; Booth, A.; et al. Preferred reporting items for systematic review and meta-analysis protocols (prisma-p) 2015: Elaboration and explanation. BMJ 2015, 349, 1–25. [Google Scholar] [CrossRef] [PubMed]
- Brink, Y.; Louw, Q.A. Clinical instruments: Reliability and validity critical appraisal. J. Eval. Clin. Pract. 2012, 18, 1126–1132. [Google Scholar] [CrossRef] [PubMed]
- Lucas, N.P.; Macaskill, P.; Irwig, L.; Bogduk, N. The development of a quality appraisal tool for studies of diagnostic reliability (QAREL). J. Clin. Epidemiol. 2010, 63, 854–861. [Google Scholar] [CrossRef]
- R Core Team. R: A Language and Environmentfor Statistical Computing; R Foundation for Statistical Computing: Vienna, Austria, 2017. [Google Scholar]
- Warnes, G.R.; Bolker, B.; Gorjanc, G.; Grothendieck, G.; Korosec, A.; Lumley, T.; MacQueen, D.; Magnusson, A.; Rogers, J. Gdata: Various R Programming Tools for Data Manipulation. R Packag. Version 2.13.3. 2014. Available online: https://cran.r-project.org/web/packages/gdata/ (accessed on 23 October 2021).
- Viechtbauer, W. Conducting meta-analyses in R with the metafor. J. Stat. Softw. 2010, 36, 1–48. [Google Scholar] [CrossRef]
- Noble, S.; Scheinost, D.; Constable, R.T. A decade of test-retest reliability of functional connectivity: A systematic review and meta-analysis. Neuroimage 2019, 203, 116157. [Google Scholar] [CrossRef]
- Shoukri, M.M.; Al-Hassan, T.; DeNiro, M.; El Dali, A.; Al-Mohanna, F. Bias and Mean Square Error of Reliability Estimators under the One and Two Random Effects Models: The Effect of Non-Normality. Open J. Stat. 2016, 6, 254–273. [Google Scholar] [CrossRef]
- Burnett, C.N.; Filusch Betts, E.; King, W.M. Reliability of isokinetic measurements of hip muscle torque in young boys. Phys. Ther. 1990, 70, 244–249. [Google Scholar] [CrossRef]
- Claiborne, T.L.; Timmons, M.K.; Pincivero, D.M. Test–Retest reliability of cardinal plane isokinetic hip torque and EMG. J. Electromyogr. Kinesiol. 2009, 19, e345–e352. [Google Scholar] [CrossRef]
- Krantz, M.M.; Åström, M.; Drake, A.M. Strength and Fatigue Measurements of the Hip Flexor and Hip Extensor Muscles: Test-Retest Reliability and Limb Dominance Effect. Int. J. Sports Phys. Ther. 2020, 15, 967–976. [Google Scholar] [CrossRef] [PubMed]
- Santos Andrade, M.; Mascarin, N.C.; Benedito-Silva, A.A.; Carderelli Minozzo, F.; Vancini, R.L.; Barbosa De Lira, C.A. Assessment of isokinetic peak torque reliability of the hip flexor, extensor, adductors and abductors muscles in female soccer players from 14 to 25 years old. J. Sports Med. Phys. Fit. 2016, 56, 843–848. [Google Scholar]
- Dugailly, P.M.; Brassinne, E.; Pirotte, E.; Mouraux, D.; Feipel, V.; Klein, P. Isokinetic assessment of hip muscle concentric strength in normal subjects: A reproducibility study. Isokinet. Exerc. Sci. 2005, 13, 129–137. [Google Scholar] [CrossRef]
- Emery, C.A.; Maitland, M.E.; Meeuwisse, W.H. Test-retest reliability of isokinetic hip adductor and flexor muscle strength. Clin. J. Sport Med. 1999, 9, 79–85. [Google Scholar] [CrossRef] [PubMed]
- Julia, M.; Dupeyron, A.; Laffont, I.; Lemoine, F.; He, C. Reproducibility of isokinetic peak torque assessments of the hip flexor and extensor muscles. Ann. Phys. Rehabil. Med. 2010, 53, 293–305. [Google Scholar] [CrossRef]
- Meyer, C.; Corten, K.; Wesseling, M.; Peers, K.; Simon, J.P.; Jonkers, I.; Desloovere, K. Test-retest reliability of innovated strength tests for hip muscles. PLoS ONE 2013, 8, e81149. [Google Scholar] [CrossRef]
- Parsons, J.L.; Porter, M.M. Reliability of Measuring Hip and Knee Power and Movement Velocity in Active Youth. Pediatric Phys. Ther. 2015, 27, 82–89. [Google Scholar] [CrossRef] [PubMed]
- Koo, T.K.; Li, M.Y. A Guideline of Selecting and Reporting Intraclass Correlation Coefficients for Reliability Research. J. Chiropr. Med. 2016, 15, 155–163. [Google Scholar] [CrossRef] [PubMed]
- Abdelmohsen, A.M. Leg Dominance Effect on Isokinetic Muscle Strength of Hip Joint. J. Chiropr. Med. 2019, 18, 27–32. [Google Scholar] [CrossRef] [PubMed]
- Sugiura, Y.; Saito, T.; Sakuraba, K.; Sakuma, K.; Suzuki, E. Strength deficits identified with concentric action of the hip extensors and eccentric action of the hamstrings predispose to hamstring injury in elite sprinters. J. Orthop. Sports Phys. Ther. 2008, 38, 457–464. [Google Scholar] [CrossRef]
- Ambegaonkar, J.P.; Mettinger, L.M.; Caswell, S.V.; Burtt, A.; Cortes, N. Relationships between core endurance, hip strength, and balance in collegiate female athletes. Int. J. Sports Phys. Ther. 2014, 9, 604–616. [Google Scholar]
- Scott, D.A.; Bond, E.Q.; Sisto, S.A.; Nadler, S.F. The intra- and interrater reliability of hip muscle strength assessments using a handheld versus a portable dynamometer anchoring station. Arch. Phys. Med. Rehabil. 2004, 85, 598–603. [Google Scholar] [CrossRef]
- Calmels, P.M.; Nellen, M.; van der Borne, I.; Jourdin, P.; Minaire, P. Concentric and eccentric isokinetic assessment of flexor-extensor torque ratios at the hip, knee, and ankle in a sample population of healthy subjects. Arch. Phys. Med. Rehabil. 1997, 78, 1224–1230. [Google Scholar] [CrossRef]
- Arokoski, M.H.; Arokoski, J.P.A.; Haara, M.; Kankaanpää, M.; Vesterinen, M.; Niemitukia, L.H.; Helminen, H.J. Hip Muscle Strength and Muscle Cross Sectional Area in Men with and without Hip Osteoarthritis. J. Rheumatol. 2002, 29, 2185–2195. [Google Scholar] [PubMed]
- Eng, J.J.; Kim, C.M.; MacIntyre, D.L. Reliability of lower extremity strength measures in persons with chronic stroke. Arch. Phys. Med. Rehabil. 2002, 83, 322–328. [Google Scholar] [CrossRef] [PubMed]


| Study | N | Gender | Type Subjects | Bilateral | Time Rest | Dynamometer |
|---|---|---|---|---|---|---|
| Burnett et al. [29] | 29 | Boys | Healthy | No | 7–14 days | Cybex II |
| Claiborne et al. [30] | 13 | Boys/Girls | Healthy | Yes | 7 days | Biodex Medical System |
| Krantz et al. [31] | 30 | Men/Woman | Healthy | Yes | 7 days | Biodex Medical System |
| Dos Santos Andrade et al. [32] | 17 | Woman | Soccer Players | Yes | 7 days | Biodex System 3 |
| Dugailly et al. [33] | 28 | Boys/Girls | Sports-active | Yes | 10 min | Cybex 340 |
| Emery et al. [34] | 19 | Males | Healthy | Yes | 7 days | Cybex Norm |
| Julia et al. [35] | 10 | Males/Woman | Healthy | Yes | 7 days | CON-TREX |
| Meyer et al. [36] | 10 | Males/Woman | Healthy | No | 7 days | Biodex |
| Parsons et al. [37] | 52 | Boys/Girls | Healthy | No | 7 days | Biodex System 3 Pro |
| Study | Hip Action Evaluated | Posture | Speed (°/s) | Mean/(SD) 1° Test | Mean/(SD) 2° Test | Mean/(SD) 3° Test | ICC (95% CI) | Limits ICC | SEM (Nm) | SEM (%) | SRD (Nm) | SRD (%) |
|---|---|---|---|---|---|---|---|---|---|---|---|---|
| Burnett et al. [29] | Flexion | Supine | 30 | 6.2 | 6.0 | (-) | 0.63 | (-) | (-) | (-) | (-) | (-) |
| Flexion | Supine | 90 | 5.1 | 5.2 | (-) | 0.75 | (-) | (-) | (-) | (-) | (-) | |
| Claiborne et al. [30] | Flexion Left | Biped | 60 | 31.37 | 34.05 | (-) | 0.82 | 0.80–0.90 | 13.92 | (-) | (-) | (-) |
| Flexion Right | Biped | 60 | 37.49 | 25.89 | (-) | 0.83 | 0.80–0.90 | 13.16 | (-) | (-) | (-) | |
| Dos Santos Andrade et al. [32] | Flexion Right | Biped | 30 | 218.9 | 208.5 | (-) | 0.25 | (-) 0.26–0.65 | (-) | (-) | (-) | (-) |
| Flexion Left | Biped | 30 | 225.3 | 217.4 | (-) | 0.38 | (-) 0.13–0.73 | (-) | (-) | (-) | (-) | |
| Flexion Right | Biped | 150 | 208.7 | 203.2 | (-) | 0.61 | 0.18–0.84 | (-) | (-) | (-) | (-) | |
| Flexion Left | Biped | 150 | 197.7 | 190.5 | (-) | 0.76 | 0.44–0.91 | (-) | (-) | (-) | (-) | |
| Dugailly et al. [33] | Flexion Women | Supine | 60 | (-) | (-) | (-) | 0.75 | (-) | 3.7 | (-) | (-) | (-) |
| Flexion Women | Supine | 120 | (-) | (-) | (-) | 0.79 | (-) | 3.6 | (-) | (-) | (-) | |
| Flexion Men | Supine | 60 | (-) | (-) | (-) | 0.75 | (-) | 3.7 | (-) | (-) | (-) | |
| Flexion Men | Supine | 120 | (-) | (-) | (-) | 0.79 | (-) | 3.6 | (-) | (-) | (-) | |
| Emery et al. [34] | Flexion Right | Supine | 60 | 54.2 | 62.9 | 51.0 | 0.37 | 0.06–0.64 | (-) | (-) | (-) | (-) |
| Flexion Left | Supine | 60 | 52.4 | 58.3 | 43.1 | 0.04 | 0–0.35 | (-) | (-) | (-) | (-) | |
| Julia et al. [35] | Flexion Left | Supine | 60 | (-) | (-) | (-) | 0.90 | (-) | (-) | (-) | (-) | (-) |
| Flexion Left | Supine | 180 | (-) | (-) | (-) | 0.94 | (-) | (-) | (-) | (-) | (-) | |
| Flexion Right | Supine | 60 | (-) | (-) | (-) | 0.94 | (-) | (-) | (-) | (-) | (-) | |
| Flexion Right | Supine | 180 | (-) | (-) | (-) | 0.96 | (-) | (-) | (-) | (-) | (-) | |
| Krantz et al. [31] | Flexion | Supine | 120 | 28.29 | 28.67 | (-) | 0.83 | 0.89–0.97 | 1.76 | 6.2 | (-) | (-) |
| Meyer et al. [36] | Flexion | Supine | 60 | 120.7 | 124.7 | (-) | 0.92 | 0.80–0.97 | 10.51 | 8.57 | 29.13 | 23.75 |
| Flexion | Supine | 120 | 103.3 | 107.1 | (-) | 0.93 | 0.82–0.97 | 8.41 | 8.00 | 23.32 | 22.17 | |
| Parsons et al. [37] | Flexion | Biped | 60 | 74.8 (28.5) | 70.1 (25.4) | (-) | 0.96 | 0.91–0.98 | 7.1 | (-) | (-) | (-) |
| Flexion | Biped | 180 | 194.1 (74.6) | 189.0 (72.6) | (-) | 0.97 | 0.95–0.99 | 16.7 | (-) | (-) | (-) |
| Study | Hip Action Evaluated | Posture | Speed (°/s) | Mean/(SD) 1° Test | Mean/(SD) 2° Test | Mean/(SD) 3° Test | ICC (95% CI) | Limits ICC | SEM (Nm) | SEM (%) | SRD (Nm) | SRD (%) |
|---|---|---|---|---|---|---|---|---|---|---|---|---|
| Burnett et al. [29] | Extension | Supine | 30 | 10.3 | 12 | (-) | 0.68 | (-) | (-) | (-) | (-) | (-) |
| Extension | Supine | 90 | 10.1 | 12.3 | (-) | 0.84 | (-) | (-) | (-) | (-) | (-) | |
| Claiborne et al. [30] | Extension Left | Biped | 60 | 32.22 | 34.55 | (-) | 0.80 | 0.80–0.90 | 14.84 | (-) | (-) | (-) |
| Extension Right | Biped | 60 | 33.78 | 31.77 | (-) | 0.90 | 0.80–0.90 | 10.40 | (-) | (-) | (-) | |
| Dos Santos Andrade et al. [32] | Extension Right | Biped | 30 | 239.0 | 227.4 | (-) | 0.16 | (-) 0.35–0.59 | (-) | (-) | (-) | (-) |
| Extension Left | Biped | 30 | 258.8 | 250.4 | (-) | 0.49 | 0.01–0.79 | (-) | (-) | (-) | (-) | |
| Extension Right | Biped | 150 | 228.8 | 227.7 | (-) | 0.55 | 0.09–0.82 | (-) | (-) | (-) | (-) | |
| Extension Left | Biped | 150 | 237.5 | 235.4 | (-) | 0.76 | 0.44–0.91 | (-) | (-) | (-) | (-) | |
| Dugailly et al. [33] | Extension Women | Supine | 60 | (-) | (-) | (-) | 0.94 | (-) | 9.5 | (-) | (-) | (-) |
| Extension Women | Supine | 120 | (-) | (-) | (-) | 0.89 | (-) | 8.2 | (-) | (-) | (-) | |
| Extension Men | Supine | 60 | (-) | (-) | (-) | 0.94 | (-) | 9.5 | (-) | (-) | (-) | |
| Extension Men | Supine | 120 | (-) | (-) | (-) | 0.89 | (-) | 8.2 | (-) | (-) | (-) | |
| Julia et al. [35] | Extension Left | Supine | 60 | (-) | (-) | (-) | 0.80 | (-) | (-) | (-) | (-) | (-) |
| Extension Right | Supine | 60 | (-) | (-) | (-) | 0.62 | (-) | (-) | (-) | (-) | (-) | |
| Extension Left | Supine | 180 | (-) | (-) | (-) | 0.94 | (-) | (-) | (-) | (-) | (-) | |
| Extension Right | Supine | 180 | (-) | (-) | (-) | 0.83 | (-) | (-) | (-) | (-) | (-) | |
| Krantz et al. [31] | Extension | Supine | 120 | 51.54 | 54.74 | (-) | 0.83 | 0.67–0.92 | 7.22 | 13.6 | (-) | (-) |
| Meyer et al. [36] | Extension | Supine | 60 | 120.2 | 140.7 | (-) | 0.84 | 0.61–0.93 | 12.66 | 9.70 | 35.10 | 26.90 |
| Extension | Supine | 120 | 114.9 | 132.1 | (-) | 0.80 | 0.55–0.92 | 16.11 | 13.06 | 44.65 | 36.31 | |
| Parsons et al. [37] | Extension | Biped | 60 | 52.2 (25.2) | 50.6 (25.3) | (-) | 0.79 | 0.63–0.88 | 15.1 | (-) | (-) | (-) |
| Study | Hip Action Evaluated | Posture | Speed (°/s) | Mean/(SD) 1° Test | Mean/(SD) 2° Test | Mean/(SD) 3° Test | ICC (95% CI) | Limits ICC | SEM (Nm) | SEM (%) | SRD (Nm) | SRD (%) |
|---|---|---|---|---|---|---|---|---|---|---|---|---|
| Flexion Eccentric | ||||||||||||
| Claiborne et al. [30] | Flexion Left | Biped | 60 | 35.38 | 34.89 | (-) | 0.74 | 0.62–0.79 | 18.06 | (-) | (-) | (-) |
| Flexion Right | Biped | 60 | 28.34 | 34.90 | (-) | 0.91 | 0.80–0.91 | 9.42 | (-) | (-) | (-) | |
| Dugailly et al. [33] | Flexion Right | Supine | 60 | 79.5 | 68.3 | 60.5 | 0.28 | 0.09–0.66 | (-) | (-) | (-) | (-) |
| Flexion Left | Supine | 60 | 63.2 | 73.6 | 53.3 | 0.35 | 0.04–0.62 | (-) | (-) | (-) | (-) | |
| Extension Eccentric | ||||||||||||
| Claiborne et al. [30] | Extension Left | Biped | 60 | 30.91 | 35.44 | (-) | 0.80 | 0.80–0.91 | 14.68 | (-) | (-) | (-) |
| Extension Right | Biped | 60 | 45.50 | 34.26 | (-) | 0.76 | 0.62–0.79 | 19.49 | (-) | (-) | (-) | |
| Julia et al. [35] | Extension Left | Supine | 30 | (-) | (-) | (-) | 0.68 | (-) | (-) | (-) | (-) | (-) |
| Extension Right | Supine | 30 | (-) | (-) | (-) | 0.80 | (-) | (-) | (-) | (-) | (-) | |
| Extension Left | Supine | 90 | (-) | (-) | (-) | 0.75 | (-) | (-) | (-) | (-) | (-) | |
| Extension Right | Supine | 90 | (-) | (-) | (-) | 0.78 | (-) | (-) | (-) | (-) | (-) | |
| Study | 1 | 2 | 3 | 4 | 5 | 6 | 7 | 8 | 9 | % |
|---|---|---|---|---|---|---|---|---|---|---|
| Burnett et al. [29] | Y | N | N | N | N | Y | Y | Y | Y | 56 |
| Claiborne et al. [30] | Y | N | N | N | N | Y | Y | Y | Y | 56 |
| Dos Santos Andrade et al. [32] | Y | Y | N | N | N | Y | Y | Y | Y | 67 |
| Dugailly et al. [33] | Y | N | N | N | N | Y | Y | Y | Y | 56 |
| Emery et al. [34] | Y | N | N | N | N | Y | Y | Y | Y | 56 |
| Julia et al. [35] | Y | N | N | N | N | Y | Y | Y | Y | 56 |
| Krantz et al. [31] | Y | Y | N | N | N | Y | Y | Y | Y | 67 |
| Meyer et al. [36] | Y | N | N | N | Y | Y | Y | Y | Y | 67 |
| Parsons et al. [37] | Y | N | Y | Y | N | Y | Y | Y | Y | 78 |
| Study | P1 | P2 | P3 | P4 | P5 | P6 | P7 | P8 | P9 | P10 | P11 | % |
|---|---|---|---|---|---|---|---|---|---|---|---|---|
| Burnett et al. [29] | Y | Y | Y | UC | NA | UC | UC | UC | Y | Y | Y | 60 |
| Claiborne et al. [30] | Y | Y | UC | UC | NA | UC | UC | N | Y | Y | Y | 50 |
| Dos Santos Andrade et al. [32] | Y | Y | UC | UC | NA | UC | UC | N | Y | Y | Y | 50 |
| Dugailly et al. [33] | Y | Y | UC | UC | NA | UC | UC | UC | UC | Y | Y | 40 |
| Emery et al. [34] | Y | Y | UC | UC | NA | UC | UC | UC | Y | Y | Y | 50 |
| Julia et al. [35] | Y | Y | N | UC | NA | UC | UC | N | Y | Y | Y | 50 |
| Krantz et al. [31] | Y | Y | N | N | NA | UC | UC | N | Y | Y | Y | 50 |
| Meyer et al. [36] | Y | Y | UC | UC | NA | UC | UC | N | Y | Y | Y | 50 |
| Parsons et al. [37] | Y | Y | N | Y | NA | UC | UC | N | Y | Y | Y | 60 |
Publisher’s Note: MDPI stays neutral with regard to jurisdictional claims in published maps and institutional affiliations. |
© 2021 by the authors. Licensee MDPI, Basel, Switzerland. This article is an open access article distributed under the terms and conditions of the Creative Commons Attribution (CC BY) license (https://creativecommons.org/licenses/by/4.0/).
Share and Cite
Contreras-Díaz, G.; Chirosa-Ríos, L.J.; Chirosa-Ríos, I.; Intelangelo, L.; Jerez-Mayorga, D.; Martinez-Garcia, D. Reliability of Isokinetic Hip Flexor and Extensor Strength Measurements in Healthy Subjects and Athletes: A Systematic Review and Meta-Analysis. Int. J. Environ. Res. Public Health 2021, 18, 11326. https://doi.org/10.3390/ijerph182111326
Contreras-Díaz G, Chirosa-Ríos LJ, Chirosa-Ríos I, Intelangelo L, Jerez-Mayorga D, Martinez-Garcia D. Reliability of Isokinetic Hip Flexor and Extensor Strength Measurements in Healthy Subjects and Athletes: A Systematic Review and Meta-Analysis. International Journal of Environmental Research and Public Health. 2021; 18(21):11326. https://doi.org/10.3390/ijerph182111326
Chicago/Turabian StyleContreras-Díaz, Guido, Luis Javier Chirosa-Ríos, Ignacio Chirosa-Ríos, Leonardo Intelangelo, Daniel Jerez-Mayorga, and Darío Martinez-Garcia. 2021. "Reliability of Isokinetic Hip Flexor and Extensor Strength Measurements in Healthy Subjects and Athletes: A Systematic Review and Meta-Analysis" International Journal of Environmental Research and Public Health 18, no. 21: 11326. https://doi.org/10.3390/ijerph182111326
APA StyleContreras-Díaz, G., Chirosa-Ríos, L. J., Chirosa-Ríos, I., Intelangelo, L., Jerez-Mayorga, D., & Martinez-Garcia, D. (2021). Reliability of Isokinetic Hip Flexor and Extensor Strength Measurements in Healthy Subjects and Athletes: A Systematic Review and Meta-Analysis. International Journal of Environmental Research and Public Health, 18(21), 11326. https://doi.org/10.3390/ijerph182111326