
Electric Bicyclist Injury Severity during Peak Traffic Periods: A Random-Parameters Approach with Heterogeneity in Means and Variances

Abstract
:1. Introduction
2. Literature Review
2.1. Traffic Safety during Peak Traffic Periods
2.2. Traffic Safety of Electric Bicycles
2.3. Heterogeneity of Crash Models
3. Data Description
4. Methodology
5. Model Estimation Results
5.1. Random Parameters and Heterogeneity Observations
5.2. Driver and Bicyclist Characteristics
5.3. Vehicle Characteristics
5.4. Pre-Crash Vehicle Movement Characteristics
5.5. Roadway and Environmental Characteristics
6. Discussion
7. Conclusions
- A vehicle taking a U-turn ahead of an electric bicycle is less likely to cause severe injuries to the rider. The vehicle turning right further decreases the possibility of electric bicyclists sustaining severe injuries than left-turning because the latter moves in the left lane.
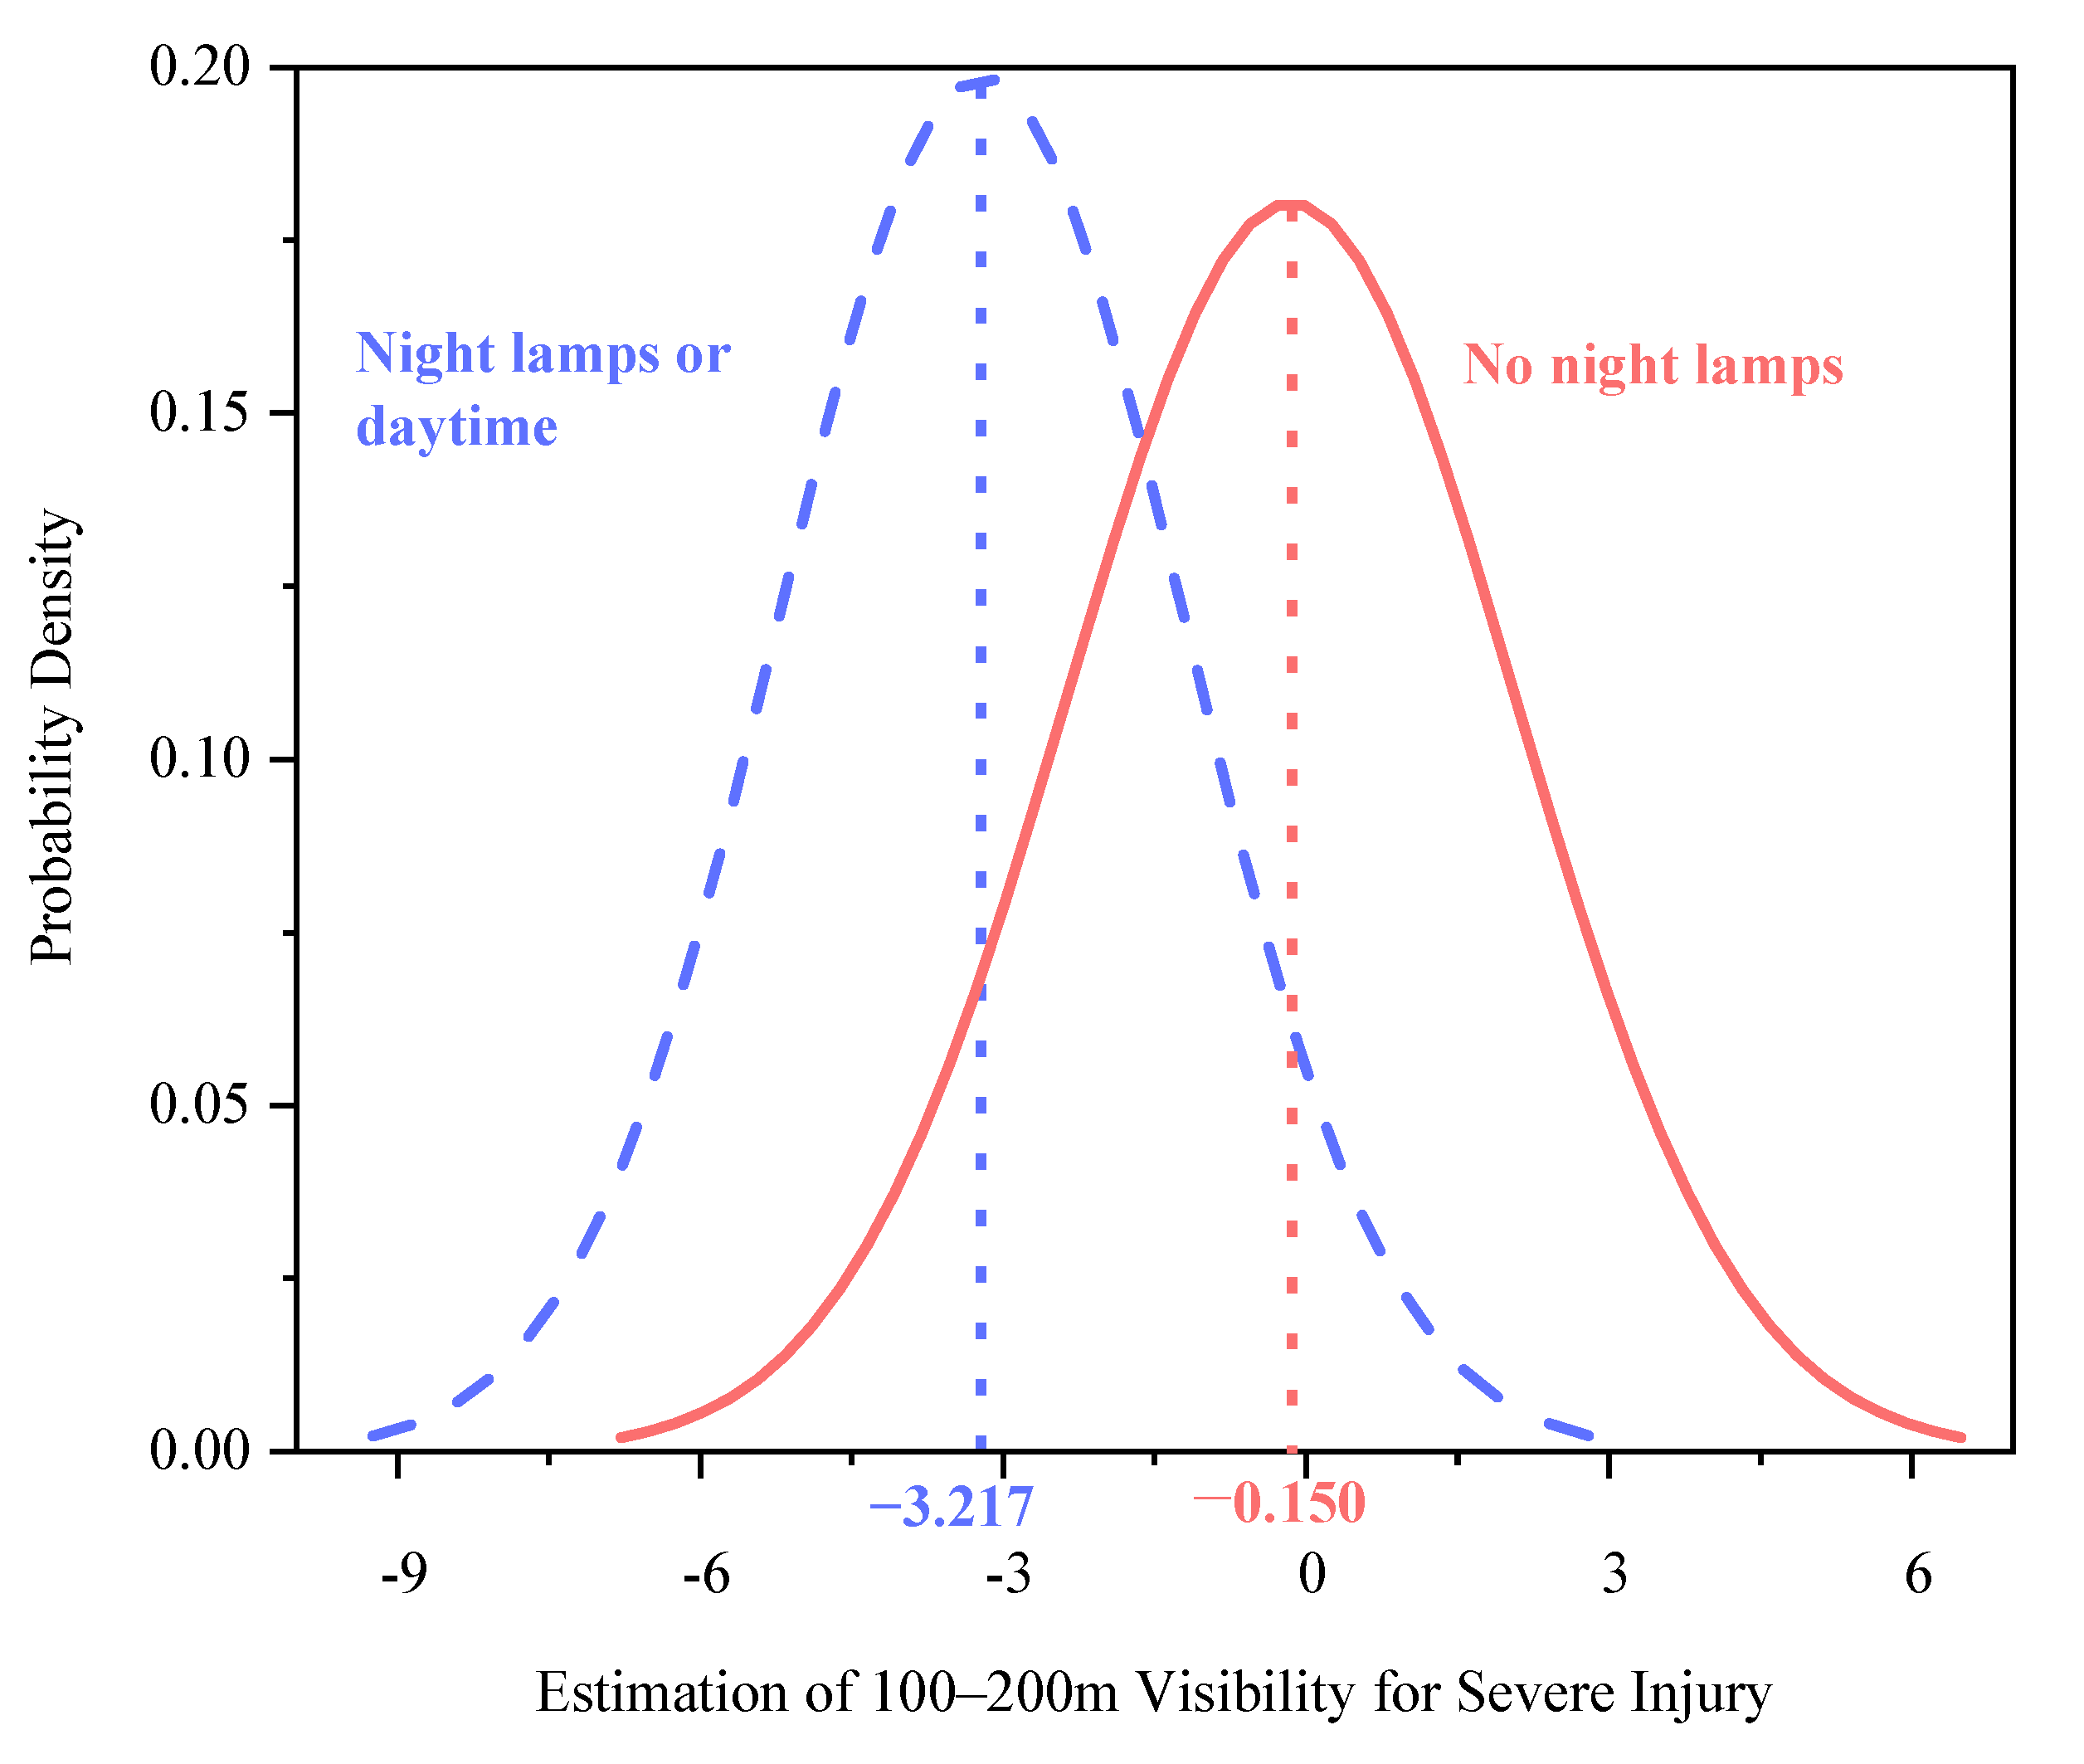
- The heterogeneity observations of poor visibility as a factor influencing injury severity disagree with those of previous studies. High visibility is not an absolute guarantee of less injury. Instead, it may present a potential risk of serious injury during peak periods. Therefore, to improve safety and lower the possibility of severe injuries, road segment control strategies must be modified to address the influence of high visibility during peak traffic hours.
- Amid poor visibility, driving at night without streetlights and driving in areas of traffic control pose a greater risk of electric bicyclist injury.
- There are significant differences between the protective effects of green belts and trees on two-wheelers during peak hours: the former have no significant impact on accident injuries while the latter is found to be the most effective roadside protection.
Author Contributions
Funding
Institutional Review Board Statement
Informed Consent Statement
Data Availability Statement
Conflicts of Interest
References
- Brach, A. Implementing the Results of the Second Strategic Highway Research Program: Saving Lives, Reducing Congestion, Improving Quality of Life; Transportation Research Board: Washington, DC, USA, 2009; ISSN 0738-6826. [Google Scholar]
- Milton, J.C.; Shankar, V.N.; Mannering, F.L. Highway accident severities and the mixed logit model: An exploratory empirical analysis. Accid. Anal. Prev. 2008, 40, 260–266. [Google Scholar] [CrossRef] [PubMed]
- Pahukula, J.; Hernandez, S.; Unnikrishnan, A. A time of day analysis of crashes involving large trucks in urban areas. Accid. Anal. Prev. 2015, 75, 155–163. [Google Scholar] [CrossRef] [PubMed]
- Behnood, A.; Mannering, F. Time-of-day variations and temporal instability of factors affecting injury severities in large-truck crashes. Anal. Methods Accid. Res. 2019, 23, 100102. [Google Scholar] [CrossRef]
- Uddin, M.; Huynh, N. Injury severity analysis of truck-involved crashes under different weather conditions. Accid. Anal. Prev. 2020, 141, 105529. [Google Scholar] [CrossRef] [PubMed]
- Dehzangi, O.; Williams, C. Towards multi-modal wearable driver monitoring: Impact of road condition on driver distraction. In Proceedings of the 2015 IEEE 12th International Conference on Wearable and Implantable Body Sensor Networks (BSN), Cambridge, MA, USA, 9–12 June 2015; pp. 1–6. [Google Scholar] [CrossRef]
- Kumar, V.; Bhat, C.R.; Pendyala, R.M.; You, D.; Ben-Elia, E.; Ettema, D. Impacts of incentive-based intervention on peak period traffic: Experience from the Netherlands. Transp. Res. Rec. 2016, 2543, 166–175. [Google Scholar] [CrossRef] [Green Version]
- Wang, C.; Kou, S.; Song, Y. Identify risk pattern of e-bike riders in China based on machine learning framework. Entropy 2019, 21, 1084. [Google Scholar] [CrossRef] [Green Version]
- Huang, Y.; Zhou, Q.; Koelper, C.; Li, Q.; Nie, B. Are riders of electric two-wheelers safer than bicyclists in collisions with motor vehicles? Accid. Anal. Prev. 2020, 134, 105336. [Google Scholar] [CrossRef] [PubMed]
- King, C.C.S.; Liu, M.; Patel, S.; Goo, T.T.; Lim, W.W.; Toh, H.C. Injury patterns associated with personal mobility devices and electric bicycles: An analysis from an acute general hospital in Singapore. Singap. Med. J. 2020, 61, 96–101. [Google Scholar] [CrossRef] [Green Version]
- China National Bureau of Statistics. China Statistical Yearbook 2019; China Statistics Press: Beijing, China, 2020. [Google Scholar]
- W.H.O. Global Status Report on Road Safety 2018: Summary; World Health Organization: Geneva, Switzerland, 2018. [Google Scholar]
- Wu, Z.; Zeng, X.; Wang, L. A new traffic conflict measurefor electric bicycles at intersections. Promet. Traffic Traffico 2020, 32, 309–320. [Google Scholar] [CrossRef]
- Yang, N.; Li, Y.; Liu, T.; Wang, J.; Zhao, H. Analysis of fatal factors influencing accidents involving two-wheel electric vehicle drivers at intersections. Leg. Med. 2020, 45, 101696. [Google Scholar] [CrossRef]
- Kim, J.K.; Ulfarsson, G.F.; Shankar, V.N.; Kim, S. Age and pedestrian injury severity in motor-vehicle crashes: A heteroskedastic logit analysis. Accid. Anal. Prev. 2008, 40, 1695–1702. [Google Scholar] [CrossRef]
- Behnood, A.; Mannering, F. Determinants of bicyclist injury severities in bicycle-vehicle crashes: A random parameters approach with heterogeneity in means and variances. Anal. Methods Accid. Res. 2017, 16, 35–47. [Google Scholar] [CrossRef]
- Downs, A. Still Stuck Traffic Coping with Peak-Hour Traffic Congestion; The Brookings Institution: Washington, DC, USA, 2005; ISBN 9780815796558. [Google Scholar]
- Khorashadi, A.; Niemeier, D.; Shankar, V.; Mannering, F. Differences in rural and urban driver-injury severities in accidents involving large-trucks: An exploratory analysis. Accid. Anal. Prev. 2005, 37, 910–921. [Google Scholar] [CrossRef]
- Wemegah, T.D.; Zhu, S.; Atombo, C. Modeling the effect of days and road type on peak period travels using structural equation modeling and big data from radio frequency identification for private cars and taxis. Eur. Transp. Res. Rev. 2018, 10, 1–14. [Google Scholar] [CrossRef]
- Gu, Z.; Peng, B. Investigation into the built environment impacts on pedestrian crash frequencies during morning, noon/afternoon, night, and during peak hours: A case study in Miami County, Florida. J. Transp. Saf. Secur. 2019, 13, 915–935. [Google Scholar] [CrossRef]
- Chen, F.; Chen, S. Injury severities of truck drivers in single- and multi-vehicle accidents on rural highways. Accid. Anal. Prev. 2011, 43, 1677–1688. [Google Scholar] [CrossRef]
- Nie, J.; Yang, J. A study of bicyclist kinematics and injuries based on reconstruction of passenger car-bicycle accident in China. Accid. Anal. Prev. 2014, 71, 50–59. [Google Scholar] [CrossRef] [PubMed]
- Siman-Tov, M.; Radomislensky, I.; Peleg, K.; Bahouth, H.; Becker, A.; Jeroukhimov, I.; Karawani, I.; Kessel, B.; Klein, Y.; Lin, G.; et al. A look at electric bike casualties: Do they differ from the mechanical bicycle? J. Transp. Health 2018, 11, 176–182. [Google Scholar] [CrossRef]
- Fyhri, A.; Johansson, O.; Bjørnskau, T. Gender differences in accident risk with e-bikes—Survey data from Norway. Accid. Anal. Prev. 2019, 132, 105248. [Google Scholar] [CrossRef]
- Qian, Y.; Sun, Q.; Fei, G.; Li, X.; Stallones, L.; Xiang, H.; Zhang, X. Riding behavior and electric bike traffic crashes: A Chinese case-control study. Traffic Inj. Prev. 2020, 21, 24–28. [Google Scholar] [CrossRef] [PubMed]
- Lin, S.; Goldman, S.; Peleg, K.; Levin, L.; Abbod, N.; Bahouth, H.; Bala, M.; Becker, A.; Beneli, M.; Braslavsky, A.; et al. Dental and maxillofacial injuries associated with electric-powered bikes and scooters in Israel: A report for 2014-2019. Dent. Traumatol. 2020, 36, 533–537. [Google Scholar] [CrossRef]
- Han, Y.; He, W.; Shi, L.; Wu, H.; Pan, D.; Huang, H. Helmet protective performance via reconstruction of electric two-wheeler rider’s head-to-ground impact accidents. Int. J. Crashworth. 2020, 25, 493–504. [Google Scholar] [CrossRef]
- Seraneeprakarn, P.; Huang, S.; Shankar, V.; Mannering, F.; Venkataraman, N.; Milton, J. Occupant injury severities in hybrid-vehicle involved crashes: A random parameters approach with heterogeneity in means and variances. Anal. Methods Accid. Res. 2017, 15, 41–55. [Google Scholar] [CrossRef]
- Shankar, V.; Mannering, F. An exploratory multinomial logit analysis of single-vehicle motorcycle accident severity. J. Saf. Res. 1996, 27, 183–194. [Google Scholar] [CrossRef]
- Rifaat, R. Industrial motor protection. IEEE Ind. Appl. Mag. 2012, 18, 10–11. [Google Scholar] [CrossRef]
- Eluru, N.; Bhat, C.R.; Hensher, D.A. A mixed generalized ordered response model for examining pedestrian and bicyclist injury severity level in traffic crashes. Accid. Anal. Prev. 2008, 40, 1033–1054. [Google Scholar] [CrossRef] [Green Version]
- Behnood, A.; Mannering, F.L. An empirical assessment of the effects of economic recessions on pedestrian-injury crashes using mixed and latent-class models. Anal. Methods Accid. Res. 2016, 12, 1–17. [Google Scholar] [CrossRef]
- Yu, M.; Zheng, C.; Ma, C. Analysis of injury severity of rear-end crashes in work zones: A random parameters approach with heterogeneity in means and variances. Anal. Methods Accid. Res. 2020, 27, 100126. [Google Scholar] [CrossRef]
- Li, Y.; Song, L.; Fan, W.D. Day-of-the-week variations and temporal instability of factors influencing pedestrian injury severity in pedestrian-vehicle crashes: A random parameters logit approach with heterogeneity in means and variances. Anal. Methods Accid. Res. 2021, 29, 100152. [Google Scholar] [CrossRef]
- Yan, X.; He, J.; Zhang, C.; Liu, Z.; Wang, C.; Qiao, B. Temporal analysis of crash severities involving male and female drivers:A random parameters approach with heterogeneity in means and variances. Anal. Methods Accid. Res. 2021, 30, 100161. [Google Scholar] [CrossRef]
- Anastasopoulos, P.C.; Mannering, F.L. An empirical assessment of fixed and random parameter logit models using crash- and non-crash-specific injury data. Accid. Anal. Prev. 2011, 43, 1140–1147. [Google Scholar] [CrossRef]
- Malyshkina, N.V.; Mannering, F.L.; Tarko, A.P. Markov switching negative binomial models: An application to vehicle accident frequencies. Accid. Anal. Prev. 2009, 41, 217–226. [Google Scholar] [CrossRef] [Green Version]
- Xiong, Y.; Tobias, J.L.; Mannering, F.L. The analysis of vehicle crash injury-severity data: A Markov switching approach with road-segment heterogeneity. Transp. Res. Part B Methodol. 2014, 67, 109–128. [Google Scholar] [CrossRef]
- Behnood, A.; Roshandeh, A.M.; Mannering, F.L. Latent class analysis of the effects of age, gender, and alcohol consumption on driver-injury severities. Anal. Methods Accid. Res. 2014, 3–4, 56–91. [Google Scholar] [CrossRef]
- Yasmin, S.; Eluru, N.; Bhat, C.R.; Tay, R. A latent segmentation based generalized ordered logit model to examine factors influencing driver injury severity. Anal. Methods Accid. Res. 2014, 1, 23–38. [Google Scholar] [CrossRef]
- Abay, K.A.; Paleti, R.; Bhat, C.R. The joint analysis of injury severity of drivers in two-vehicle crashes accommodating seat belt use endogeneity. Transp. Res. Part B Methodol. 2013, 50, 74–89. [Google Scholar] [CrossRef] [Green Version]
- Russo, B.J.; Savolainen, P.T.; Schneider, W.H., IV; Anastasopoulos, P.C. Comparison of factors affecting injury severity in angle collisions by fault status using a random parameters bivariate ordered probit model. Anal. Methods Accid. Res. 2014, 2, 21–29. [Google Scholar] [CrossRef]
- Xin, C.; Guo, R.; Wang, Z.; Lu, Q.; Lin, P.S. The effects of neighborhood characteristics and the built environment on pedestrian injury severity: A random parameters generalized ordered probability model with heterogeneity in means and variances. Anal. Methods Accid. Res. 2017, 16, 117–132. [Google Scholar] [CrossRef]
- Yu, M.; Ma, C.; Shen, J. Temporal stability of driver injury severity in single-vehicle roadway departure crashes: A random thresholds random parameters hierarchical ordered probit approach. Anal. Methods Accid. Res. 2021, 29, 100144. [Google Scholar] [CrossRef]
- Zhai, G.; Yang, H.; Liu, J. Is the front passenger seat always the “death seat”? An application of a hierarchical ordered probit model for occupant injury severity. Int. J. Inj. Contr. Saf. Promot. 2020, 27, 438–446. [Google Scholar] [CrossRef]
- Mannering, F.L.; Shankar, V.; Bhat, C.R. Unobserved heterogeneity and the statistical analysis of highway accident data. Anal. Methods Accid. Res. 2016, 11, 1–16. [Google Scholar] [CrossRef]
- McFadden, D. Econometric Models of Probabilistic Choice, Structural Analysis of Discrete Data with Econometric Applications; MIT Press: Cambridge, MA, USA, 1981. [Google Scholar]
- Train, K.E. Discrete Choice Methods with Simulation; The Second Press: New York, NY, USA, 2003; ISBN 9780511753930. [Google Scholar]
- Washington, S.P.; Karlaftis, M.G.; Mannering, F.L. Statistical and Econometric Methods for Transportation Data Analysis, 2nd ed.; CRC Press: Boca Raton, FL, USA, 2010; ISBN 9781420082869. [Google Scholar]
- Halton, J.H. On the efficiency of certain quasi-random sequences of points in evaluating multi-dimensional integrals. Numer. Math. 1960, 2, 84–90. [Google Scholar] [CrossRef]
- Trick, L.M.; Toxopeus, R.; Wilson, D. The effects of visibility conditions, traffic density, and navigational challenge on speed compensation and driving performance in older adults. Accid. Anal. Prev. 2010, 42, 1661–1671. [Google Scholar] [CrossRef]
- Hou, Q.; Huo, X.; Leng, J.; Cheng, Y. Examination of driver injury severity in freeway single-vehicle crashes using a mixed logit model with heterogeneity-in-means. Phys. A Stat. Mech. Appl. 2019, 531, 121760. [Google Scholar] [CrossRef]
- Vogt, A.; Bared, J. Accident models for two-lane rural segments and intersections. Transp. Res. Rec. 1998, 1635, 18–29. [Google Scholar] [CrossRef]
- Pang, M.B.; Zheng, S.S.; Cai, Z.H. Simulation of three lanes one-way freeway in low visibility weather by possible traffic accidents. Phys. Stat. Mech. Appl. 2015, 433, 161–170. [Google Scholar] [CrossRef]
- Peng, Y.; Abdel-Aty, M.; Shi, Q.; Yu, R. Assessing the impact of reduced visibility on traffic crash risk using microscopic data and surrogate safety measures. Transp. Res. Part C Emerg. Technol. 2017, 74, 295–305. [Google Scholar] [CrossRef] [Green Version]
- Taszarek, M.; Kendzierski, S.; Pilguj, N. Hazardous weather affecting European airports: Climatological estimates of situations with limited visibility, thunderstorm, low-level wind shear and snowfall from ERA5. Weather Clim. Extrem. 2020, 28, 100243. [Google Scholar] [CrossRef]
- Lee, J.; Mannering, F. Impact of roadside features on the frequency and severity of run-off-roadway accidents: An empirical analysis. Accid. Anal. Prev. 2002, 34, 149–161. [Google Scholar] [CrossRef]


| Study | Methodology | Object of Study | Heterogeneity | Key Finding |
|---|---|---|---|---|
| [17] | Review | / | / | The study proposed to cope with the “excess” peak-hour demand for road space by constructing sufficient public transit facilities and shifting all the “excess” peak-hour demand there. |
| [18] | Multinomial logit model | Injury severity | / | In urban areas, crashes happened between 5 a.m. and 8 a.m. Application of the model can reduce the possibility of drivers suffering severe or fatal injuries. |
| [21] | Mixed logit model | Injury severity | / | In a single-vehicle model, accidents on rural highways during the busy harvest period may cause non-incapacitating injuries. |
| [3] | Mixed logit model | Injury severity | / | Different periods have different contributing factors to each degree of injury severity. |
| [7] | Mixed panel multinomial logit model | Traveler choices | √ | Socioeconomic factors, work attributes, and trip characteristics (degree of flexibility) affect the traveler’s response during the peak traffic period. |
| [19] | Structural equation model | Vehicle movement | / | Weekday travel influences peak-hour travel more than weekend, and the choice of road and car types have different effects on peak-hour travels. |
| [6] | Mixed logit model | Injury severity | √ | Different periods have different impacts on different degrees of injury severity. |
| [20] | Negative binomial regression and zero-inflated negative binomial regression | Crash frequency | / | Pedestrians are more likely to be hit by a vehicle if they cross signalized traffic light intersections during peak traffic hours. During the peak period, road segments with more bus stops are more likely to cause collisions between vehicles and pedestrians. |
| [5] | Mixed logit model | Injury severity | √ | Crashes occurring during the morning peak hours were found to increase the probability of major injuries in sunny weather, whereas crashes occurring during the evening peak hours were found to increase the probability of major injury in snowy weather. |
| Study | Methodology | Unique Factors | Heterogeneity | Key Findings |
|---|---|---|---|---|
| [22] | Accident reconstruction simulation | Head impact speed, time of head impact, and impact angle of bicyclists with vehicle impact speed, wrap-around distance, and throw-out distance | / | Wrap-around distance, head impact speed, time of head impact, head impact angle, and throw-out distance of bicyclists have a strong relationship with the vehicle impact speed. A higher vehicle impact speed puts the electric bicyclist at a higher risk of injury. |
| [23] | Historic prospective study | Population group, hospital resource utilization, discharge disposition, and injured body region | / | Arab children (aged 0–15) and young adults (aged 16–29) are at higher risk of e-bike accidents. E-bikers are at a greater risk of head and lower-extremity injuries. Consequently, they will require surgery, longer hospital stays, and visits to the rehabilitation center. |
| [24] | Simple chi-square statistics analysis and logit regression model | Gender, distance cycled/week, bicycle type, participants’ reported cause of accidents | / | Females are more prone to accidents on electric bikes than conventional ones, whereas males are equally prone to accidents on both bikes. |
| [10] | Retrospective study | Ethnicity, motorized device, nonmotorized device and type of impact | / | Electric bikes always cause mild injuries, which are mainly superficial wounds and upper- and lower-limb injuries. |
| [26] | Retrospective cohort study | Region, oral, and maxillofacial injuries, and hospital resource utilization | / | Electric bikers suffer mainly oral and maxillofacial injuries and pedestrians involved in electric bike crashes, who are mostly children and older people, suffer oral and maxillofacial injuries. |
| [25] | Multiple-factor conditional logistic regression | Marital status, electric bike type, and electric bikers’ behavior | / | Multiple-factor conditional logistic regression analysis of e-bike-related traffic crashes identified running red lights, drinking and riding, carrying adults while riding, turning without signaling, riding in the motor vehicle lane, prior crash history, and type of e-bike as possible risk factors for e-bike traffic crashes. |
| [14] | Main factor analysis | Collision objects, speed, driving direction, sight obstacle, and riders’ violation | / | Two-wheel electric vehicles are most prone to accidents when turning left. The most common collision object for two-wheel electric-vehicle riders are automobiles. |
| [27] | In-depth accident reconstruction and validated finite element model | Stress–strain performance, material of helmet outer shell, landing condition, and velocity of three parts of the human body before head impact | / | Electric bicyclist helmets not offering adequate protection increase the risk of injury. |
| [9] | Finite element model | Geometric and mass parameters of bicycle and electric two-wheeler and moving velocities of all parties and their initial relative position | / | The risk of head injury to electric bicyclists increases with the oncoming vehicle velocity. Riders with a larger stature have a higher chance of escaping head impact on the vehicle. In collision with a sedan or an SUV will cause electric bicyclists’ lower head injuries. |
| Variable | Mean | Standard Deviation (SD) | Variable | Mean | SD |
|---|---|---|---|---|---|
| Driver and Bicyclist Characteristics | Roadway and Environmental Characteristics | ||||
| Male Vehicle Driver | 0.91 | 0.29 | Time of accident is a weekday | 0.73 | 0.44 |
| Male Electric Bicyclist | 0.71 | 0.45 | Roadway location is under traffic control | 0.18 | 0.39 |
| Electric Bicyclist Age Group < 18 years | 0.36 | 0.48 | Roadside protection is not provided | 0.60 | 0.49 |
| Electric Bicyclist Age Group 18–30 years | 0.33 | 0.47 | Roadside protections are trees | 0.14 | 0.35 |
| Electric Bicyclist Age Group 31–40 years | 0.24 | 0.43 | Roadside protections are green belts | 0.13 | 0.34 |
| Electric Bicyclist Age Group 41–50 years | 0.07 | 0.25 | Roadside protections are fences | 0.07 | 0.26 |
| Electric Bicyclist Age Group > 50 years | 0.01 | 0.11 | Roadside protections are truck escape ramps | 0.05 | 0.22 |
| Vehicle Driver Age Group 18–30 years | 0.18 | 0.39 | Roadside protections are protective piers | 0.11 | 0.19 |
| Vehicle Driver Age Group 31–40 years | 0.20 | 0.40 | Roadside protections are buffers | 0.38 | 0.14 |
| Vehicle Driver Age Group 41–50 years | 0.24 | 0.42 | Road surface condition is rough | 0.99 | 0.11 |
| Vehicle Driver Age Group > 50 years | 0.36 | 0.48 | Road surface is dry | 0.89 | 0.31 |
| Vehicle Driving Experience 1–5 years | 0.22 | 0.41 | Pavement structure is bituminous | 0.92 | 0.27 |
| Vehicle Driving Experience 6–10 years | 0.26 | 0.44 | Crash occurred in road segments | 0.79 | 0.40 |
| Vehicle Driving Experience 11–15 years | 0.41 | 0.49 | Road alignment is flat and straight | 0.90 | 0.30 |
| Vehicle Driving Experience > 15 years | 0.11 | 0.32 | Road type is general urban road | 0.58 | 0.49 |
| Intoxicated | 0.16 | 0.64 | Road type is graded highway | 0.28 | 0.45 |
| Vehicle Characteristics | Road type is urban expressway or another urban road | 0.14 | 0.34 | ||
| Vehicle Insured | 0.99 | 0.10 | Weather is sunny | 0.78 | 0.41 |
| Sedan | 0.74 | 0.44 | Weather is foggy | 0.65 | 0.14 |
| Passenger Car | 0.06 | 0.24 | Weather is cloudy | 0.13 | 0.34 |
| Truck | 0.18 | 0.38 | Weather is rainy | 0.07 | 0.26 |
| Motorcycle | 0.02 | 0.15 | Weather is snowy or covered with hail | 0.01 | 0.11 |
| * Abnormal | 0.99 | 0.11 | Visibility is more than 200 m | 0.49 | 0.50 |
| Overloaded | 0.02 | 0.13 | Visibility is 100–200 m | 0.23 | 0.42 |
| Pre-crash Vehicle Movement Characteristics | Visibility is 50–100 m | 0.20 | 0.40 | ||
| Go Straight | 0.76 | 0.42 | Visibility is less than 50 m | 0.09 | 0.28 |
| U-turn | 0.02 | 0.16 | Landform is plain | 0.97 | 0.17 |
| Turning Left | 0.10 | 0.30 | Lighting condition is daytime | 0.71 | 0.46 |
| Turning Right | 0.11 | 0.32 | Lighting condition is ‘streetlight at night’ | 0.20 | 0.40 |
| No Braking | 0.23 | 0.14 | Lighting condition is ‘no streetlight at night’ | 0.07 | 0.26 |
| Partial Braking | 0.06 | 0.22 | Lighting condition is natural light of dawn or dusk | 0.02 | 0.15 |
| Entire Braking | 0.18 | 0.66 | Location of accident is downtown | 0.45 | 0.50 |
| Throttle Loose | 0.05 | 0.24 | Construction area | 0.09 | 0.21 |
| Variable | Mixed Logit | ||
|---|---|---|---|
| No Mean–Variance Heterogeneity | Mean Heterogeneity | Mean–Variance Heterogeneity | |
| Coefficient (t-Statistic) | Coefficient (t-Statistic) | Coefficient (t-Statistic) | |
| Constant [I] | 5.428 ***(8.57) | 5.428 *** (8.57) | 5.473 *** (9.12) |
| Constant [I+] | −3.957 *** (−8.62) | −3.957 *** (−7.95) | −3.716 *** (−7.57) |
| Constant [I++] | −2.854 *** (−18.47) | −2.854 *** (−18.47) | −2.811 *** (−19.04) |
| Driver and Bicyclist Characteristics | |||
| Female Electric Bicyclist [I] | −1.228 *** (3.12) | −1.228 *** (3.12) | −1.237 *** (3.04) |
| Vehicle Characteristics | |||
| Passenger Car [I+] | 0.653 ** (2.46) | 0.653 ** (2.46) | 0.701 ** (2.56) |
| Passenger Car [I++] | 1.122 *** (6.08) | 1.125 *** (6.05) | 1.408 *** (4.79) |
| Truck [I+] | 1.125 *** (6.58) | 1.196 *** (6.46) | 1.187 *** (6.34) |
| Truck [I++] | 1.756 *** (11.78) | 1.833 *** (11.56) | 1.825 *** (10.89) |
| Motorcycle [I] | −1.288 *** (−3.56) | −1.455 *** (−4.05) | −1.455 *** (−3.88) |
| Pre-crash Vehicle Movement Characteristics | |||
| U-turn [I+] | −1.857 *** (−3.07) | −1.946 *** (−4.05) | −2.105 *** (−3.94) |
| U-turn [I++] | −1.887 ** (−2.22) | −1.889 ** (−2.44) | −1.890 ** (−2.42) |
| Turning Left [I+] | −2.055 *** (−5.02) | −2.277 *** (−4.89) | −2.028 *** (−4.88) |
| Turning Left [I++] | −1.588 *** (−4.02) | −1.276 *** (−3.48) | −1.426 *** (−4.02) |
| Turning Right [I+] | −1.725 *** (−5.20) | −1.701 *** (−5.16) | −1.770 *** (−6.42) |
| Turning Right [I++] | −0.653 ** (−2.12) | −0.653 ** (−2.12) | −0.652 ** (−2.08) |
| Roadway and Environmental Characteristics | |||
| Traffic Control [I+] | −0.725 *** (−3.22) | −0.728 *** (−3.37) | −0.806 *** (−3.91) |
| Roadside Protection Trees [I+] | −0.988 *** (−4.29) | −0.993 *** (−3.43) | −1.021 *** (−3.84) |
| Roadside Protection Fences [I+] | −1.428 *** (−4.01) | −1.458 *** (−4.15) | −1.559 *** (−4.15) |
| Road Segments [I+] | 2.048 *** (4.26) | 2.125 *** (4.12) | 2.218 *** (4.86) |
| Flat and Straight Road Alignment [I+] | −1.701 *** (3.04) | −1.628 *** (3.22) | −1.112 *** (4.07) |
| Graded Highway [I+] | 0.480 ** (2.41) | 0.491 ** (2.41) | 0.485 ** (1.95) |
| Graded Highway [I++] | 0.855 *** (4.94) | 0.877 *** (4.85) | 0.827 *** (4.88) |
| Urban Expressway or another Urban Road [I+] | 0.852 *** (3.97) | 0.565 *** (3.48) | 0.786 *** (4.05) |
| Visibility < 50 m [I] | −0.528 ** (−2.42) | −0.701 ** (−2.39) | −0.897 ** (−2.37) |
| Streetlights at Night [I+] | 0.398 ** (2.17) | 0.527 ** (2.11) | 0.242 ** (2.19) |
| No Lights at Night [I+] | 0.958 ** (2.13) | 0.727 ** (2.34) | 0.672 ** (2.48) |
| Downtown Driving [I+] | 1.424 *** (6.12) | 1.486 *** (5.78) | 1.271 *** (6.01) |
| Random Parameters (Normal Distribution) | |||
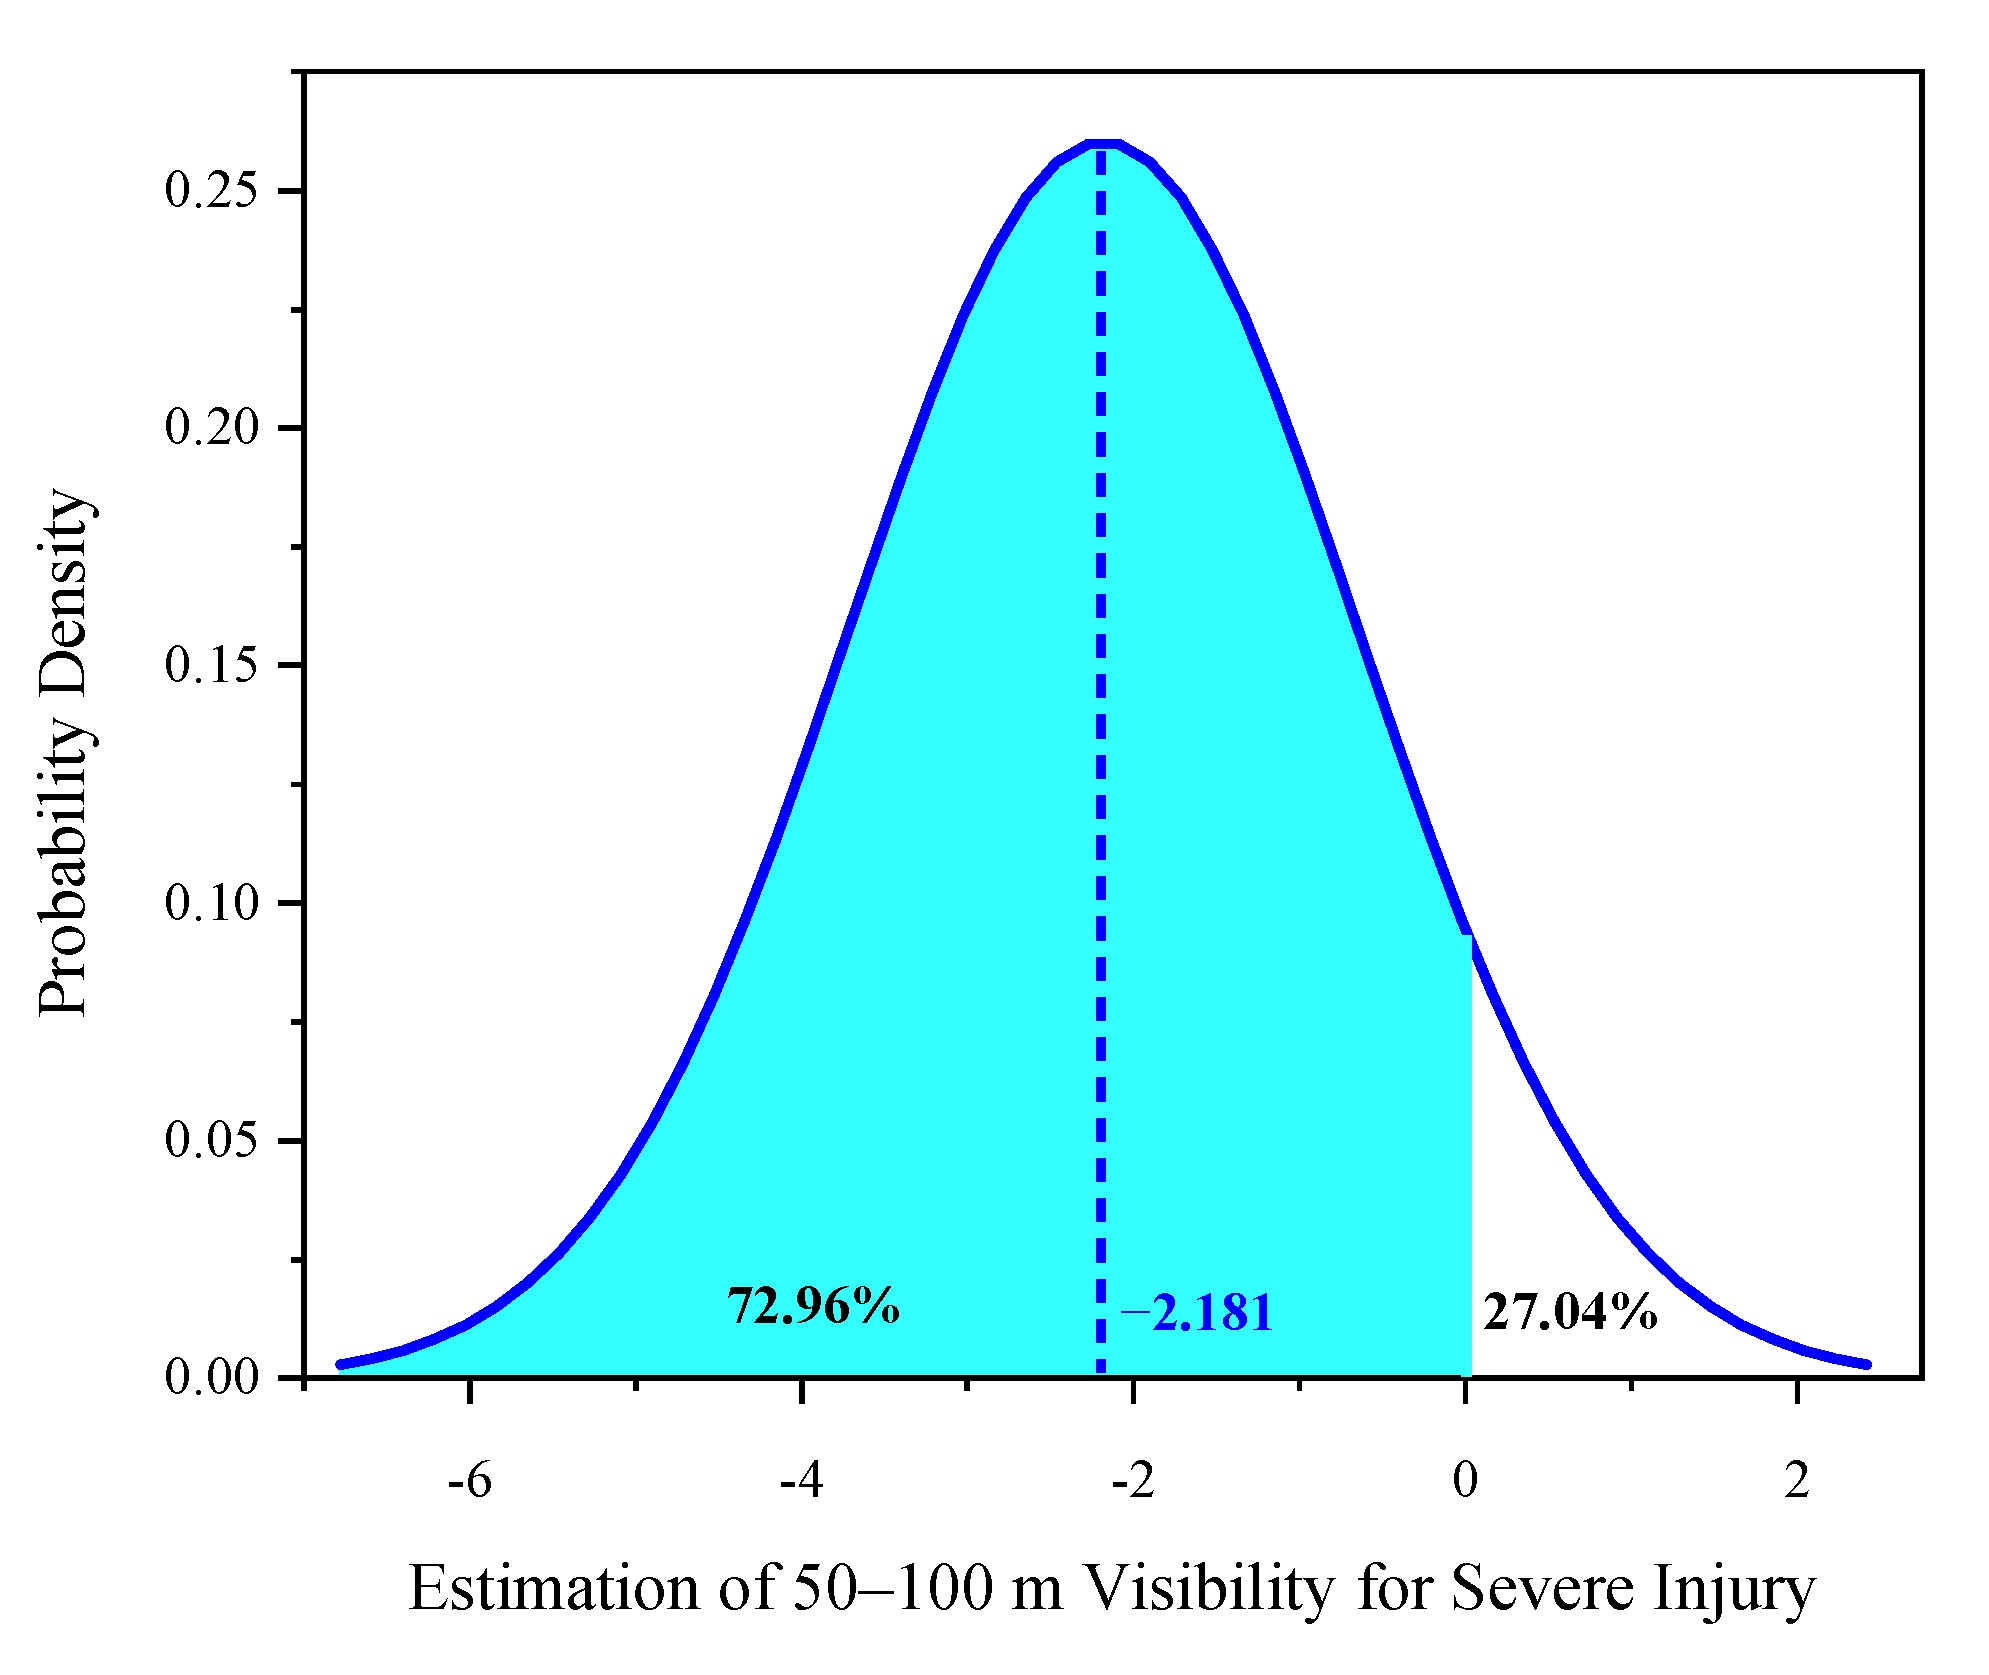
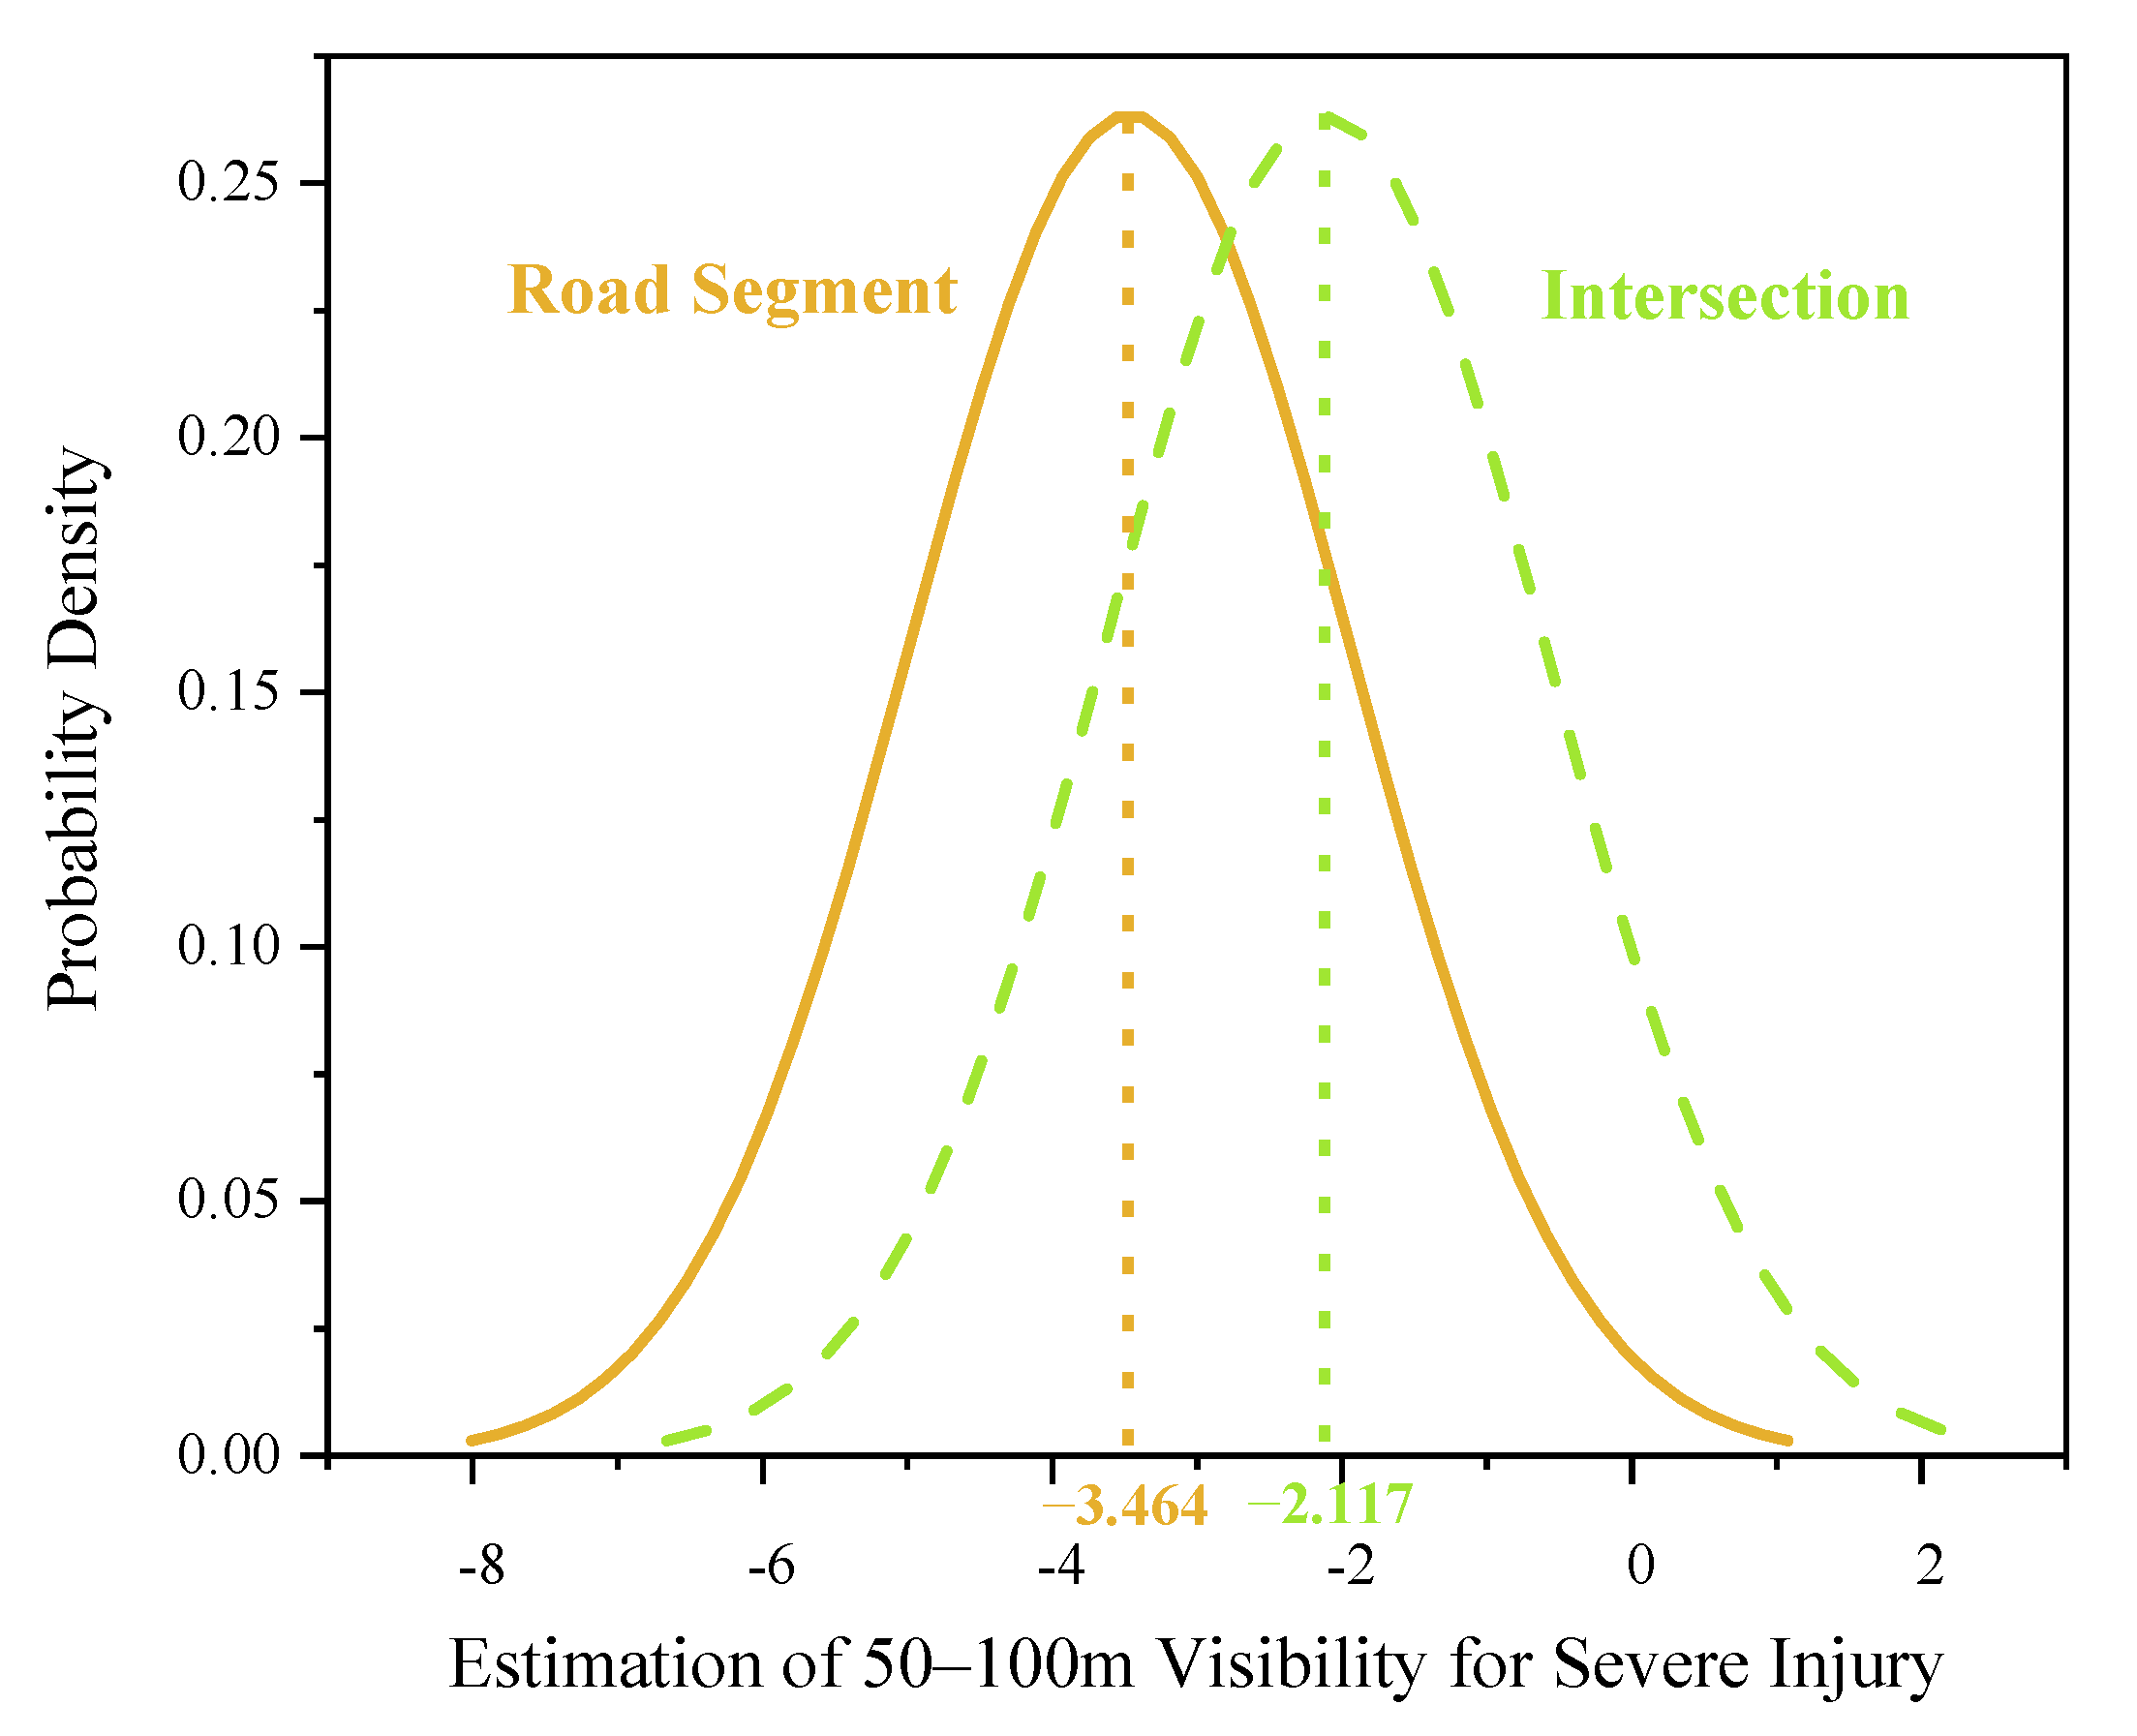
| Visibility 50–100 m [I+] | −2.181 ** (−2.25) | −2.117 ** (−2.14) | −2.331 ** (−2.21) |
| SD for random parameter | 2.348 ** (2.32) | 2.294 ** (2.14) | 2.581 ** (2.49) |
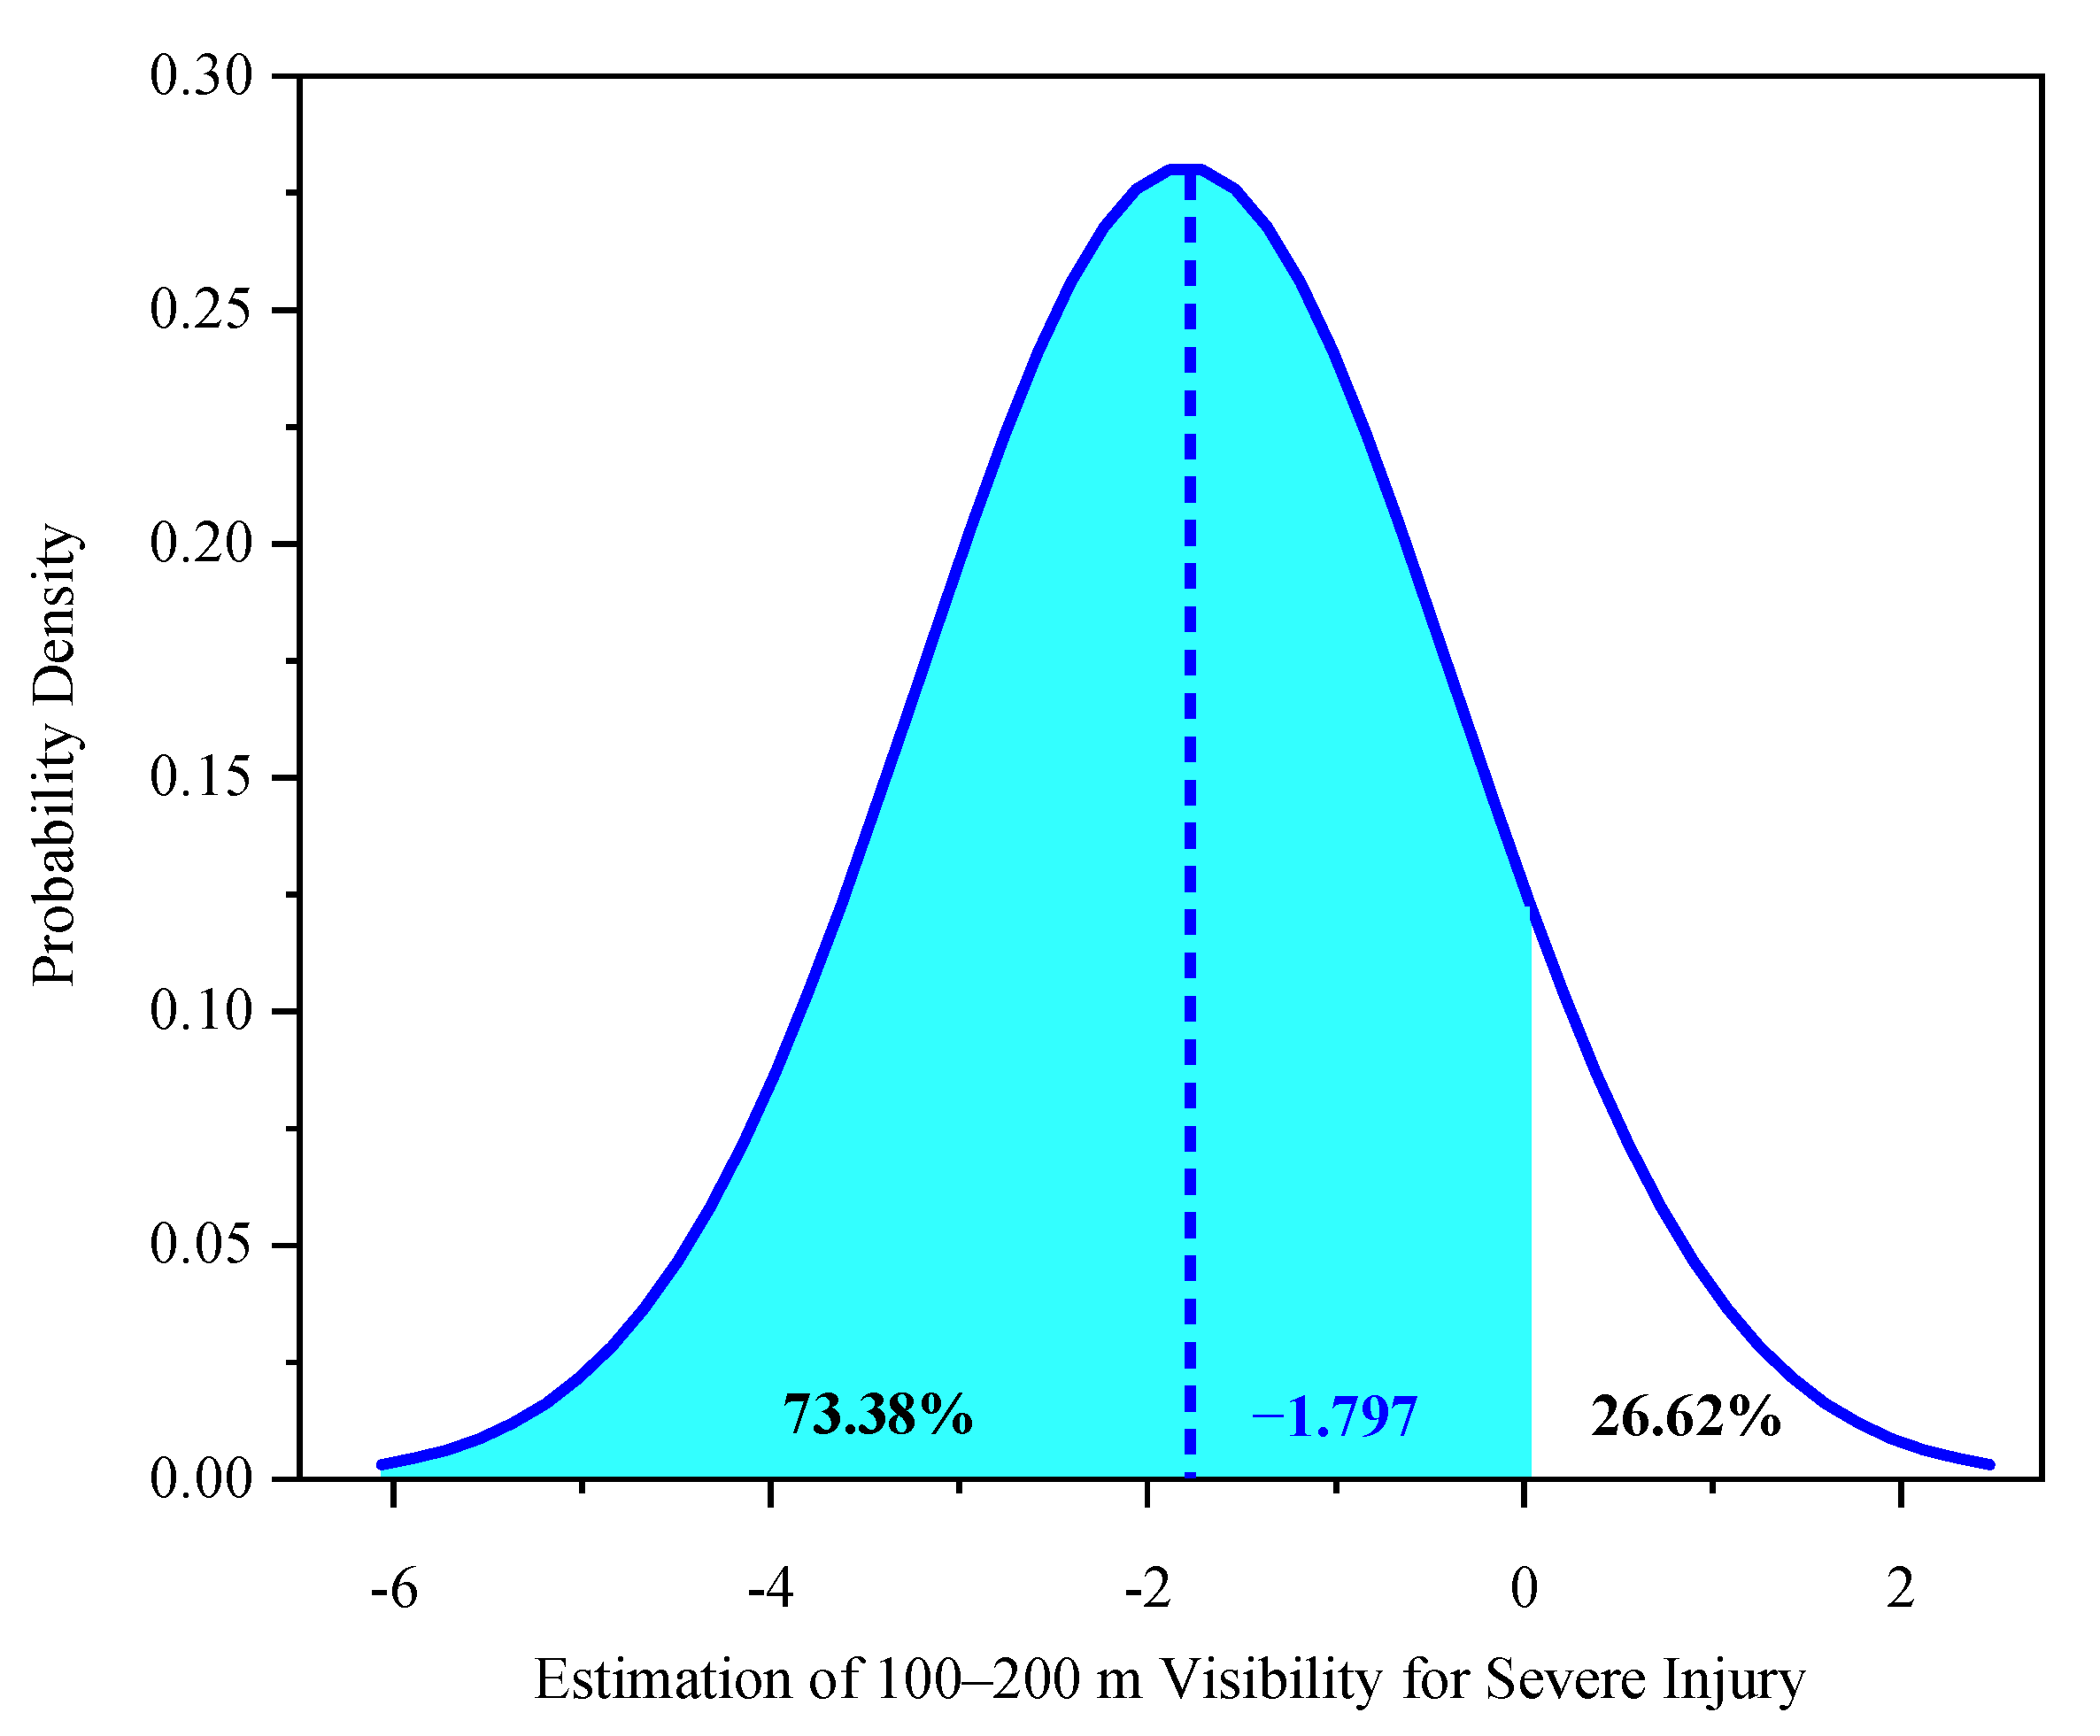
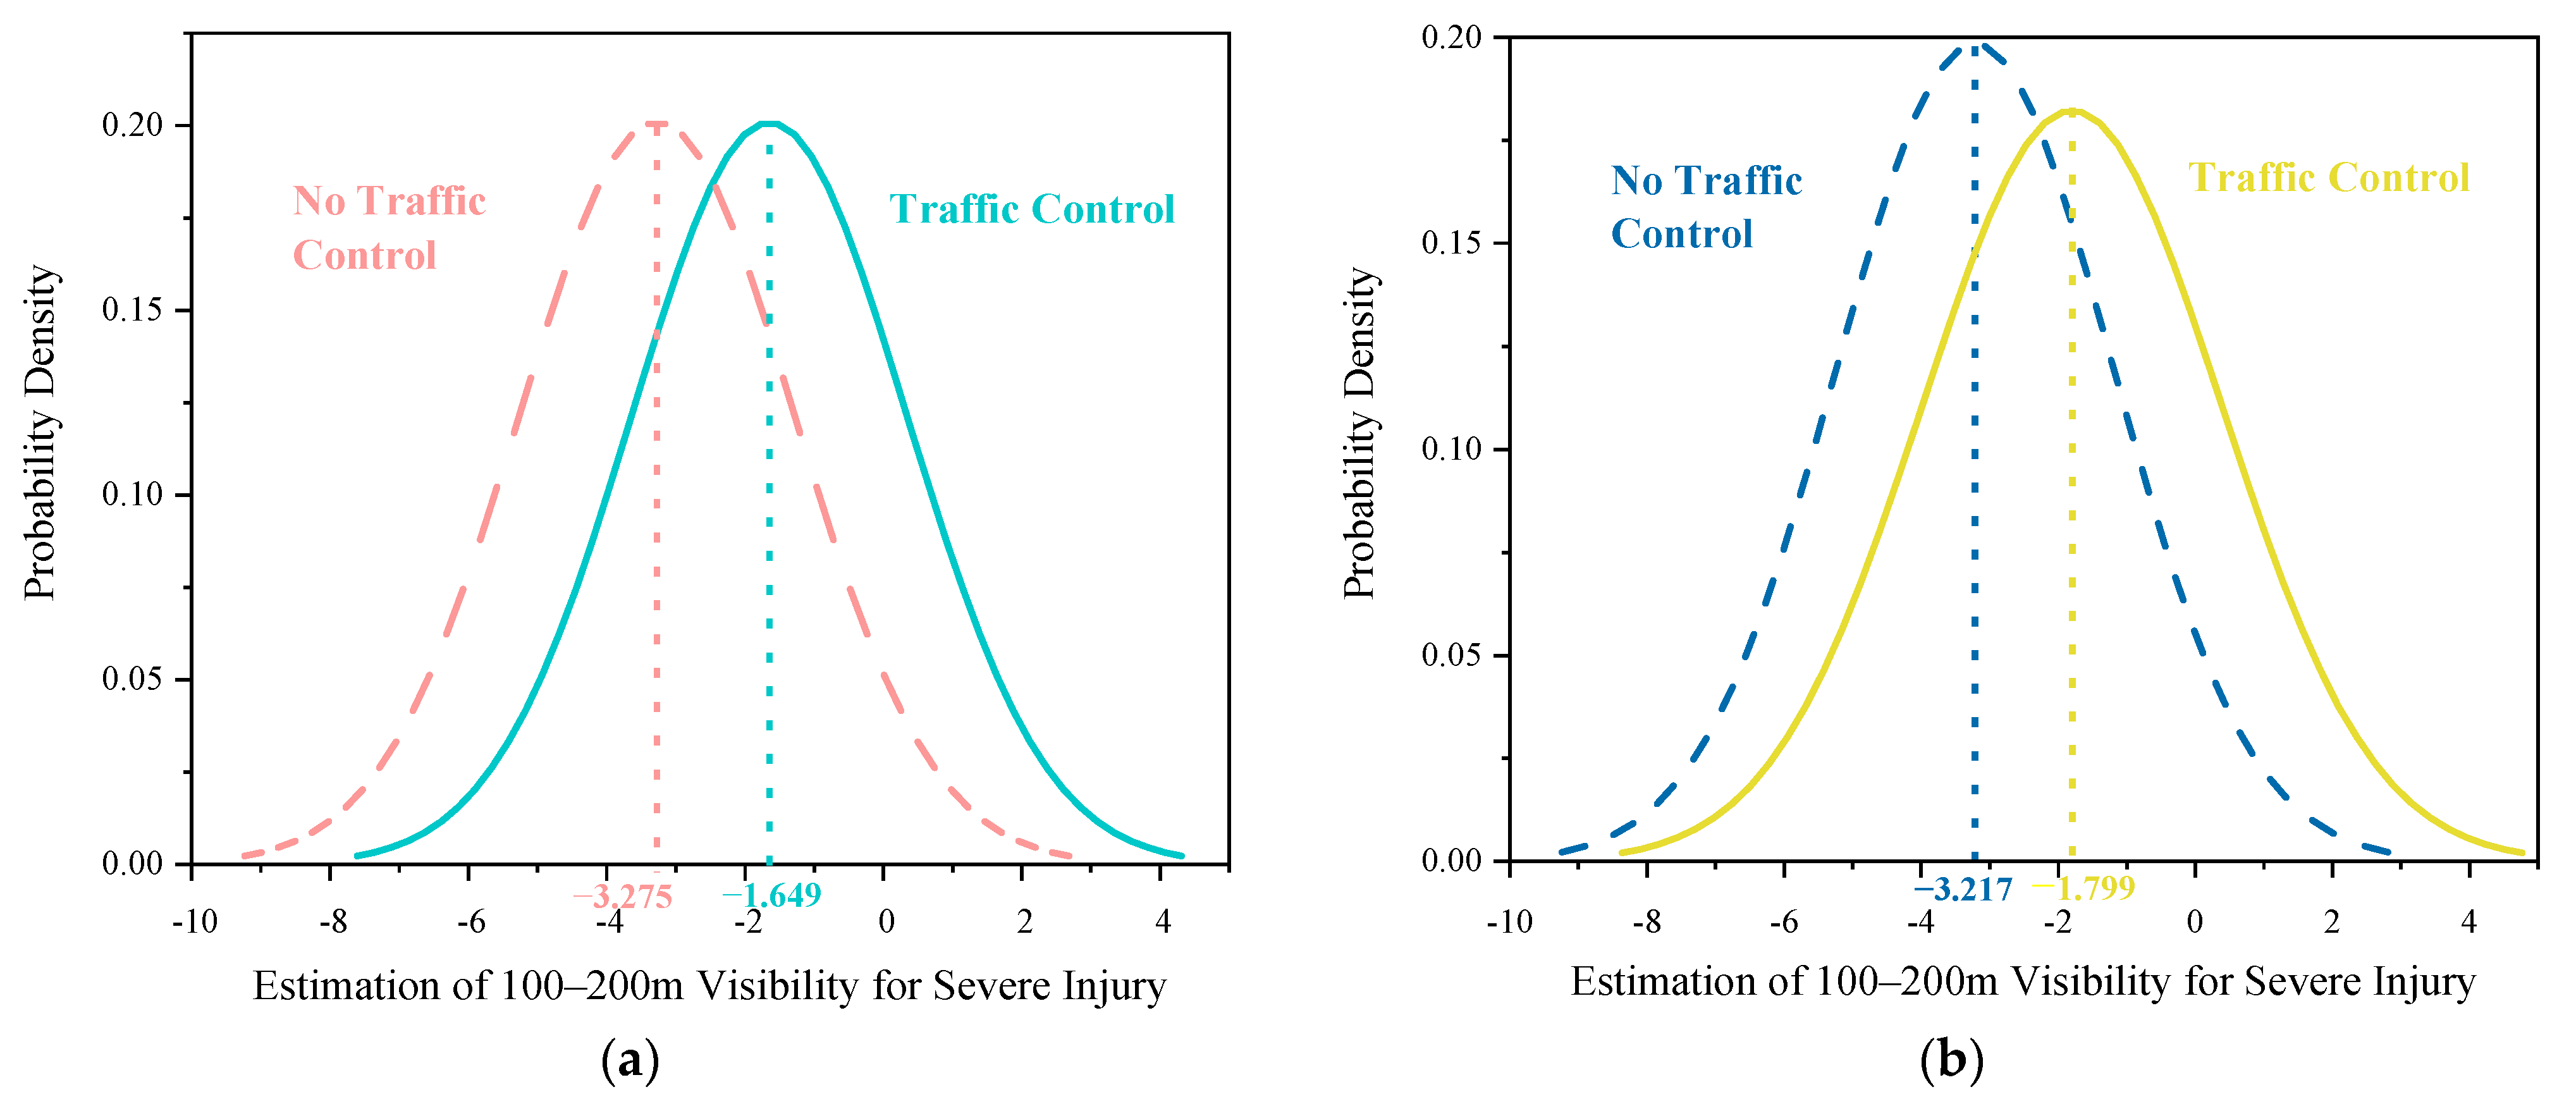
| Visibility 100–200 m [I+] | −1.797 ** (−2.36) | −3.275 ** (−2.32) | −3.127 ** (−2.45) |
| SD for random parameter | 2.023 ** (2.24) | 3.946 ** (2.70) | 4.037 ** (3.15) |
| Heterogeneity in Means of the Random Parameters | |||
| Visibility 100–200 m: Traffic Control [I+] | 1.626 ** (1.95) | 1.418 ** (2.13) | |
| Visibility 100–200 m: No Lights at Night [I+] | 3.067 ** (2.05) | ||
| Visibility 50–100 m: Road Segments [I+] | −1.347 ** (−2.21) | ||
| Heterogeneity in Variances of the Random Parameters | |||
| Visibility 100–200 m: Traffic Control [I+] | 0.568 ** (2.01) | ||
| Visibility 100–200 m: No Lights at Night [I+] | 0.732 * (1.20) | ||
| Variable | Mixed Logit | ||
|---|---|---|---|
| No Mean–Variance Heterogeneity | Mean Heterogeneity | Mean–Variance Heterogeneity | |
| Driver and Bicyclist Characteristics | |||
| Female Electric Bicyclist [I] | −0.0137 | −0.0134 | −0.0255 |
| Vehicle Characteristics | |||
| Passenger Car [I+] | 0.2711 | 0.2715 | 0.1533 |
| Passenger Car [I++] | 0.0238 | 0.0233 | 0.0114 |
| Truck [I+] | 0.0347 | 0.0355 | 0.0589 |
| Truck [I++] | 0.0433 | 0.0412 | 0.0407 |
| Motorcycle [I] | −0.0291 | −0.0344 | −0.0308 |
| Pre-crash Vehicle Movement Characteristics | |||
| U-turn [I+] | −0.0472 | −0.0564 | −0.0566 |
| U-turn [I++] | −0.0085 | −0.0085 | −0.0074 |
| Turning Left [I+] | −0.0587 | −0.0592 | −0.0688 |
| Turning Left [I++] | −0.0472 | −0.0470 | −0.0481 |
| Turning Right [I+] | −0.0905 | −0.1028 | −0.1033 |
| Turning Right [I++] | −0.0522 | −0.0623 | −0.0688 |
| Roadway and Environmental Characteristics | |||
| Traffic Control [I+] | −0.0804 | −0.0910 | −0.0912 |
| Roadside Protection Trees [I+] | −0.1228 | −0.1220 | −0.1181 |
| Roadside Protection Fences [I+] | −0.0523 | −0.0412 | −0.0404 |
| Road Segments [I+] | 0.0805 | 0.0927 | 0.0933 |
| Flat and Straight Road Alignment [I+] | −0.0711 | −0.0659 | −0.0783 |
| Classified Highway [I+] | 0.0023 | 0.0021 | 0.0133 |
| Classified Highway [I++] | 0.0112 | 0.0110 | 0.0129 |
| Urban Expressway or another Urban Road [I+] | 0.0291 | 0.0284 | 0.0199 |
| Visibility < 50 m [I] | −0.0672 | −0.0665 | −0.0638 |
| Streetlights at Night [I+] | 0.1862 | 0.1877 | 0.1928 |
| No Lights at Night [I+] | 0.3486 | 0.3522 | 0.3697 |
| Downtown Driving [I+] | 0.0632 | 0.0703 | 0.0710 |
| Random Parameters (Normal Distribution) | |||
| Visibility 50–100 m [I+] | −0.1824 | −0.1810 | −0.1776 |
| Visibility 100–200 m [I+] | −0.1791 | −0.1774 | −0.1739 |
| Indicators | No Mean–Variance Heterogeneity | Mean Heterogeneity | Mean–Variance Heterogeneity |
|---|---|---|---|
| Number of Observations | 2141 | 2141 | 2141 |
| Log Likelihood with Constants Only | −1947.61 | −1947.61 | −1947.61 |
| Log Likelihood at Convergence | −1625.30 | −1611.70 | −1602.48 |
| Adjusted McFadden—ρ2 | 0.564 | 0.640 | 0.642 |
| Akaike Information Criterion | 3300.7 | 3299.3 | 3153.8 |
| Bayesian Information Criterion | 3288.5 | 3397.3 | 3530.7 |
Publisher’s Note: MDPI stays neutral with regard to jurisdictional claims in published maps and institutional affiliations. |
© 2021 by the authors. Licensee MDPI, Basel, Switzerland. This article is an open access article distributed under the terms and conditions of the Creative Commons Attribution (CC BY) license (https://creativecommons.org/licenses/by/4.0/).
Share and Cite
Zhu, T.; Zhu, Z.; Zhang, J.; Yang, C. Electric Bicyclist Injury Severity during Peak Traffic Periods: A Random-Parameters Approach with Heterogeneity in Means and Variances. Int. J. Environ. Res. Public Health 2021, 18, 11131. https://doi.org/10.3390/ijerph182111131
Zhu T, Zhu Z, Zhang J, Yang C. Electric Bicyclist Injury Severity during Peak Traffic Periods: A Random-Parameters Approach with Heterogeneity in Means and Variances. International Journal of Environmental Research and Public Health. 2021; 18(21):11131. https://doi.org/10.3390/ijerph182111131
Chicago/Turabian StyleZhu, Tong, Zishuo Zhu, Jie Zhang, and Chenxuan Yang. 2021. "Electric Bicyclist Injury Severity during Peak Traffic Periods: A Random-Parameters Approach with Heterogeneity in Means and Variances" International Journal of Environmental Research and Public Health 18, no. 21: 11131. https://doi.org/10.3390/ijerph182111131
APA StyleZhu, T., Zhu, Z., Zhang, J., & Yang, C. (2021). Electric Bicyclist Injury Severity during Peak Traffic Periods: A Random-Parameters Approach with Heterogeneity in Means and Variances. International Journal of Environmental Research and Public Health, 18(21), 11131. https://doi.org/10.3390/ijerph182111131