Abstract
Particulate matter (PM) is a complex mixture of solid particles and liquid droplets suspended in the air with varying size, shape, and chemical composition which intensifies significant concern due to severe health effects. Based on the well-established human health effects of outdoor PM, health-based standards for outdoor air have been promoted (e.g., the National Ambient Air Quality Standards formulated by the U.S.). Due to the exchange of indoor and outdoor air, the chemical composition of indoor particulate matter is related to the sources and components of outdoor PM. However, PM in the indoor environment has the potential to exceed outdoor PM levels. Indoor PM includes particles of outdoor origin that drift indoors and particles that originate from indoor activities, which include cooking, fireplaces, smoking, fuel combustion for heating, human activities, and burning incense. Indoor PM can be enriched with inorganic and organic contaminants, including toxic heavy metals and carcinogenic volatile organic compounds. As a potential health hazard, indoor exposure to PM has received increased attention in recent years because people spend most of their time indoors. In addition, as the quantity, quality, and scope of the research have expanded, it is necessary to conduct a systematic review of indoor PM. This review discusses the sources, pathways, characteristics, health effects, and exposure mitigation of indoor PM. Practical solutions and steps to reduce exposure to indoor PM are also discussed.
1. Introduction
Air pollution results from introducing various contaminants into the atmosphere that are likely to be detrimental to humans, other living organisms, and the natural environment [1]. Among a wide range of air pollutants, particulate matter (PM) is of particular concern because of its association with cardiopulmonary health disorders [2,3]. PM is a complex mixture of solid particles and liquid droplets made up of metals, organic compounds, sulfate, nitrate, ammonium, and other ions (Figure 1) [2,4]. In different indoor environments, the composition is generally the same, but due to different indoor environment types, the difference may be small, and the proportion may be significantly different [5,6,7,8,9]. Early studies have shown that PM’s composition is associated with some respiratory diseases, including asthma, chronic bronchitis, and acute bronchitis [10,11,12].
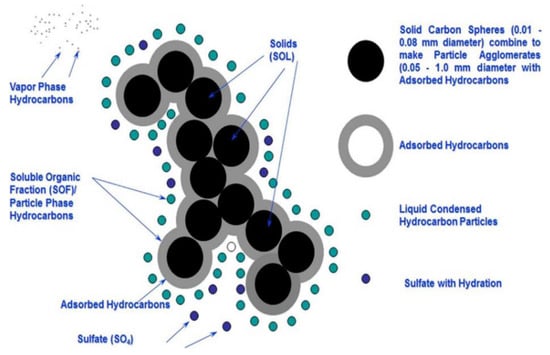
Figure 1.
Schematic representation of PM (Source reference: [4]).
In addition to physical and chemical composition, the size of PM is an essential factor related to its effect on health. Briefly, PM is broadly categorized by its “aerodynamic equivalent diameter” (AED). As shown in Figure 2, particles with diameters between 2.5 and 10 μm (PM2.5–10) are defined as “coarse”; less than 2.5 μm as “fine”; and less than 0.1 μm as “ultrafine” [13]. The main threat to health from PM is inhalable particulate matter, which can penetrate the chest area of the respiratory system and cause adverse health effects (Figure 3) [14]. For example, because PM2.5 is light, it has a higher incidence rate and deposition rate in the lungs than other particles, resulting in it staying longer in the respiratory tract [15,16]. Pope et al. found that for every 10 μg/m3 increase in PM2.5 levels, the risk of death increases by 8% to 18% [16]. According to data from the World Health Organization, about seven million people die from exposure to PM2.5 in polluted air every year [17]. Moreover, ultrafine particles cause a more significant inflammatory response than fine particles per given mass [18], and the ultrafine-particle-toxicity effect can be enhanced by a gaseous co-pollutant such as ozone [14,19].
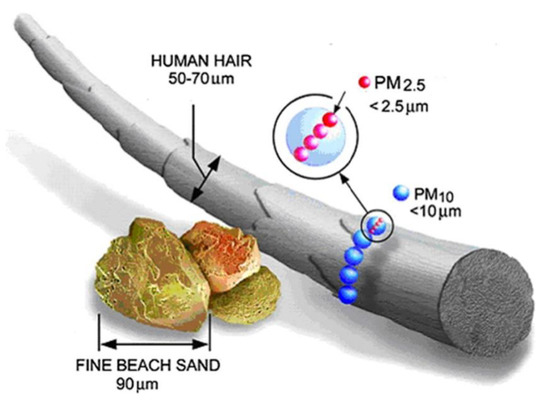
Figure 2.
Size comparison of PM2.5 and PM10 against the average diameter of a human hair (~70 μm) and fine beach sand (~90 μm) (Source reference: [1]).
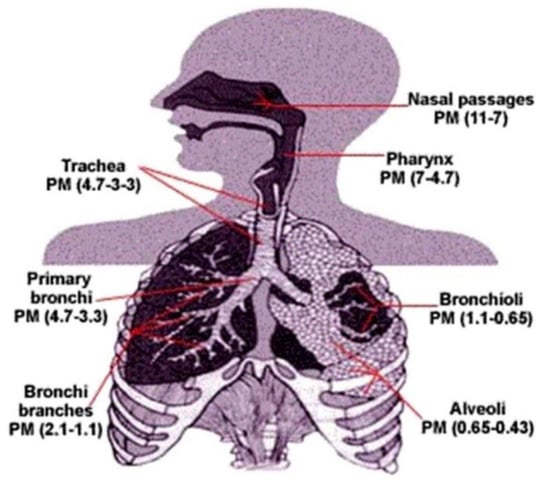
Figure 3.
Deposition potential for particles of varying sizes (Source reference: [1]).
With technological advancements and lifestyle changes, more human activities, including cooking, cleaning, and indoor sports activities, are carried out indoors, all of which are likely to increase indoor PM [20]. Exposure studies show that indoor PM contributes substantially to personal exposure, and the indoor PM concentration levels may exceed those outdoors [1]. Specifically, epidemiologic studies have presented evidence that indoor PM plays a significant role in human health, such as lung malfunctioning, cardiovascular disease, respiratory symptoms, asthma, and premature births [21,22,23,24]. In addition, PM may alter the immune response by promoting immunoglobulin E, causing an inflammatory response. Nowadays, the indoor, suspended PM concentration has been identified as one criterion for evaluating indoor environmental quality [25]. For example, in 2012, Canada established the Residential Indoor Air Quality Guidelines, which state that PM2.5 needs to be monitored, with a limit of 100 µg/m3 as a 1 h average (Short-Term Exposure) and 40 µg/m3 as an 8 h average (Long-Term Exposure). The National Ambient Air Quality Standard (NAAQS), set by USEPA, stipulates 35 µg/m3 and 15 µg/m3 for 24 h and annual periods, respectively, for exposure to PM2.5. Furthermore, the World Health Organization recommended to apply to indoor spaces the same PM guidelines as for ambient air, presented on the 2005 global update, which are 25 and 50 μg m−3 for PM2.5 and PM10, respectively (over 24 h) [26].
Indoor PM sources include indoor origins and outdoor infiltration. Primary indoor sources of PM result from specific activities (cooking, sweeping, dusting, candle or incense burning, using laser-printing devices, fuel combustion for heating, and smoking tobacco), the design of the house, and secondary organic aerosols [27,28,29,30]. Due to air exchange, the indoor PM also originates from outdoor sources, including natural ones (forest fires, soil dust, and sea salt) and anthropogenic ones (transport, oil combustion, and coal burning in power plants) [2,31]. The automatic monitoring methods of PM2.5 ambient air quality are the β-ray method and micro-oscillatory balance method. The effectiveness of urban ambient air quality assessment can be effectively improved by selecting suitable methods in suitable areas.
To ensure the health and comfort of indoor environments, strategies should be taken to reduce indoor PM concentrations. The development of technology has allowed the new trend of operating indoor air purifiers to control indoor PM concentrations. Systems based on the principle of electrostatic precipitation and air purifiers using filtration technologies are two of the most common indoor air-purification technologies [32,33,34]. Natural ventilation with open windows is a common and economical approach to diluting indoor PM [35].
Numerous studies have described sources and health risks of indoor PM, but their conclusions have been focused on a single topic, e.g., the sources and its effects on susceptible subgroups [36,37,38]. As the quantity, quality, and scope of the research have expanded, this review is necessary to discuss new information, e.g., the characteristics, distribution, and pathways. This paper conducts a systematic review of sources, pathways, characteristics, and health effects of indoor PM. In addition, practical steps to reduce exposure to indoor PM are also discussed.
2. Sources and Distribution of Indoor PM
2.1. Major Sources of Indoor PM
Indoor particulate pollution is grouped into primary and secondary PM, based on the origin of the PM. Primary indoor pollutants are directly generated from indoor domestic activities such as cooking, biomass heating, tobacco smoking, washing, cleaning, and other indoor activities. Secondary PM includes pollutants infiltrated from the outdoor environment and particles generated due to chemical reactions between indoor precursors and outdoor sources [39,40]. It is well known that ambient (outdoor) PM is a significant contributor and determining factor of indoor PM levels. Other factors, including indoor-type homes, offices, and commercial spaces; ventilation arrangements (naturally provided by windows or mechanical ventilation); occupancy rate and time; endotoxin levels; and geographical location, play a critical role in defining the chemical composition and disease burden of indoor PM [41,42]. According to the study of Sumpter and Chandramohan, the majority of lower-income groups from developing and low income countries rely on solid fuels for cooking and heating [43]. Activities such as cooking and heating using biofuels (coal and wood) can generate significant indoor PM concentrations, especially PM2.5 and ultrafine particulate matter [44]. Additionally, indoor exposure to asbestos fibers in old houses has been highlighted as a significant concern [45,46]. Due to its high tensile strength and versatility, asbestos, including crocidolite, was once widely used in construction (roofing, floors, and walls) and manufacturing household items such as fireproof curtains. Over time, weathering releases microscopic fibers, which are highly fibrogenic to the human lungs upon inhalation [45]. Furthermore, human habits, such as frequent windows and other dust-generating indoor activities, result in crucial indoor PM sources. For example, human walking is an important factor causing the resuspension of indoor PM. During the movement of humans, soles were exposed to the air. Branis et al. found that indoor human activities in the classroom could also lead to resuspension of large particulate matter, especially for PM10 [47].
Indoor cooking has been a well-investigated source of PM over the past decades. Studies have shown that cooking activities enable the emission of millions of particles (~106 particles/cm3) through oil, wood, and food combustion, and most of them are ultra-fine particulates [48,49]. In addition, cooking can lead to indoor PM emissions from cooking areas in homes, restaurants, and other building types (offices, schools, etc.) because high-temperature cooking can lead to water vapor and other solid and liquid particle emissions.
High emissions of indoor fine particulates (aerodynamic diameter <100 nm) occur during frying and boiling [50]. Zhang et al. showed that average concentrations of ultrafine, fine, and black carbon particles emitted during boiling and frying ranged from 1.34 × 10⁴ to 6.04 × 10⁵ particles/cm3, 10.0 to 230.9 μg/m3, and 0.1 to 0.8 μg/m3, respectively [51]. Chinese-style cooking has been identified as one of the major sources of indoor PM. It contributes up to 33% of indoor PM levels (PM0.5-5) [52]. The PM exposure level of indoor populations due to cooking and heating is related to fuel type, stove type, and population type [53,54,55]. Cooking behavior, such as using different types of aerosols, fuels, and exhaust fans or stove hoods, is also closely linked to the level of indoor PM pollution. A study showed that, when no stove hood was used, indoor PM2.5 was at a sufficient concentration to affect potentially the health of children, even in non-cooking times [56].
Tobacco smoke from cigarettes, water pipes, and e-cigarettes is also a well-investigated source of indoor PM, which threatens the well-being of both smokers and other occupants. Drago et al. showed that concentrations of PM2.5 and several toxic trace elements were higher in smoker dwellings than non-smoker dwellings [57]. Braun et al. studied the effects of tobacco strength, measured by quantifying the amount of tar, nicotine, carbon monoxide, and different additives on the amount of PM [58]. This study included five cigarette types with different tobacco strengths, with or without additives, and a reference cigarette. Studies have found that incense is an important source of polycyclic aromatic hydrocarbons (PAHs), carbon monoxide, benzene, isoprene, PM2.5, and PM10 [5]. Lee and Wang observed that PM2.5 emission rates of different incense types varied considerably [59]. PM levels were directly proportional to concentrations of residuals in the cigarettes. Compared to tobacco smoke, incense smoke contains higher concentrations of PM. Lin et al. showed that incense burning generates PM >45 mg/g compared to 10 mg/g from cigarette burning [60]. Kumar et al. investigated PM levels generated from indoor incense-smoking activities, such as pre-burning, burning, and post-burning phases [61]. Incenses that they studied included sandalwood and floral sticks, dhoops (dhoops are an extruded incense, lacking a core bamboo stick), and mosquito coils (a mosquito coil is a mosquito-repelling incense). They showed that the mean concentrations of PM during the burning phase were highest. Concentrations ranged from 1300 to 1880 μg/m3 for dhoops and from 214 to 259 μg/m3 for mosquito coils. The burning of floral incense had a higher PM concentration (700 to 854 μg/m3) compared to the burning of sandalwood incense (99 to 114 μg/m3). With the increasing popularity of IQOS and e-cigarette devices among adolescents and adults, more and more studies have been conducted to explore the relationship between PM2.5 and e-cigarette aerosol. Studies have shown that indoor PM2.5 concentrations can rise to 197–818μg/m3 during vaping [62]. The level of PM2.5 is comparable to or even higher than those found in conventional cigarettes. IQOS smoking had little effect on indoor fine particulate matter (>300 nm) concentration or PM2.5 concentration. However, the concentration of ultrafine particles (25–300 nm) can be significantly increased [63]. Overall, PM emission during the burning of dhoops was higher than PM emission during the burning of sandalwood or floral incense and mosquito coils. This study also showed a higher PM emission during the post-burning phase of dhoops than sandalwood and floral incenses and mosquito coils, which indicated potential exposure even after the cessation of the burning phase of dhoops.
Besides indoor in-situ sources, outdoor PM can be transported into indoor environments through air movement. Particles in the outdoor environment enters the room through air flow, that is, through a combination of osmosis, natural (NV) and mechanical ventilation (MV). PM originates from a range of outdoor natural sources, including forest fires, soil dust, sea salt, the presence of pets and farm animals (i.e., animal debris), pollen, spores, plant debris, and bacteria. Anthropogenic outdoor PM sources, such as evaporative gasoline emissions from transport, oil combustion, and coal burning in power plants, contribute to indoor PM concentrations [2,31].
2.2. Distribution Characteristics of Indoor PM
Distribution characteristics of PM include size, mass, mass, or particle concentration, and chemical or biological composition. The mass of PM is a major characteristic that affects its distribution. Microscopic particles with low density can remain airborne for extended periods and move freely from source to surrounding areas, reducing indoor and outdoor air quality [64]. Indoor PM burden may range from 15 to 259 μg/m3 and from 3 to 202 μg/m3 for PM10 and PM2.5, respectively [65]. Factors such as geographical location, air exchange efficiency, penetration and deposition rate, occupancy rate, and the particles’ presence dictate indoor PM levels. Not all indoors are affected equally. For example, residents of a building living closer to ground level experience higher PM levels compared to occupants residing at higher levels [66].
Similarly, individuals located in cities with frequent dust storms have elevated indoor PM levels and are more susceptible to PM-associated diseases compared to residents of other cities [67,68]. The effect of human exposure to PM is especially significant in urban environments, where higher population density leads to higher pollutant generation and higher human exposure [69]. Densely populated urban centers curb black carbon emissions from fossil-fuel transport, household stoves, and space heating. The negative effects of this growing pollution have been enhanced by the continuous movement of people from rural to urban areas. Ventilation of the confined spaces plays a critical role in regulating indoor PM levels. Spaces equipped with mechanical ventilation or poor air conditioning systems have high infiltrated PM2.5 levels from outdoors.
Chithra and Shiva Nagendra measured the temporal characteristics of PM concentrations inside a room in a naturally ventilated school building located near a roadway in Chennai, India [70]. They found that, during working hours, the number concentrations of PM inside the room were 2.4 × 10⁵, 2.2 × 10³, and 8.1 × 10² particles/dm3 in size ranges of PM0.3–1, PM1–3, and PM3–10 µm, respectively. Putaud et al. showed a difference in the chemical profiles of coarse and fine particulate fractions of aerosol PM [71]. The coarse PM was made up of mineral composites (e.g., crustal species, fly ash, and minor elements), sea salt, and black carbon. Fine particulates contained ammonium sulfate, ammonium nitrate, and organic compounds. The formation of secondary aerosols is a major factor that affects PM pollution. Both secondary organic and inorganic aerosols can be dominant components of PM. Wang et al. found secondary inorganic species, including sulfate, nitrate, and ammonium, in PM air samples collected from four regions in China [72]. They also showed the production of secondary organic aerosol species in three regions and suggested that aqueous-phase processing and photochemical reactions were occurring and they were possible causes for the production of the organic aerosols.
In addition to mass and size, biological composition is another important characteristic of indoor PM distribution. Indoor PM biological compositions, also known as bioaerosols, are solid or liquid particles carrying living organisms from biological sources, with sizes ranging from 0.1 mm to 100 mm in diameter [73]. Generally, their particle size distribution varies from the nucleation mode (<30 nm in vacuum cleaning condition) to the accumulation mode (~100 nm, indoor combustion aerosols from smoking, cooking, or incense burning), and to the fine and coarse modes (>1 µm, resuspension aerosols) [74,75]. They include biological allergens (e.g., animal dander and cat saliva, house dust, cockroaches, mites, and pollen) and microorganisms (viruses, fungi, and bacteria) [76,77,78]. Biological allergens, known as antigens, originate from a number of insects, animals, mites, plants, or fungi, and will induce an allergic state in reacting with specific immunoglobulin E antibodies. Indoor sources of allergens mainly include furred pets (dog and cat dander), house dust mites, molds, plants, cockroaches, and rodents [79], and there are outdoor sources as well [80]. Humans and animals are one of the dominant sources of bacteria in indoor environments, while fungi mostly originate from the outdoor environment [81,82,83].
2.3. Factors Influencing the Distribution of Indoor PM
Both indoor and outdoor environmental conditions influence indoor PM levels. Indoor factors, such as temperature, humidity, and air exchange rate and efficiency, are some of the important ones that dictate the indoor PM levels. Outdoor factors, such as weather, wind velocity, temperature, humidity, and solar radiation, influence indoor PM levels and secondary aerosol formation. For example, changes in temperature affect PM by influencing the change of chemical reaction rates and atmospheric mixing heights that affect the vertical dispersion of pollutants and modifying local wind and flow patterns that control the transportation of pollutants [84]. Meanwhile, differences in temperature indoors and outdoors also influence natural ventilation through the movement of air, and thus affecting indoor PM concentration [85]. With the increase of relative humidity, the resuspension rate of fine particulate matters decreased [86]. Several studies have demonstrated that air exchange rate has a significant effect on indoor PM concentrations under stable outdoor PM concentrations. In general, the higher air exchange rate was, the lower the indoor PM concentration was [87]. Seasonality is a major factor influencing the distribution of indoor PM. Indoor PM2.5 concentration is related to season and building type. The PM concentration in the heating season was significantly higher than that in the non-heating season [88,89]. Epidemiological data from urban and rural areas in developing and developed countries show a steep rise in airborne PM during autumn and winter compared to spring and summer. Although advances in technology have provided safe, conventional (electrical) cooking and heating methods in developed countries, the majority of the population from urban and rural areas in developing countries still relies on traditional heating (burning wood and coal) to keep homes warm. Huang et al. studied three urban areas of China (Beijing-Tianjin-Hebei) between 2013 and 2017 and showed that the average concentration of outdoor PM2.5 in the springtime (July) was 38.76 mg/m3; by winter (January), levels had risen to 133.10 mg/m3, which was 5.3 times above WHO air quality standards [90,91]. The use of conventional heating methods, such as gas and electricity, reduced indoor levels of PM2.5 in heating and non-heating seasons by 43% and 70%, respectively [54].
Meteorological factors during different seasons, such as wind velocity, precipitation, air and soil temperatures, and atmospheric and soil humidity, have noticeable relationships with the PM distribution. Deng et al. measured PM at heights of 121 and 454 m on the Canton Tower in China and showed that the vertical distributions of PM decreased with height [92]. Chen et al. studied the effects of SO2 and NH3 on secondary aerosol formation from unburned gasoline vapor and found that an increase in SO2 and NH3 concentrations (from 0 to 151 ppb and from 0 to 200 ppb, respectively) promoted the formation of secondary aerosols by a factor of 1.6 to 2.6 and 2.0 to 2.5, respectively [93]. They also reported that new particle formation and particle size growth were enhanced in SO2 and NH3. Increased solar radiation and intensity promote photochemical reactions that lead to the formation of secondary aerosols, thereby accelerating PM pollution and its distribution in the environment [72].
2.4. Unique Characteristics and Spatial-Temporal Distribution of Indoor PM
PM possesses unique characteristics, such as a small aerodynamic diameter, a large surface to volume ratio, a complex chemical profile, and a high toxicity index, which depend upon the origin and source of the PM. The large surface to volume ratio provides a natural platform for reactive chemicals and ionic species to undergo oxidative and reduction reactions (RedOx). The large surface area of the particles can harbor surrounding environmental pollutants and acts as a “carrier” for heavy metals (e.g., Cr, Pb, Hg, Cd, and As), organic pollutants such as polyaromatic hydrocarbons (PAH), heterocyclic amines, and inorganic minerals (e.g., Si, Al, Fe, Mn, Ca, Cl, and Zn) [89,94,95]. The microscopic size and aerodynamic diameter allow the particles or particle-bound contaminants to remain airborne and drift along with the winds to reach extreme distances. The chemical composition of indoor PM is complex because it comprises particles from indoor and outdoor origins. Indoor activities, such as cooking using solid fuels including coal, wood, dung, and kerosene, can liberate black-carbon soot (elemental carbon) and organic carbon (bound carbon). Other major factors affecting both indoor and personal exposure to PM include the penetration factor, air exchange rate, and particle deposition and sedimentation, as well as human behavior [96]. Hung et al. studied indoor PM2.5 and PM10 in office spaces and showed an increase of 0.211 μg/m3 and 0.226 μg/m3 per 1 μg/m3, respectively, over outdoor levels [97]. Climatic and environmental factors affect both indoor and outdoor PM levels and composition.
Annual average levels of PM10, PM2.5, and PM1 at observational heights of 121 m and 454 m above ground were 44.1, 38.2, and 34.9 μg/m3 and 35.7, 30.4, and 27.5 μg/m3, respectively [98]. Spatio-temporal studies conducted on PM10, PM2.5, and PM1 levels in Seoul (Korea) metropolitan subways showed a vertical distribution (going upwards from the ground) in the sequence PM10 > PM2.5 > PM1, and levels of fine particulates were uniform compared to coarse particles [99]. Moreover, the distribution was constant in summers compared to other seasons. Air quality monitoring studies conducted in confined and crowded spaces such as underground subways and metro stations often record a several-fold increase (4- to 6-fold) in indoor PM levels compared to ambient levels [99,100,101]. Human activities, such as primary or second-hand smoking, add airborne PM and nicotine to indoor microenvironments [9].
3. Pathways of Exposure to Indoor PM
As shown in Figure 4, potential sources for indoor PM include bioaerosols (plant, animal, bacteria, fungi, and viruses), combustion of fuel used for cooking and heating, and home or personal care products [102,103,104]. The diameter of these particles is in a range of 0.001–2000 µm. Even though some consider that the amount of PM is more significant indoors than outdoors, the concentrations vary with location (e.g., urban or rural or proximity to roadsides) and with socio-economic factors of the population [104,105,106,107]. Smoking, cooking using gas and wood stoves, and cleaning are the major sources for elevated indoor levels of PM10 and PM2.5 [108]. This PM can enter the human body through inhalation, dermal absorption, or ingestion [106,109,110].
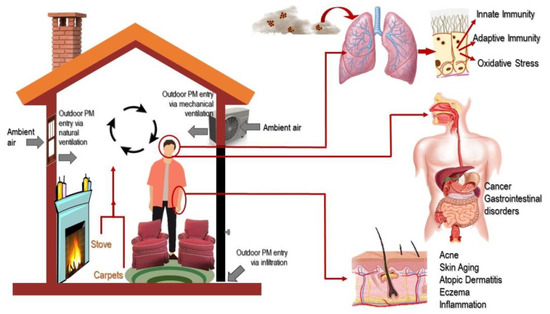
Figure 4.
The main pathways of exposure to indoor PM.
3.1. Respiratory Absorption
Respiratory absorption is the most common route of exposure. Both in an outdoor or indoor environment, PM in the air can get into the body via breathing through the nose, which is able to filter large particles, or the mouth, which is unable to perform that particular task [111,112,113]. Ample evidence demonstrates that the “personal cloud,” which is resuspended house dust, is one of the major pathways of exposure for inhalation [113]. Passing through the pharynx and larynx, air-containing particles enter the trachea, which is connected to the left and right primary bronchi. Primary bronchi are further subdivided into bronchioles leading into alveolar ducts and sacs in the lung. It is estimated that particles up to 100 μm in aerodynamic diameter (Dae) present in the inhaled air can be deposited in the respiratory system [114]. When inhaled, the particles in the air come to equilibrium with body temperature and humidity, and, as a consequence, the movement of large particles becomes restricted [103]. Depending on the size of the inhaled particles, they are categorized as “extrathoracic,” which cannot pass the larynx; “thoracic,” which are particles that reach beyond the larynx (relates to particles with Dae < 10 μm); and “respirable,” which are particles that manage to pass into the pulmonary or alveolar region (relates to particles with Dae < 4 μm) [114]. Fine particle pollution can enter the body through inhalation airflow, cross the respiratory tract and reach the alveoli, where it triggers an inflammatory response that reduces the immune system’s ability to respond. Further, once in the lungs, PM can enter the bloodstream and spread to other organs.
The direction of the airflow within the respiratory system and the velocity of inhaled air impact particle deposition and diffusion. At the point of inhalation and when air comes into the tracheobronchial region, the linear velocity of the inhaled air can be relatively high. However, compression of residual gases within the alveolar sacs slows down the airflow speed, and, therefore, the velocity of the air in the alveolar region is minimal [110]. PM is composed of both soluble and insoluble particles, and it is assumed that the sizes of the particles get altered in the alveolar region due to their hygroscopic nature. Depending on the modifications to the PM, these could either be deposited in the lung or get removed with exhaled breath [115].
The United States Environmental Protection Agency (USEPA) states that only PM < 10 μm has the ability to be deposited in the trachea-bronchial and alveolar regions, and, consequently, causes the maximum danger by way of inhalation [116]. However, during exercise, breathing is mostly done by the mouth, and, as a result, larger particles (PM > 10 μm) can be deposited in the tracheobronchial airways [103]. Madureira et al. reported that 3-month old infants had 4-fold higher inhalation doses of ultra-fine particles than their mothers [112]. PM10 was predominantly deposited in the head region, whereas deposition of PM2.5 and ultra-fine particles occurred in the pulmonary area. Lower right lobes demonstrated a high susceptibility to respiratory problems because they received higher PM deposition than upper, lower left, and middle lobes. Meanwhile, the elderly is also a group susceptive to particulate matter, since they spend more time indoors. Almeida-Silva et al. used computational models to measure particle transport and deposition in the human respiratory tract of the elders [117]. The results shown that after 5 years of continuous exposure to the average particle concentration, 258 mg of all particles are deposited on the surface of the alveoli of which 79.6% are cleared, 18.8% are retained in the alveolar region, 1.5% translocate to the hilar lymph nodes, and 0.1% are transferred to the interstitium. Additionally, Segalin et al. found that respiratory deposition of PM2.5 was almost 25% higher in male than female elderly [118].
Whether or not bioaerosols are inhaled depends on their infectivity, airborne concentration, immunogenicity, and particle size [119]. Carpeted homes have higher concentrations of Al, As, and transition metals such as Cd and Cr than non-carpeted homes, which indicates the possibility of inhalation exposure of these elements [113].
Respiratory absorption can be summarized as follows: deposition of particulate matter (PM10) in the upper respiratory tract, fine particles (PM2.5) in the lower respiratory tract, followed by ultrafine particles (UFPs < 100 nm) in alveoli. Few scientific data exist concerning human toxicity from inhaled fungal toxins [102]. Methodologies for measuring indoor bioaerosol exposure and health risk assessment are not well standardized and, therefore, additional studies are needed on exposure-disease and dose-response relationships in humans.
3.2. Cutaneous Absorption
Skin, which covers the entire human body, is considered the largest organ of the body. It is made up of three main layers: epidermis, dermis, and hypodermis [120]. PM in indoor air can be deposited easily onto the skin or absorbed through the skin because it is exposed to the environment [121]. Dermal exposure also depends on dust adherence to skin, which is adapted from guidelines on dermal contact with soil and varies from 0.004 to 0.01 mg/cm2 for different parts of the body of children indoors and from 0.02 to 0.80 mg/cm2 for adults based on activity. Indoor environments are rich in semi-volatile organic compounds (SVOCs). Garrido et al. and Weschler et al. showed that the concentrations of SVOCs absorbed via direct air-to-skin dermal uptake could be comparable inhalation intake [39,122]. Williams et al. showed that perspiration-induced absorption of pesticides into the human body occurred through the dermal contact [123]. The epidermis stratum corneum is the outermost skin layer and is the primary barrier that prevents environmental pollutants from entering the body. Skin is the first defense immune system that protects the human body from toxic substances [120]. PM gets absorbed by percutaneous penetration, which causes local toxicity in the skin and systemic toxicity in other organs [124]. The four different ways that PM penetrates the skin are by mechanical delivery, an intracellular route, a transcellular route, and through the trans-follicular route [120]. Hair follicles that create pores in the skin help the PM to get into the body through the trans-follicular route [125].
3.3. Hand-to-Mouth Behavior
The main pathways of human exposure to PM are skin exposure to PM and particle ingestion, hand-to-mouth behavior, and food containing. However, both the rate of particle ingestion and the size of particle ingested are highly uncertain. Finer particles can stick to the hands, so both ingestion and skin contact are major problems. However, there is little consensus on how small the particulates should be to stick to your hands, since the airborne particles range in size over five orders of magnitude (from about 0.001 μm to about 100 μm) [41]. Unsurprisingly, children consumed much higher rates of particulate matter than adults because they liked to play on the floor and put their hands and non-food objects in their mouths more frequently. This behavior, combined with their smaller body size, makes exposure to chemicals through PM more important for children than for adults [126].
3.4. Digestive System Absorption
Absorption of PM by the digestive system can occur in two ways: directly by diet (direct consumption of food and drinks that are enriched with PM) or indirectly into the gastrointestinal tract through the expulsion of particles removed from the lungs via mucociliary transport [127,128,129,130]. It is estimated that roughly 50% of the inhaled dose could reach the intestinal tract. Therefore, researchers have pointed out the necessity of recognizing ingestion as an essential human exposure pathway to PM pollution. Research needs to be conducted on both the ingestion mechanisms and constraints to ingestion [110]. The absorption of this PM can be the epithelial lining of the small intestine, colonic epithelium, or the stomach. Researchers have identified links between the ingestion of PM and different diseased conditions in the digestive tract, but, at present, data on the effect of PM on the digestive tract are elusive [128]. More research is needed to identify how the chemical nature and sizes of the particles affect the rate of absorption of PM along the digestive tract.
Wang et al. estimated the ingestion of tetrabromobisphenol A and eight bisphenol analogs, including bisphenol A, in 12 countries [131]. The highest median estimated daily intake (EDI) of bisphenols through dust ingestion was observed in Greece, Japan, and the U.S. They showed that the EDI for infants and toddlers was high, which indicated that dust ingestion was a significant exposure pathway.
It is difficult to quantify the amount of PM a person gets into the body by staying indoors. Whether the uptake is through inhalation, dermal exposure, or absorption through the digestive tract is a personalized matter, which varies with individual human beings and the particular indoor environment (home, school, office, or another type of working place) and the length of stay in the environment. The nature of the chemical and biological constituents of the PM also needs to be considered.
4. Characteristics of Indoor PM
The chemical composition of indoor PM is determined by the sources of PM and chemical processes that occur both indoors and outdoors. The primary constituents of PM include inorganic metallic compounds, organic compounds of biological origin, inorganic carbonaceous material (including black carbon and elemental carbon), sulfate, nitrate, ammonium, and other ions (Table 1).

Table 1.
Selected references on the composition of indoor PM.
Chemical compounds in PM are grouped into various categories that consist of organic carbon (OC), elemental carbon (EC), carbonate carbon (CC), non-sea salt sulfate (NSS-SO42–), nitrate (NO3–), ammonium (NH4+), sea salt, mineral dust, and non-dust elements [140]. Generally, the NSS-SO42 fraction is estimated from the difference between the total sulfate and the sea-salt fraction of SO42–. Sea-salt concentrations are estimated from soluble sodium concentrations [141]. Mineral dust components are determined by summing Al2O3, SiO2, CO32–, Ca, Fe, K, Mg, and Mn. Non-dust elements include common trace elements (i.e., Cu, Ni, Pb, V, and Zn), and they are generally derived from atmospheric origin or attributed to atmospheric pollution [142]. Typically, indoor PM consists of approximately 50% organic carbon, 3% elemental carbon, 30% sulfates and nitrates, 15% ammonium ion and water, and 1% total metal content, with more than two-thirds of that being iron.
Wang et al. noticed that NSS-sulfate in PM10 and PM2.5 contributed 95% of the total sulfate in Guangzhou, China, suggesting a significant anthropogenic origin of the PM [143]. The primary sources of the sulfate in Guangzhou may be attributed to the release of SOx from sulfuric-acid-manufacturing industries and the generation of sulfate compounds in coal-fired power plants and their subsequent utilization in construction and agricultural industries. Some fraction of the SOx released through anthropogenic sources is oxidized to secondary aerosols of sulfate compounds [144].
The sources and composition of PM vary with PM particle size. PM10 consists predominantly of insoluble, Earth-crust-derived compounds such as iron and aluminum oxides; biological materials such as pollen, fungi, and bacteria; and sea salts. PM2.5 is derived mainly from combustion-related sources and consists of carbon, hydrocarbons, and sulfur and nitrogen [2].
In addition to PM, indoor air and ambient air also contain a range of gaseous pollutants that include carbon monoxide, sulphur dioxide, and nitrogen oxides derived from both indoor (e.g., combustion) and outdoor (e.g., bushfire) activities. Indoor PM is generally enriched with chemical additives, such as phthalate plasticizers, organophosphates, brominated flame retardants, and fluorinated surfactants used in products that are part of the indoor environment. These pollutants associated with PM cause health effects when the indoor occupants inhale PM.
The chemical elements in PM can be divided into two major groups: Earth-crust elements derived from soil (i.e., soil tracers) and introduced elements derived from human activities (i.e., anthropogenic tracers). Earth-crust elements include Na, Al, K, Mg, Ca, Fe, Ti, and Mn, which are derived primarily from geological sources, whereas V, Cr, Cd, Ni, Cu, Pb, Zn, As, Sn, and Se can be derived from both natural Earth-crust sources and anthropogenic sources [145]. These elements can be used to fingerprint the anthropogenic sources of indoor PM.
Several methods are used to fingerprint the most likely indoor PM [146,147]. For example, enrichment factors are calculated for individual elements in terms of their average concentration in the Earth’s crust. Aluminum is commonly used as a reference for these elements because of the minor contribution of Al as a potential pollutant and its major contribution to the Earth’s crust. The enrichment factor (EF) of an element E is defined according to Equation (1):
where T and R represent the concentrations of the tested and the reference element, respectively, if the EF approaches 1, then the Earth’s crust is considered as the dominant source of the tested element. Considering the variation in the Earth-crust composition (Table 2), EF > 5 in PM indicates that non-crustal anthropogenic sources contribute a significant portion of PM’s element.
EF = (T/R)air/(T/R)crust
Table 2.
Selected references on the enrichment ratio of various elements in indoor PM.
For example, Alves et al. measured high EF values (>10) for Pb, As, Cu, and Zn in both indoor and outdoor PM, which suggested that there was a contribution of anthropogenic activities to both the outdoor and indoor environments [149]. The data also indicated that air infiltration affects the nature and composition of indoor PM. Furthermore, the mean outdoor concentrations of many of these metals for both coarse and fine PM exceed that of indoor PM, which indicates that air infiltration makes a significant contribution in lowering the enrichment of these metals in indoor PM [141].
Wang et al. noticed that Cd and Se exhibited the highest enrichment factors (>10,000) in indoor PM collected from the Guangzhou region. Pb, As, Sn, and Zn also showed high enrichment factors (>100) [143]. Ni, V, Cr, and Cu appeared to be moderately enriched (10 < EF < 100). The high enrichment of these elements indicates that non-crustal sources, including pollution emissions, contribute primarily to elemental loading in indoor PM. For example, the high ER for Cr reveals a range of pollution sources, including coal combustion and tannery sludge incineration [151]. While non-crustal V is derived mainly from heavy fuel oil combustion, metal smelting, and fossil fuel combustion are the likely sources of non-crustal volatile metals such as Cd, Zn, and Pb [152]. Furthermore, elements with high EF values such as Cr and V generally have low concentrations in PM. Elements originating from the Earth’s crust and sea salt, such as Na, Mg, K, Ca, Ti, Mn, and Fe, have high concentrations in PM, but low enrichment factors (<5), which indicates an insignificant contribution from anthropogenic sources of these elements in PM; airborne Earth-crust dust is the primary source of these elements in PM [150].
5. Health Effects of Indoor PM
5.1. Overall Impact
In the presence of indoor sources, PM levels can rise rapidly to several orders of magnitude greater than outdoor levels [153,154,155]. As a potential health hazard, indoor exposure to PM has received increased attention in recent years because people spend almost 90% of their time indoors [153]. Brauer et al. have found that 99% of the population in south and east Asia live in areas where the WHO Air Quality Guideline for PM2.5 is exceeded [156]. Exposure to indoor PM has been identified as the cause of respiratory infection, allergic symptoms, cardiovascular disease, adverse birth outcomes, and neurological and cognitive disorders [157,158,159]. Epidemiological studies have found that mortality and morbidity of respiratory diseases rose as the PM concentration increased [160,161]. Long-term exposure to PM less than 2.5 μm in diameter (PM2.5) is associated with chronic conditions such as cardiovascular and respiratory diseases and cerebrovascular complications, leading to reduced life expectancy [162]. Short-term exposure to PM2.5 can also cause a variety of health impacts including exacerbation of asthma and increases in respiratory and cardiovascular hospital admissions and mortality [162,163]. Additionally, it was also found that mortality generated by short-term PM2.5 exposure was influenced by season, region (urban and rural), and co-pollutants [164].
The main components of indoor PM are inhalable, which can penetrate the chest area of the respiratory system and cause adverse health effects [13]. Exposure to indoor PM will affect lung development, especially in children, including reversible deficits in lung function, chronically reduced lung growth rate, and a deficit in long-term lung function [13,165]. Moreover, some toxic pollutants, such as heavy metals and polycyclic aromatic hydrocarbons (PAHs), are also attached to the surface of indoor PM, and they pose a severe threat to human health [166,167]. PAHs adsorbed on the surface of PM have been shown to have carcinogenic and mutagenic effects [168]. Heavy metals and PAHs, individually or in concert, damage the double helix structure of DNA, leading to genetic mutations. MAC releases cytokines, such as growth factors, which alter the cell cycle and cause cells to divide forever. Thus, tumors can form. A survey has confirmed the presence of particulate polycyclic aromatic hydrocarbons (PAHs), such as bingo pyrene, in the air of Beijing. All air samples are highly mutagenic [169]. Even at low doses, heavy metals can have severe effects on neurodevelopment [170]. To control its adverse health impacts, it is essential to explore the composition of indoor PM. Studies have found that the elderly, children, and pregnant women are more susceptible to PM than others and PM concentrations vary in different indoor environments. As such, the further discussion of this issue is of great significance for removing indoor PM and reducing the exposure of susceptible groups to PM.
5.2. Harm of Main Components of PM to the Human Body
In general, toxicity of particulate matter refers to the absorption and distribution of chemical components of the particle, which, in addition to carcinogenicity and mutagenicity can cause adverse health effects throughout the body [171]. According to recent studies of indoor PM done at different places [172,173,174], the components of indoor PM can be roughly divided into metals (e.g., Fe, Ni, Zn, and V), inorganic compounds (e.g., sulfate, nitrate, and ammonium), and organic compounds (e.g., PAHs, volatile organic compounds (VOCs), and soot). Numerous studies have reported that some trace elements (e.g., Fe, Ni, Zn, V, Pb, As, Se, Cd, and Hg) may cause damage to cells, tissues, proteins, and DNA and change cell permeability by inducing the production of reactive oxygen species (ROS) [175,176,177]. For example, an extensive increase in ROS can be caused by Fe in vivo, causing oxidative damage and inflammation [178]. Gilli et al. found that oxidative DNA damage attributed to PM is also related to the Fe content [179]. Magnani et al. studied the effect of transition metals in air particles on pulmonary oxygen metabolism and found that Ni could cause metabolic changes [180]. Additionally, Cu, K, Mn, Zn, V, and Ni are associated with increased odds of hospital admission for cardiovascular disease, which can lead to death in severe cases [181,182,183,184].
Inorganic substances are also common pollutants in indoor air, among which nitrate, sulfate, and ammonium particles are representative. Most sulfate and nitrate in PM originate from the atmospheric oxidation of SO2 and NOx emissions, mainly in the form of aerosols (e.g., (NH4)2SO4, NH4HSO4, NH4NO3, and partially neutralized salts). Ammonium ions are mainly involved in the neutralization reaction of sulfuric acid and nitric acid. Sulfate in the atmosphere can increase the deposition of toxic compounds in the lungs, affecting breathing conditions. A 1% variation in sulfate was associated with 0.117% variation in respiratory diseases [14,185]. Further, sulfates increase ROS levels, and long-term exposure to sulfates may cause oxidative stress, increasing the risk of many vascular diseases [184]. In addition to sulfates, it was found that the increase of acute cardiovascular hospitalization rate was also related to the increase of nitrate concentration [186]. Additionally, the mortality rate of the elderly was significantly associated with nitrate concentrations [187,188].
In addition to the inorganic component, the organic part of PM is formed in a complex and poorly understood way, and it is also known as organic aerosols, such as PAHs, VOCs, and soot [174,189]. PAHs, which are rich in carbon and hydrophobic, easily cross cell membranes, and quickly enter cells. Then, the PAHs from a harmful intermediate inside the cell with a ring of active epoxides, and, when a gene mutates under the circumstances of a gene polymerase error, the PAHs randomly select locations in the genome, in some cases leading to cancer [190]. Long-term exposure can affect women’s reproductive health, cause proteinuria, and even lead to lung cancer [191,192,193].
Another critical component, VOCs, are organic substances that can easily evaporate under ambient air conditions, and most of them are toxic. The VOCs can cause skin irritation, cancer, respiratory diseases, chronic obstructive pulmonary disease, bronchial asthma, and systolic plus diastolic hypertension [194,195,196]. The increased concentration of VOCs will lead to decreased respiratory and lung function in children and cardiopulmonary dysfunction in susceptible populations [197].
The levels of PM found in the indoor environment are mainly brought in by ventilated airflows or produced by burning indoors for heating and cooking. Soot is formed through a series of reactions in which small free radicals (e.g., OH, O, H, CH, and CH2) cause chemically induced combustion and fuel decomposition, producing larger hydrocarbon free radicals and PAHs. Some soot is cytotoxic and has adverse effects on cardiovascular and lung health. PM penetrates deep into the lungs and enters the bloodstream, causing high blood pressure and damage to blood vessels. Once in the bloodstream, PM can spread to other organs, such as the heart, damaging their cellular structure and function [198].
Compared with PM10, PM2.5 with smaller particle sizes has larger specific surface area and larger adsorption capacity, and toxic heavy metals are more likely to bind to PM2.5 [199], and so do acid oxides, organic pollutants and pathogenic microorganisms. Dacunto et al. found that the proportion of trace metal (transition metal) elements and carcinogenic polycyclic aromatic hydrocarbons in PM2.5 was almost twice that of PM10. At least 60% of PM2.5–PM10 is reported to be deposited on the outside of the chest [172,200].
Particles with a size ranging from 1 to 2.5 μm mainly deposited in bronchial and alveolar, and some particles remained in lung tissue for a long time, forming lung interstitial lesions. PM0.1 can invade alveolar and stay in it, and then quickly enter blood circulation system through breathing, and finally flow into human kidney, liver, heart, brain, and other organs. In conclusion, PM2.5 is more harmful to human health than PM10.
5.3. Harm to Different Groups
Because of the different occupational and physical characteristics of people, their susceptibility to PM is also different. Therefore, it is necessary to explore the different reactions of diverse populations to PM.
Most epidemiological studies have focused on the health effects of indoor PM on susceptible populations, namely pregnant women, children, or the elderly [138]. For pregnant women with long-term exposure to high levels of PM, the developing human fetus may be at risks, such as adverse birth outcomes, preterm birth, term low birth weights [159,201], congenital disabilities, stillbirths, and respiratory disease [202,203,204]. Epidemiological studies have shown that exposure to pollutants in the indoor environment is associated with respiratory diseases in children, such as wheezing, asthma, and rhinitis, and it can lead to disease in later life [205,206,207]. Mousavi et al. showed that exposure to air pollution in childhood increased the susceptibility to Alzheimer’s disease and Parkinson’s disease in adulthood [208]. Not just for children, but also for the elderly, exposure to indoor PM may be the most significant public health burden in terms of risk to health [209,210]. Chen et al. studied residential areas with long-term exposure to PM2.5 and PM2.5–10 and found that the decline of lung function in the elderly (aged 65 years or older) was related to PM [211]. Recent studies suggest that PM is associated with low bone mineral density and osteoporosis-related fractures [212]. Exposure to PM is associated with cognitive deficits, oxidative stress, neuroinflammation, and neurodegeneration [213]. Several metals, including aluminum, arsenic, cadmium, lead, manganese, and mercury, have been shown to affect the nervous system, while the general accumulation of metal ions in the brain can exacerbate oxidative stress and neuronal damage [214].
In addition to the relatively severe impact on susceptible populations, there is damage to people who, unavoidably, have long-term exposure to high PM concentrations. Indoor cooking has been considered one of the most important indoor PM [215]. Studies have shown that emissions from cooking can harm human health, leading to lung toxicity, immune-toxicity, genotoxicity, and potential carcinogenicity in the human body [216,217,218]. Particularly for individuals exposed to indoor cooking fumes, such as cooks, workers, and restaurant customers, health will be adversely affected [219]. Pan et al. suggested that kitchen staff is more likely to have oxidative stress than service area workers [220]. Bigert et al. found that female cooks, restaurant and kitchen assistants, and wait staff showed a statistically significant increase in myocardial infarction risk [221]. Welding can produce high amounts of fumes containing ultrafine particles with Mn [222]. Racette et al. observed that some might develop Parkinson’s disease 17 years earlier than the general population in welding populations [223].
Studies have shown gender differences in indoor PM exposure. Sears et al. studied people living near coal-fired power plants with coal-ash-fly-storage facilities and found that women were more susceptible than men to impaired cognitive ability and associated with PM exposure [224]. Additionally, Gregory et al. disclosed that the distribution of multiple sclerosis prevalence was related to PM10 concentration, especially in women [225]. In offices, female employees, and particularly those suffering from allergies, reported more sick-building-syndrome symptoms (e.g., sneezing, cough, tiredness, and irritability) than their male counterparts [226]. Contrary to the above, men are more likely than women to develop symptoms. In exploring the effects on the human brain of aerosols produced by exposure to electric frying, it was found that the aerosol response of the brain to electric frying occurred in males rather than females [227]. Weichenthal et al. analyzed the relationship between PM2.5 and non-accidental cardiovascular mortality and found that male cardiovascular mortality may be related to PM2.5 exposure, while female cardiovascular mortality had no similar association [228]. The differences in PM symptoms between men and women may be related to gender-specific behavior patterns [229].
The range of the effect of PM on health is broad, but it mainly affects the respiratory tract in children and cardiovascular function in the elderly. The impact of PM on different populations shows a need to improve health in the general population, to control the sources of PM, and to raise awareness of the potential impact of household pollutants.
6. Mitigation of Exposure to Indoor PM
6.1. Standards of Indoor PM
To reduce exposure to indoor PM and its adverse health impacts, many national organizations and influential worldwide committees (e.g., WHO) have stipulated mass standards and guidelines that coincide with desired indoor air quality. Indoor air standards to evaluate an acceptable quality of air are generally defined by various agencies, causing significant regional differences. Dai et al. installed long-term IAQ sensors in 117 homes in all climate zones of China in order to able to measure indoor PM2.5 and CO2 concentrations consecutively [230]. Using this indoor and outdoor data, local polynomial regression fitting was used to determine the relationship between indoor CO2 and PM2.5 concentrations and the corresponding outdoor parameters. Maleki et al. tested the potential of an artificial neural network (ANN) algorithm to estimate hourly air pollutant concentration parameters and two air quality indices, the air quality index (AQI) and the air quality health index (AQHI) [231]. Air quality often has negative health, socio-economic, agricultural, and political consequences. Meteorology and pollution sources are two basic factors affecting air quality. The method can be used to predict the spatial and temporal distribution of pollutants and air quality index. Main standards and guidelines formulated by global institutions are summarized in Table 3, and they guide the development of effective strategies.
Table 3.
Standards and guidelines for PM2.5 and PM10.
In China, the previous Indoor Air Quality Standard (GBT 17095-1997) only provided a limit for PM10 and stipulated that the daily permissible maximum concentration of PM10 should be 0.15 mg/m3. With increased knowledge about indoor air pollution, PM with sizes <2.5 and 10 µm (PM2.5 and PM10, respectively) are now both listed as common indoor air pollutants. A standard and guidelines (JGJ/T 309-2013), issued on 2 July 2013, require that the daily average concentration of indoor PM2.5 should be <75 µg/m3. As early as 1996, Singapore formulated a control standard for PM10 in office air, and the value was 150 µg/m3 [233]. However, a control standard for indoor PM2.5 in Singapore is still lacking. In 2012, Canada established the Residential Indoor Air Quality Guidelines, which state that PM2.5 needs to be monitored, with a limit of 100 µg/m3 as a 1 h average (Short-Term Exposure) and 40 µg/m3 as an 8 h average (Long-Term Exposure). The National Ambient Air Quality Standard (NAAQS), set by USEPA, stipulates 35 µg/m3 and 15 µg/m3 for 24 h and annual periods, respectively, for exposure to PM2.5. For PM10, the US EPA [236] states that the permissible value is 150 µg/m3 over an average of 24 h. The United Kingdom, Finland, and Germany do not have PM2.5 monitoring [237]. However, these European countries follow the guidelines set by the WHO with values of 25 µg/m3 and 10 µg/m3 for 24 h and annual averages, respectively. Because various international institutions set these standards and guidelines, they are not in unity. Therefore, a comprehensive investigation should be carried out to develop uniform standards and practical strategies to mitigate exposure to indoor PM. Mass concentration predictions have a key role to play in making decisions about atmospheric resources [243]. This has had adverse health effects, such as high morbidity and mortality rates from cardiovascular and respiratory diseases. For this cause, it is crucial to avoid air pollution in advance by improving air quality protection and ensuring effective environmental monitoring. This is very critical for people’s daily safety and the government’s decision-making on air quality regulation.
6.2. Effective Removal Technologies of Indoor PM
Current particulate removal technologies mainly involve filtration, adsorption, electrostatic dust removal, and the negative ion and plasma (NIP) method (Table 4). They have been applied in various aspects of life to improve air quality where humans live and work.
Table 4.
Application of Removal Technologies.
Generally, filtration is typically installed to eliminate PM prior to other abatement technology [253]. Five principles for removal are used in filter technology, including interception, diffusion, inertia, gravity, and the electrostatic force (Figure 5) [244]. In particulate removal by filtration, bag type dust collectors, particle layer dust collectors, and carbon-based air filters are three typical, traditional methods [245,254,255]. Adsorption is often used in conjunction with filter-particulate removal in air purifiers to reach superior indoor air quality. Disadvantages include a compromised efficiency at a high relative humidity [256], the need for periodic replacement of adsorbents to prevent re-entry of waste pollutants into the atmosphere, and that airborne bacteria may thrive on carbon sorbents.
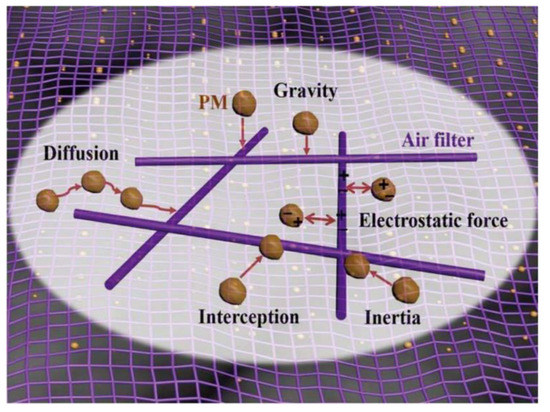
Figure 5.
The five main capturing mechanisms for various kinds of PM (Source reference: [244]).
Some carbon-based materials, e.g., activated carbon fiber and granular activated carbon, with the virtues of high density, low ash content, and high absorption capacity, have been widely used for removing molecules, gases, and vapors from indoor air [248].
Electric-collection technology can be applied in filtration technology to improve the efficiency of filter-particulate removal. By applying electrostatic forces, air filters can capture PM without high-density micropores, thus leading to a sharply decreased filter thickness and higher filtration removal efficiency [257]. On the basis of these previous findings, a high-efficiency rotating TENG (R-TENG) enhanced polyimide (PI) nanofiber air filter was developed for PM removal in ambient atmospheres by Gu et al. [251]. (TENG stands for triboelectric nanogenerator.) Charged positively by the R-TENG, an electric field was formed around a stainless-steel mesh and PI-nanofiber, thus significantly improving the PM-capturing efficiency of the filter due to electrostatic filtration [258]. However, electronic filters can generate hazardous charged particles, an obstacle for the extensive application of electrostatic-particulate-removal technology [259].
In addition to hazardous gases, indoor particles also can carry large amounts of harmful viruses and bacteria. Therefore, to ensure indoor human health and reduce noise pollution from filtration, new particulate-removal technologies that can provide such problems are imperative. Negative ion and plasma (NIP) methods are being developed due to their excellent ultra-fine particle removal and sterilization without making noise. The principles of the NIP methods are similar. Both are charged by an external force to neutralize the particles and coalesce them to form larger particles that settle [260]. Nowadays, the main application of the NIP method is plasma dust collection [252]. However, the PM is not removed but only adheres to the nearby surface, and it is easy to raise dust again. Therefore, the widespread application of the negative ion and plasma method is restricted.
6.3. Strategies to Reduce Exposure to Indoor PM
Rational and effective methods need to be taken to mitigate exposure to indoor PM for the sake of human health and a comfortable indoor environment. Based on the characteristics and sources of indoor PM, control strategies can be targeted at two sources: ambient PM and domestic PM.
6.3.1. Control Strategies for Ambient PM
- (1)
- Building ventilation
Ventilation of households is crucial to bring indoor PM concentrations to levels similar to those of outdoors [261]. Specific measures should be considered, based on the ventilation types of buildings, which are identified as being natural, mechanical, or a mixed type of ventilation. Buildings with mechanical ventilation systems (air conditioners) show a minimum concentration of particles, which indicates that adequate household ventilation can improve indoor air quality. Building ventilation (interventions) is beneficial to mitigate indoor PM exposure, but they always incur a high energy expenditure cost. Therefore, an optimized building intervention model is needed to establish maximum efficiency and minimum energy cost [262]. When outdoor PM2.5 concentration is high, doors and windows should be closed. The key of the method is real-time monitoring of indoor and outdoor PM2.5. Also important is improving air distribution, increasing ventilation rate, fresh air (filtration) volume, regularly cleaning and disinfecting air-conditioning system, etc. In buildings with centralized or semi-centralized air-conditioning systems, the use of fresh air systems can reduce indoor PM2.5. Some experts believe that for public buildings, air purification facilities could be equipped in existing fresh air units, return air inlet, and blast pipes, and air cleaners also could be used directly there [261].
- (2)
- Climate and season
In some regions, climatic and seasonal characteristics are distinct, such as in the east and west of the USA and southeast China. The variations can be used to mitigate exposure to indoor PM [263,264,265]. In China in the summer, the prevailing wind direction from the south will bring clean air from the ocean. As such, at this time, citizens should open windows and doors frequently to promote clean air exchange. In winter, windows and doors should be closed as far as possible. Industrial emissions must be reduced. The coal should be desulfurized before burning. Boilers of 30 t/h should be phased out as soon as possible. In North China, central heating should be promoted.
- (3)
- Traffic and industries
With rapid urbanization and industrialization, particles generated by traffic and industries have aggravated the indoor air environment. To handle air pollution in heavily trafficked areas, enough urban greenspace should be guaranteed to reduce indoor levels of PM, especially PM2.5 [266]. In addition, vehicle emission must be controlled, and emission standards must be strictly followed. Additionally, vehicles that use new-energy technology ought to be promoted. Urban greenery and other protective procedures should be enhanced where traffic is heavy. Finally, the upgrading of petroleum refining should be accelerated to prepare for the improvement of motor gasoline and diesel.
Industrial and agricultural emissions are the two primary sources of particles that need to be reduced. Increased use of clean fuels and effective dust extraction is crucial so that industries and agriculture can reduce the generation and emission of PM. Removal of industrial dust is an issue that people are increasingly concerned about because of its health effects on humans, especially workers in factories. Nanofibrous filters, produced by electrospinning, have increasingly been used in air filtration products due to their high surface area and micro-porosity, which improve the entrapment of PM [267]. Liu et al. synthesized a transparent air filter by electrospinning, which achieved high ventilation and PM2.5 filtration efficiency (>95.0%) [268].
6.3.2. Control Strategies for Indoor PM
- (1)
- Smoking
The first strategy is to control smoking. The government and relevant departments should actively promote the smoking ban and enhance the public’s health awareness. In public places, such as train stations and restaurants, there should be smoking and non-smoking areas and a reasonable division of functional areas to avoid cross-contamination. One study showed that Ontario’s smoking ban saved five to seven non-smokers working in bars $5–6.8 million a year [269]. With the development of e-cigarettes, more teens are jumping on the bandwagon and using them; even though levels of some potentially harmful ingredients from e-cigarettes are significantly lower than combustible cigarette, this does not mean that e-cigarette aerosols are ‘‘harmless vapour” as industry has claimed in the past [270]. The effects of SHA vaping exposure are largely unknown. E-cigarettes are not emission-free and their pollutants can reduce indoor air quality because the air exhaled by e-cigarette smokers contains dangerous chemicals. There is a potential health concern of SHA exposure via both respiration and dermal absorption. In particular, ultrafine particles formed from supersaturated 1,2-propanediol vapour can be deposited in the lung, while atomized nicotine appears to increase the release of inflammatory signaling molecule NO after inhalation.
Overall, the increased use of e-cigarettes is worrisome and restrictions on tobacco marketing should be implemented to better protect the health of the general public. Future research should specifically focus on the long-term adverse effects of e-cigarettes on the cardiovascular system or respiratory diseases and cancer, as there is still a lack of strong evidence. There is no doubt, however, that quitting smoking is and will continue to be the most powerful way to prevent the cardiovascular and respiratory diseases caused by smoking and to protect people’s health [271].
- (2)
- Cooking
Natural gas cooking has been identified as one of the predominant sources of indoor PM in developed countries [51,215,272,273,274,275,276]. Therefore, the development of methods to control PM generated from cooking is imperative. Kitchens must be ventilated to promote air exchange during cooking. Traditional solid fuels, such as straw, coal, and asphalt, must be replaced by clean energy as much as possible. Natural gas, methane, and electricity are good clean-energy options. Stoves must be maintained in functional order, especially in rural areas [277]. Cooking habits should be improved, and exhaust hoods are crucial for control of indoor PM during cooking [261]. Different cooking methods and ingredients, such as preferring safflower oil to olive oil. Adding salt and pepper early in cooking can also reduce the emission of PM.
- (3)
- Indoor activities
Apart from cooking, indoor activities should be carried out to reduce PM. People should clean households regularly to remove the origins of indoor PM. Regular cleaning of the house, reasonable choices of decoration, as far as possible not keeping pets, and burning incense less, are considered good habits. Branco et al. demonstrated that improving the ventilation rate with convenient cleaning decreased the indoor PM concentration in a nursery from 79 ± 22 µg/m3 to 64 ± 15 µg/m3, which showed that regular indoor cleaning could control indoor PM [278].
- (4)
- Indoor layout
Interior decoration, such as house plants, can improve indoor air quality and reduce indoor PM [266]. Previous studies have confirmed that the impact of woodland with rough surface on PM2.5 is much greater than that of grassland, while grassland has historically had a smaller effect on PM2.5 reduction [191,279]. However, tree-grass configurations contributed much more than tree only configurations for horizontal PM2.5 reduction, indicating that grassland is playing a contributory role in reducing atmospheric PM2.5. Vegetation has the irreplaceable role of adsorbing dust and removing harmful substances in the air. Leaf structure can be chosen for the deposition of dust [280,281]. Trees remove gas pollution mainly through leaf stomata, although some of the gas is removed from the plant’s surface. Once inside the leaf, the gas diffuses into the intercellular space and may be absorbed by the water membrane to form acids or react with the inner surface of the leaf.
Trees also eliminate pollution by intercepting airborne particles. Some particles can be absorbed by the tree, but most of the trapped particles remain on the surface of the plant. The intercepted particle is often suspended back to the atmosphere, washed away by rain, or dropped to the ground with leaf and twig fall. A widely accepted view is that trees with large leaf area density and the turbulent air movement caused by their structure can capture particulate matter. Leaves provide surfaces for removing pollutants through wet and dry deposition, adsorption, and absorption. Local decreases of temperatures may modify the rate of chemical reactions, leading to decreased ozone concentrations [282]. Green plant species differ in their ability to purify particulate air pollution. Appropriate indoor green plants for air purification are orchids, caladium, and red back laurel. Leaf hairs can trap and absorb floating particles and smoke in the air. Active green walls use ornamental plants growing along the vertical plane, coupled with mechanical air induction, to actively attract polluted air through the plant growth substrate and leaves. Additionally, with improved living standards, urban residents might buy air cleansers to reduce indoor PM levels and improve indoor air quality. HEPA air purifiers are effective at reducing the concentration of indoor air particles [283]. HEPA filter-type small air purifiers demonstrate relatively high particle removal performance, based on the high single-pass collection efficiency of the HEPA filters (>99.97% for 0.3 μm particles).
7. Conclusions
PM includes a mixture of solid and liquid particles suspended in air, and these particles can vary in size, shape, and chemical composition. Particles that are less than 10 μm in diameter (PM10 and PM2.5) are of major concern, because they are inhalable, thereby impacting the heart and lungs, and are associated with respiratory diseases, including asthma, chronic bronchitis, and acute bronchitis. Indoor PM is more harmful to special populations, such as the elderly, children, and pregnant women. Indoor PM originates mainly from combustion activities and the regular wearing of household furniture. It also is derived from outdoor sources, including dust particles. PM can be enriched with inorganic and organic contaminants, including toxic heavy metals and carcinogenic, volatile organic compounds. To reduce exposure to indoor PM and its adverse health impacts, the government and industry should formulate detailed and uniform indoor PM control standards based on abundant research. From a practical point of view, indoor air-purifier technologies involving electrostatic precipitation and filtration, as well as natural ventilation, are most commonly adopted to control concentrations of indoor PM. Additionally, regular indoor cleaning and suitable interior decoration, such as house plants and air purifiers, also significantly influence indoor air quality and reduce indoor PM.
Given the current knowledge about the sources, distribution, pathways, characteristics, and health effects of indoor PM, the following research areas should be pursued:
- Development and adoption of advanced technologies, such as the tapered element oscillating microbalance (TEOM), X-ray fluorescence (XRF), and inductively coupled plasma mass spectrometry (ICP-MS), to quantify and fingerprint sources of indoor PM.
- Characterization and monitoring of bioaccessibility of inorganic and organic contaminants in indoor PM.
- Studies on mucosal interactions of indoor PM and associated contaminants concerning their toxicity.
- Development and evaluation of advanced PM removal technologies involving electrostatic precipitation to mitigate the health impacts of indoor PM.
- As soon as possible, the government and industry should formulate detailed and uniform indoor PM control standards, based on many investigations.
Author Contributions
Conceptualization, L.Z., C.O., Y.Y. and N.B.; writing—original draft, L.Z., C.O., D.M.-A., K.S.V., T.P., H.W. and K.M.; writing—review and editing, M.V., Y.Y., N.B. and M.B.K.; visualization, L.Z., C.O., M.V. and Y.Y.; data curation, L.Z., H.W., K.S.V. and T.P.; funding acquisition, L.Z. and C.O.; supervision, N.B. All authors have read and agreed to the published version of the manuscript.
Funding
This research was funded by “National Natural Science Foundation of China, No. 51708302”, “Natural Science Foundation of Jiangsu higher Education Institution of China, No. 17KJB610008 and No. 19KJD610002”, and “Open Funds of Jiangsu Key Laboratory for Biomass-based Energy and Enzyme Technology, No. BEETKC1906”.
Institutional Review Board Statement
Not applicable.
Informed Consent Statement
Not applicable.
Data Availability Statement
Not applicable.
Conflicts of Interest
The authors declare no conflict of interest.
References
- Kim, K.H.; Kabir, E.; Kabir, S. A review on the human health impact of airborne particulate matter. Environ. Int. 2015, 74, 136–143. [Google Scholar] [CrossRef] [PubMed]
- Adams, K.; Greenbaum, D.S.; Shaikh, R.; van Erp, A.M.; Russell, A.G. Particulate matter components, sources, and health: Systematic approaches to testing effects. J. Air Waste Manag. Assoc. 2015, 65, 544–558. [Google Scholar] [CrossRef] [PubMed]
- Nasir, Z.A.; Colbeck, I. Particulate pollution in different housing types in a UK suburban location. Sci. Total Environ. 2013, 445, 165–176. [Google Scholar] [CrossRef] [PubMed]
- Mohankumar, S.; Senthilkumar, P. Particulate matter formation and its control methodologies for diesel engine: A comprehensive review. Renew. Sustain. Energy Rev. 2017, 80, 1227–1238. [Google Scholar] [CrossRef]
- Bootdee, S.; Chantara, S.; Prapamontol, T. Determination of pm2.5 and polycyclic aromatic hydrocarbons from incense burning emission at shrine for health risk assessment. Atmos. Pollut. Res. 2016, 7, 680–689. [Google Scholar] [CrossRef]
- Coombs, K.C.; Chew, G.L.; Schaffer, C.; Ryan, P.H.; Brokamp, C.; Grinshpun, S.A.; Adamkiewicz, G.; Chillrud, S.; Hedman, C.; Colton, M.; et al. Indoor air quality in green-renovated vs. non-green low-income homes of children living in a temperate region of US (Ohio). Sci. Total Environ. 2016, 554, 178–185. [Google Scholar] [CrossRef]
- McNamara, M.; Thornburg, J.; Semmens, E.; Ward, T.; Noonan, C. Coarse particulate matter and airborne endotoxin within wood stove homes. Indoor Air 2013, 23, 498–505. [Google Scholar] [CrossRef]
- Rivas, I.; Viana, M.; Moreno, T.; Pandolfi, M.; Amato, F.; Reche, C.; Bouso, L.; Alvarez-Pedrerol, M.; Alastuey, A.; Sunyer, J.; et al. Child exposure to indoor and outdoor air pollutants in schools in Barcelona, Spain. Environ. Int. 2014, 69, 200–212. [Google Scholar] [CrossRef]
- Russo, E.T.; Hulse, T.E.; Adamkiewicz, G.; Levy, D.E.; Bethune, L.; Kane, J.; Reid, M.; Shah, S.N. Comparison of indoor air quality in smoke-permitted and smoke-free multiunit housing: Findings from the Boston Housing Authority. Nicotine Tob. Res. 2015, 17, 316–322. [Google Scholar] [CrossRef]
- Jones, R.R.; Hogrefe, C.; Fitzgerald, E.F.; Hwang, S.A.; Ozkaynak, H.; Garcia, V.C.; Lin, S. Respiratory hospitalizations in association with fine PM and its components in New York State. J. Air Waste Manag. Assoc. 2015, 65, 559–569. [Google Scholar] [CrossRef]
- Ostro, B.; Roth, L.; Malig, B.; Marty, M. The Effects of Fine Particle Components on Respiratory Hospital Admissions in Children. Environ. Health Perspect. 2009, 117, 475–480. [Google Scholar] [CrossRef]
- Wichmann, F.A.; Muller, A.; Busi, L.E.; Cianni, N.; Massolo, L.; Schlink, U.; Porta, A.; Sly, P.D. Increased asthma and respiratory symptoms in children exposed to petrochemical pollution. J. Allergy Clin. Immun. 2009, 123, 632–638. [Google Scholar] [CrossRef] [PubMed]
- Liu, H.Y.; Dunea, D.; Iordache, S.; Pohoata, A. A Review of Airborne Particulate Matter Effects on Young Children’s Respiratory Symptoms and Diseases. Atmosphere 2018, 9, 150. [Google Scholar] [CrossRef]
- Reiss, R.; Anderson, E.L.; Cross, C.E.; Hidy, G.; Hoel, D.; McClellan, R.; Moolgavkar, S. Evidence of health impacts of sulfate- and nitrate-containing particles in ambient air. Inhal. Toxicol. 2007, 19, 419–449. [Google Scholar] [CrossRef] [PubMed]
- Hoffmann, B.; Moebus, S.; Mohlenkamp, S.; Stang, A.; Lehmann, N.; Dragano, N.; Schmermund, A.; Memmesheimer, M.; Mann, K.; Erbel, R.; et al. Residential exposure to traffic is associated with coronary atherosclerosis. Circulation 2007, 116, 489–496. [Google Scholar] [CrossRef] [PubMed]
- Pope, C.A.; Burnett, R.T.; Thurston, G.D.; Thun, M.J.; Calle, E.E.; Krewski, D.; Godleski, J.J. Cardiovascular mortality and long-term exposure to particulate air pollution-Epidemiological evidence of general pathophysiological pathways of disease. Circulation 2004, 109, 71–77. [Google Scholar] [CrossRef] [PubMed]
- WHO (World Health Organization). 9 out of 10 People Worldwide Breathe Polluted Air, but More Countries are Taking Action. Available online: http://www.who.int/news-room/detail/02-05-2018-9-out-of-10-people-worldwide-breathe-polluted-air-but-more-countries-are-taking-action (accessed on 6 September 2018).
- Jeon, Y.M.; Lee, M.Y. Airborne nanoparticles (PM0.1) induce autophagic cell death of human neuronal cells. J. Appl. Toxicol. 2016, 36, 1332–1342. [Google Scholar] [CrossRef] [PubMed]
- Oberdorster, G. Pulmonary effects of inhaled ultrafine particles. Int. Arch. Occup. Environ. Health 2001, 74, 1–8. [Google Scholar] [CrossRef]
- Lai, H.K.; Kendall, M.; Ferrier, H.; Lindup, I.; Alm, S.; Hanninen, O.; Jantunen, M.; Mathys, P.; Colvile, R.; Ashmore, M.R.; et al. Personal exposures and microenvironment concentrations of PM2.5, VOC, NO2 and CO in Oxford, UK. Atmos. Environ. 2004, 38, 6399–6410. [Google Scholar] [CrossRef]
- Zaidi, S.M.A.; Moin, O.; Khan, J.A. Second-hand smoke in indoor hospitality venues in Pakistan. Int. J. Tuberc. Lung Dis. 2011, 15, 972–977. [Google Scholar] [CrossRef]
- Smith, K.R. National burden of disease in India from indoor air pollution. Proc. Natl. Acad. Sci. USA 2000, 97, 13286–13293. [Google Scholar] [CrossRef]
- Simoni, M.; Carrozzi, L.; Baldacci, S.; Scognamiglio, A.; di Pede, F.; Sapigni, T.; Viegi, G. The Po River Delta (north Italy) indoor epidemiological study: Effects of pollutant exposure on acute respiratory symptoms and respiratory function in adults. Arch. Environ. Health 2002, 57, 130–136. [Google Scholar] [CrossRef]
- Yamamoto, S.S.; Phalkey, R.; Malik, A.A. A systematic review of air pollution as a risk factor for cardiovascular disease in South Asia: Limited evidence from India and Pakistan. Int. J. Hyg. Environ. Health 2014, 217, 133–144. [Google Scholar] [CrossRef] [PubMed]
- You, S.M.; Wan, M.P. Experimental investigation and modelling of human-walking-induced particle resuspension. Indoor Built Environ. 2015, 24, 564–576. [Google Scholar] [CrossRef]
- WHO (World Health Organization). WHO Guidelines for Indoor Air Quality: Selected Pollutants; WHO: Geneva, Switzerland, 2010. [Google Scholar]
- Breysse, P.N.; Diette, G.B.; Matsui, E.C.; Butz, A.M.; Hansel, N.N.; McCormack, M.C. Indoor air pollution and asthma in children. Proc. Am. Thorac. Soc. 2010, 7, 102–106. [Google Scholar] [CrossRef] [PubMed]
- Destaillats, H.; Maddalena, R.L.; Singer, B.C.; Hodgson, A.T.; McKone, T.E. Indoor pollutants emitted by office equipment: A review of reported data and information needs. Atmos. Environ. 2008, 42, 1371–1388. [Google Scholar] [CrossRef]
- Holmes, H.A.; Pardyjak, E.R.; Speckart, S.O.; Alexander, D. Comparison of indoor/outdoor carbon content and time resolved PM concentrations for gas and biomass cooking fuels in Nogales, Sonora, Mexico. Atmos. Environ. 2011, 45, 7600–7611. [Google Scholar] [CrossRef]
- Waring, M.S. Secondary organic aerosol in residences: Predicting its fraction of fine particle mass and determinants of formation strength. Indoor Air 2014, 24, 376–389. [Google Scholar] [CrossRef]
- Karagulian, F.; Belis, C.A.; Dora, C.F.C.; Pruss-Ustun, A.M.; Bonjour, S.; Adair-Rohani, H.; Amann, M. Contributions to cities’ ambient particulate matter (PM): A systematic review of local source contributions at global level. Atmos. Environ. 2015, 120, 475–483. [Google Scholar] [CrossRef]
- Paschold, H.; Li, W.W.; Morales, H.; Walton, J. Laboratory study of the impact of evaporative coolers on indoor PM concentrations. Atmos. Environ. 2003, 37, 1075–1086. [Google Scholar] [CrossRef]
- McNamara, M.L.; Thornburg, J.; Semmens, E.O.; Ward, T.J.; Noonan, C.W. Reducing indoor air pollutants with air filtration units in wood stove homes. Sci. Total Environ. 2017, 592, 488–494. [Google Scholar] [CrossRef]
- Molchanov, O.; Krpec, K.; Horak, J. Electrostatic precipitation as a method to control the emissions of particulate matter from small-scale combustion units. J. Clean. Prod. 2020, 246, 119022. [Google Scholar] [CrossRef]
- Cai, J.; Yu, W.; Li, B.Z.; Yao, R.M.; Zhang, T.J.W.; Guo, M.; Wang, H.; Cheng, Z.; Xiong, J.; Meng, Q.Y.; et al. Particle removal efficiency of a household portable air cleaner in real-world residences: A single-blind cross-over field study. Energy Build. 2019, 203, 109464. [Google Scholar] [CrossRef]
- Isiugo, K.; Jandarov, R.; Cox, J.; Ryan, P.; Newman, N.; Grinshpun, S.A.; Indugula, R.; Vesper, S.; Reponen, T. Indoor particulate matter and lung function in children. Sci. Total Environ. 2019, 663, 408–417. [Google Scholar] [CrossRef]
- Ferro, A.R.; Kopperud, R.J.; Hildemann, L.M. Source strengths for indoor human activities that resuspend particulate matter. Environ. Sci. Technol. 2004, 38, 1759–1764. [Google Scholar] [CrossRef]
- Oliveria, M.; Slezakova, K.; Delerue-Matos, C.; Pereira, M.C.; Morais, S. Children environmental exposure to particulate matter and polycyclic aromatic hydrocarbons and biomonitoring in school environments: A review on indoor and outdoor exposure levels, major sources and health impacts. Environ. Int. 2019, 124, 180–204. [Google Scholar] [CrossRef]
- Weschler, C.J.; Nazaroff, W.W. Dermal Uptake of Organic Vapors Commonly Found in Indoor Air. Environ. Sci. Technol. 2014, 48, 1230–1237. [Google Scholar] [CrossRef]
- Hassanvand, M.S.; Naddafi, K.; Faridi, S.; Arhami, M.; Nabizadeh, R.; Sowlat, M.H.; Pourpak, Z.; Rastkari, N.; Momeniha, F.; Kashani, H.; et al. Indoor/outdoor relationships of PM10, PM2.5, and PM1 mass concentrations and their water-soluble ions in a retirement home and a school dormitory. Atmos. Environ. 2014, 82, 375–382. [Google Scholar] [CrossRef]
- Morawska, L.; Afshari, A.; Bae, G.N.; Buonanno, G.; Chao, C.Y.H.; Hanninen, O.; Hofmann, W.; Isaxon, C.; Jayaratne, E.R.; Pasanen, P.; et al. Indoor aerosols: From personal exposure to risk assessment. Indoor Air 2013, 23, 462–487. [Google Scholar] [CrossRef]
- Salje, H.; Gurley, E.S.; Homaira, N.; Ram, P.K.; Haque, R.; Petri, W.; Moss, W.J.; Luby, S.P.; Breysse, P.; Azziz-Baumgartner, E. Impact of neighborhood biomass cooking patterns on episodic high indoor particulate matter concentrations in clean fuel homes in Dhaka, Bangladesh. Indoor Air 2014, 24, 213–220. [Google Scholar] [CrossRef] [PubMed]
- Sumpter, C.; Chandramohan, D. Systematic review and meta-analysis of the associations between indoor air pollution and tuberculosis. Trop. Med. Int. Health 2013, 18, 101–108. [Google Scholar] [CrossRef] [PubMed]
- Semmens, E.O.; Noonan, C.W.; Allen, R.W.; Weiler, E.C.; Ward, T.J. Indoor particulate matter in rural, wood stove heated homes. Environ. Res. 2015, 138, 93–100. [Google Scholar] [CrossRef] [PubMed]
- Schneider, J.; Rodelsperger, K.; Bruckel, B.; Kleineberg, J.; Woitowitz, H.J. Pleural mesothelioma associated with indoor pollution of asbestos. J. Cancer Res. Clin. 2001, 127, 123–127. [Google Scholar] [CrossRef]
- Perez, A.L.; Nelson, M.L.; Cheng, T.J.; Comerford, C.E.; Scott, P.K. A meta-analysis of airborne asbestos fiber concentrations from work with or around asbestos-containing floor tile. Int. J. Occup. Environ. Health 2018, 24, 134–148. [Google Scholar] [CrossRef] [PubMed]
- Branis, M.; Rezacova, P.; Domasova, M. The Effect of Outdoor Air and Indoor Human Activity on Mass Concentrations of PM10, PM2.5 and PM1 in a Classroom. Environ. Res. 2005, 99, 143–149. [Google Scholar] [CrossRef]
- Tran, V.V.; Park, D.; Lee, Y.-C. Indoor Air Pollution, Related Human Diseases, and Recent Trends in the Control and Improvement of Indoor Air Quality. Int. J. Environ. Res. Public Health 2020, 17, 2927. [Google Scholar] [CrossRef]
- Yu, K.-P.; Yang, K.R.; Chen, Y.C.; Gong, J.Y.; Chen, Y.P.; Shih, H.-C.; Lung, S.-C.C. Indoor air pollution from gas cooking infive Taiwanese families. Build. Environ. 2015, 93, 258–266. [Google Scholar] [CrossRef]
- Huboyo, H.S.; Tohno, S.; Cao, R.Q. Indoor PM2.5 Characteristics and CO Concentration Related to Water-Based and Oil-Based Cooking Emissions Using a Gas Stove. Aerosol Air Qual. Res. 2011, 11, 401–411. [Google Scholar] [CrossRef]
- Zhang, Q.F.; Gangupomu, R.H.; Ramirez, D.; Zhu, Y.F. Measurement of Ultrafine Particles and Other Air Pollutants Emitted by Cooking Activities. Int. J. Environ. Res. Public Health 2010, 7, 1744–1759. [Google Scholar] [CrossRef]
- Liao, C.M.; Shen, S.C.; Chen, J.W.; Liang, H.M. Contribution of Chinese-style cooking and incense burning to personal exposure and residential PM concentrations in Taiwan region. Sci. Total Environ. 2006, 358, 72–84. [Google Scholar] [CrossRef]
- Gurley, E.S.; Homaira, N.; Salje, H.; Ram, P.K.; Haque, R.; Petri, W.; Bresee, J.; Moss, W.J.; Breysse, P.; Luby, S.P. Indoor exposure to particulate matter and the incidence of acute lower respiratory infections among children: A birth cohort study in urban Bangladesh. Indoor Air 2013, 23, 379–386. [Google Scholar] [CrossRef]
- Li, T.; Cao, S.; Fan, D.; Zhang, Y.; Wang, B.; Zhao, X.; Leaderer, B.P.; Shen, G.; Zhang, Y.; Duan, X. Household concentrations and personal exposure of PM2.5 among urban residents using different cooking fuels. Sci. Total Environ. 2016, 548, 6–12. [Google Scholar] [CrossRef]
- Njenga, M.; Iiyama, M.; Jamnadass, R.; Helander, H.; Larsson, L.; de Leeuw, J.; Neufeldt, H.; de Nowina, K.R.; Sundberg, C. Gasifier as a cleaner cooking system in rural Kenya. J. Clean. Prod. 2016, 121, 208–217. [Google Scholar] [CrossRef]
- Holm, S.M.; Balmes, J.; Gillette, D.; Hartin, K.; Seto, E.; Lindeman, D.; Polanco, D.; Fong, E. Cooking behaviors are related to household particulate matter exposure in children with asthma in the urban East Bay Area of Northern California. PLoS ONE 2018, 13, e0197199. [Google Scholar] [CrossRef] [PubMed]
- Drago, G.; Perrino, C.; Canepari, S.; Ruggieri, S.; L’Abbate, L.; Longo, V.; Colombo, P.; Feasca, D.; Balzan, M.; Cuttitta, G.; et al. Relationship between domestic smoking and metals and rare earth elements concentration in indoor PM2.5. Environ. Res. 2018, 165, 71–80. [Google Scholar] [CrossRef]
- Braun, M.; Koger, F.; Klingelhofer, D.; Muller, R.; Gronerberg, D.A. Particulate matter emissions of four different cigarette types of one popular brand: Influence of tobacco strength and additives. Int. J. Environ. Res. Public Health 2019, 16, 263. [Google Scholar] [CrossRef]
- Lee, S.; Wang, B. Characteristics of emissions of air pollutants from burning of incense in a large environmental chamber. Atmos. Environ. 2004, 38, 941–951. [Google Scholar] [CrossRef]
- Lin, T.C.; Krishnaswamy, G.H.; Chi, D.S. Incense smoke: Clinical, structural and molecular effects on airway disease. Clin. Mol. Allergy 2008, 6, 3. [Google Scholar] [CrossRef]
- Kumar, R.; Gupta, N.; Kumar, D.; Mavi, A.K.; Singh, K.; Kumar, M. Monitoring of indoor particulate matter during burning of mosquito coil, incense sticks and dhoop. Indian J. Allergy Asthma Immunol. 2014, 28, 68–73. [Google Scholar] [CrossRef]
- Soule, E.; Maloney, S.F.; Spindle, T.; Rudy, A.; Hiler, M.M.; Cobb, C.O. Electronic cigarette use and indoor air quality in a natural setting. Tob. Control. 2017, 26, 109–112. [Google Scholar] [CrossRef] [PubMed]
- Schober, W.; Fembacher, L.; Frenzen, A.; Fromme, H. Passive exposure to pollutants from conventional cigarettes and new electronic smoking devices (IQOS, e-cigarette) in passenger cars. Int. J. Hyg. Environ. Health 2019, 222, 486–493. [Google Scholar] [CrossRef] [PubMed]
- Cassee, F.R.; Héroux, M.E.; Gerlofs-Nijland, M.E.; Kelly, F.J. Particulate matter beyond mass: Recent health evidence on the role of fractions, chemical constituents and sources of emission. Inhal. Toxicol. 2013, 25, 802–812. [Google Scholar] [CrossRef] [PubMed]
- Morawska, L.; Ayoko, G.A.; Bae, G.N.; Buonanno, G.; Chao, C.Y.H.; Clifford, S.; Fu, S.C.; Hanninen, O.; He, C.; Isaxon, C.; et al. Airborne particles in indoor environment of homes, schools, offices and aged care facilities: The main routes of exposure. Environ. Int. 2017, 108, 75–83. [Google Scholar] [CrossRef] [PubMed]
- Jones, N.; Thornton, C.; Mark, D.; Harrison, R. Indoor/outdoor relationships of particulate matter in domestic homes with roadside, urban and rural locations. Atmos. Environ. 2000, 34, 2603–2612. [Google Scholar] [CrossRef]
- Kuo, H.W.; Shen, H.Y. Indoor and outdoor PM2.5 and PM10 concentrations in the air during a dust storm. Build. Environ. 2010, 45, 610–614. [Google Scholar] [CrossRef]
- Goudie, A.S. Dust Storms and Human Health. In Extreme Weather Events and Human Health; Akhtar, R., Ed.; Springer: Cham, Switzerland, 2020; pp. 13–24. [Google Scholar]
- Baklanov, A.; Molina, L.T.; Gauss, M. Megacities, air quality and climate. Atmos. Environ. 2016, 126, 235–249. [Google Scholar] [CrossRef]
- Chithra, V.S.; Shiva Nagendra, S.M. Particulate Matter Mass and Number Concentrations Inside a Naturally Ventilated School Building Located Adjacent to an Urban Roadway. J. Inst. Eng. (India) Ser. A 2014, 95, 143–149. [Google Scholar] [CrossRef]
- Putaud, J.P.; Raes, F.; Van Dingenen, R.; Bruggemann, E.; Facchini, M.C.; Decesari, S.; Fuzzi, S.; Gehrig, R.; Huglin, C.; Laj, P.; et al. A European aerosol phenomenology-2 chemical characteristics of particulate matter at kerbside, urban, rural and background sites in Europe. Atmos. Environ. 2004, 38, 2579–2595. [Google Scholar] [CrossRef]
- Wang, Y.C.; Chen, J.; Wang, Q.Y.; Qin, Q.D.; Ye, J.H.; Han, Y.M.; Li, L.; Zhen, W.; Zhi, Q.; Zhang, Y.; et al. Increased Secondary Aerosol Contribution and Possible Processing on Polluted Qinter Days in China. Environ. Int. 2019, 127, 78–84. [Google Scholar] [CrossRef]
- Morakinyo, O.M.; Mokgobu, M.I.; Mukhola, M.S.; Godobedzha, T. Biological Composition of Respirable Particulate Matter in an Industrial Vicinity in South Africa. Int. J. Environ. Res. Public Health 2019, 16, 629. [Google Scholar] [CrossRef]
- Vu, T.V.; Ondracek, J.; Zdímal, V.; Schwarz, J.; Delgado-Saborit, J.M.; Harrison, R.M. Physical properties and lung deposition of particles emitted from five major indoor sources. Air Qual. Atmos. Health 2017, 10, 1–14. [Google Scholar] [CrossRef]
- Nazaro, W.W. Indoor particle dynamics. Indoor Air 2004, 14, 175–183. [Google Scholar] [CrossRef] [PubMed]
- Hussain, S.; Parker, S.; Edwards, K.; Finch, J.; Jeanjean, A.; Leigh, R.; Gonem, S. Effects of indoor particulate matter exposure on daily asthma control. Ann. Allergy Asthma Immunol. 2019, 123, 375–380. [Google Scholar] [CrossRef] [PubMed]
- Abbing-Karahagopian, V.; van der Gugten, A.C.; van der Ent, C.K.; Uiterwaal, C.; de Jongh, M.; Oldenwening, M.; Brunekreef, B.; Gehring, U. Effect of endotoxin and allergens on neonatal lung function and infancy respiratory symptoms and eczema. Pediatr. Allergy Immunol. 2012, 23, 448–455. [Google Scholar] [CrossRef] [PubMed]
- Mercorio, R.; Bonzini, M.; Angelici, L.; Iodice, S.; Delbue, S.; Mariani, J.; Apostoli, P.; Pesatori, A.C.; Bollati, V. Effects of metal-rich particulate matter exposure on exogenous and endogenous viral sequence methylation in healthy steel-workers. Environ. Res. 2017, 159, 452–457. [Google Scholar] [CrossRef]
- Hulin, M.; Simoni, M.; Viegi, G.; Annesi-Maesano, I. Respiratory health and indoor air pollutants based on quantitative exposure assessments. Eur. Respir. J. 2012, 40, 1033–1045. [Google Scholar] [CrossRef] [PubMed]
- Bousquet, J.; Khaltaev, N.; Cruz, A.A.; Denburg, J.; Fokkens, W.J.; Togias, A.; Zuberbier, T.; Baena-Cagnani, C.E.; Canonica, G.W.; Weel, C.V.; et al. Allergic Rhinitis and its impact on Asthma (ARIA) 2008. Allergy 2008, 63, 8–160. [Google Scholar] [CrossRef]
- Adams, R.I.; Miletto, M.; Taylor, J.W.; Bruns, T.D. The diversity and distribution of fungi on residential surfaces. PLoS ONE 2013, 8, e78866. [Google Scholar] [CrossRef]
- Barberán, A.; Dunn, R.R.; Reich, B.J.; Pacifici, K.; Laber, E.B.; Menninger, H.L.; Morton, J.M.; Henley, J.B.; Leff, J.W.; Miller, S.L.; et al. The ecology of microscopic life in household dust. Proc. R. Soc. B Biol. Sci. 2015, 282, 1139. [Google Scholar] [CrossRef] [PubMed]
- Weikl, F.; Tischer, C.; Probst, A.J.; Heinrich, J.; Markevych, I.; Jochner, S.; Pritsch, K. Fungal and Bacterial Communities in Indoor Dust Follow Different Environmental Determinants. PLoS ONE 2016, 11, e0154131. [Google Scholar] [CrossRef]
- Megaritis, A.; Fountoukis, C.; Charalampidis, P.; Pilinis, C.; Pandis, S.N. Response of fine particulate matter concentrations to changes of emissions and temperature in europe. Atmos. Chem. Phys. 2013, 13, 3423–3443. [Google Scholar] [CrossRef]
- Kapwata, T.; Language, B.; Piketh, S.; Wright, C.Y. Variation of Indoor Particulate Matter Concentrations and Association with Indoor/Outdoor Temperature: A Case Study in Rural Limpopo, South Africa. Atmosphere 2018, 9, 124. [Google Scholar] [CrossRef]
- Zheng, S.; Zhang, J.; Mou, J.; Du, W.; Yu, Y.; Wang, L. The influence of relative humidity and ground material on indoor walking-induced particle resuspension. J. Environ. Sci. Heal. A 2019, 54, 1044–1053. [Google Scholar] [CrossRef] [PubMed]
- Guo, H.; Morawska, L.; He, C.; Gilbert, D. Impact of ventilation scenario on air exchange rates and on indoor particle number concentrations in an air-conditioned classroom. Atmos. Environ. 2008, 42, 757–768. [Google Scholar] [CrossRef]
- Han, Y.; Qi, M.; Chen, Y.; Shen, H.; Liu, J.; Huang, Y.; Chen, H.; Liu, W.X.; Wang, X.L.; Liu, J.F. Influences of ambient air PM2.5 concentration and meteorological condition on the indoor PM2.5 concentrations in a residential apartment in Beijing using a new approach. Environ. Pollut. 2015, 205, 307–314. [Google Scholar] [CrossRef]
- Zhu, C.S.; Cao, J.J.; Shen, Z.X.; Liu, S.X.; Zhang, T.; Zhao, Z.Z.; Xu, H.M.; Zhang, E.K. Indoor and outdoor chemical components of PM2.5 in the rural areas of Northwestern China. Aerosol Air Qual. Res. 2012, 12, 1157–1165. [Google Scholar] [CrossRef]
- Huang, T.; Yu, Y.; Wei, Y.; Wang, H.; Huang, W.; Chen, X. Spatial-seasonal characteristics and critical impact factors of PM2.5 concentration in the Beijing-Tianjin-Hebei urban agglomeration. PLoS ONE 2018, 13, e0201364. [Google Scholar] [CrossRef] [PubMed]
- WHO (World Health Organization). Air Quality Guidelines for Particulate Matter, Ozone, Nitrogen Dioxide and Sulfur Dioxide; WHO: Geneva, Switzerland, 2005; Available online: https://apps.who.int/iris/bitstream/handle/10665/107823/9789289021920-eng.pdf?sequence=1&isAllowed=y (accessed on 15 July 2021).
- Deng, X.J.; Li, F.; Li, Y.H.; Li, J.Y.; Huang, H.Z.; Liu, X.T. Vertical distribution characteristics of PM in the surface layer of Guangzhou. Particuology 2015, 20, 3–9. [Google Scholar] [CrossRef]
- Chen, T.Z.; Liu, Y.C.; Ma, Q.X.; Chu, B.W.; Zhang, P.; Liu, C.G.; Liu, J.; He, H. Significant source of secondary aerosol: Formation from gasoline evaporative emissions in the presence of SO2 and NH3. Atmos. Chem. Phys. 2019, 19, 8063–8081. [Google Scholar] [CrossRef]
- Lim, J.M.; Jeong, J.H.; Lee, J.H.; Moon, J.H.; Chung, Y.S.; Kim, K.H. The analysis of PM2.5 and associated elements and their indoor/outdoor pollution status in an urban area. Indoor Air 2011, 21, 145–155. [Google Scholar] [CrossRef]
- Kong, S.; Lu, B.; Ji, Y.; Zhao, X.; Bai, Z.; Xu, Y.; Liu, Y.; Jiang, H. Risk assessment of heavy metals in road and soil dusts within PM2.5, PM10 and PM100 fractions in Dongying city, Shandong Province. China J. Environ. Monit. 2012, 14, 791–803. [Google Scholar] [CrossRef]
- Hsu, S.I.; Ito, K.; Kendall, M.; Lippmann, M. Factors affecting personal exposure to thoracic and fine particles and their components. J. Expo. Sci. Environ. Epidemiol. 2012, 22, 439–447. [Google Scholar] [CrossRef]
- Hung, P.S.; Shen, H.Y.; Kuo, H.W. Factors affecting the indoor concentrations of PM2.5 and PM10 in a high-rise office building. Epidemiology 2006, 17, S355–S356. [Google Scholar] [CrossRef]
- Wang, J.; Xie, X.; Fang, C.S. Temporal and Spatial Distribution Characteristics of Atmospheric Particulate Matter (PM10 and PM2.5) in Changchun and Analysis of Its Influencing Factors. Atmosphere 2019, 10, 651. [Google Scholar] [CrossRef]
- Kim, K.Y.; Kim, Y.S.; Roh, Y.M.; Lee, C.M.; Kim, C.N. Spatial distribution of particulate matter (PM10 and PM2.5) in Seoul Metropolitan Subway stations. J. Hazard. Mater. 2008, 154, 440–443. [Google Scholar] [CrossRef] [PubMed]
- Cartenì, A.; Cascetta, F.; Campana, S. Underground and ground-level particulate matter concentrations in an Italian metro system. Atmos. Environ. 2015, 101, 328–337. [Google Scholar] [CrossRef]
- Guo, E.; Shen, H.; He, L.; Zhang, J. Investigation of air pollution of Shanghai subway stations in ventilation seasons in terms of PM2.5 and PM10. Toxicol. Ind. Health 2017, 33, 588–600. [Google Scholar] [CrossRef] [PubMed]
- Fung, F.; Hughson, W.G. Health effects of indoor fungal bioaerosol exposure. Appl. Occup. Environ. Hyg. 2003, 18, 535–544. [Google Scholar]
- Morman, S.A.; Plumlee, G.S. The role of airborne mineral dusts in human disease. Aeolian Res. 2013, 9, 203–212. [Google Scholar] [CrossRef]
- Srithawirat, T.; Latif, M.T.; Sulaiman, F.R. Indoor PM10 and its heavy metal composition at a roadside residential environment, Phitsanulok, Thailand. Atmósfera 2016, 29, 311–322. [Google Scholar] [CrossRef]
- Lv, Y.; Wang, H.F.; Wei, S.S.; Zhang, L.; Zhao, Q. The Correlation between Indoor and Outdoor Particulate Matter of Different Building Types in Daqing, China. Procedia Eng. 2017, 205, 360–367. [Google Scholar] [CrossRef]
- Patel, S.; Sankhyan, S.; Boedicker, E.K.; DeCarlo, P.F.; Farmer, D.K.; Goldstein, A.H.; Katz, E.F.; Nazaroff, W.W.; Tian, Y.; Vanhanen, J.; et al. Indoor Particulate Matter during HOMEChem: Concentrations, Size Distributions, and Exposures. Environ. Sci. Technol. 2020, 54, 7107–7116. [Google Scholar] [CrossRef] [PubMed]
- Taner, S.; Pekey, B.; Pekey, H. Fine particulate matter in the indoor air of barbeque restaurants: Elemental compositions, sources and health risks. Sci. Total Environ. 2013, 454, 79–87. [Google Scholar] [CrossRef] [PubMed]
- Abdel-Salam, M.M.M. Indoor particulate matter in urban residences of Alexandria, Egypt. J. Air Waste Manag. Assoc. 2013, 63, 956–962. [Google Scholar] [CrossRef] [PubMed]
- Koivisto, A.J.; Kling, K.I.; Hanninen, O.; Jayjock, M.; Londahl, J.; Wierzbicka, A.; Fonseca, A.S.; Uhrbrand, K.; Boor, B.E.; Jimenez, A.S.; et al. Source specific exposure and risk assessment for indoor aerosols. Sci. Total Environ. 2019, 668, 13–24. [Google Scholar] [CrossRef]
- Thompson, J.E. Airborne Particulate Matter: Human Exposure and Health Effects. J. Occup. Environ. Med. 2018, 60, 392–423. [Google Scholar] [CrossRef] [PubMed]
- Hodas, N.; Loh, M.; Shin, H.M.; Li, D.; Bennett, D.; McKone, T.E.; Jolliet, O.; Weschler, C.J.; Jantunen, M.; Lioy, P.; et al. Indoor inhalation intake fractions of fine particulate matter: Review of influencing factors. Indoor Air 2016, 26, 836–856. [Google Scholar] [CrossRef]
- Madureira, J.; Slezakova, K.; Silva, A.I.; Lage, B.; Mendes, A.; Aguiar, L.; Pereira, M.C.; Teixeira, J.P.; Costa, C. Assessment of indoor air exposure at residential homes: Inhalation dose and lung deposition of PM10, PM2.5 and ultrafine particles among newborn children and their mothers. Sci. Total Environ. 2020, 717, 137293. [Google Scholar] [CrossRef]
- Rasmussen, P.E.; Levesque, C.; Chénier, M.; Gardner, H.D. Contribution of metals in resuspended dust to indoor and personal inhalation exposures: Relationships between PM10 and settled dust. Build. Environ. 2018, 143, 513–522. [Google Scholar] [CrossRef]
- Brown, J.S.; Gordon, T.; Price, O.; Asgharian, B. Thoracic and respirable particle definitions for human health risk assessment. Part. Fibre Toxicol. 2013, 10, 12. [Google Scholar] [CrossRef]
- Kastury, F.; Smith, E.; Juhasz, A.L. A critical review of approaches and limitations of inhalation bioavailability and bioaccessibility of metal(loid)s from ambient particulate matter or dust. Sci. Total Environ. 2017, 574, 1054–1074. [Google Scholar] [CrossRef]
- USEPA (United States Environmental Protection Agency EPA). Exposure and Human Health Evaluation of Airborne Pollution from the World Trade Center Disaster; USEPA: Washington, DC, USA, 2002. [Google Scholar]
- Almeida-Silva, M.; Pilou, M.; Housiadas, C.; Almeida, S.M. Internal dose of particles in the elderly—Modeling based on aerosol measurements. Environ. Sci. Pollut. Res. 2018, 25, 23645–23656. [Google Scholar] [CrossRef] [PubMed]
- Segalin, B.; Kumar, P.; Micadei, K.; Fornaro, A.; Gonçalves, F.L.T. Size–segregated particulate matter inside residences of elderly in the Metropolitan Area of São Paulo, Brazil. Atmos. Environ. 2017, 148, 139–151. [Google Scholar] [CrossRef]
- Blais-Lecours, P.; Perrott, P.; Duchaine, C. Non-culturable bioaerosols in indoor settings: Impact on health and molecular approaches for detection. Atmos. Environ. 2015, 110, 45–53. [Google Scholar] [CrossRef]
- Kim, K.E.; Cho, D.; Park, H.J. Air pollution and skin diseases: Adverse effects of airborne particulate matter on various skin diseases. Life Sci. 2016, 152, 126–134. [Google Scholar] [CrossRef] [PubMed]
- Wu, C.C.; Bao, L.J.; Tao, S.; Zeng, E.Y. Dermal Uptake from Airborne Organics as an Important Route of Human Exposure to E-Waste Combustion Fumes. Environ. Sci. Technol. 2016, 50, 6599–6605. [Google Scholar] [CrossRef]
- Garrido, J.A.; Parthasarathy, S.; Moschet, C.; Young, T.M.; McKone, T.E.; Bennett, D.H. Exposure Assessment for Air-To-Skin Uptake of Semivolatile Organic Compounds (SVOCs) Indoors. Environ. Sci. Technol. 2019, 53, 1608–1616. [Google Scholar] [CrossRef] [PubMed]
- Williams, R.L.; Aston, L.S.; Krieger, R.I. Perspiration increased human pesticide absorption following surface contact during an indoor scripted activity program. J. Expo. Sci. Environ. Epidemiol. 2004, 14, 129–136. [Google Scholar] [CrossRef] [PubMed]
- Sánchez-Pérez, Y.; Chirino, Y.I.; Osornio-Vargas, A.R.; Herrera, L.A.; Morales-Bárcenas, R.; López-Saavedra, A.; González-Ramírez, I.; Miranda, J.; García-Cuellar, C.M. Cytoplasmic p21CIP1/WAF1, ERK1/2 activation, and cytoskeletal remodeling are associated with the senescence-like phenotype after airborne particulate matter (PM10) exposure in lung cells. Toxicol. Lett. 2014, 225, 12–19. [Google Scholar] [CrossRef]
- Lademann, J.; Schaefer, H.; Otberg, N.; Teichmann, A.; Blume-Peytavi, U.; Sterry, W. Penetration of microparticles into human skin. Hautarzt 2004, 55, 1117–1119. [Google Scholar] [CrossRef]
- Wilson, R.; Jones-Otazo, H.; Petrovic, S.; Mitchell, I.; Bonvalot, Y.; Williams, D.; Richardson, G.M. Revisiting Dust and Soil Ingestion Rates Based on Hand-to-Mouth Transfer. Hum. Ecol. Risk Assess. Int. J. 2013, 19, 158–188. [Google Scholar] [CrossRef]
- De Brouwere, K.; Buekers, J.; Cornelis, C.; Schlekat, C.E.; Oller, A.R. Assessment of indirect human exposure to environmental sources of nickel: Oral exposure and risk characterization for systemic effects. Sci. Total Environ. 2012, 419, 25–36. [Google Scholar] [CrossRef]
- Beamish, L.A.; Osornio-Vargas, A.R.; Wine, E. Air pollution: An environmental factor contributing to intestinal disease. J. Crohn’s Colitis 2011, 5, 279–286. [Google Scholar] [CrossRef] [PubMed]
- Fan, X.; Wang, Z.; Li, Y.; Wang, H.; Fan, W.; Dong, Z. Estimating the dietary exposure and risk of persistent organic pollutants in China: A national analysis. Environ. Pollut. 2021, 288, 117764. [Google Scholar] [CrossRef] [PubMed]
- Dong, Z.; Fan, X.; Li, Y.; Wang, Z.; Chen, L.; Wang, Y.; Zhao, X.; Fan, W.; Wu, F. A Web-Based Database on Exposure to Persistent Organic Pollutants in China. Environ. Health Perspect. 2021, 129, 057701. [Google Scholar] [CrossRef] [PubMed]
- Wang, W.; Abualnaja, K.O.; Asimakopoulos, A.G.; Covaci, A.; Gevao, B.; Johnson-Restrepo, B.; Kumosani, T.A.; Malarvannan, G.; Minh, T.B.; Moon, H.B.; et al. A comparative assessment of human exposure to tetrabromobisphenol A and eight bisphenols including bisphenol A via indoor dust ingestion in twelve countries. Environ. Int. 2015, 83, 183–191. [Google Scholar] [CrossRef]
- Xu, H.M.; Guinot, B.; Cao, J.J.; Li, Y.Q.; Niu, X.Y.; Ho, K.F.; Shen, Z.X.; Liu, S.X.; Zhang, T.; Lei, Y.L.; et al. Source, health risk and composition impact of outdoor very fine particles (VFPs) to school indoor environment in Xi’an, Northwestern China. Sci. Total Environ. 2018, 612, 238–246. [Google Scholar] [CrossRef]
- Avigo, D.; Godoi, A.F.L.; Janissek, P.R.; Makarovska, Y.; Krata, A.; Potgieter-Vermaak, S.; Alfoldy, B.; Van Grieken, R.; Godoi, R.H.M. Particulate matter analysis at elementary schools in Curitiba, Brazil. Anal. Bioanal. Chem. 2008, 391, 1459–1468. [Google Scholar] [CrossRef]
- Ali, M.Y.M.; Hanafiah, M.M.; Latif, M.T. Composition and Distribution of Particulate Matter (PM10) in a Mechanically Ventilated University Building. AIP Conf. Proc. 2016, 1784, 060017. [Google Scholar]
- Sysoltseva, M.; Winterhalter, R.; Wolf, J.; Berlin, K.; Eckert, S.; Fembacher, L.; Matzen, W.; Nitschke, L.; Scheu, C.; Fromme, H. Particulate matter in air at indoor go-kart facilities in Bavaria, Germany. Atmos. Environ. 2018, 193, 118–126. [Google Scholar] [CrossRef]
- Horemans, B.; Worobiec, A.; Buczynska, A.; Van Meel, K.; Van Grieken, R. Airborne particulate matter and BTEX in office environments. J. Environ. Monit. 2008, 10, 867–876. [Google Scholar] [CrossRef]
- Huang, R.J.; Duan, J.; Li, Y.J.; Chen, Q.; Chen, Y.; Tang, M.J.; Yang, L.; Ni, H.Y.; Lin, C.S.; Xu, W.; et al. Effects of NH3 and alkaline metals on the formation of particulate sulfate and nitrate in wintertime Beijing. Sci. Total Environ. 2020, 717, 137190. [Google Scholar] [CrossRef] [PubMed]
- Buczynska, A.J.; Krata, A.; Van Grieken, R.; Brown, A.; Polezer, G.; De Wael, K.; Potgieter-Vermaak, S. Composition of PM2.5 and PM1 on high and low pollution event days and its relation to indoor air quality in a home for the elderly. Sci. Total Environ. 2014, 490, 134–143. [Google Scholar] [CrossRef] [PubMed]
- Frasca, D.; Marcoccia, M.; Tofful, L.; Simonetti, G.; Perrino, C.; Canepari, S. Influence of advanced wood-fired appliances for residential heating on indoor air quality. Chemosphere 2018, 211, 62–71. [Google Scholar] [CrossRef] [PubMed]
- Salameh, D.; Detournay, A.; Pey, J.; Perez, N.; Liguori, F.; Saraga, D.; Bove, M.C.; Brotto, P.; Cassola, F.; Massabo, D.; et al. PM2.5 chemical composition in five European Mediterranean cities: A 1-year study. Atmos. Res. 2015, 155, 102–117. [Google Scholar] [CrossRef]
- Saraga, D.; Maggos, T.; Sadoun, E.; Fthenou, E.; Hassan, H.; Tsiouri, V.; Karavoltsos, S.; Sakellari, A.; Vasilakos, C.; Kakosimos, K. Chemical Characterization of Indoor and Outdoor Particulate Matter (PM2.5, PM10) in Doha, Qatar. Aerosol Air Qual. Res. 2017, 17, 1156–1168. [Google Scholar] [CrossRef]
- Biester, H.; Hermanns, Y.M.; Cortizas, A.M. The influence of organic matter decay on the distribution of major and trace elements in ombrotrophic mires-a case study from the Harz Mountains. Geochim. Cosmochim. Acta 2012, 84, 126–136. [Google Scholar] [CrossRef]
- Wang, X.H.; Bi, X.H.; Sheng, G.Y.; Fu, J.M. Chemical Composition and Sources of PM10 and PM2.5 Aerosols in Guangzhou, China. Environ. Monit. Assess. 2006, 119, 425–439. [Google Scholar] [CrossRef]
- Cheng, Z.L.; Lam, K.S.; Chan, L.Y.; Wang, T.; Cheng, K.K. Chemical characteristics of aerosols at coastal station in Hong Kong. I. Seasonal variation of major ions, halogens and mineral dusts between 1995 and 1996. Atmos. Environ. 2000, 34, 2771–2783. [Google Scholar] [CrossRef]
- Mahfouz, M.M.; Yigiterhan, O.; Elnaiem, A.E.; Hassan, H.M.; Alfoldy, B. Elemental compositions of particulate matter retained on air condition unit’s filters at Greater Doha, Qatar. Environ. Geochem. Health 2019, 41, 2533–2548. [Google Scholar] [CrossRef]
- Monsalve, S.M.; Martinez, L.; Vasquez, K.Y.; Orellana, S.A.; Vergara, J.K.; Mateo, M.M.; Salazar, R.C.; Alburquenque, M.F.; Lillo, D.D.C. Trace element contents in fine particulate matter (PM2.5) in urban school microenvironments near a contaminated beach with mine tailings, Chaaral, Chile. Environ. Geochem. Health 2018, 40, 1077–1091. [Google Scholar] [CrossRef] [PubMed]
- Rogula-Kopiec, P.; Pastuszka, J.; Mathews, B.; Widziewicz, K. Factors determining the concentration and chemical composition of particulate matter in the air of selected service facilities. E3S Web Conf. 2018, 28, 01032. [Google Scholar] [CrossRef]
- Ali, M.Y.; Hanafiah, M.M.; Khan, M.F.; Latif, M.T. Quantitative source apportionment and human toxicity of indoor trace metals at university buildings. Build. Environ. 2017, 121, 238–246. [Google Scholar] [CrossRef]
- Alves, C.A.; Vicente, E.D.; Evtyugina, M.; Vicente, A.M.; Nunes, T.; Lucarelli, F.; Calzolai, G.; Nava, S.; Calvo, A.I.; Alegre, C.D.; et al. Indoor and outdoor air quality: A university cafeteria as a case study. Atmos. Pollut. Res. 2020, 11, 531–544. [Google Scholar] [CrossRef]
- Zhang, Q.; Shen, Z.X.; Cao, J.J.; Ho, K.F.; Zhang, R.J.; Bie, Z.J.; Chang, H.R.; Liu, S.X. Chemical profiles of urban fugitive dust over Xi’an in the south margin of the Loess Plateau. China Atmos. Pollut. Res. 2014, 5, 421–430. [Google Scholar] [CrossRef]
- Choppala, G.; Bolan, N.; Kunhikrishnan, A.; Skinner, W.; Seshadri, B. Concomitant reduction and immobilization of chromium in relation to its bioavailability in soils. Environ. Sci. Pollut. Res. 2015, 22, 8969–8978. [Google Scholar] [CrossRef]
- Yadav, S.; Rajamani, V. Air quality and trace metal chemistry of different size fractions of aerosols in N-NW India-implications for source diversity. Atmos. Environ. 2006, 40, 698–712. [Google Scholar] [CrossRef]
- Lowther, S.D.; Jones, K.C.; Wang, X.M.; Whyatt, J.D.; Wild, O.; Booker, D. Particulate Matter Measurement Indoors: A Review of Metrics, Sensors, Needs, and Applications. Environ. Sci. Technol. 2019, 53, 11644–11656. [Google Scholar] [CrossRef]
- Sakellaris, I.; Saraga, D.; Mandin, C.; de Kluizenaar, Y.; Fossati, S.; Spinazzè, A.; Cattaneo, A.; Szigeti, T.; Mihucz, V.; de Oliveira Fernandes, E.; et al. Personal Control of the Indoor Environment in Offices: Relations with Building Characteristics, Influence on Occupant Perception and Reported Symptoms Related to the Building—The Officair Project. Appl. Sci. 2019, 9, 3227. [Google Scholar] [CrossRef]
- Abdel-Salam, M.M.M. Indoor PM in Different Residential Areas of Alexandria City, Egypt. Indoor Built Environ. 2012, 21, 857–862. [Google Scholar] [CrossRef]
- Brauer, M.; Freedman, G.; Frostad, J.; van Donkelaar, A.; Martin, R.V.; Dentener, F.; van Dingenen, R.; Estep, K.; Amini, H.; Apte, J.S.; et al. Exposure assessment for estimation of the global burden of disease attributable to outdoor air pollution. Environ. Sci. Technol. 2012, 45, 652–660. [Google Scholar] [CrossRef]
- Chen, R.J.; Zhao, A.; Chen, H.L.; Zhao, Z.H.; Cai, J.; Wang, C.C.; Yang, C.Y.; Li, H.C.; Xu, X.H.; Ha, S.D.; et al. Cardiopulmonary Benefits of Reducing Indoor Particles of Outdoor Origin: A Randomized, Double-Blind Crossover Trial of Air Purifiers. J. Am. Coll. Cardiol. 2015, 65, 2279–2287. [Google Scholar] [CrossRef]
- Salimifard, P.; Rim, D.; Gomes, C.; Kremer, P.; Freihaut, J.D. Resuspension of Biological Particles from Indoor Surfaces: Effects of Humidity and Air Swirl. Sci. Total Environ. 2017, 583, 241–247. [Google Scholar] [CrossRef]
- Dadvand, P.; Parker, J.; Bell, M.L.; Bonzini, M.; Brauer, M.; Darrow, L.A.; Gehring, U.; Glinianaia, S.V.; Gouveia, N.; Ha, E.H.; et al. Maternal exposure to particulate air pollution and term birth weight: A multi-country evaluation of effect and heterogeneity. Environ. Health Persp. 2013, 121, 267–373. [Google Scholar] [CrossRef]
- Neuberger, M.; Moshammer, H.; Rabczenko, D. Acute and Subacute Effects of Urban Air Pollution on Cardiopulmonary Emergencies and Mortality: Time Series Studies in Austrian Cities. Int. J. Environ. Res. Public Health 2013, 10, 4728–4751. [Google Scholar] [CrossRef]
- Yorifuji, T.; Kashima, S.; Doi, H. Associations of acute exposure to fine and coarse particulate matter and mortality among older people in Tokyo, Japan. Sci. Total Environ. 2016, 542, 354–359. [Google Scholar] [CrossRef]
- COMEAP (The Committee on the Medical Effects of Air Pollutants). Long-Term Exposure to Air Pollution: Effect on Mortality; COMEAP: Oxfordshire, UK, 2009. [Google Scholar]
- Health Matters: Air Pollution. 2018. Available online: https://elkssl0654429fdf150efe5e4fdae07ab4ffa3lib.v.ntu.edu.cn:4443/government/publications/health-matters-air-pollution/health-matters-air-pollution (accessed on 8 April 2020).
- Samoli, E.; Stafoggia, M.; Rodopoulou, S.; Ostro, B.; Declercq, C.; Alessandrini, E.; Díaz, J.; Karanasiou, A.; Kelessis, A.G.; Tertre, A.L.; et al. Associations between fine and coarse particles and mortality in Mediterranean cities: Results from the MED-PARTICLES project. Environ. Health Perspect. 2013, 121, 932–938. [Google Scholar] [CrossRef] [PubMed]
- Garcia, E.; Rice, M.B.; Gold, D.R. Air pollution and lung function in children. J. Allergy Clin. Immun. 2021, 148, 1–14. [Google Scholar] [CrossRef] [PubMed]
- Kumar, P.; Morawska, L.; Birmili, W.; Paasonen, P.; Hu, M.; Kulmala, M.; Harrison, R.M.; Norford, L.; Britter, R. Ultra-fine particles in cities. Environ. Int. 2014, 66, 1–10. [Google Scholar] [CrossRef]
- Xu, H.M.; Guinot, B.; Niu, X.Y.; Cao, J.J.; Ho, K.F.; Zhao, Z.H.; Ho, S.S.H.; Liu, S.X. Concentrations, particle-size distributions, and indoor/outdoor differences of polycyclic aromatic hydrocarbons (PAHs) in a middle school classroom in Xi’an, China. Environ. Geochem. Health 2015, 37, 861–873. [Google Scholar] [CrossRef] [PubMed]
- Slezakova, K.; Castro, D.; Pereira, M.C.; Morais, S.; Delerue-Matos, C.; Alvim-Ferraz, M.C. Influence of Tobacco Smoke on Carcinogenic PAH Composition in Indoor PM10 and PM2.5. Atmos. Environ. 2009, 43, 6376–6382. [Google Scholar] [CrossRef]
- Da Silva, C.S.; Rossato, J.M.; Vaz Rocha, J.A.; Vargas, V.M.F. Characterization of an area of reference for inhalable particulate matter (PM2.5) associated with genetic biomonitoring in children. Mutat. Res. Genet. Toxicol. Environ. Mutagenesis 2015, 778, 44–55. [Google Scholar] [CrossRef]
- Yousef, A.O.S.; Fahad, A.A.; Moneim, A.E.A.; Metwally, D.M.; El-khadragy, M.F.; Kassab, R.B. The Neuroprotective Role of Coenzyme Q10 Against Lead Acetate-Induced Neurotoxicity Is Mediated by Antioxidant, Anti-Inflammatory and Anti-Apoptotic Activities. Int. J. Environ. Res. Public Health 2019, 16, 2895. [Google Scholar] [CrossRef] [PubMed]
- Rundell, K.W.; Hoffman, J.R.; Caviston, R.; Bulbulian, R.; Hollenbach, A.M. Inhalation of ultrafine and fine particulate matter disrupts systemic vascular function. Inhal. Toxicol. 2007, 19, 133–140. [Google Scholar] [CrossRef]
- Dacunto, P.J.; Cheng, K.C.; Acevedo-Bolton, V.; Jiang, R.T.; Klepeis, N.E.; Repace, J.L.; Ott, W.R.; Hildemann, L.M. Identifying and quantifying secondhand smoke in source and receptorrooms: Logistic regression and chemical mass balance approaches. Indoor Air 2014, 24, 59–70. [Google Scholar] [CrossRef]
- Quezada-Maldonado, E.M.; Sánchez-Pérez, Y.; Chirino, Y.I.; García-Cuellar, C.M. Airborne particulate matter induces oxidative damage, DNA adduct formation and alterations in DNA repair pathways. Environ. Pollut. 2021, 287, 117313. [Google Scholar] [CrossRef] [PubMed]
- Gollmer, C.; Hofer, I.; Kaltschmitt, M. Additives as a fuel-oriented measure to mitigate inorganic particulate matter (PM) emissions during small-scale combustion of solid biofuels. Biomass Convers. Biorefinery 2019, 9, 3–20. [Google Scholar] [CrossRef]
- Gemenetzis, P.; Moussas, P.; Arditsoglou, A.; Samara, C. Mass concentration and elemental composition of indoor PM2.5 and PM10 in university rooms in Thessaloniki, northern Greece. Atmos. Environ. 2006, 40, 3195–3206. [Google Scholar] [CrossRef]
- Wolfle, U.; Esser, P.R.; Simon-Haarhaus, B.; Martin, S.F.; Lademann, J.; Schempp, C.M. UVB-induced DNA damage, generation of reactive oxygen species, and inflammation are effectively attenuated by the flavonoid luteolin in vitro and in vivo. Free Radic. Biol. Med. 2011, 50, 1081–1093. [Google Scholar] [CrossRef]
- Nanayakkara, G.K.; Wang, H.; Yang, X.F. Proton leak regulates mitochondrial reactive oxygen species generation in endothelial cell activation and inflammation—A novel concept. Arch. Biochem. Biophys. 2019, 662, 68–74. [Google Scholar] [CrossRef]
- Peng, J.J.; Zhang, L.L.; Meng, Q.Q.; Zhang, F.; Mao, X.N.; Liu, J.M.; Chen, Y.H.; Zou, H.F.; Shi, B.Y.; Wu, R.J.; et al. Adverse impact of ambient PM2.5 on expression and trafficking of surfactant protein A through reactive oxygen species damage to lamellar bodies. Toxicol. Lett. 2019, 315, 47–54. [Google Scholar] [CrossRef]
- Gilli, G.; Traversi, D.; Rovere, R.; Pignata, C.; Schiliro, T. Chemical characteristics and mutagenic activity of PM10 in Torino, a Northern Italian City. Sci. Total Environ. 2007, 385, 97–107. [Google Scholar] [CrossRef] [PubMed]
- Magnani, N.D.; Marchini, T.; Garces, M.; Mebert, A.; Caceres, L.; Diaz, L.; Desimone, M.; Evelson, P.A. Role of transition metals present in air particulate matter on lung oxygen metabolism. Int. J. Biochem. Cell B 2016, 81, 419–426. [Google Scholar] [CrossRef]
- Suh, H.H.; Zanobetti, A.; Schwartz, J.; Coull, B.A. Chemical Properties of Air Pollutants and Cause-Specific Hospital Admissions among the Elderly in Atlanta, Georgia. Environ. Health Persp. 2011, 119, 1421–1428. [Google Scholar] [CrossRef] [PubMed]
- Bell, M.L.; Ebisu, K.; Peng, R.D.; Samet, J.M.; Dominici, F. Hospital Admissions and Chemical Composition of Fine Particle Air Pollution. Am. J. Respir. Crit. Care Med. 2009, 179, 1115–1120. [Google Scholar] [CrossRef] [PubMed]
- Lipfert, F.W.; Baty, J.D.; Miller, J.P.; Wyzga, R.E. PM2.5 constituents and related air quality variables as predictors of survival in a cohort of U.S. military veterans. Inhal. Toxicol. 2006, 18, 645–657. [Google Scholar] [CrossRef]
- Ho, C.C.; Chen, Y.C.; Yet, S.F.; Weng, C.Y.; Tsai, H.T.; Hsu, J.F.; Lin, P.P. Identification of ambient fine PM components related to vascular dysfunction by analyzing spatiotemporal variations. Sci. Total Environ. 2020, 719, 137243. [Google Scholar] [CrossRef]
- Ostro, B.D. Associations between morbidity and alternative measures of particulate matter. Risk Anal. 1990, 10, 421–427. [Google Scholar] [CrossRef]
- Rich, D.Q.; Zhang, W.J.; Lin, S.; Squizzato, S.; Thurston, S.W.; van Wijngaarden, E.; Croft, D.; Masiol, M.; Hopke, P.K. Triggering of cardiovascular hospital admissions by source specific fine particle concentrations in urban centers of New York State. Environ. Int. 2019, 126, 387–394. [Google Scholar] [CrossRef] [PubMed]
- Wang, Y.C.; Lin, Y.K. Mortality and emergency room visits associated with ambient PM constituents in metropolitan Taipei. Sci. Total Environ. 2016, 569, 1427–1434. [Google Scholar] [CrossRef] [PubMed]
- Ostro, B.; Feng, W.Y.; Broadwin, R.; Green, S.; Lipsett, M. The effects of components of fine particulate air pollution on mortality in California: Results from CALFINE. Environ. Health Persp. 2007, 115, 13–19. [Google Scholar] [CrossRef]
- Fine, P.M.; Sioutas, C.; Solomon, P.A. Secondary particulate matter in the United States: Insights from the particulate matter supersites program and related studies. J. Air Waste Manag. Assoc. 2008, 58, 234–253. [Google Scholar] [CrossRef]
- Goodsell, D.S. The Molecular Perspective: Polycyclic Aromatic Hydrocarbons. Stem Cells 2004, 22, 873–874. [Google Scholar] [CrossRef]
- Nguyen, T.N.T.; Kwon, H.O.; Lammel, G.; Jung, K.S.; Lee, S.J.; Choi, S.D. Spatially high-resolved monitoring and risk assessment of polycyclic aromatic hydrocarbons in an industrial city. J. Hazard. Mater. 2020, 393, 122409. [Google Scholar] [CrossRef]
- Li, J.; Fan, H.Z.; Liu, K.P.; Li, X.Y.; Fan, D.P.; Lu, X.C.; Xia, Y.; Cao, Y.; Xiao, C. Associations of urinary polycyclic aromatic hydrocarbons with albuminuria in US adults, NHANES 2003–2014. Ecotoxicol. Environ. Safe 2020, 195, 110445. [Google Scholar] [CrossRef] [PubMed]
- Ye, X.Q.; Pan, W.Y.; Li, C.M.; Ma, X.C.; Yin, S.S.; Zhou, J.H.; Liu, J. Exposure to polycyclic aromatic hydrocarbons and risk for premature ovarian failure and reproductive hormones imbalance. J. Environ. Sci. 2020, 91, 1–9. [Google Scholar] [CrossRef]
- Hien, V.T.D.; Lin, C.; Thanh, V.C.; Oanh, N.T.K.; Thanh, B.X.; Weng, C.E.; Yuan, C.S.; Rene, E.R. An overview of the development of vertical sampling technologies for ambient volatile organic compounds (VOCs). J. Environ. Manag. 2019, 247, 401–412. [Google Scholar] [CrossRef] [PubMed]
- Guo, H.; Lee, S.C.; Chan, L.Y.; Li, W.M. Risk assessment of exposure to volatile organic compounds in different indoor environments. Environ. Res. 2004, 94, 57–66. [Google Scholar] [CrossRef]
- Ramadan, A.; Yassin, M.F.; Alshammari, B.Z. Health risk assessment associated with volatile organic compounds in a parking garage. Int. J. Environ. Sci. Technol. 2019, 16, 2549–2564. [Google Scholar] [CrossRef]
- Wolkoff, P. Indoor air pollutants in office environments: Assessment of comfort, health, and performance. Int. J. Hyg. Environ. Health 2013, 216, 371–394. [Google Scholar] [CrossRef] [PubMed]
- Feng, S.; Gao, D.; Liao, F.; Zhou, F.R.; Wang, X.M. The health effects of ambient PM2.5 and potential mechanisms. Ecotoxicol. Environ. Safe. 2016, 128, 67–74. [Google Scholar] [CrossRef]
- Widziewicz, K.; Loska, K. Metal induced inhalation exposure in urban population: A probabilistic approach. Atmos. Environ. 2016, 128, 198–207. [Google Scholar] [CrossRef]
- . Hadnagy, W.; Stiller-Winkler, R.; Kainka, E.; Ranft, U.; Idel, H. Influence of urban particulate air pollution (PM10; PM2.5) on the immune system of children. J. Aerosol Sci. 1998, 29, S997–S998. [Google Scholar] [CrossRef]
- DeFranco, E.; Moravec, W.; Xu, F.; Hall, E.; Hossain, M.; Haynes, E.N.; Muglia, L.; Chen, A. Exposure to airborne particulate matter during pregnancy is associated with preterm birth: A population-based cohort study. Environ. Health 2016, 15, 6. [Google Scholar] [CrossRef] [PubMed]
- Tanner, J.P.; Salemi, J.L.; Stuart, A.L.; Yu, H.; Jordan, M.M.; DuClos, C.; Cavicchia, P.; Correia, J.A.; Watkins, S.M.; Kirby, R.S. Associations between exposure to ambient benzene and PM2.5 during pregnancy and the risk of selected birth defects in offspring. Environ. Res. 2015, 142, 345–353. [Google Scholar] [CrossRef]
- Siddika, N.; Balogun, H.A.; Amegah, A.K.; Jaakkola, J.J. Prenatal ambient air pollution exposure and the risk of stillbirth: Systematic review and meta-analysis of the empirical evidence. Occup. Environ. Med. 2016, 73, 573–581. [Google Scholar] [CrossRef] [PubMed]
- Jedrychowski, W.A.; Perera, F.P.; Spengler, J.D.; Mroz, E.; Stigter, L.; Flak, E.; Majewska, R.; Klimaszewska-Rembiasz, M.; Jacek, R. Intrauterine exposure to fine particulate matter as a risk factor for increased susceptibility to acute broncho-pulmonary infections in early childhood. Int. J. Hyg. Environ. Health 2013, 216, 395–401. [Google Scholar] [CrossRef]
- Burtscher, H.; Schuepp, K. The occurrence of ultrafine particles in the specific environment of children. Paediatr. Respir. Rev. 2012, 13, 89–94. [Google Scholar] [CrossRef]
- Mendell, M.J. Indoor residential chemical emissions as risk factors for-respiratory and allergic effects in children: A review. Indoor Air 2007, 17, 259–277. [Google Scholar] [CrossRef]
- Bornehag, C.G.; Sundell, J.; Weschler, C.J.; Sigsgaard, T.; Lundgren, B.; Hasselgren, M.; Hagerhed-Engman, L. The association between asthma and allergic symptoms in children and phthalates in house dust: A nested case-control study. Environ. Health Persp. 2004, 112, 1393–1397. [Google Scholar] [CrossRef]
- Mousavi, S.E.; Heydarpour, P.; Reis, J.; Amiri, M.; Sahraian, M.A. Multiple sclerosis and air pollution exposure: Mechanisms toward brain autoimmunity. Med. Hypotheses 2017, 100, 23–30. [Google Scholar] [CrossRef]
- Chapman, R.S.; Watkinson, W.P.; Dreher, K.L.; Costa, D.L. Ambient particulate matter and respiratory and cardiovascular illness in adults: Particle-borne transition metals and the heart-lung axis. Environ. Toxicol. Phar. 1997, 4, 331–338. [Google Scholar] [CrossRef]
- Chang, L.T.; Tang, C.S.; Pan, Y.Z.; Chan, C.C. Association of heart rate variability of the elderly with personal exposure to PM1, PM1–2.5, and PM2.5–10. Bull. Environ. Contam. Toxicol. 2007, 79, 552–556. [Google Scholar] [CrossRef] [PubMed]
- Chen, C.H.; Wu, C.D.; Chiang, H.C.; Chu, D.C.; Lee, K.Y.; Lin, W.Y.; Yeh, J.I.; Tsai, K.W.; Guo, Y.L.L. The effects of fine and coarse PM on lung function among the elderly. Sci. Rep. 2019, 9, 14790. [Google Scholar] [CrossRef] [PubMed]
- Prada, D.; Lopez, G.; Solleiro-Villavicencio, H.; Garcia-Cuellar, C.; Baccarelli, A.A. Molecular and cellular mechanisms linking air pollution and bone damage. Environ. Res. 2020, 185, 109465. [Google Scholar] [CrossRef]
- Calderon-Garciduenas, L.; Serrano-Sierra, A.; Torres-Jardón, R.; Zhu, H.; Yuan, Y.; Smith, D.; Delgado-Chavez, R.; Cross, J.V.; Medina-Cortina, H.; Kavanaugh, M.; et al. The impact of environmental metals in young urbanites’ brains. Exp. Toxicol. Pathol. 2013, 65, 503–511. [Google Scholar] [CrossRef]
- Pohl, H.R.; Roney, N.; Abadin, H.G. Metal ions affecting the neurological system. Met. Ions Life Sci. 2011, 8, 247–262. [Google Scholar]
- Li, Y.C.; Shu, M.; Ho, S.S.H.; Wang, C.; Cao, J.J.; Wang, G.H.; Wang, X.X.; Wang, K.; Zhao, X.Q. Characteristics of PM2.5 emitted from different cooking activities in China. Atmos. Res. 2015, 166, 83–91. [Google Scholar] [CrossRef]
- Wan, M.P.; Wu, C.L.; Szeto, G.N.; Chan, T.C.; Chao, C.Y.H. Ultrafine particles, and PM2.5 generated from cooking in homes. Atmos. Environ. 2011, 45, 6141–6148. [Google Scholar] [CrossRef]
- Wong, T.W.; Wong, A.H.S.; Lee, F.S.C.; Qiu, H. Respiratory health and lung function in Chinese restaurant kitchen workers. Occup. Environ. Med. 2011, 68, 746–752. [Google Scholar] [CrossRef]
- Cheng, J.H.; Lee, Y.S.; Chen, K.S. Carbonyl compounds in dining areas, kitchens and exhaust streams in restaurants with varying cooking methods in Kaohsiung, Taiwan. J. Environ. Sci. 2016, 41, 218–226. [Google Scholar] [CrossRef] [PubMed]
- See, S.W.; Balasubramanian, R. Risk assessment of exposure to indoor aerosols associated with Chinese cooking. Environ. Res. 2006, 102, 197–204. [Google Scholar] [CrossRef]
- Pan, C.H.; Chan, C.C.; Wu, K.Y. Effects on Chinese Restaurant Workers of Exposure to Cooking Oil Fumes: A Cautionary Note on Urinary 8-Hydroxy-2-Deoxyguanosine. Cancer Epidemiol. Prev. Biomark. 2008, 17, 3351–3357. [Google Scholar] [CrossRef]
- Bigert, C.; Lonn, M.; Feychting, M.; Sjogren, B.; Lewne, M.; Gustavsson, P. Incidence of myocardial infarction among cooks and other restaurant workers in Sweden 1987–2005. Scand. J. Work. Environ. Health 2013, 39, 204–211. [Google Scholar] [CrossRef]
- Zimmer, A.T.; Baron, P.A.; Biswas, P. The influence of operating parameters on number-weighted aerosol size distribution generated from a gas metal arc welding process. J. Aerosol Sci. 2002, 33, 519–531. [Google Scholar] [CrossRef]
- Racette, B.A.; McGee-Minnich, L.; Moerlein, S.M.; Mink, J.W.; Videen, T.O.; Perlmutter, J.S. Welding-related parkinsonism. Clinical features, treatment, and pathophysiology. Neurology 2001, 56, 8–13. [Google Scholar] [CrossRef]
- Sears, C.G.; Sears, L.; Zierold, K.M. Sex differences in the association between exposure to indoor particulate matter and cognitive control among children (age 6–14 years) living near coal-fired power plants. Neurotoxicol. Teratol. 2020, 78, 106855. [Google Scholar] [CrossRef]
- Gregory, A.C.; Shendell, D.G.; Okosun, I.S.; Gieseker, K.E. Multiple Sclerosis disease distribution and potential impact of environmental air pollutants in Georgia. Sci. Total Environ. 2008, 396, 42–51. [Google Scholar] [CrossRef] [PubMed]
- Tsai, D.H.; Lin, J.S.; Chan, C.C. Office Workers’ Sick Building Syndrome and Indoor Carbon Dioxide Concentrations. J. Occup. Environ. Hyg. 2012, 9, 345–351. [Google Scholar] [CrossRef] [PubMed]
- Naseri, M.; Jouzizadeh, M.; Tabesh, M.; Malekipirbazari, M.; Gabdrashova, R.; Nurzhan, S.; Farrokhi, H.; Khanbabaie, R.; Mehri-Dehnavi, H.; Bekezhankyzy, Z.; et al. The impact of frying aerosol on human brain activity. Neurotoxicology 2019, 74, 149–161. [Google Scholar] [CrossRef]
- Weichenthal, S.; Villeneuve, P.J.; Burnett, R.T.; Van Donkelaar, A.; Martin, R.V.; Jones, R.R.; DellaValle, C.T.; Sandler, D.P.; Ward, M.H.; Hoppin, J.A. Long-Term Exposure to Fine Particulate Matter: Association with Nonaccidental and Cardiovascular Mortality in the Agricultural Health Study Cohort. Environ. Health Persp. 2014, 122, 609–615. [Google Scholar] [CrossRef]
- Reynolds, S.J.; Black, D.W.; Borin, S.S.; Breuer, G.; Burmeister, L.F.; Fuortes, L.J.; Smith, T.F.; Stein, M.A.; Subramanian, P.; Thorne, P.S.; et al. Indoor environmental quality in six commercial office buildings in the midwest United States. Appl. Occup. Environ. Hyg. 2001, 16, 1065–1077. [Google Scholar] [CrossRef]
- Dai, X.L.; Liu, J.J.; Li, X.D.; Zhao, L. Long-term monitoring of indoor CO2 and PM2.5 in Chinese homes: Concentrations and their relationships with outdoor environments. Build. Environ. 2018, 144, 238–247. [Google Scholar] [CrossRef]
- Maleki, H.; Sorooshian, A.; Goudarzi, G.; Baboli, Z.; Birgani, Y.T.; Rahmati, M. Air pollution prediction by using an artificial neural network model. Clean Technol. Environ. 2019, 21, 1341–1352. [Google Scholar] [CrossRef]
- Administration of Quality Supervision, Inspection and Quarantine; Ministry of Environmental Protection; Ministry of Health. Indoor Air Quality Standard, Standard No: GB/T 18883-2002. Available online: https://www.mee.gov.cn/ywgz/fgbz/bz/bzwb/dqhjbh/dqhjzlbz/200303/t20030301_67375.shtml (accessed on 15 July 2021).
- Institute of Environmental Epidemiology. Guidelines for Good Indoor Air Quality in Office Premises; Ministry of the Environment: Singapore, 1996.
- TEC Green Office. Indoor Air Quality Guidelines for Sydney Olympic Facilities; TEC Green Office: Sydney, Australia, 1997. [Google Scholar]
- Health Canada. Exposure Guidelines for Residential Indoor Air Quality: A Report of the Federal-Provincial Advisory Committee on Environmental and Occupational Health; Health Canada: Ottawa, ON, Canada, 1989. [Google Scholar]
- ANSI/ASHRAE Standard 62.1. Ventilation for Acceptable Indoor Air Quality; American Society of Heating. Refrigerating and Air-Conditioning Engineers, Inc.: Atlanta, GA, USA, 2007; Available online: https://doc.wendoc.com/ba5824c3fc5ebb69eb1225b67.html (accessed on 15 July 2021).
- Abdul-Wahab, S.A.; En, S.C.F.; Elkamel, A.; Ahmadi, L.; Yetilmezsoy, K. A review of standards and guidelines set by international bodies for the parameters of indoor air quality. Atmos. Pollut. Res. 2015, 5, 751–767. [Google Scholar] [CrossRef]
- Dales, R.; Liu, L.; Wheeler, A.J.; Gilbert, N.L. Quality of indoor residential air and health. Can. Med. Assoc. J. 2008, 179, 147–152. [Google Scholar] [CrossRef]
- ACGIH (American Conference of Governmental Industrial Hygienists). Threshol Limit Values for Chemical Substances and Physical Agents and Biological Exposure Indices; American Conference of Governmental Industrial Hygienists: Cincinnati, OH, USA, 2005; pp. 4524–16340. [Google Scholar]
- Charles, K.; Magee, R.J.; Won, D.; Lusztyk, E. Indoor Air Quality Guidelines and Standards: Final Report 5.1. Achiev. Gains 2005, 4, 206–207. [Google Scholar]
- Bluyssen, P. Product Policy and Indoor Air Quality. Indoor Sources and Health Effects: Background Information and Ways to Go; Directorate General for Environment: Brussels, Belgium, 2010. [Google Scholar]
- Salthammer, T. Critical evaluation of approaches in setting indoor air quality guidelines and reference values. Chemosphere 2011, 82, 1507–1517. [Google Scholar] [CrossRef]
- Wen, C.; Liu, S.; Yao, X.; Peng, L.; Li, X.; Hu, Y.; Chi, T.H. A novel spatiotemporal convolutional long short-term neural network for air pollution prediction. Sci. Total Environ. 2019, 654, 1091–1099. [Google Scholar] [CrossRef]
- Liu, H.; Cao, C.Y.; Huang, J.Y.; Chen, Z.; Chen, G.Q.; Lai, Y.K. Progress on particulate matter filtration technology: Basic concepts, advanced materials, and performances. Nanoscale 2020, 12, 437–453. [Google Scholar] [CrossRef]
- Zheng, C.H.; Kanaoka, C. Recent advances in dust collection technology and ISO standardization in bag filtration. J. Zhejiang Univ. Sci. A 2018, 19, 21–33. [Google Scholar] [CrossRef]
- Simon, X.; Chazelet, S.; Thomas, D.; Bemer, D.; Regnier, R. Experimental study of pulse-jet cleaning of bag filters supported by rigid rings. Powder Technol. 2007, 172, 67–81. [Google Scholar] [CrossRef]
- Bai, Y.; Han, B.; He, C.; Gu, G.Q.; Nie, J.H.; Shao, J.J.; Xiao, T.X.; Deng, C.R.; Wang, Z.L. Washable Multilayer Triboelectric Air Filter for Efficient Particulate Matter PM2.5 Removal. Adv. Funct. Mater. 2018, 28, 1706680. [Google Scholar] [CrossRef]
- Leman, A.M.; Zakaria, S.; Salleh, M.N.M.; Feriyanto, D.; Sunar, N.M.; Misdan, N. Indoor Air Contaminant Adsorption by Palm Shell Activated Carbon Filter-A Proposed Study, 2nd ed.; International Conference on Green Design and Manufacture: Phuket, Thailand, 2016. [Google Scholar]
- Bologa, A.; Paur, H.R.; Seifert, H.; Wascher, T.; Woletz, K. Novel wet electrostatic precipitator for collection of fine aerosol. J. Electrostat. 2009, 67, 150–153. [Google Scholar] [CrossRef]
- Tan, Z.C.; Zhang, Y.H. A Review of effects and control methods of particulate matter in animal indoor environments. J. Air Waste Manag. Assoc. 2004, 54, 845–854. [Google Scholar] [CrossRef]
- Gu, G.Q.; Han, C.B.; Lu, C.X.; He, C.; Jiang, T.; Gao, Z.L.; Li, C.J.; Wang, Z.L. Triboelectric Nanogenerator Enhanced Nanofiber Air Filters for Efficient Particulate Matter Removal. ACS Nano 2017, 11, 6211–6217. [Google Scholar] [CrossRef] [PubMed]
- Zhu, T.; Wang, R.N.; Zhang, X.; Han, Y.W.; Niu, W.F.; Xue, Z.Y.; Wang, L.F. Controlling fine particles in flue gas from lead-zinc smelting by plasma technology. Plasma Sci. Technol. 2020, 22, 044004. [Google Scholar] [CrossRef]
- Luengas, A.; Barona, A.; Hort, C.; Gallastegui, G.; Platel, V.; Elias, A. A review of indoor air treatment technologies. Rev. Environ. Sci. Bio/Technol. 2015, 14, 499–522. [Google Scholar] [CrossRef]
- Xie, B.; Li, S.H.; Jin, H.; Hu, S.D.; Wang, F.; Zhou, F.B. Analysis of the performance of a novel dust collector combining cyclone separator and cartridge filter. Powder Technol. 2018, 339, 695–701. [Google Scholar] [CrossRef]
- Mauter, M.S.; Elimelech, M. Environmental applications of carbon-based nanomaterials. Environ. Sci. Technol. 2008, 42, 5843–5859. [Google Scholar] [CrossRef] [PubMed]
- Jo, W.K.; Yang, C.H. Granular-activated carbon adsorption followed by annular-type photocatalytic system for control of indoor aromatic compounds. Sep. Purif. Technol. 2009, 66, 438–442. [Google Scholar] [CrossRef]
- Liu, R.L.; Zhou, G.; Wang, C.M.; Jiang, W.J.; Wei, X. Preparation and performance characteristics of an environmentally-friendly agglomerant to improve the dry dust removal effect for filter material. J. Hazard. Mater. 2020, 397, 122734. [Google Scholar] [CrossRef] [PubMed]
- Xiao, J.; Liang, J.C.; Zhang, C.; Tao, Y.; Ling, G.W.; Yang, Q.H. Advanced Materials for Capturing Particulate Matter: Progress and Perspectives. Small Methods. 2018, 2, 1800012. [Google Scholar] [CrossRef]
- Guieysse, B.; Hort, C.; Platel, V.; Munoz, R.; Ondarts, M.; Revah, S. Biological treatment of indoor air for VOC removal: Potential and challenges. Biotechnol. Adv. 2008, 26, 398–410. [Google Scholar] [CrossRef]
- Schmid, S.; Meier, L.; Berchtold, C.; Zenobi, R. Online Monitoring of Molecular Processes in a Plasma Air Purifying System. Environ. Sci. Technol. 2012, 46, 4067–4073. [Google Scholar] [CrossRef]
- Li, Z.; Wen, Q.; Zhang, R. Sources, health effects and control strategies of indoor fine particulate matter (PM2.5): A review. Sci. Total Environ. 2017, 586, 610–622. [Google Scholar] [CrossRef] [PubMed]
- Yuan, Y.; Luo, Z.W.; Liu, J.; Wang, Y.W.; Lin, Y.Y. Health and economic benefits of building ventilation for reducing indoor PM2.5 exposure from both indoor and outdoor origins in urban Beijing. China. Sci. Total Environ. 2018, 626, 546–554. [Google Scholar] [CrossRef]
- Davis, J.; Benner, R. Seasonal trends in the abundance, composition and bioavailability of particulate and dissolved organic matter in the Chukchi/Beaufort Seas and western Canada Basin. Deep. Sea Res. Part II Top. Stud. Oceanogr. 2005, 52, 3396–3410. [Google Scholar] [CrossRef]
- Kume, K.; Ohura, T.; Noda, T.; Amagai, T.; Fusaya, M. Seasonal and spatial trends of suspended-particle associated polycyclic aromatic hydrocarbons in urban Shizuoka, Japan. J. Hazard. Mater. 2007, 144, 513–521. [Google Scholar] [CrossRef]
- Shao, Z.J.; Bi, J.; Ma, Z.W.; Wang, J.N. Seasonal trends of indoor fine particulate matter and its determinants in urban residences in Nanjing, China. Build. Environ. 2017, 125, 319–325. [Google Scholar] [CrossRef]
- Mueller, W.; Steinle, S.; Parkka, J.; Parmes, E.; Liedes, H.; Kuijpers, E.; Pronk, A.; Sarigiannis, D.; Karakitsios, S.; Chapizanis, D.; et al. Urban greenspace and the indoor environment: Pathways to health via indoor particulate matter, noise, and road noise annoyance. Environ. Res. 2019, 180, 108850. [Google Scholar] [CrossRef]
- Li, Y.; He, J.H.; Sun, Q.L.; Wang, P. High Temperature Resistant Nanofiber by Bubbfil-Spinning. Therm. Sci. 2015, 19, 1461–1462. [Google Scholar] [CrossRef]
- Liu, C.; Hsu, P.C.; Lee, H.W.; Ye, M.; Zheng, G.Y.; Liu, N.A.; Li, W.Y.; Cui, Y. Transparent air filter for high-efficiency PM2.5 capture. Nat. Commun. 2015, 6, 6205. [Google Scholar] [CrossRef]
- Repace, J.; Zhang, B.; Bondy, S.J.; Benowitz, N.; Ferrence, R. Air quality, mortality, and economic benefits of a smoke-free workplace law for non-smoking Ontario bar workers. Indoor Air 2013, 23, 93–104. [Google Scholar] [CrossRef] [PubMed]
- Bhatt, J.M.; Ramphul, M.; Bush, A.P. An update on controversies in e-cigarettes. Paediatr. Respir. Rev. 2020, 36, 75–86. [Google Scholar] [CrossRef] [PubMed]
- Cao, Y.N.; Wu, D.M.; Ma, Y.; Ma, X.M.; Wang, S.L.; Li, F.X.; Li, M.H.; Zhang, T. Toxicity of electronic cigarettes: A general review of the origins, health hazards, and toxicity mechanisms. Sci. Total Environ. 2021, 772, 145475. [Google Scholar] [CrossRef]
- Ng, T.P.; Hui, K.P.; Tan, W.C. Respiratory Symptoms and lungs function effects of domestic exposure to tobacco smoke and cooking by gas in non-smoking women in Singapore. J. Epidemiol. Commun. Health 1993, 47, 454–458. [Google Scholar] [CrossRef]
- Dennekamp, M.; Howarth, S.; Dick, C.A.; Cherrie, J.W.; Donaldson, K.; Seaton, A. Ultrafine particles and nitrogen oxides generated by gas and electric cooking. Occup. Environ. Med. 2001, 58, 511–516. [Google Scholar] [CrossRef]
- He, C.R.; Morawska, L.D.; Hitchins, J.; Gilbert, D. Contribution from indoor sources to particle number and mass concentrations in residential houses. Atmos. Environ. 2004, 38, 3405–3415. [Google Scholar] [CrossRef]
- See, S.W.; Karthikeyana, S.; Balasubramanian, R. Health risk assessment of occupational exposure to particulate-phase polycyclic aromatic hydrocarbons associated with Chinese, Malay and Indian cooking. J. Environ. Monitor. 2006, 8, 369–376. [Google Scholar] [CrossRef]
- Torkmahalleh, M.A.; Gorjinezhad, S.; Keles, M.; Unluevcek, H.S.; Azgin, C.; Cihan, E.; Tanis, B.; Soy, N.; Ozaslan, N.; Ozturk, F.; et al. A controlled study for the characterization of PM2.5 emitted during grilling ground beef meat. J. Aerosol Sci. 2017, 103, 132–140. [Google Scholar] [CrossRef]
- Hartinger, S.M.; Commodore, A.A.; Hattendorf, J.; Lanata, C.F.; Gil, A.I.; Verastegui, H.; Aguilar-Villalobos, M.; Mausezahl, D.; Naeher, L.P. Chimney stoves modestly improved Indoor Air Quality measurements compared with traditional open fire stoves: Results from a small-scale intervention study in rural Peru. Indoor Air 2013, 23, 342–352. [Google Scholar] [CrossRef] [PubMed]
- Branco, P.T.B.S.; Alvim-Ferraz, M.C.M.; Martins, F.G.; Sousa, S.I.V. Indoor air quality in urban nurseries at Porto city: Particulate matter assessment. Atmos. Environ. 2013, 84, 133–143. [Google Scholar] [CrossRef]
- Nowak, D.J.; Hirabayashi, S.; Bodine, A.; Hoehn, R. Modeled PM2.5 removal by trees in ten U.S. cities and associated health effects. Environ. Pollut. 2013, 178, 395–402. [Google Scholar] [CrossRef]
- Little, P.; Wiffen, R.D. Emission and deposition of petrol engine exhaust Pb-I. Deposition of exhaust Pb to plant and soil surface. Atmos. Environ. 1977, 11, 437–447. [Google Scholar] [CrossRef]
- Langner, M.; Kull, M.; Endlicher, W.R. Determination of PM10 deposition based on antimony flux to selected urban surfaces. Environ. Pollut. 2011, 159, 2028–2034. [Google Scholar] [CrossRef]
- Wang, Y.; Akbari, H. The effects of street tree planting on urban heat island mitigation in Montreal. Sustain. Cities Soc. 2016, 27, 121–128. [Google Scholar] [CrossRef]
- Du, L.; Batterman, S.; Parker, E.; Godwin, C.; Chin, J.Y.; O’Toole, A.; Robins, T.; Brakefield-Caldwell, W.; Lewis, T. Particle concentrations and effectiveness of freestanding air filters in bedrooms of children with asthma in Detroit, Michigan. Build. Environ. 2011, 46, 2303–2313. [Google Scholar] [CrossRef]


Publisher’s Note: MDPI stays neutral with regard to jurisdictional claims in published maps and institutional affiliations. |
© 2021 by the authors. Licensee MDPI, Basel, Switzerland. This article is an open access article distributed under the terms and conditions of the Creative Commons Attribution (CC BY) license (https://creativecommons.org/licenses/by/4.0/).