
Exploring the Dependence and Influencing Factors of Carbon Emissions from the Perspective of Population Development


Abstract
:1. Introduction
1.1. Importance and Motivation
1.2. Objective and Contribution
- (1)
- Develop a comprehensive indicator to reflect the multifaceted aspects of population development;
- (2)
- Explore the decoupling relationship between carbon emissions and population development;
- (3)
- Identify the driving force of population development on carbon emissions to promote carbon decoupling.
2. Literature Review
3. Materials and Methods
3.1. PDI Construction
3.1.1. Indicator Selection
3.1.2. Weight Determination and PDI Calculation
3.2. Carbon Emission Estimation
3.3. Decoupling Elasticity Model
3.4. The Extended STIRPAT Model
3.5. Ridge Regression
4. Study Areas and Data Sources
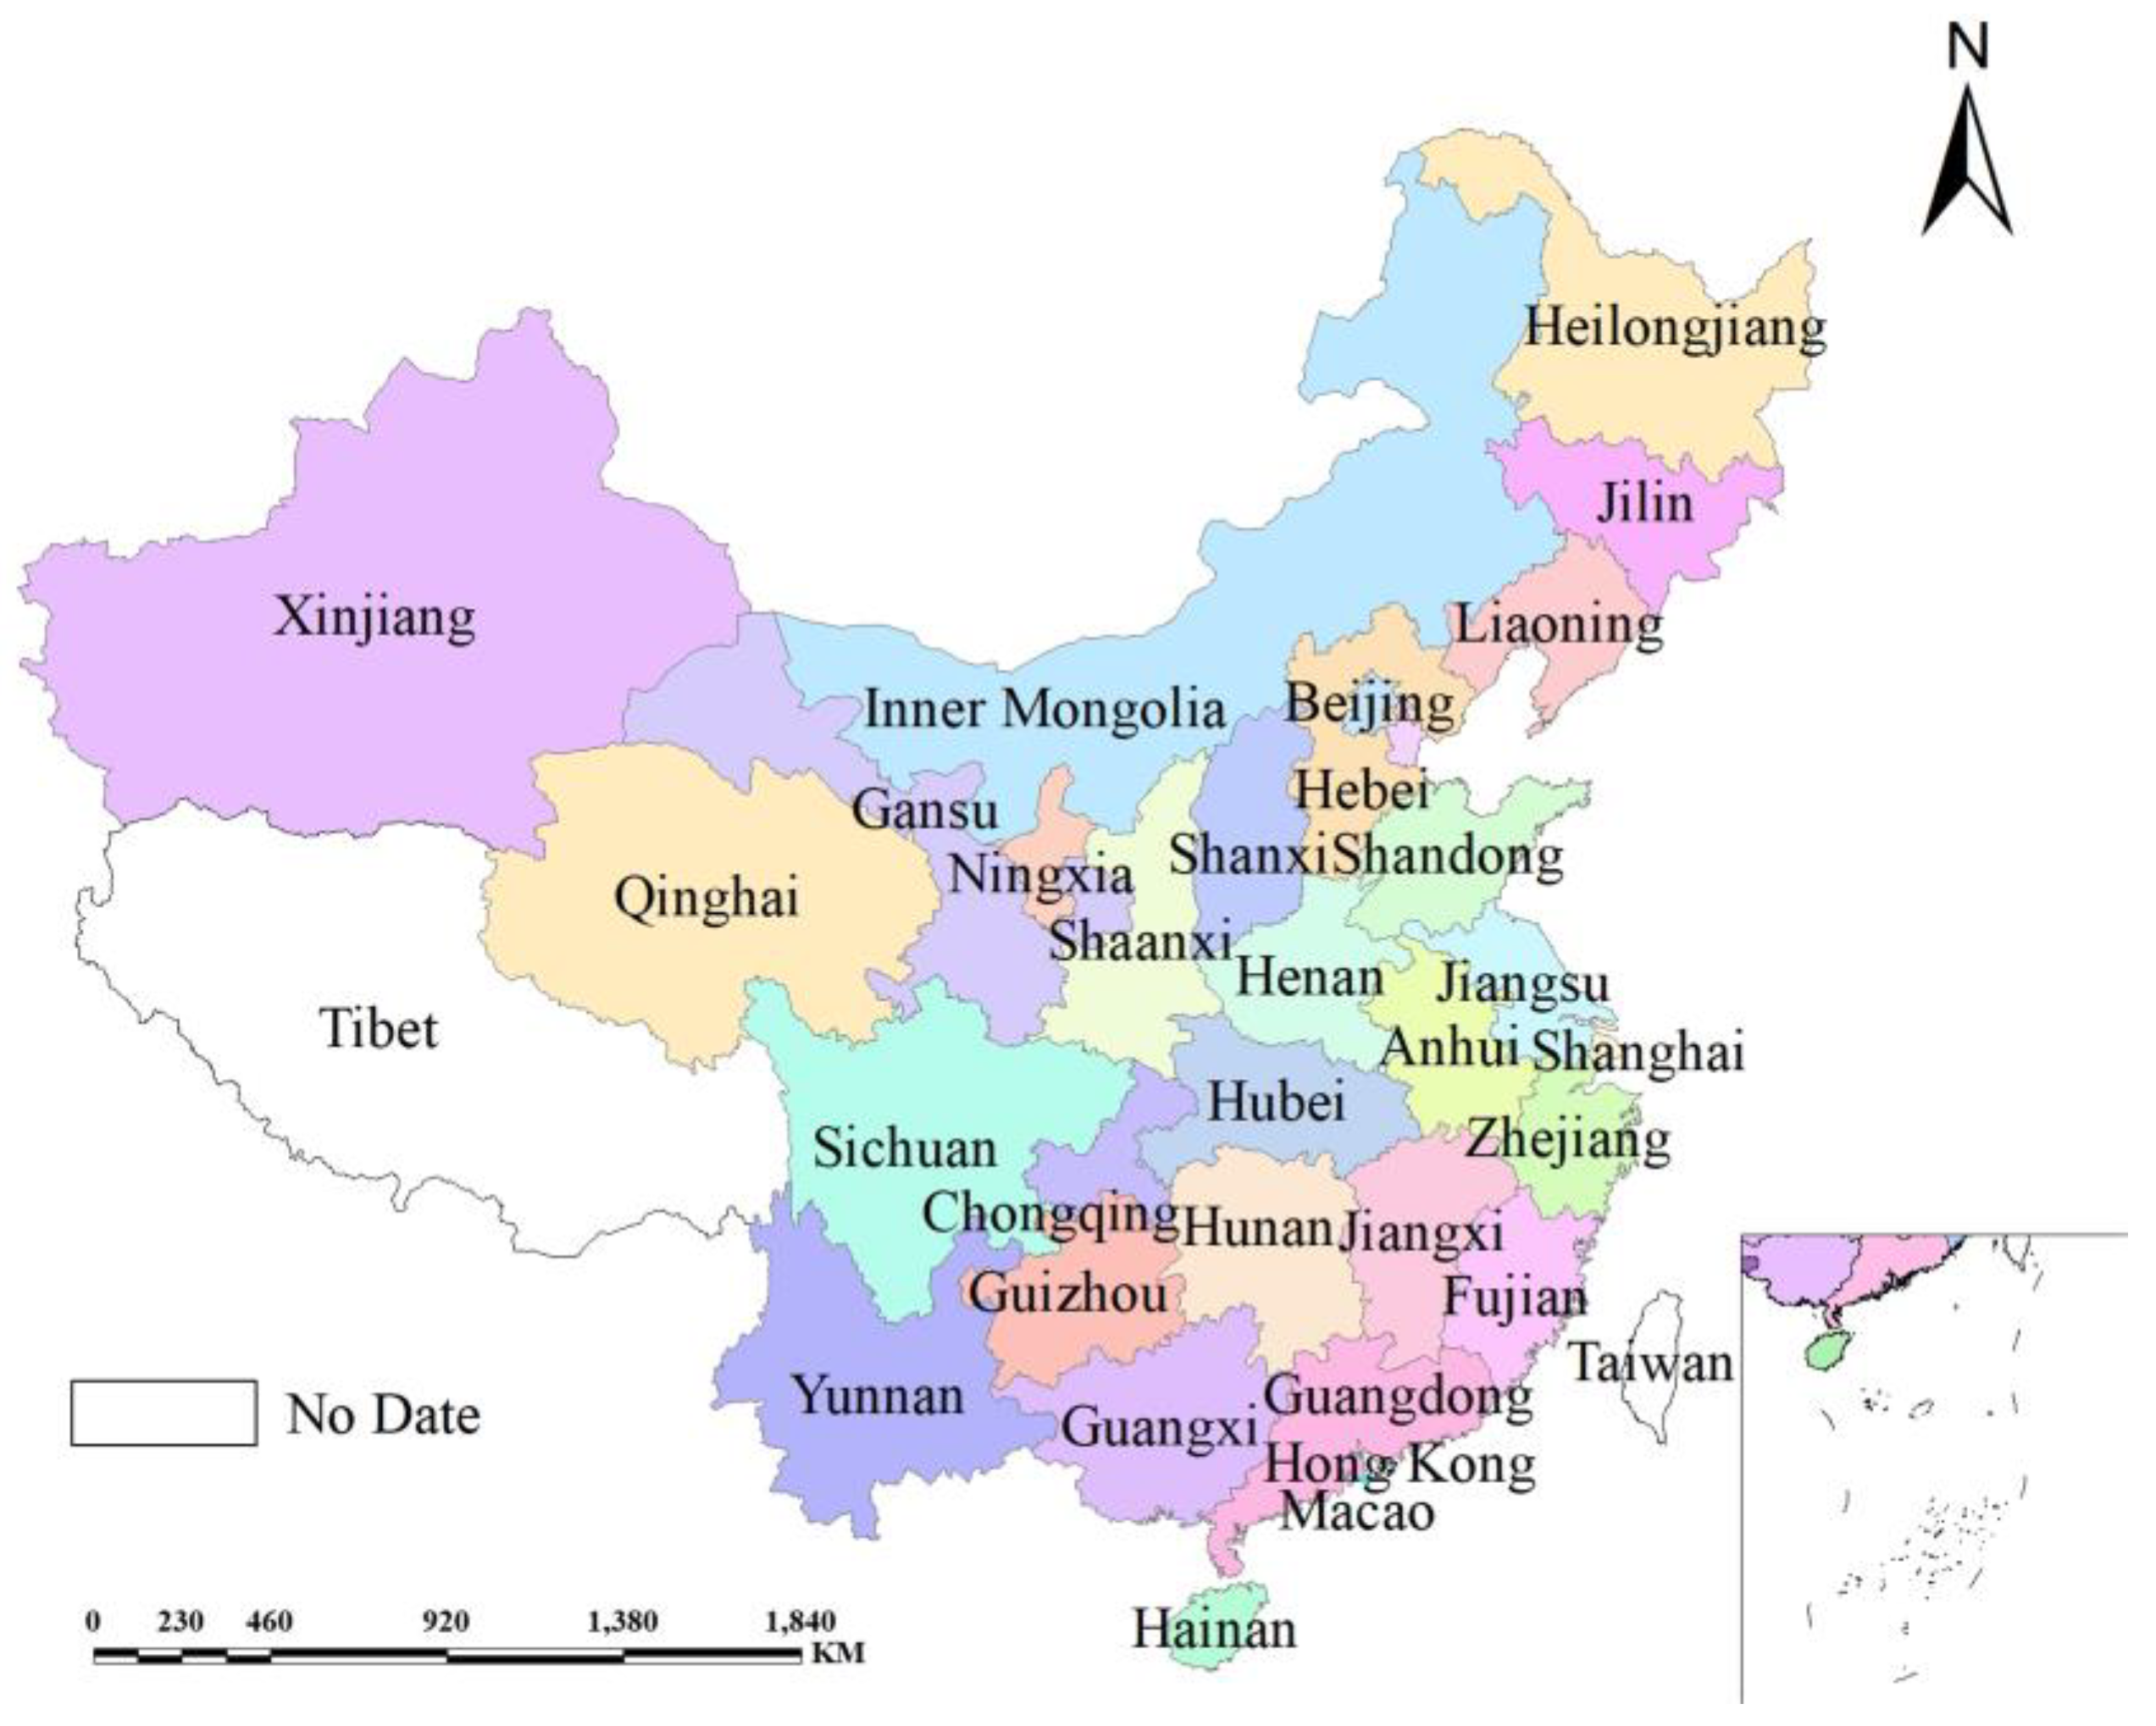
4.1. Study Areas
4.2. Data Sources
5. Results and Discussion
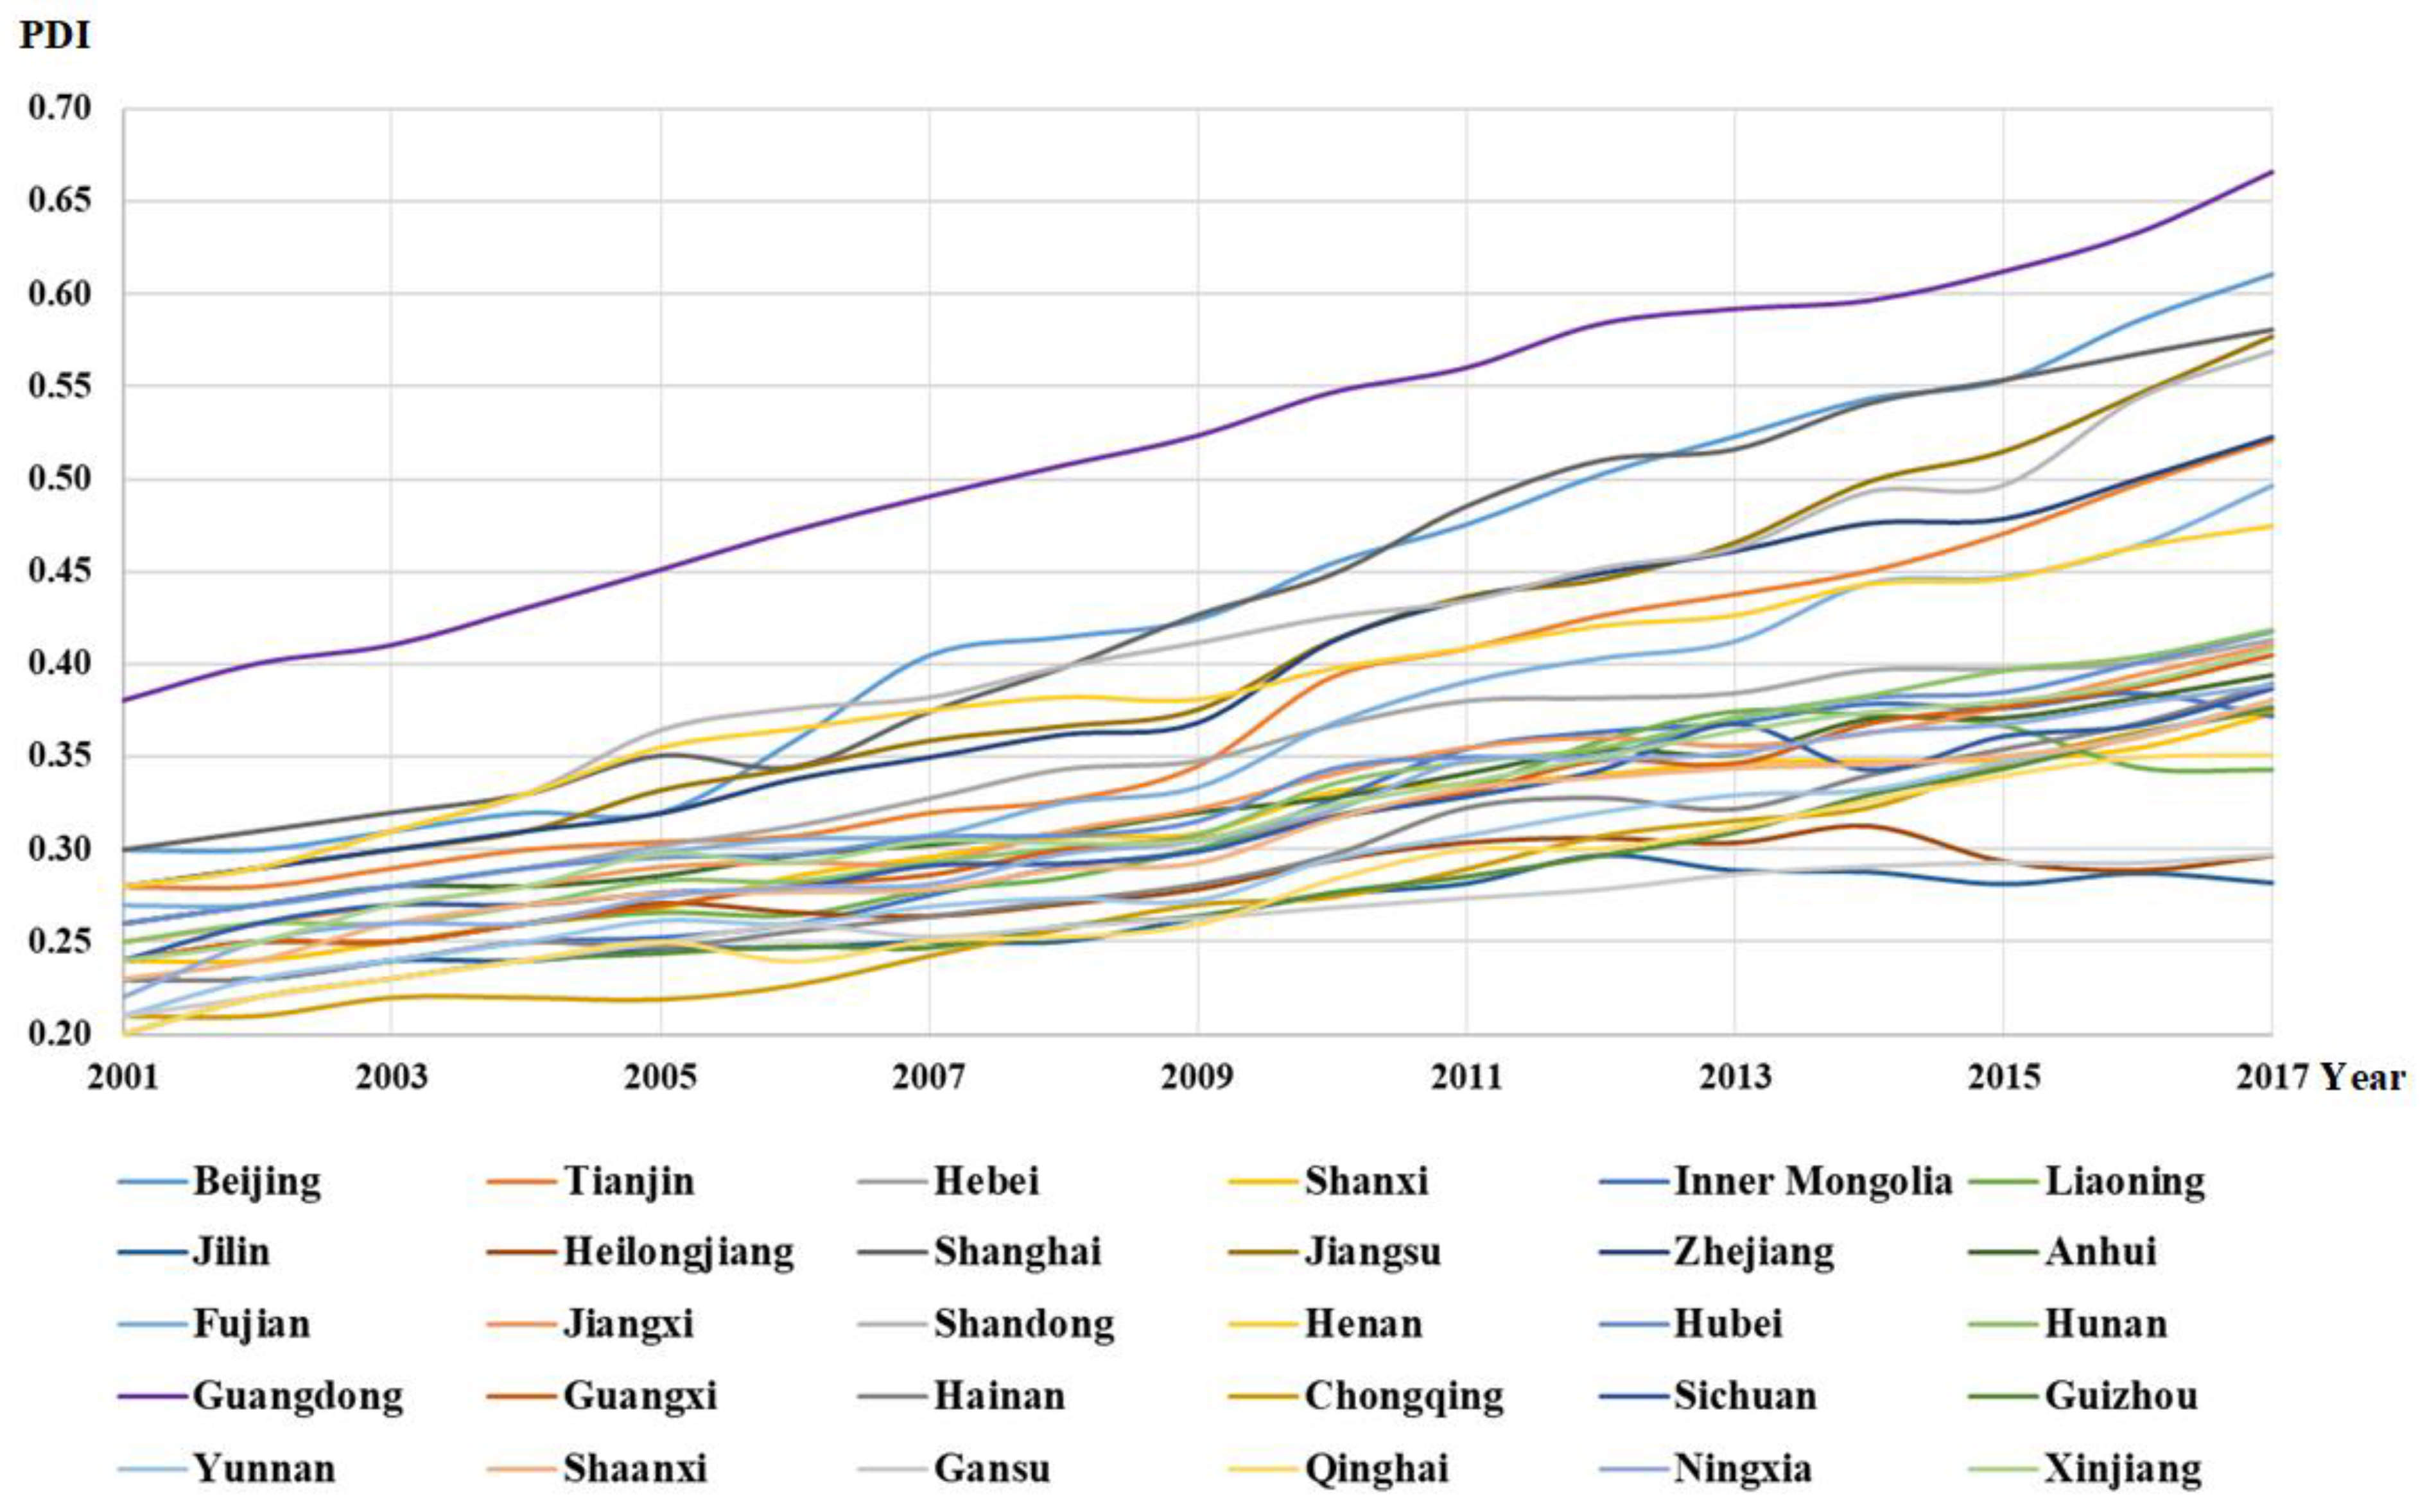
5.1. PDI of the 30 Provinces in China
5.2. Decoupling between Carbon Emissions and PDI
5.2.1. Decoupling at the National Scale
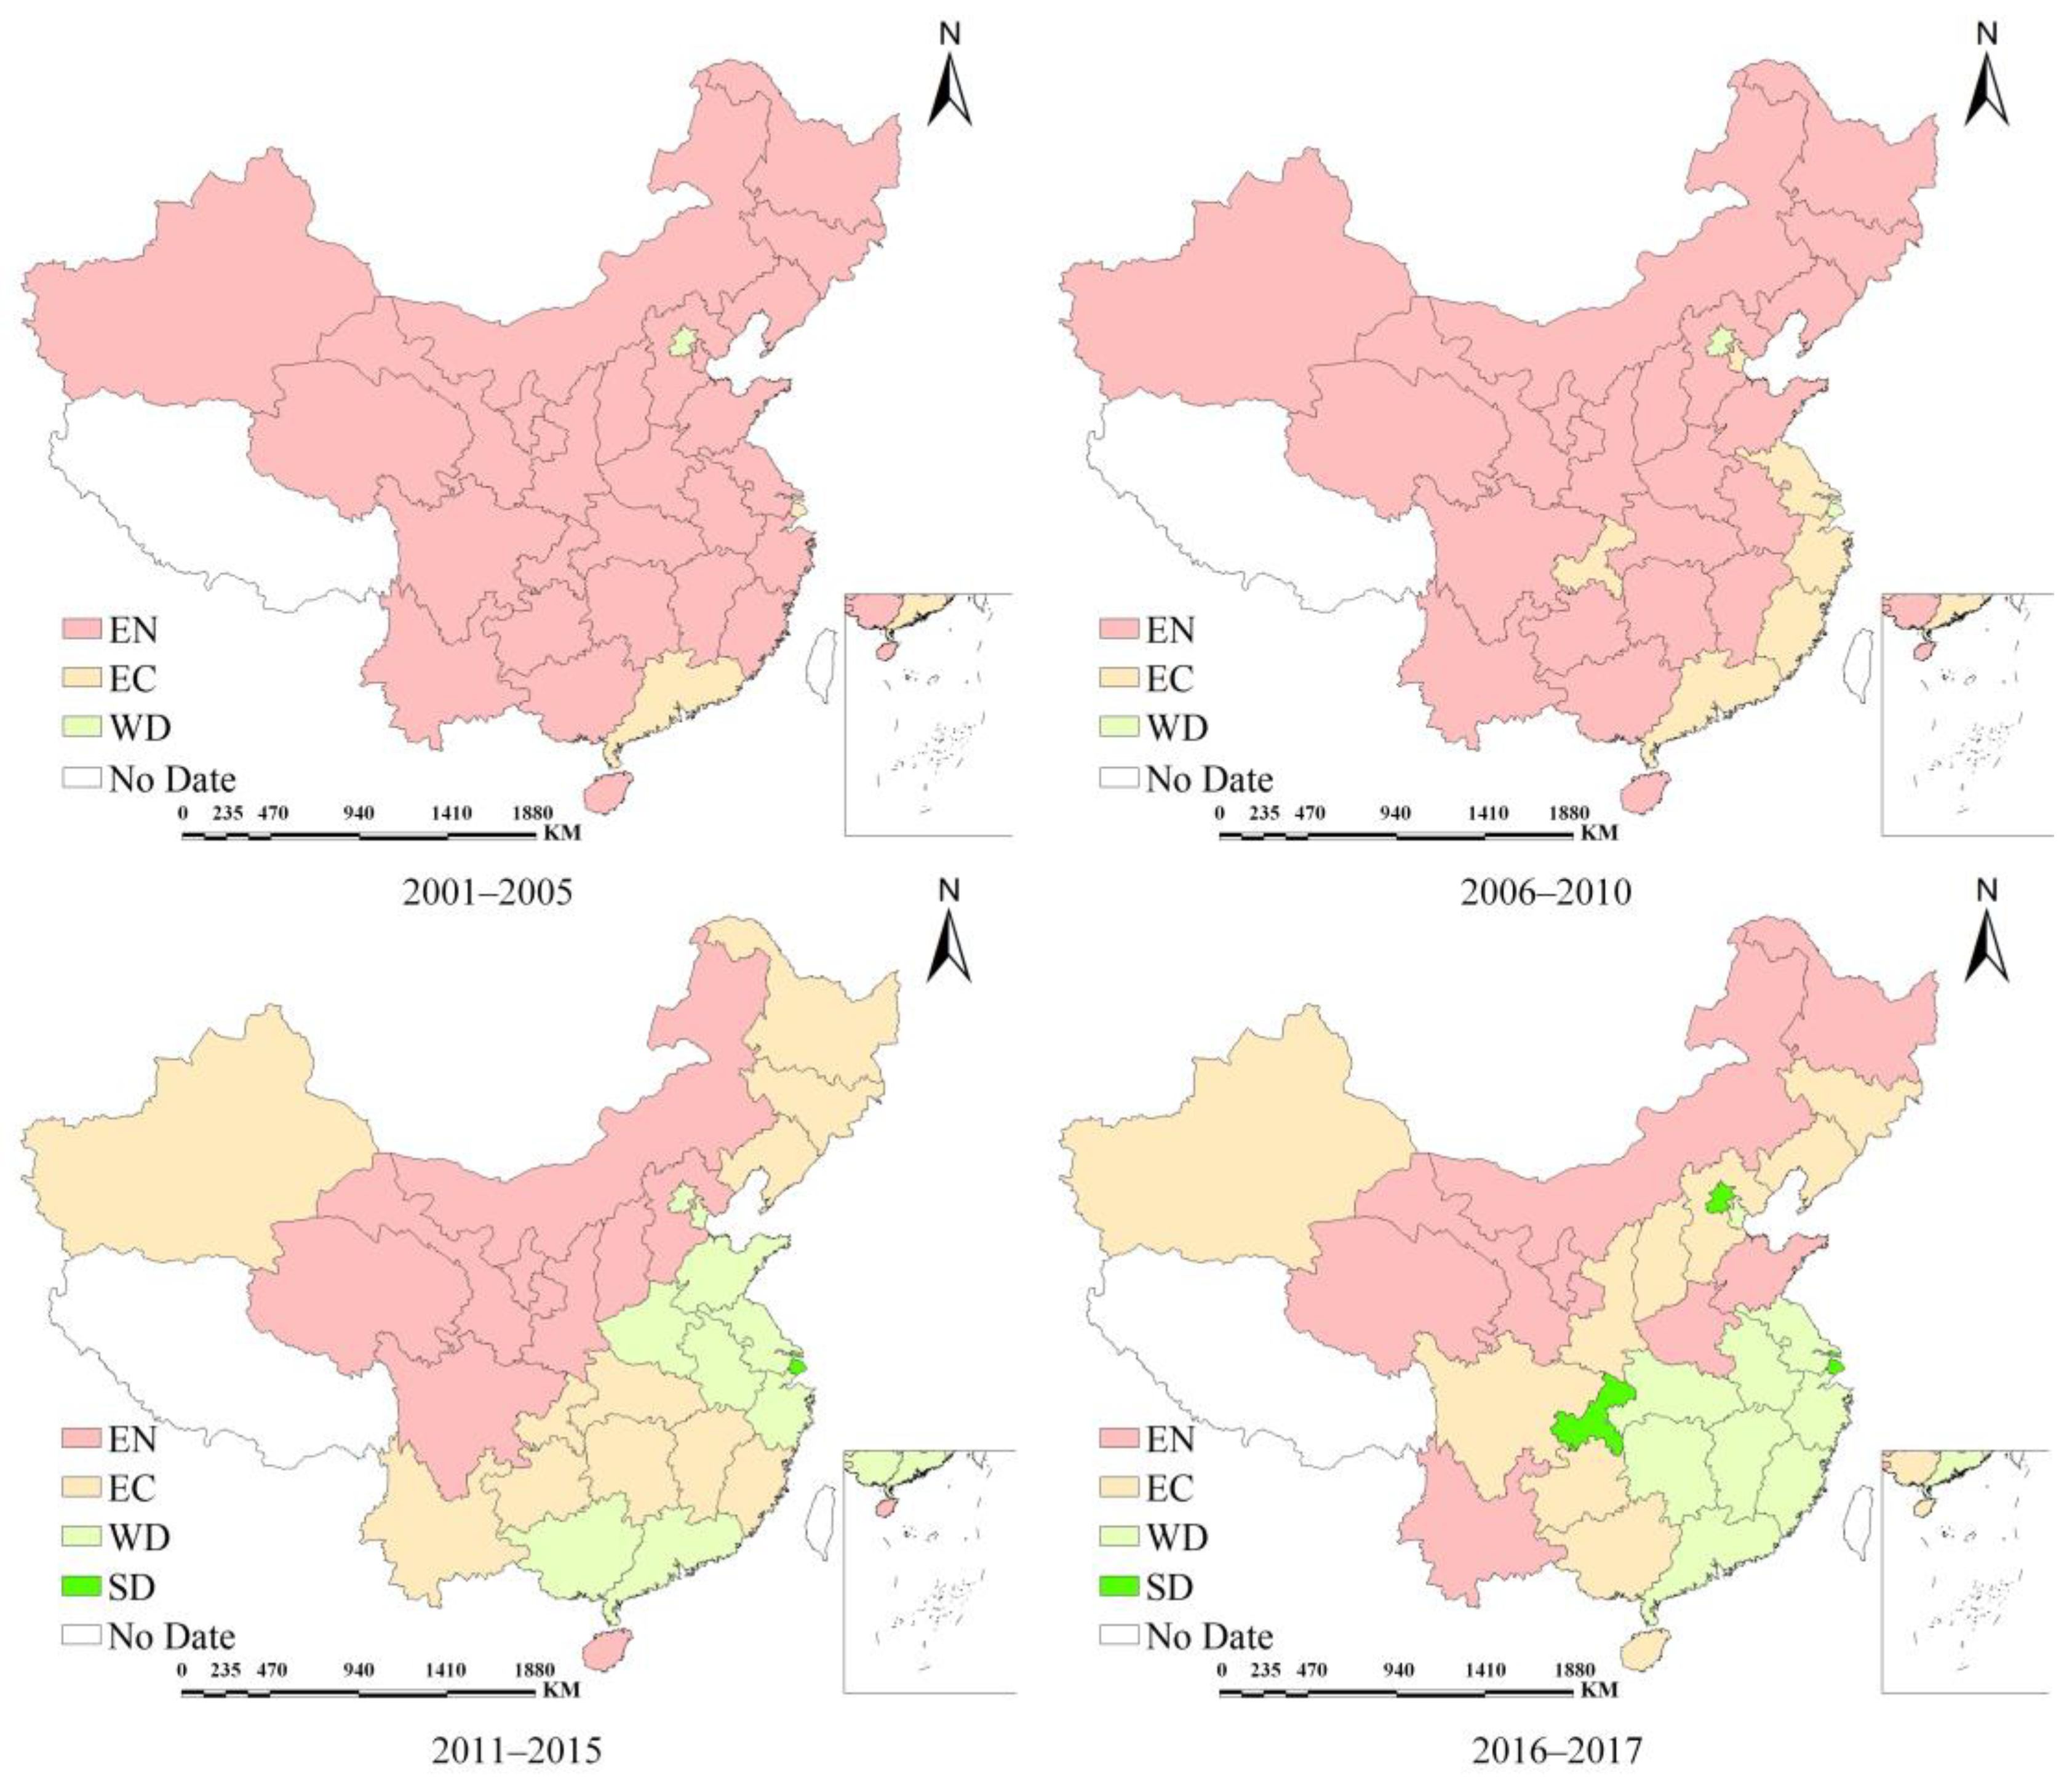
5.2.2. Decoupling at the Provincial Scale
5.3. Analysis of Population Effect on Carbon Emissions
6. Conclusions
Author Contributions
Funding
Institutional Review Board Statement
Informed Consent Statement
Data Availability Statement
Conflicts of Interest
References
- Dong, F.; Hua, Y.; Yu, B. Peak carbon emissions in china: Status, key factors and countermeasures—A literature review. Sustainability 2018, 10, 2895. [Google Scholar] [CrossRef] [Green Version]
- Peng, X. China’s demographic history and future challenges. Science 2011, 333, 581–587. [Google Scholar] [CrossRef] [PubMed] [Green Version]
- Riti, J.S.; Song, D.; Shu, Y.; Kamah, M. Decoupling CO2 emission and economic growth in China: Is there consistency in estimation results in analyzing environmental Kuznets curve? J. Clean. Prod. 2017, 166, 1448–1461. [Google Scholar] [CrossRef]
- Cui, X.; Zhao, K.; Zhou, Z.; Huang, P. Examining the uncertainty of carbon emission changes: A systematic approach based on peak simulation and resilience assessment. Environ. Impact Assess. Rev. 2021, 91, 106667. [Google Scholar] [CrossRef]
- Gong, W.; Wang, C.; Fan, Z.; Xu, Y. Drivers of the peaking and decoupling between CO2 emissions and economic growth around 2030 in China. Environ. Sci. Pollut. Res. 2021. [Google Scholar] [CrossRef] [PubMed]
- Huo, T.; Ma, Y.; Yu, T.; Cai, W.; Liu, B.; Ren, H. Decoupling and decomposition analysis of residential building carbon emissions from residential income: Evidence from the provincial level in China. Environ. Impact Assess. Rev. 2021, 86, 106487. [Google Scholar] [CrossRef]
- Xu, W.; Xie, Y.; Xia, D.; Ji, L.; Huang, G. A multi-sectoral decomposition and decoupling analysis of carbon emissions in Guangdong province, China. J. Environ. Manag. 2021, 298, 113485. [Google Scholar] [CrossRef] [PubMed]
- He, J.; Yu, Z.; Zhang, D. China’s strategy for energy development and climate change mitigation. Energy Policy 2012, 51, 7–13. [Google Scholar]
- Chen, L.; Cai, W.; Ma, M. Decoupling or delusion? Mapping carbon emission per capita based on the human development index in Southwest China. Sci. Total Environ. 2020, 741, 138722. [Google Scholar] [CrossRef]
- Qi, X.; Han, Y.; Kou, P. Population urbanization, trade openness and carbon emissions: An empirical analysis based on China. Air Qual. Atmos. Health 2020, 13, 519–528. [Google Scholar] [CrossRef]
- Wang, Y.; Kang, Y.; Wang, J.; Xu, L. Panel estimation for the impacts of population-related factors on CO2 emissions: A regional analysis in China. Ecol. Indic. 2017, 78, 322–330. [Google Scholar] [CrossRef]
- Cramer, J.C. Population Growth and Local Air Pollution: Methods, Models, and Results. Popul. Dev. Rev. 2002, 28, 22–52. [Google Scholar]
- NBSC. National Bureau of Statistics of China; NBSC: Beijing, China, 2017.
- Liu, B.; Shi, J.; Wang, H.; Su, X.; Zhou, P. Driving factors of carbon emissions in China: A joint decomposition approach based on meta-frontier. Appl. Energy 2019, 256, 113986. [Google Scholar] [CrossRef]
- Xu, S.-C.; He, Z.-X.; Long, R.-Y. Factors that influence carbon emissions due to energy consumption in China: Decomposition analysis using LMDI. Appl. Energy 2014, 127, 182–193. [Google Scholar] [CrossRef]
- Song, M.; Guo, X.; Wu, K.; Wang, G. Driving effect analysis of energy-consumption carbon emissions in the Yangtze River Delta region. J. Clean. Prod. 2015, 103, 620–628. [Google Scholar] [CrossRef]
- Zhang, Y.-J.; Liu, Z.; Zhang, H.; Tan, T.-D. The impact of economic growth, industrial structure and urbanization on carbon emission intensity in China. Nat. Hazards 2014, 73, 579–595. [Google Scholar] [CrossRef]
- Shuai, C.; Chen, X.; Wu, Y.; Zhang, Y.; Tan, Y. A three-step strategy for decoupling economic growth from carbon emission: Empirical evidences from 133 countries. Sci. Total Environ. 2019, 646, 524–543. [Google Scholar] [CrossRef]
- Zhang, Y.-J.; Da, Y.-B. The decomposition of energy-related carbon emission and its decoupling with economic growth in China. Renew. Sustain. Energy Rev. 2015, 41, 1255–1266. [Google Scholar] [CrossRef]
- Song, Y.; Sun, J.; Zhang, M.; Su, B. Using the Tapio-Z decoupling model to evaluate the decoupling status of China’s CO2 emissions at provincial level and its dynamic trend. Struct. Chang. Econ. Dyn. 2020, 52, 120–129. [Google Scholar] [CrossRef]
- Xu, Q.; Yang, R. The sequential collaborative relationship between economic growth and carbon emissions in the rapid urbanization of the Pearl River Delta. Environ. Sci. Pollut. Res. 2019, 26, 30130–30144. [Google Scholar] [CrossRef]
- Jiang, R.; Zhou, Y.; Li, R. Moving to a low-carbon economy in China: Decoupling and decomposition analysis of emission and economy from a sector perspective. Sustainability 2018, 10, 978. [Google Scholar] [CrossRef] [Green Version]
- Hu, J.; Gui, S.; Zhang, W. Decoupling Analysis of China’s Product Sector Output and Its Embodied Carbon Emissions—An Empirical Study Based on Non-Competitive I-O and Tapio Decoupling Model. Sustainability 2017, 9, 815. [Google Scholar] [CrossRef] [Green Version]
- Wang, Q.; Wang, S. A comparison of decomposition the decoupling carbon emissions from economic growth in transport sector of selected provinces in eastern, central and western China. J. Clean. Prod. 2019, 229, 570–581. [Google Scholar] [CrossRef]
- Wang, Q.; Wang, S.; Li, R. Determinants of Decoupling Economic Output from Carbon Emission in the Transport Sector: A Comparison Study of Four Municipalities in China. Int. J. Environ. Res. Public Health 2019, 16, 3729. [Google Scholar] [CrossRef] [Green Version]
- Zhao, M.-M.; Li, R. Decoupling and decomposition analysis of carbon emissions from economic output in Chinese Guangdong Province: A sector perspective. Energy Environ. 2018, 29, 543–555. [Google Scholar] [CrossRef]
- Shang, M.; Luo, J. The Tapio Decoupling Principle and Key Strategies for Changing Factors of Chinese Urban Carbon Footprint Based on Cloud Computing. Int. J. Environ. Res. Public Health 2021, 18, 2101. [Google Scholar] [CrossRef] [PubMed]
- Yasmeen, H.; Tan, Q. Assessing Pakistan’s energy use, environmental degradation, and economic progress based on Tapio decoupling model. Environ. Sci. Pollut. Res. Int. 2021. [Google Scholar] [CrossRef]
- Ma, X.-W.; Ye, Y.; Shi, X.-Q.; Zou, L.-L. Decoupling economic growth from CO2 emissions: A decomposition analysis of China’s household energy consumption. Adv. Clim. Chang. Res. 2016, 7, 192–200. [Google Scholar] [CrossRef]
- Jorgenson, A.K.; Clark, B. Assessing the temporal stability of the population/environment relationship in comparative perspective: A cross-national panel study of carbon dioxide emissions, 1960–2005. Popul. Environ. 2010, 32, 27–41. [Google Scholar] [CrossRef]
- Hertwich, E.G.; Peters, G.P. Carbon footprint of nations: A global, trade-linked analysis. Environ. Sci. Technol. 2009, 43, 6414–6420. [Google Scholar] [CrossRef] [Green Version]
- Liu, Y.; Zhou, Y.; Wu, W. Assessing the impact of population, income and technology on energy consumption and industrial pollutant emissions in China. Appl. Energy 2015, 155, 904–917. [Google Scholar] [CrossRef]
- Onozaki, K. Population is a critical factor for global carbon dioxide increase. J. Health Sci. 2009, 55, 125–127. [Google Scholar] [CrossRef] [Green Version]
- Dietz, T.; Rosa, E.A.; York, R. Driving the human ecological footprint. Front. Ecol. Environ. 2007, 5, 13–18. [Google Scholar] [CrossRef]
- Zhu, Q.; Peng, X. The impacts of population change on carbon emissions in China during 1978–2008. Environ. Impact Assess. Rev. 2012, 36, 1–8. [Google Scholar] [CrossRef]
- Jorgenson, A.K.; Clark, B. The relationship between national-level carbon dioxide emissions and population size: An assessment of regional and temporal variation, 1960–2005. PLoS ONE 2013, 8, e57107. [Google Scholar] [CrossRef] [PubMed] [Green Version]
- Menz, T.; Welsch, H. Population aging and carbon emissions in OECD countries: Accounting for life-cycle and cohort effects. Energy Econ. 2012, 34, 842–849. [Google Scholar] [CrossRef]
- O’Neill, B.C.; Liddle, B.; Jiang, L.; Smith, K.R.; Pachauri, S.; Dalton, M.; Fuchs, R. Demographic change and carbon dioxide emissions. Lancet 2012, 380, 157–164. [Google Scholar] [CrossRef]
- Zhou, Y.; Liu, Y. Does population have a larger impact on carbon dioxide emissions than income? Evidence from a cross-regional panel analysis in China. Appl. Energy 2016, 180, 800–809. [Google Scholar] [CrossRef]
- Zhang, C.; Tan, Z. The relationships between population factors and China’s carbon emissions: Does population aging matter? Renew. Sustain. Energy Rev. 2016, 65, 1018–1025. [Google Scholar] [CrossRef]
- Li, W.; Qi, X.; Zhao, X. Impact of Population Aging on Carbon Emission in China: A Panel Data Analysis. Sustainability 2018, 10, 2458. [Google Scholar] [CrossRef] [Green Version]
- Bano, S.; Zhao, Y.; Ahmad, A.; Wang, S.; Liu, Y. Identifying the impacts of human capital on carbon emissions in Pakistan. J. Clean. Prod. 2018, 183, 1082–1092. [Google Scholar] [CrossRef]
- Cole, M.A.; Neumayer, E. Examining the Impact of Demographic Factors on Air Pollution. Popul. Environ. 2004, 26, 5–21. [Google Scholar] [CrossRef] [Green Version]
- Yang, Y.; Zhao, T.; Wang, Y.; Shi, Z. Research on impacts of population-related factors on carbon emissions in Beijing from 1984 to 2012. Environ. Impact Assess. Rev. 2015, 55, 45–53. [Google Scholar] [CrossRef]
- Wei, T. What STIRPAT tells about effects of population and affluence on the environment? Ecol. Econ. 2011, 72, 70–74. [Google Scholar] [CrossRef]
- Chen, Z.; Yang, L. Research on model about development of population based on entropy-fuzzy comprehensive evaluation. China Popul. Resour. Environ. 2009, 19, 93–99. [Google Scholar]
- Chen, Y. Study on evaluation index system of population modernization. Chin. Popul. Sci. 2003, 3, 64–70. [Google Scholar]
- Wang, X. Study on the construction of the measurement index system of population modernization. Popul. Res. 2006, 4, 46–51. [Google Scholar]
- Meidutė-Kavaliauskienė, I.; Dudzevičiūtė, G.; Maknickienė, N.; Vasilis Vasiliauskas, A. The relation between aging of population and sustainable development of EU countries. Entrep. Sustain. Issues 2020, 7, 2026–2042. [Google Scholar] [CrossRef]
- Wang, J.; Wu, Y.; Zhao, Y.; He, S.; Dong, Z.; Bo, W. The population structural transition effect on rising per capita CO2 emissions: Evidence from China. Clim. Policy 2019, 19, 1250–1269. [Google Scholar] [CrossRef]
- He, C.; Mao, X. Population dynamics and regional development in China. Camb. J. Reg. Econ. Soc. 2016, 9. [Google Scholar] [CrossRef]
- Zhang, Y.; Xie, H. Interactive Relationship among Urban Expansion, Economic Development, and Population Growth since the Reform and Opening up in China: An Analysis Based on a Vector Error Correction Model. Land 2019, 8, 153. [Google Scholar] [CrossRef] [Green Version]
- Johnson, D.G. Population and economic development. China Econ. Rev. 1999, 10, 1–16. [Google Scholar] [CrossRef]
- Bai, C.; Lei, X. New trends in population aging and challenges for China’s sustainable development. China Econ. J. 2019, 13, 3–23. [Google Scholar] [CrossRef]
- Chang, A.Y.; Skirbekk, V.F.; Tyrovolas, S.; Kassebaum, N.J.; Dieleman, J.L. Measuring population ageing: An analysis of the Global Burden of Disease Study 2017. Lancet Public Health 2019, 4, e159–e167. [Google Scholar] [CrossRef] [Green Version]
- Hope, K.R. Urbanization and economic development in the Third World. Cities 1986, 3, 41–57. [Google Scholar] [CrossRef]
- Ding, Y.; Li, Z.; Ge, X.; Hu, Y. Empirical analysis of the synergy of the three sectors’ development and labor employment. Technol. Forecast. Soc. Chang. 2020, 160, 120223. [Google Scholar] [CrossRef]
- Geng, X. Analysis of the influence of economic development on population quality. Manag. World 2008, 11, 168–169. [Google Scholar]
- Brinkman, R.L.; Brinkman, J.E. GDP as a measure of progress and human development: A process of conceptual evolution. J. Econ. Issues 2011, 45, 447–456. [Google Scholar] [CrossRef]
- Song, Q.; Zhou, N.; Liu, T.; Siehr, S.A.; Qi, Y. Investigation of a “coupling model” of coordination between low-carbon development and urbanization in China. Energy Policy 2018, 121, 346–354. [Google Scholar] [CrossRef] [Green Version]
- IPCC. Climate Change 2007: Synthesis Report. Contribution of Working Groups I, II and III to the Fourth Assessment Report of the Intergovernmental Panel on Climate Change. 2007. Available online: https://archive.ipcc.ch/publications_and_data/ar4/syr/en/contents.html (accessed on 5 August 2020).
- IPCC. 2006 IPCC Guidelines for National Greenhouse Gas Inventories. Volume 2. Energy. 2006. Available online: https://www.ipcc-nggip.iges.or.jp/public/2006gl/vol2.html (accessed on 5 August 2020).
- Su, K.; Wei, D.-Z.; Lin, W.-X. Influencing factors and spatial patterns of energy-related carbon emissions at the city-scale in Fujian province, Southeastern China. J. Clean. Prod. 2019, 244, 118840. [Google Scholar] [CrossRef]
- Tapio, P. Towards a theory of decoupling: Degrees of decoupling in the EU and the case of road traffic in Finland between 1970 and 2001. Transp. Policy 2005, 12, 137–151. [Google Scholar] [CrossRef] [Green Version]
- Shuai, C.; Chen, X.; Wu, Y.; Tan, Y.; Zhang, Y.; Shen, L. Identifying the key impact factors of carbon emission in China: Results from a largely expanded pool of potential impact factors. J. Clean. Prod. 2018, 175, 612–623. [Google Scholar] [CrossRef]
- Shi, A. The impact of population pressure on global carbon dioxide emissions, 1975–1996: Evidence from pooled cross-country data. Ecol. Econ. 2003, 44, 29–42. [Google Scholar] [CrossRef]
- Wang, S.; Wang, J.; Li, S.; Fang, C.; Feng, K. Socioeconomic driving forces and scenario simulation of CO2 emissions for a fast-developing region in China. J. Clean. Prod. 2019, 216, 217–229. [Google Scholar] [CrossRef]
- Hoerl, A.E.; Kennard, R.W. Ridge Regression: Biased Estimation for Nonorthogonal Problems. Technometrics 2000, 42, 80–86. [Google Scholar] [CrossRef]
- Li, J.; Zhang, D.; Su, B. The Impact of Social Awareness and Lifestyles on Household Carbon Emissions in China. Ecol. Econ. 2019, 160, 145–155. [Google Scholar] [CrossRef]
- Lindner, S.; Liu, Z.; Guan, D.; Geng, Y.; Li, X. CO2 emissions from China’s power sector at the provincial level: Consumption versus production perspectives. Renew. Sustain. Energy Rev. 2013, 19, 164–172. [Google Scholar] [CrossRef]
- Luo, F.; Guo, Y.; Yao, M.; Cai, W.; Wang, M.; Wei, W. Carbon emissions and driving forces of China’s power sector: Input-output model based on the disaggregated power sector. J. Clean. Prod. 2020, 268, 121915. [Google Scholar] [CrossRef]
- Wang, Y.; Su, X.; Qi, L.; Shang, P.; Xu, Y. Feasibility of peaking carbon emissions of the power sector in China’s eight regions: Decomposition, decoupling, and prediction analysis. Environ. Sci. Pollut. Res. 2019, 26, 29212–29233. [Google Scholar] [CrossRef]
- Meng, M.; Jing, K.; Mander, S. Scenario analysis of CO2 emissions from China’s electric power industry. J. Clean. Prod. 2017, 142, 3101–3108. [Google Scholar] [CrossRef]
- Lenzen, M.; Wier, M.; Cohen, C.; Hayami, H.; Pachauri, S.; Schaeffer, R. A comparative multivariate analysis of household energy requirements in Australia, Brazil, Denmark, India and Japan. Energy 2006, 31, 181–207. [Google Scholar] [CrossRef]
- Baiocchi, G.; Minx, J.; Hubacek, K. The Impact of Social Factors and Consumer Behavior on Carbon Dioxide Emissions in the United Kingdom. J. Ind. Ecol. 2010, 14, 50–72. [Google Scholar] [CrossRef]
- Hanushek, E.A.; Woessmann, L. The Role of Cognitive Skills in Economic Development. J. Econ. Lit. 2008, 46, 607–668. [Google Scholar] [CrossRef] [Green Version]
- Chi, W. The role of human capital in China’s economic development: Review and new evidence. China Econ. Rev. 2008, 19, 421–436. [Google Scholar] [CrossRef]
- Zhang, C.; Zhuang, L. The composition of human capital and economic growth: Evidence from China using dynamic panel data analysis. China Econ. Rev. 2011, 22, 165–171. [Google Scholar] [CrossRef]

| Index | Sub-Indicator | Data Interpretation | Symbol |
|---|---|---|---|
| Size | Total regional population | Total population | TP |
| Demographic trends | Natural population growth rate | PG | |
| Structure | Age structure | Population aged 0–14 | P0–14 |
| Population aged 15–64 | P15–64 | ||
| Population over 65 years old | P65+ | ||
| Urban–rural structure | Population urbanization rate | UR | |
| Employment structure | Employed population in the secondary industry | ES | |
| Employed population in the tertiary industry | ET | ||
| Quality | Education level | Higher education proportion | EP |
| Adult illiteracy rate | IR | ||
| Wealth | National economic output | GDP per capita | GP |
| Consumption ability | Per capita consumption expenditure | CE |
| Degree | State | Symbol | ΔC | ΔP | β |
|---|---|---|---|---|---|
| Decoupling | Strong decoupling | SD | <0 | >0 | <0 |
| Weak decoupling | WD | >0 | >0 | 0 < t < 0.8 | |
| Recessive decoupling | RD | <0 | <0 | >1.2 | |
| Coupling | Recessive coupling | RC | <0 | <0 | 0.8 < t < 1.2 |
| Expansive coupling | EC | >0 | >0 | 0.8 < t < 1.2 | |
| Negative decoupling | Strong negative decoupling | SN | >0 | <0 | <0 |
| Weak negative decoupling | WN | <0 | <0 | 0 < t < 0.8 | |
| Expansive negative decoupling | EN | >0 | >0 | >1.2 |
| Data | Data Description | Year | Source |
|---|---|---|---|
| Population size | Total population and growth trend | 2001–2017 | China Statistical Yearbook |
| Population structure | Urban–rural structure, age, labor force distribution | 2001–2017 | China Statistical Yearbook; The data for 2010 are from the sixth National Population Census Bulletin |
| Population quality | Education level | 2001–2017 | China Statistical Yearbook |
| Personal wealth | Affluence degree | 2001–2017 | China Statistical Yearbook |
| Energy consumption | Fossil energy consumption | 2001–2017 | China Energy Statistical Yearbook |
| Boundaries | Chinese provincial administrative boundary | 2015 | Resources and Environment Science and Data Center, Chinese Academy of Sciences |
| Year | Maximum | Minimum | Max-Min | Average |
|---|---|---|---|---|
| 2001 | 0.38 | 0.20 | 0.18 | 0.25 |
| 2002 | 0.40 | 0.21 | 0.19 | 0.25 |
| 2003 | 0.42 | 0.21 | 0.21 | 0.26 |
| 2004 | 0.43 | 0.21 | 0.22 | 0.27 |
| 2005 | 0.45 | 0.22 | 0.23 | 0.29 |
| 2006 | 0.47 | 0.23 | 0.25 | 0.30 |
| 2007 | 0.49 | 0.24 | 0.25 | 0.31 |
| 2008 | 0.51 | 0.25 | 0.26 | 0.32 |
| 2009 | 0.52 | 0.26 | 0.26 | 0.32 |
| 2010 | 0.56 | 0.27 | 0.29 | 0.35 |
| 2011 | 0.57 | 0.27 | 0.29 | 0.36 |
| 2012 | 0.58 | 0.28 | 0.31 | 0.37 |
| 2013 | 0.59 | 0.29 | 0.31 | 0.38 |
| 2014 | 0.59 | 0.29 | 0.30 | 0.39 |
| 2015 | 0.61 | 0.28 | 0.33 | 0.40 |
| 2016 | 0.63 | 0.29 | 0.35 | 0.41 |
| 2017 | 0.67 | 0.28 | 0.38 | 0.43 |
| Period | ΔC | ΔP | Decoupling Elasticity | Decoupling Degrees |
|---|---|---|---|---|
| 2001–2002 | >0 | >0 | 4.21 | EN |
| 2002–2003 | >0 | >0 | 3.72 | EN |
| 2003–2004 | >0 | >0 | 2.96 | EN |
| 2004–2005 | >0 | >0 | 2.60 | EN |
| 2005–2006 | >0 | >0 | 2.27 | EN |
| 2006–2007 | >0 | >0 | 1.53 | EN |
| 2007–2008 | >0 | >0 | 1.02 | EC |
| 2008–2009 | >0 | >0 | 0.99 | EC |
| 2009–2010 | >0 | >0 | 2.07 | EN |
| 2010–2011 | >0 | >0 | 1.38 | EN |
| 2011–2012 | >0 | >0 | 1.13 | EC |
| 2012–2013 | <0 | >0 | −0.15 | SD |
| 2013–2014 | <0 | >0 | −0.22 | SD |
| 2014–2015 | <0 | >0 | −0.08 | SD |
| 2015–2016 | >0 | >0 | 1.14 | EC |
| 2016–2017 | >0 | >0 | 0.77 | WD |
| 2001–2005 | >0 | >0 | 2.94 | EN |
| 2006–2010 | >0 | >0 | 1.99 | EN |
| 2011–2015 | >0 | >0 | 1.19 | EC |
| 2016–2017 | >0 | >0 | 0.77 | WD |
| Province | Cons | R2 | |||||||||||||
|---|---|---|---|---|---|---|---|---|---|---|---|---|---|---|---|
| Beijing | 0.589 ** | 0.004 ** | −0.233 *** | 0.682 ** | −0.575 ** | 0.62 *** | 0.527 *** | 0.419 ** | 0.069 * | 0.001 | −0.156 *** | 1.548 ** | −0.934 ** | 1.415 *** | 0.95 |
| Tianjin | 1.033 ** | 0.002 | −0.13 * | 0.837 * | −0.254 * | 1.458 ** | 0.779 *** | −0.35 * | 0.106 ** | 0.003 * | 0.215 ** | 0.746 *** | −0.378 ** | 2.566 *** | 0.93 |
| Hebei | 0.891 ** | 0.006 * | −0.018 ** | 0.445 * | −0.046 * | 0.734 *** | 0.433 ** | 0.217 *** | 0.405 ** | 0.005 * | 0.768 ** | 0.371 *** | −0.199 *** | −1.054 *** | 0.94 |
| Shanxi | 0.465 *** | −0.003 ** | −0.007 * | 0.624 ** | −0.087 *** | 0.695 *** | 0.352 *** | 0.423 *** | 0.618 ** | 0.011 | 0.836 *** | 0.262 ** | −0.107 ** | 3.45 *** | 0.97 |
| Inner Mongolia | 0.562 *** | 0.016 | 0.187 * | 1.396 *** | 0.024 ** | 0.339 *** | −0.195 *** | 0.28 ** | 0.525 * | 0.021 | 0.787 ** | −0.543 *** | 0.152 *** | −2.645 *** | 0.96 |
| Liaoning | −0.526 ** | −0.158 ** | −0.122 * | −0.263 ** | 0.394 *** | 0.637 ** | −0.119 *** | 0.135 *** | 0.176 * | 0.032 * | 0.387 *** | 0.214 * | 0.103 * | 3.699 *** | 0.97 |
| Jilin | −0.874 *** | −0.079 * | −0.138 ** | −0.462 * | 0.191 ** | 0.89 *** | −0.273 *** | 0.105 * | 0.254 ** | 0.177 | 0.344 *** | −0.176 *** | 0.462 *** | 2.67*** | 0.92 |
| Heilongjiang | −0.479 ** | −0.165 * | −0.241 | −0.015 *** | 0.452 ** | 0.746 *** | −0.172 *** | 0.078 | 0.125 ** | 0.084 * | 0.92 *** | 0.256 *** | 0.201 ** | 0.983 *** | 0.94 |
| Shanghai | 0.342 * | 0.31 ** | 0.385 *** | 0.874 *** | −0.653 * | 0.839 ** | 0.548 *** | −0.461 ** | 0.11 ** | 0.021 | 0.104 *** | 0.356 *** | −1.529 *** | −3.607 *** | 0.91 |
| Jiangsu | 0.835 ** | 0.024 * | −0.426 ** | 0.262 *** | −0.115 *** | 0.56 *** | 0.137 *** | 0.268 *** | −0.417 | 0.043 * | −0.181 *** | −0.134 ** | −0.296 *** | −0.425 ** | 0.96 |
| Zhejiang | 0.943 ** | 0.16 * | −0.227 ** | 0.396 ** | −0.241 *** | 0.567 *** | 0.253 *** | −0.275 *** | 0.272 ** | 0.05 | 0.174 *** | 0.233 *** | −0.652 ** | −0.782 *** | 0.98 |
| Anhui | −0.684 | 0.037 *** | −0.196 * | −0.125 ** | 0.087 * | 0.239 *** | 0.192 *** | −0.247 * | 0.015 * | 0.027 * | 0.865 ** | 0.223 ** | 0.314 *** | −1.654 *** | 0.98 |
| Fujian | 0.572 *** | 0.186 * | 0.359 | 0.06 *** | −0.254 ** | 0.304 ** | 0.131 *** | 0.107 *** | 0.225 *** | 0.011 | 0.148 *** | 0.435 *** | −0.552 *** | −2.645 *** | 0.96 |
| Jiangxi | 0.631 ** | 0.104 * | −0.165 ** | 0.047 ** | −0.129 ** | 0.402 *** | 0.113 *** | 0.147 *** | 0.093 ** | 0.032 * | 0.106 *** | 0.264 * | −0.118 * | −3.135 *** | 0.95 |
| Shandong | 1.014*** | 0.037 ** | 0.562 ** | 0.106 ** | 0.191 *** | −0.148 *** | 0.105 ** | 0.174 *** | 0.229 * | −0.057 * | 0.133 *** | −0.088 *** | −0.325 *** | −0.647 *** | 0.99 |
| Henan | 0.108 ** | −0.042 | −0.117 *** | 0.625 *** | −0.169 * | 0.43 *** | 0.241 *** | 0.139 ** | 0.238 *** | 0.074 * | 0.201 ** | 0.196 ** | −0.435 ** | −0.342 *** | 0.98 |
| Hubei | −0.126 ** | 0.103 ** | −0.182 * | −0.195 ** | −0.084 * | 0.763 *** | 0.157 ** | 0.099 *** | 0.335 ** | 0.025 ** | −0.142 *** | 0.254 *** | −0.373 *** | −2.051 ** | 0.96 |
| Hunan | 0.675 * | 0.297 | 0.255 | −0.356 ** | 0.217 ** | 0.193 *** | 0.262 *** | 0.108 *** | 0.412 * | 0.164 ** | −0.057 ** | 0.106 * | −0.14 * | −1.956 *** | 0.93 |
| Guangdong | 0.264 * | 0.058 | −0.173 ** | 0.426 *** | −0.113 *** | 0.653 ** | 0.187 *** | −0.08 ** | 0.044 ** | 0.062 * | −0.158 *** | −0.043 *** | −0.384 *** | 0.25 *** | 0.94 |
| Guangxi | 0.392 ** | 0.006 * | 0.075 | 0.101 *** | 0.024 * | 0.586 *** | 0.195 *** | 0.152 *** | 0.325 * | −0.064 * | 0.156 * | 0.266 | 0.152 * | −3.615 *** | 0.91 |
| Hainan | 0.345 ** | −0.197 | −0.161 * | 0.874 ** | −0.105 *** | 0.406 *** | 0.053 *** | 0.076 *** | 0.264 *** | −0.011 | 0.087 *** | 0.092 *** | −0.093 *** | 0.413 *** | 0.95 |
| Chongqing | −0.27 ** | 0.155 | −0.126 ** | 0.154 *** | 0.219 *** | 0.513 * | 0.268 *** | 0.027 ** | 0.112 ** | 0.174 | −0.215 * | −0.139 *** | −0.248 ** | 1.158 *** | 0.95 |
| Sichuan | 0.265 *** | −0.046 * | −0.142 * | 0.349 *** | 0.134 ** | 0.409 *** | 0.115 * | 0.047 *** | 0.025 *** | 0.031 | 0.157 *** | 0.136 *** | −0.154 *** | −0.974 *** | 0.96 |
| Guizhou | 0.437 ** | −0.169 *** | −0.159 * | 0.264 ** | 0.101 *** | 0.223 *** | 0.295 *** | 0.154 ** | 0.132** | 0.227** | 0.076 *** | 0.084 *** | −0.106 *** | −1.482 *** | 0.98 |
| Yunnan | 0.168 * | −0.049 | −0.127 | 0.351 * | 0.145 * | 0.413 *** | 0.126 ** | 0.173 *** | −0.009 *** | 0.242 * | 0.175 *** | 0.153 *** | −0.215 *** | −0.186 *** | 0.93 |
| Shaanxi | 0.582 *** | 0.036 ** | −0.103 ** | 0.517 ** | 0.089 ** | 0.494 ** | 0.164 *** | 0.055 | 0.081*** | 0.107 | 0.187 ** | 0.243 *** | −0.254 * | −2.413 ** | 0.98 |
| Gansu | 0.411 ** | −0.15 * | −0.187 *** | 0.234 ** | 0.073 * | 0.513 *** | 0.195*** | 0.154 * | 0.102 ** | 0.076 * | 0.218 *** | 0.106 * | −0.182 *** | −1.181 *** | 0.94 |
| Qinghai | 0.365 | 0.064 ** | −0.077 * | 0.316 *** | 0.122 ** | 0.435 *** | 0.207** | 0.085 *** | 0.039 * | 0.106 | 0.159 ** | 0.193 ** | −0.25 ** | −1.647 *** | 0.91 |
| Ningxia | 0.284 ** | −0.091 * | −0.111 *** | 0.223 ** | 0.067 ** | 0.369 ** | 0.098** | 0.027 *** | 0.115 *** | 0.17 ** | 0.151 *** | 0.185 *** | 0.086*** | −3.812 ** | 0.95 |
| Xinjiang | 0.162 ** | 0.054 * | 0.138 ** | −0.435 *** | 0.1 | 0.62 *** | 0.195*** | 0.07 * | 0.184 ** | 0.139 ** | 0.159 *** | 0.187 * | −0.164 ** | 1.643 *** | 0.97 |
Publisher’s Note: MDPI stays neutral with regard to jurisdictional claims in published maps and institutional affiliations. |
© 2021 by the authors. Licensee MDPI, Basel, Switzerland. This article is an open access article distributed under the terms and conditions of the Creative Commons Attribution (CC BY) license (https://creativecommons.org/licenses/by/4.0/).
Share and Cite
Zhao, K.; Cui, X.; Zhou, Z.; Huang, P.; Li, D. Exploring the Dependence and Influencing Factors of Carbon Emissions from the Perspective of Population Development. Int. J. Environ. Res. Public Health 2021, 18, 11024. https://doi.org/10.3390/ijerph182111024
Zhao K, Cui X, Zhou Z, Huang P, Li D. Exploring the Dependence and Influencing Factors of Carbon Emissions from the Perspective of Population Development. International Journal of Environmental Research and Public Health. 2021; 18(21):11024. https://doi.org/10.3390/ijerph182111024
Chicago/Turabian StyleZhao, Kuokuo, Xuezhu Cui, Zhanhang Zhou, Peixuan Huang, and Dongliang Li. 2021. "Exploring the Dependence and Influencing Factors of Carbon Emissions from the Perspective of Population Development" International Journal of Environmental Research and Public Health 18, no. 21: 11024. https://doi.org/10.3390/ijerph182111024
APA StyleZhao, K., Cui, X., Zhou, Z., Huang, P., & Li, D. (2021). Exploring the Dependence and Influencing Factors of Carbon Emissions from the Perspective of Population Development. International Journal of Environmental Research and Public Health, 18(21), 11024. https://doi.org/10.3390/ijerph182111024