
Life Cycle Assessment of Cement Production with Marble Waste Sludges

 ,
,  ,
,  ,
,  and
and 
Abstract
:1. Introduction

| Material | Parameters Analyzed * | GHG ** | Functional Unit | Stages Considered | Ref. |
|---|---|---|---|---|---|
| Cement production in Spain | ADP, GWP, ODP, HTP, TETP, POCP, AP, EP, MEP, LUP | 21.6% | 1 ton of grey cement | Cement production. CO2 capture | [37] |
| Cement with cementitious powder waste | GWP | Variable | - | Cement production | [38] |
| Cement production in China | GWP, AP, EP, POCP, HTP | - | 1 ton of cement and with 42.5 MPa | Material acquisition. Processing and transportation to plant. Cement production | [39] |
| Substitution of cement in concrete with supplementary cementing materials | GWP | Variable | 1 m3 of concrete | Material acquisition. Transportation to plant. Concrete production. Final transportation | [40] |
| Mixtures of concrete with blast furnace fly ash and slag | GWP | 32% 62% | 1 m3 of concrete | Material acquisition. Transportation to plant. Concrete production. Final transportation | [41] |
| Self-compacting concrete | GWP | - | 1 m3 of premixed concrete | Premixed | [42] |
| Cement with additives | GWP, EC | 12% | 1 ton of cement | Material acquisition. Processing and transportation to plant. Cement production. | [43] |
| Construction product recycling | GWP | - | Cement production demand. Reference flow | Landfill. Downstream recycling. Recycling. Recycling after selective demolition | [44] |
| Concrete with ash from wastewater treatment plant sludges | ADP, GWP, ODP, HTP, TETP, POCP, AP, EP | 9% | 1 m3 of premixed concrete | Transportation and premixing | [45] |
| Cement with granite sludges | EC | - | - | Test tube preparation | [46] |
| Cement mortars with plastic waste and carbon fibers | GWP, EC | 13.69% | 1 m3 of cement paste | Cement production | [47] |
| Self-compacting concrete reducing binding material | GWP | 16% | 1 m3 of premixed concrete | Concrete production | [48] |
| Cement mortar with glass powder | GWP, ODP, AP, EP, POCP | 20% | 100 bags of cement | Cement production | [49] |
| Concrete reducing cement, adding metakaolin and steel fibers | GWP | Variable | 1 m3 of premixed concrete | Obtaining raw material Fresh concrete production. Transportation | [50] |
| Ornamental stone waste added to cement | GWP, EC | 9% | 1 kg of product | Additive drying. Cement production. Transportation | [51] |
2. Materials and Methods
2.1. Marble Waste Sludges
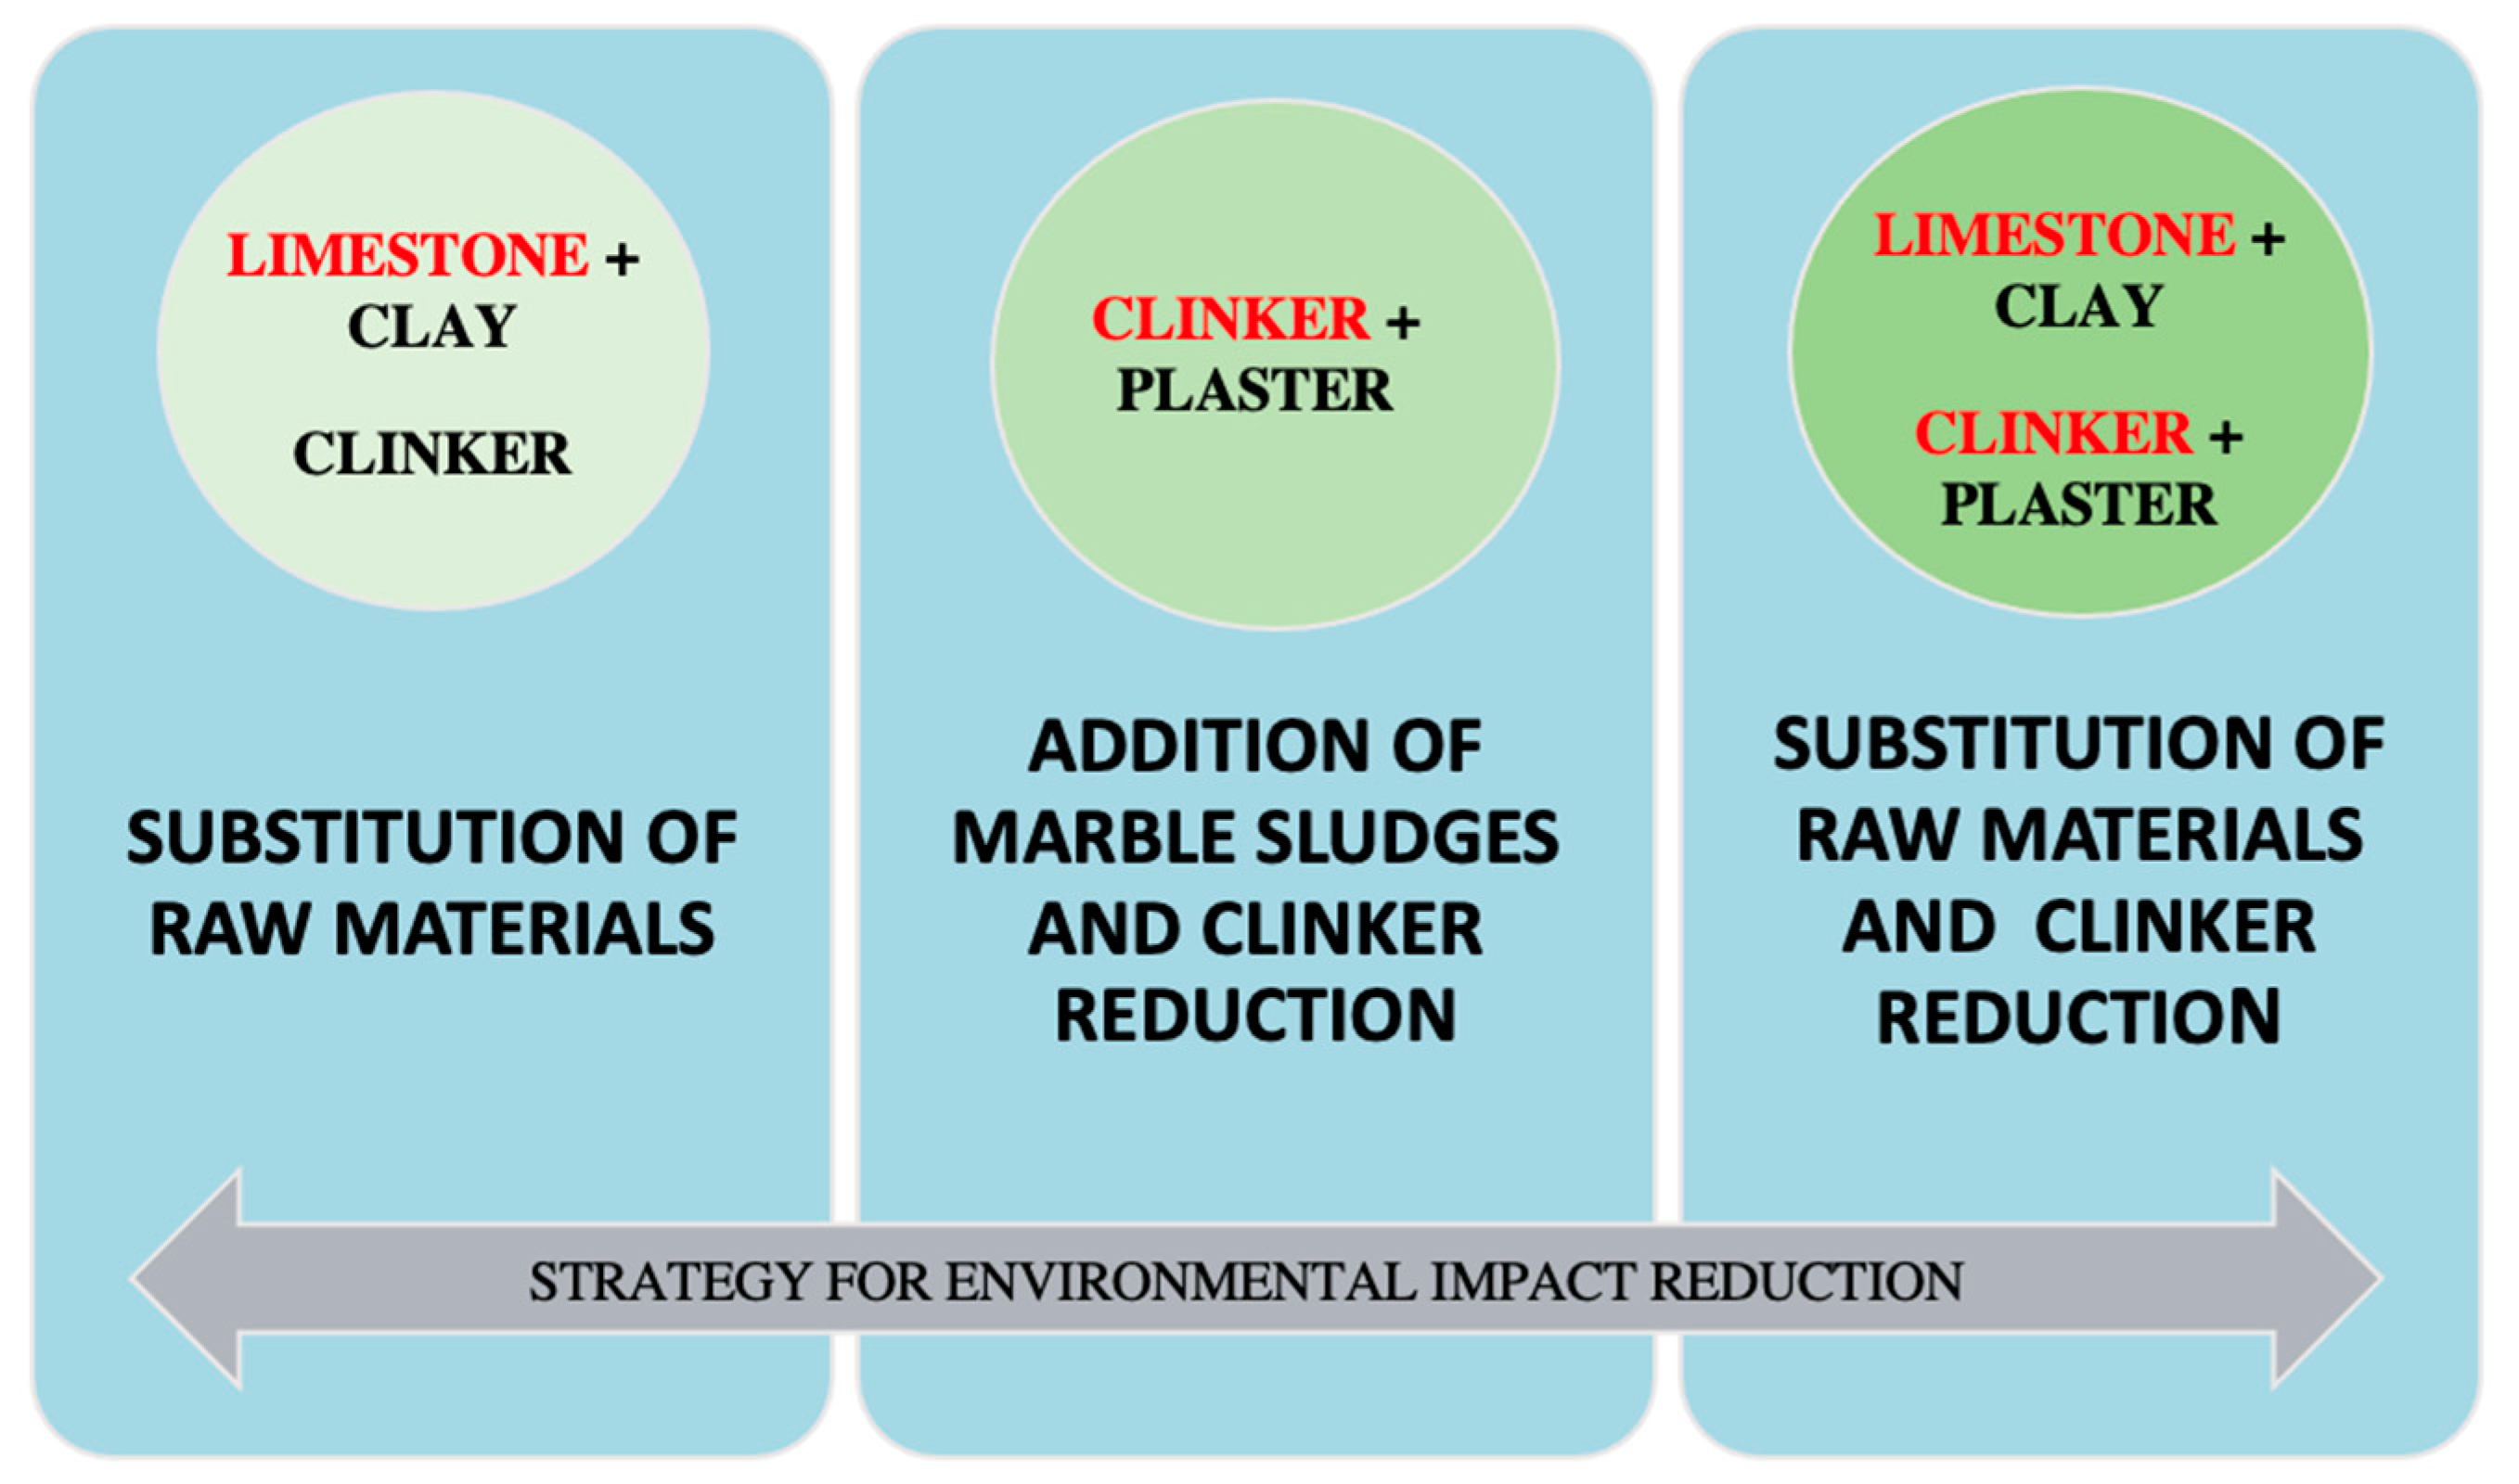
2.2. Study Strategies for Reducing Environmental Impacts
- Utilization of carbonated sludge as substitute for raw materials used to produce cement clinker, maintaining composition percentages.
- Utilization of carbonated sludge as additive, reducing the percentage clinker in cement (by weight) to obtain CEM-II cement.
- Utilization of carbonated sludge to replace the raw materials that form the clinker, obtaining CEM-II cements with different proportions of carbonated sludge.
2.3. Scope, System Boundary, and LCA Methodology
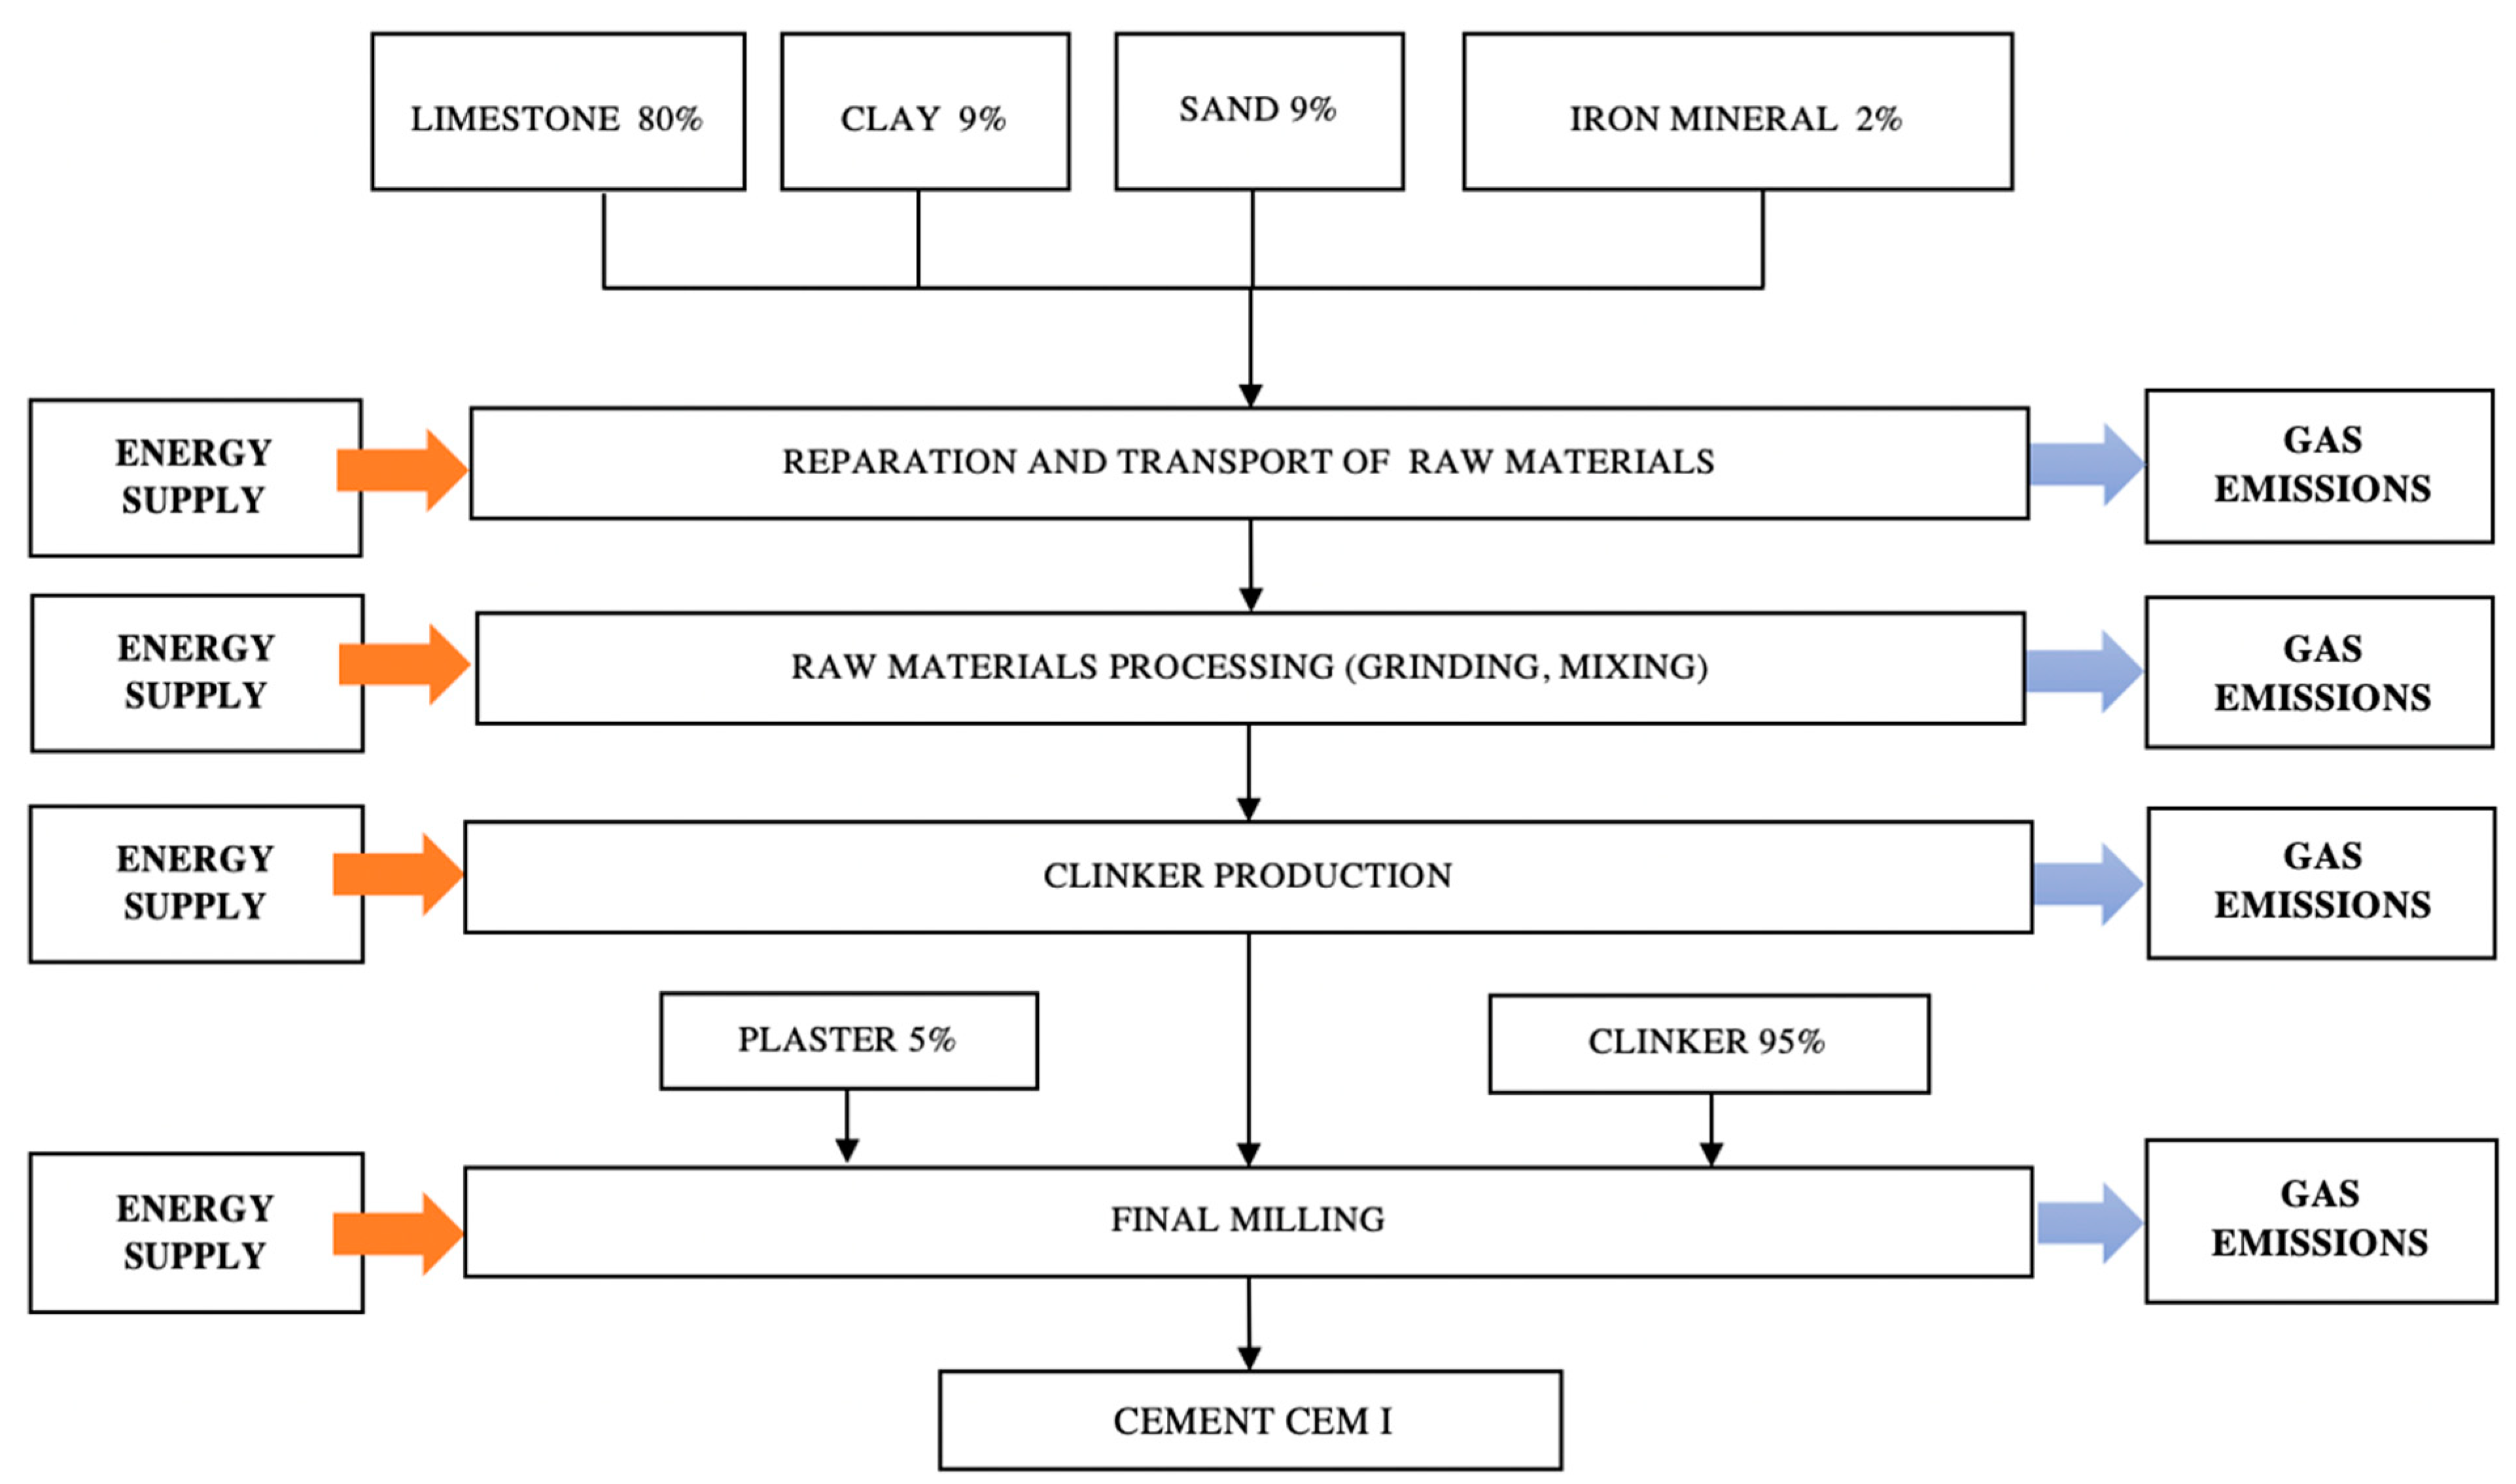
2.3.1. Scope of the Study
2.3.2. Functional Unit
- Definition of the objectives and scope, making key decisions on the configuration and definition of the system under study.
- Inventory analysis, identifying and quantifying the energy, water, and materials used and environmental emissions, including solid waste, gas emissions, and wastewater discharge.
- Evaluation of the LCIA to identify and assess the amount and importance of potential environmental impacts. Inputs and outputs are first assigned to impact categories, and their potential impacts are quantified according to characterization factors. This step provides details on the indicators resulting from all impact categories; the importance of each impact category is evaluated by normalization and, finally, by weighting.
- The last phase comprises the interpretation and review of results, determination of data sensitivity, and presentation of conclusions.
2.3.3. System Boundary
2.3.4. Life Cycle Inventory Analysis and Impact Assessment
3. Results
4. Conclusions
Supplementary Materials
Author Contributions
Funding
Institutional Review Board Statement
Informed Consent Statement
Acknowledgments
Conflicts of Interest
References
- US Geological Survey. Cement Production Globally and in the U.S. from 2010 to 2019 (in Million Metric Tons) [Graph]. In Statista. Available online: https://www.statista.com/statistics/219343/cement-production-worldwide/ (accessed on 12 July 2021).
- International Energy Agency. Low-Carbon Transition in the Cement Industry: Technology Roadmap. Available online: https://www.iea.org/reports/technology-roadmap-low-carbon-transition-in-the-cement-industry (accessed on 12 July 2021).
- Worrell, E.; Price, L.; Martin, N.; Hendriks, C.; Meida, L.O. Carbon Dioxide Emissions from the Global Cement Industry. Annu. Rev. Energy Environ. 2001, 26, 303–329. [Google Scholar] [CrossRef]
- Lehne, J.; Preston, F. Making Concrete Change: Innovation in Low-Carbon Cement and Concrete; Chatham House—The Royal Institute of International Affairs: London, UK, 2018. [Google Scholar]
- Andrew, R.M. Global CO2 Emissions from Cement Production, 1928–2018. Earth Syst. Sci. Data 2019, 11, 1675–1710. [Google Scholar] [CrossRef] [Green Version]
- Huntzinger, D.N.; Eatmon, T. A life-cycle assessment of Portland cement manufacturing: Comparing the traditional process with alternative technologies. J. Clean. Prod. 2009, 17, 668–675. [Google Scholar] [CrossRef]
- Chen, C.; Habert, G.; Bouzidi, Y.; Jullien, A. Environmental impact of cement production: Detail of the different processes and cement plant variability evaluation. J. Clean. Prod. 2010, 18, 478–485. [Google Scholar] [CrossRef]
- Puertas, F.; García-Díaz, I.; Barba-Juan, A.; Gazulla, M.; Palacios, M.; Gómez-Tena, M.P.; Martinez-Ramirez, S. Ceramic wastes as alternative raw materials for Portland cement clinker production. Cem. Concr. Compos. 2008, 30, 798–805. [Google Scholar] [CrossRef]
- Kim, S.-H.; Hwang, J.-P. The CO2 Emission in the Process of Cement Manufacture Depending on CaO Content. J. Korea Concr. Inst. 2013, 25, 365–370. [Google Scholar] [CrossRef] [Green Version]
- Cement Sustainability Initiative. Global Cement Data Base on CO2 and Energy Information, GNR. Getting the Numbers Right Database, Gross CO2 Emissions. Ratios: Weighted Average, World 21% Coverage in 2018. Available online: https://cutt.ly/bh59mBK (accessed on 24 December 2020).
- Cement Sustainability Initiative. CSI Global Cement Data Base on CO2 and Energy Information, GNR. Getting the Numbers Right Database, Gross CO2 Emissions. Ratios: Weighted Average, Spain 63% Coverage in 2018. Available online: https://cutt.ly/th59b7i (accessed on 24 December 2020).
- Schneider, M. The cement industry on the way to a low-carbon future. Cem. Concr. Res. 2019, 124, 105792. [Google Scholar] [CrossRef]
- European Commission. Paris Agreement. Available online: https://cutt.ly/Ch59gtV (accessed on 22 December 2020).
- Aruntaş, H.Y.; Gürü, M.; Dayi, M.; Tekin, I. Utilization of waste marble dust as an additive in cement production. Mater. Des. 2010, 31, 4039–4042. [Google Scholar] [CrossRef]
- Bignozzi, M. The Use of Industrial Waste for the Production of New Blended Cement. In Waste Management: Research Advances to Convert Waste to Wealth; Nova Science Publishers, Inc.: Hauppauge, NY, USA, 2010. [Google Scholar]
- Kavas, T.; Olgun, A. Properties of Cement and Mortar Incorporating Marble Dust and Crushed Brick. Ceram. Silik. 2008, 52, 24. [Google Scholar]
- Yen, C.-L.; Tseng, D.-H.; Lin, T.-T. Characterization of eco-cement paste produced from waste sludges. Chemosphere 2011, 84, 220–226. [Google Scholar] [CrossRef]
- Baeza, F.; Payá, J.; Galao, O.; Saval, J.; Garcés, P. Blending of industrial waste from different sources as partial substitution of Portland cement in pastes and mortars. Constr. Build. Mater. 2014, 66, 645–653. [Google Scholar] [CrossRef]
- Prusty, J.K.; Patro, S.K.; Basarkar, S. Concrete using agro-waste as fine aggregate for sustainable built environment—A review. Int. J. Sustain. Built Environ. 2016, 5, 312–333. [Google Scholar] [CrossRef] [Green Version]
- Grilo, M.J.; Pereira, J.; Costa, C. Waste Marble Dust Blended Cement. Mater. Sci. Forum 2012, 730–732, 671–676. [Google Scholar] [CrossRef]
- Ashish, D.K. Concrete made with waste marble powder and supplementary cementitious material for sustainable development. J. Clean. Prod. 2019, 211, 716–729. [Google Scholar] [CrossRef]
- Singh, M.; Srivastava, A.; Bhunia, D. Long term strength and durability parameters of hardened concrete on partially replacing cement by dried waste marble powder slurry. Constr. Build. Mater. 2019, 198, 553–569. [Google Scholar] [CrossRef]
- de Brito, J.; Kurda, R. The past and future of sustainable concrete: A critical review and new strategies on cement-based materials. J. Clean. Prod. 2021, 281, 123558. [Google Scholar] [CrossRef]
- Chen, J.; Kwan, A.; Jiang, Y. Adding limestone fines as cement paste replacement to reduce water permeability and sorptivity of concrete. Constr. Build. Mater. 2014, 56, 87–93. [Google Scholar] [CrossRef]
- Perera, A.G.; Dionisio, M.D.P.S.; Sancha, P. Alternativas de reducción de las emisiones de dióxido de carbono (C02) en la producción de cemento. Propuesta de un modelo de evaluación. Innovar 2016, 26, 51–66. [Google Scholar] [CrossRef]
- European Commission. European Platform on Life Cycle Assessment (LCA). Available online: https://cutt.ly/6h59vTl (accessed on 25 December 2020).
- Gursel, A.P.; Masanet, E.; Horvath, A.; Stadel, A. Life-cycle inventory analysis of concrete production: A critical review. Cem. Concr. Compos. 2014, 51, 38–48. [Google Scholar] [CrossRef]
- Aguado, A.; Josa, A.; Cardim, A. Strengths and Weaknesses of Life Cycle Inventories (LCI) of Cement for Its Use in Life Assesments (LCA). In Boletin de la Sociedad Espanola de Ceramica y Vidrio; Sociedad Espanola de Ceramica y Vidrio: Madrid, Spain, 2004; Volume 43, pp. 587–590. [Google Scholar] [CrossRef]
- European Commission; Joint Research Centre; Institute for Environment and Sustainability. International Reference Life Cycle Data System (ILCD) Handbook General Guide for Life Cycle Assessment: Provisions and Action Steps; Publications Office of the European Union: Luxembourg, 2011. [Google Scholar]
- Tam, V.W.; Li, J.; Cai, H. System dynamic modeling on construction waste management in Shenzhen, China. Waste Manag. Res. 2014, 32, 441–453. [Google Scholar] [CrossRef] [PubMed]
- Ding, Z.; Wang, Y.; Zou, P. An agent based environmental impact assessment of building demolition waste management: Conventional versus green management. J. Clean. Prod. 2016, 133, 1136–1153. [Google Scholar] [CrossRef] [Green Version]
- Yuan, H. A model for evaluating the social performance of construction waste management. Waste Manag. 2012, 32, 1218–1228. [Google Scholar] [CrossRef]
- An, J.; Middleton, R.S.; Li, Y. Environmental Performance Analysis of Cement Production with CO2 Capture and Storage Technology in a Life-Cycle Perspective. Sustainability 2019, 11, 2626. [Google Scholar] [CrossRef] [Green Version]
- Wu, H.; Zuo, J.; Yuan, H.; Zillante, G.; Wang, J. A review of performance assessment methods for construction and demolition waste management. Resour. Conserv. Recycl. 2019, 150, 104407. [Google Scholar] [CrossRef]
- Nicoara, A.I.; Grumezescu, A.M.; Vrabec, M.; Šmuc, N.R.; Šturm, S.; Ow-Yang, C.; Gulgun, M.A.; Bundur, Z.B.; Ciuca, I.; Vasile, B.S. End-of-Life Materials Used as Supplementary Cementitious Materials in the Concrete Industry. Materials 2020, 13, 1954. [Google Scholar] [CrossRef] [PubMed] [Green Version]
- Scrivener, K.L.; John, V.M.; Gartner, E.M. Eco-efficient cements: Potential economically viable solutions for a low-CO2 cement-based materials industry. Cem. Concr. Res. 2018, 114, 2–26. [Google Scholar] [CrossRef]
- García-Gusano, D.; Garraín, D.; Herrera, I.; Cabal, H.; Lechón, Y. Life Cycle Assessment of applying CO2 post-combustion capture to the Spanish cement production. J. Clean. Prod. 2015, 104, 328–338. [Google Scholar] [CrossRef]
- Kwon, E.; Ahn, J.; Cho, B.; Park, D. A study on development of recycled cement made from waste cementitious powder. Constr. Build. Mater. 2015, 83, 174–180. [Google Scholar] [CrossRef]
- Li, C.; Cui, S.; Nie, Z.; Gong, X.; Wang, Z.; Itsubo, N. The LCA of portland cement production in China. Int. J. Life Cycle Assess. 2015, 20, 117–127. [Google Scholar] [CrossRef]
- Yang, K.-H.; Jung, Y.-B.; Cho, M.-S.; Tae, S.-H. Effect of supplementary cementitious materials on reduction of CO2 emissions from concrete. J. Clean. Prod. 2015, 103, 774–783. [Google Scholar] [CrossRef]
- Tait, M.W.; Cheung, W.M. A comparative cradle-to-gate life cycle assessment of three concrete mix designs. Int. J. Life Cycle Assess. 2016, 21, 847–860. [Google Scholar] [CrossRef] [Green Version]
- Esmaeilkhanian, B.; Khayat, K.; Wallevik, O.H. Mix design approach for low-powder self-consolidating concrete: Eco-SCC—Content optimization and performance. Mater. Struct. 2017, 50, 124. [Google Scholar] [CrossRef]
- Hossain, U.; Poon, C.S.; Lo, I.M.C.; Cheng, J.C. Comparative LCA on using waste materials in the cement industry: A Hong Kong case study. Resour. Conserv. Recycl. 2017, 120, 199–208. [Google Scholar] [CrossRef]
- Di Maria, A.; Eyckmans, J.; van Acker, K. Downcycling versus recycling of construction and demolition waste: Combining LCA and LCC to support sustainable policy making. Waste Manag. 2018, 75, 3–21. [Google Scholar] [CrossRef] [PubMed]
- Nakic, D. Environmental evaluation of concrete with sewage sludge ash based on LCA. Sustain. Prod. Consum. 2018, 16, 193–201. [Google Scholar] [CrossRef]
- Medina, G.; del Bosque, I.S.; Frías, M.; de Rojas, M.S.; Medina, C. Energy performance and calorimetric behaviour of cements bearing granite sludge. Powder Technol. 2019, 356, 517–527. [Google Scholar] [CrossRef]
- Akbar, A.; Liew, K. Assessing recycling potential of carbon fiber reinforced plastic waste in production of eco-efficient cement-based materials. J. Clean. Prod. 2020, 274, 123001. [Google Scholar] [CrossRef]
- Ali, Z.S.; Hosseinpoor, M.; Yahia, A. New aggregate grading models for low-binder self-consolidating and semi-self-consolidating concrete (Eco-SCC and Eco-semi-SCC). Constr. Build. Mater. 2020, 265, 120314. [Google Scholar] [CrossRef]
- Patel, D.; Shrivastava, R.; Tiwari, R.; Yadav, R. Properties of cement mortar in substitution with waste fine glass powder and environmental impact study. J. Build. Eng. 2020, 27, 100940. [Google Scholar] [CrossRef]
- Mehdipour, S.; Nikbin, I.; Dezhampanah, S.; Mohebbi, R.; Moghadam, H.; Charkhtab, S.; Moradi, A. Mechanical properties, durability and environmental evaluation of rubberized concrete incorporating steel fiber and metakaolin at elevated temperatures. J. Clean. Prod. 2020, 254, 120126. [Google Scholar] [CrossRef]
- Zulcão, R.; Calmon, J.L.; Rebello, T.A.; Vieira, D.R. Life cycle assessment of the ornamental stone processing waste use in cement-based building materials. Constr. Build. Mater. 2020, 257, 119523. [Google Scholar] [CrossRef]
- Chaid, R.; Rendell, F.; Jauberthie, R. Impact or Marble Powder Combined with Limestone CEM II on Concrete Durability. In Proceedings of the 13th Congress of the Chemistry of Cement, Madrid, Spain, 3–8 July 2011. [Google Scholar]
- Kaliyavaradhan, S.K.; Ling, T.-C.; Mo, K.H. Valorization of waste powders from cement-concrete life cycle: A pathway to circular future. J. Clean. Prod. 2020, 268, 122358. [Google Scholar] [CrossRef]
- Schneider, M.; Romer, M.; Tschudin, M.; Bolio, H. Sustainable cement production—Present and future. Cem. Concr. Res. 2011, 41, 642–650. [Google Scholar] [CrossRef]
- Nisbet, M.; Vangeem, M.; Consultants, J.; van Geem, M.C. Environmental Life Cycle Inventory of Portland Cement and Concrete. Environmental Life Cycle Inventory; Portland Cement Association: Skokie, IL, USA, 2002. [Google Scholar]
- International Organization for Standardization: ISO 14040. Environmental Management—Life Cycle Assessment—Principles and Framework; International Organization for Standardization: Geneva, Switzerland, 2006. [Google Scholar]
- Flower, D.J.M.; Sanjayan, J.G. Green house gas emissions due to concrete manufacture. Int. J. Life Cycle Assess. 2007, 12, 282–288. [Google Scholar] [CrossRef]
- Serres, N.; Braymand, S.; Feugeas, F. Environmental evaluation of concrete made from recycled concrete aggregate implementing life cycle assessment. J. Build. Eng. 2016, 5, 24–33. [Google Scholar] [CrossRef]
- Griggs, D.J.; Noguer, M. Climate Change 2001: The Scientific Basis. Contribution of Working Group I to the Third Assessment Report of the Intergovernmental Panel on Climate Change. Weather 2002, 57, 267–269. [Google Scholar] [CrossRef]
- Huijbregts, M.A.; Hellweg, S.; Frischknecht, R.; Hungerbühler, K.; Hendriks, A.J. Ecological footprint accounting in the life cycle assessment of products. Ecol. Econ. 2008, 64, 798–807. [Google Scholar] [CrossRef]
- Collins, F. Inclusion of carbonation during the life cycle of built and recycled concrete: Influence on their carbon footprint. Int. J. Life Cycle Assess. 2010, 15, 549–556. [Google Scholar] [CrossRef]
- Ortiz, O.; Castells, F.; Sonnemann, G. Sustainability in the construction industry: A review of recent developments based on LCA. Constr. Build. Mater. 2009, 23, 28–39. [Google Scholar] [CrossRef]
- Masanet, E. Reducing California’s Greenhouse Gas Emissions through Product Life-Cycle Optimization; Lawrence Berkeley National Laboratory: Berkeley, CA, USA, 2005. [Google Scholar]
- Lippiatt, B.C.; Ahmad, S. Measuring the Life-Cycle Environmental and Economic Performance of Concrete: The Bees Approach; International Workshop on Sustainable Development and Concrete Technology: Beijing, China, 2004. [Google Scholar]
- Gäbel, K.; Forsberg, P.; Tillman, A.-M. The design and building of a lifecycle-based process model for simulating environmental performance, product performance and cost in cement manufacturing. J. Clean. Prod. 2004, 12, 77–93. [Google Scholar] [CrossRef] [Green Version]
- de la Presidencia, M. Real Decreto 256/2016, de 10 de Junio, Por El Que Se Aprueba La Instrucción Para La Recepción de Cementos RC-16; Agencia Estatal Boletín Oficial del Estado: Madrid, Spain, 2016; Volume 153, pp. 45755–45824. [Google Scholar]
- Goedkoop, M.J.; Oele, M.; de Schrywer, A.; Vieira, M. SimaPro Database Manual: Methods Library; PReConsultants: Amersfoort, The Netherlands, 2008. [Google Scholar]
- Guinée, J.B.; Lindeijer, E. Handbook on Life Cycle Assessment: Operational Guide to the ISO Standards; Springer Science & Business Media: Dordrecht, The Netherlands, 2002; Volume 7. [Google Scholar]
- von Bahr, B.; Hanssen, O.; Vold, M.; Pott, G.; Stoltenberg-Hansson, E.; Steen, B. Experiences of environmental performance evaluation in the cement industry. Data quality of environmental performance indicators as a limiting factor for Benchmarking and Rating. J. Clean. Prod. 2003, 11, 713–725. [Google Scholar] [CrossRef]
- Panesar, D.K.; Seto, K.E.; Churchill, C.J. Impact of the selection of functional unit on the life cycle assessment of green concrete. Int. J. Life Cycle Assess. 2017, 22, 1969–1986. [Google Scholar] [CrossRef]
- Hertwich, E.G. Consumption and the Rebound Effect: An Industrial Ecology Perspective. J. Ind. Ecol. 2005, 9, 85–98. [Google Scholar] [CrossRef] [Green Version]


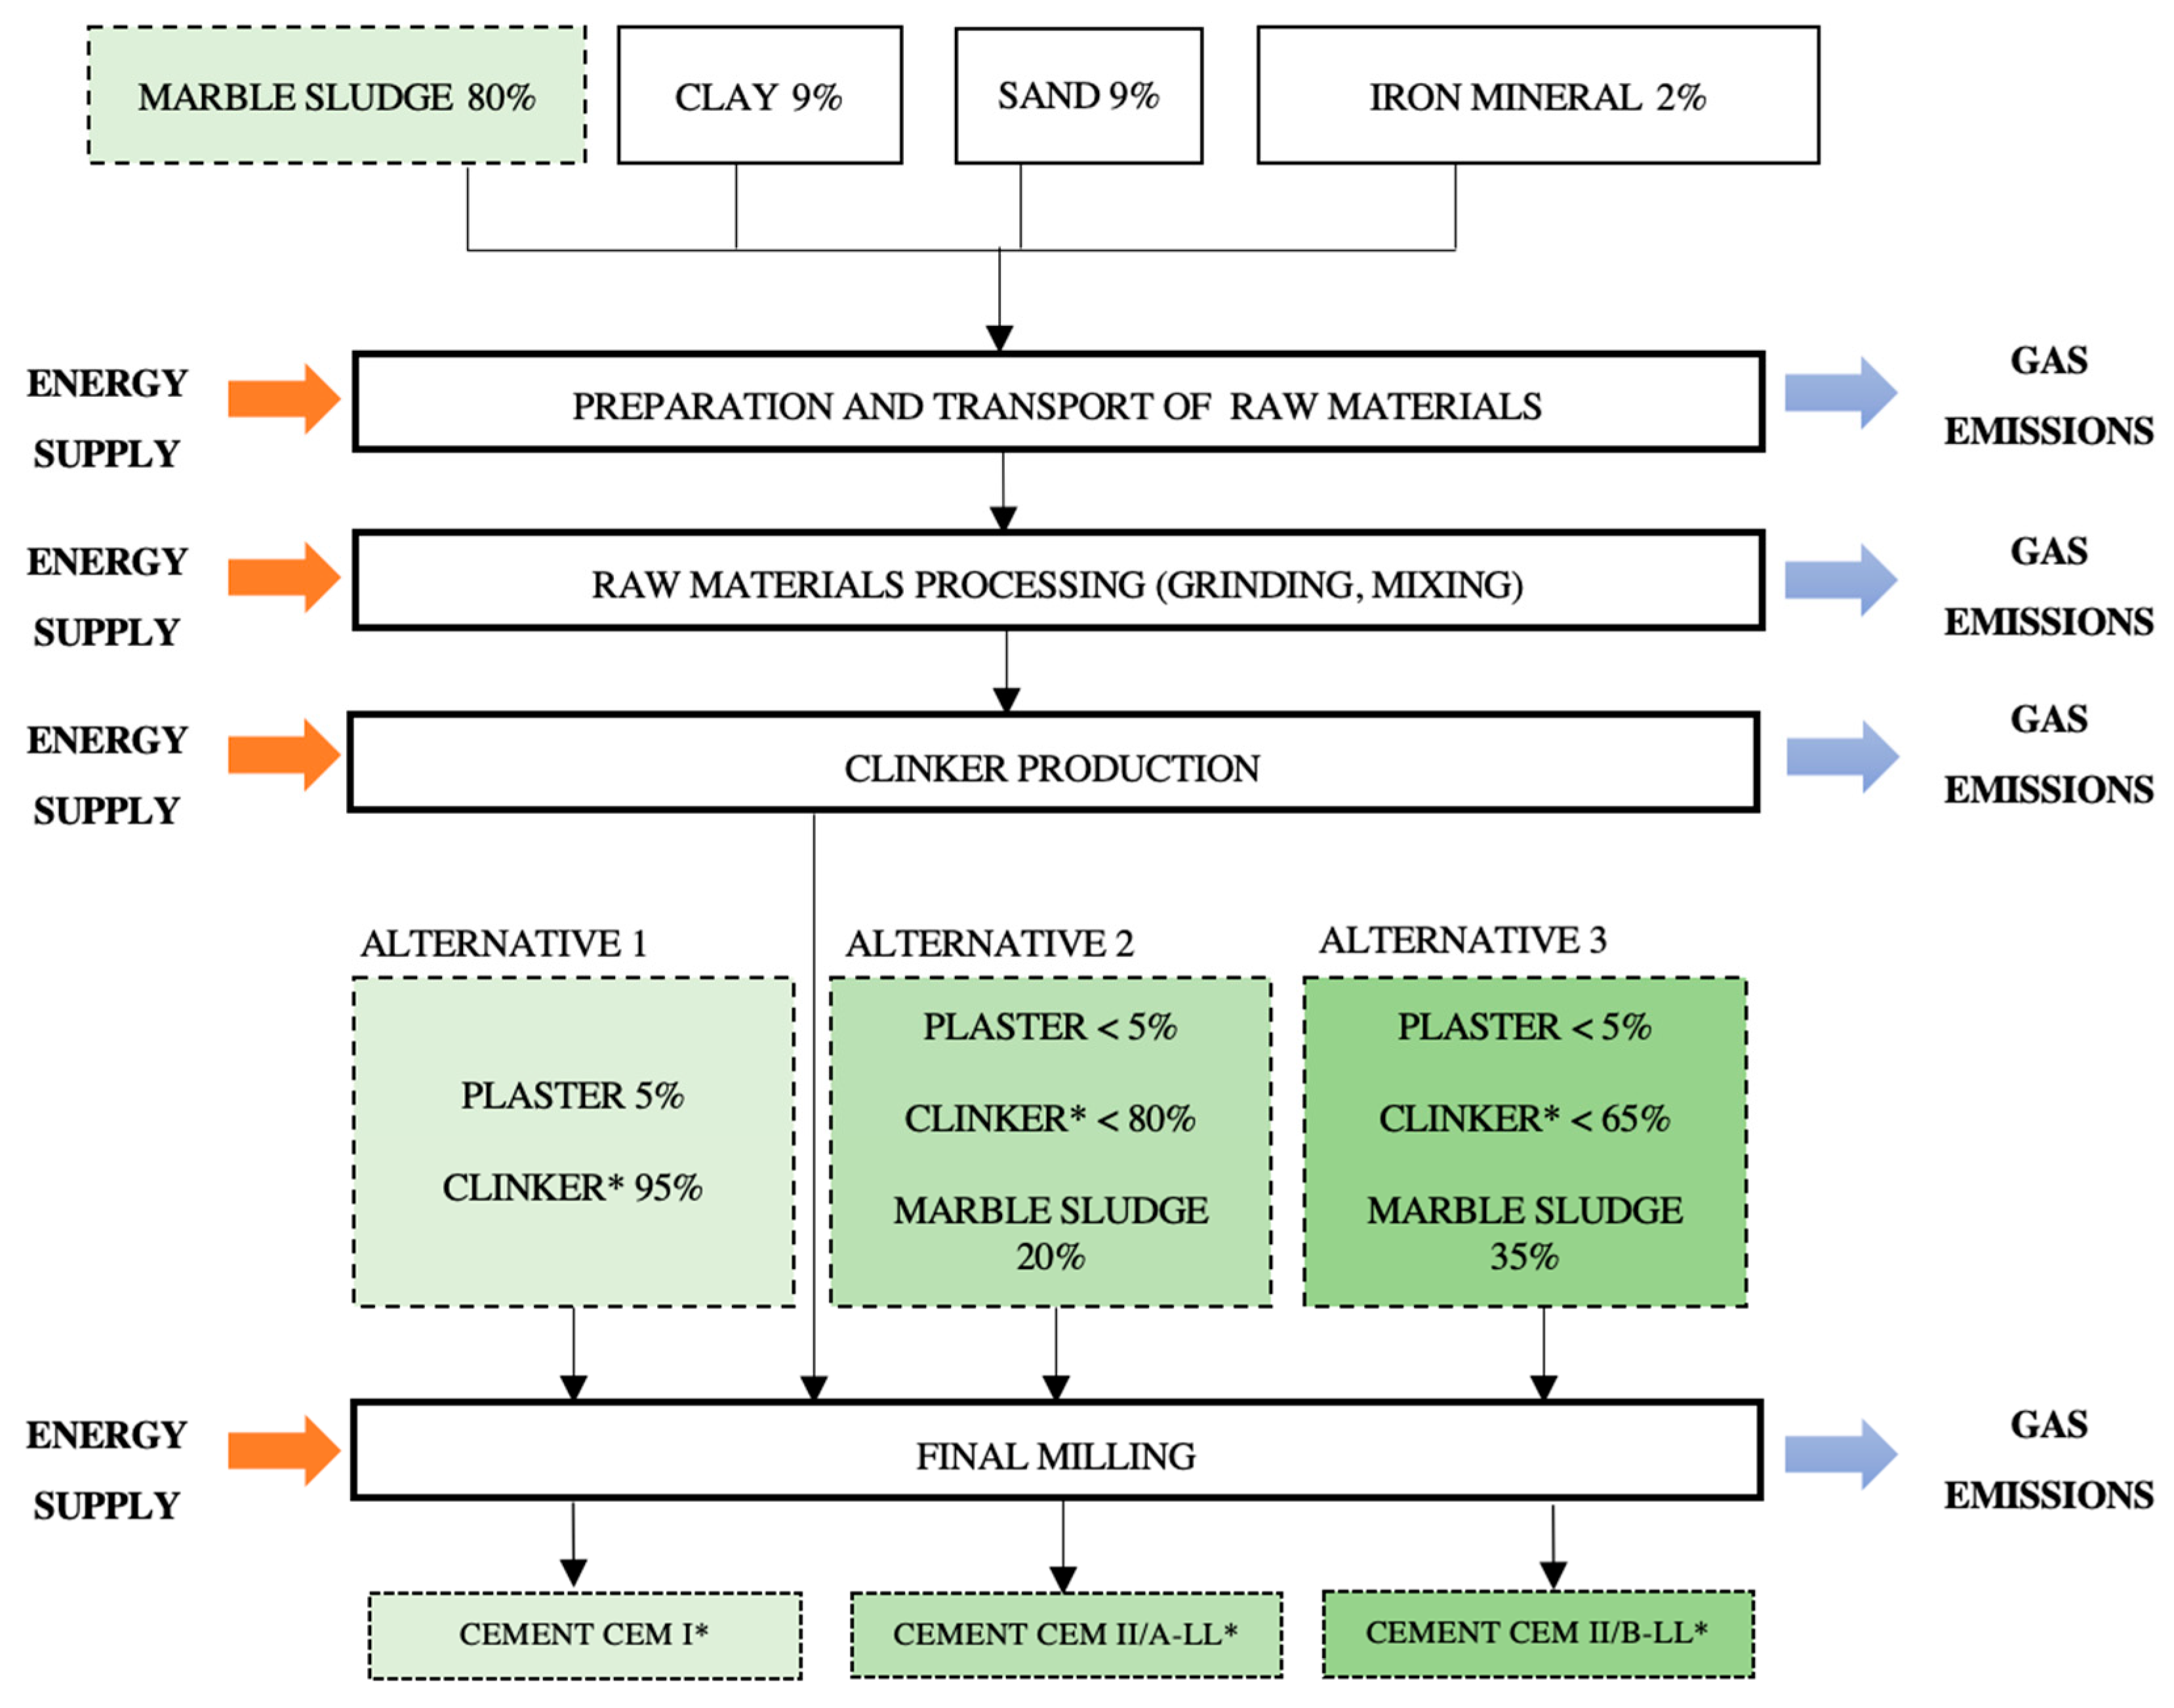

| Materials | Type of Cement (RC-16) | ||
| CEM I | CEM II/A-LL | CEM II/B-LL | |
| Clinker | 95–100% | 80–94% | 65–79% |
| Plaster | <5% | <5% | <5% |
| Limestone | - | <20% | <35% |
| Materials | Type of Cement | ||
| CEM I * | CEM II/A-LL * | CEM II/B-LL * | |
| Clinker | 95–100% | 80–94% | 65–79% |
| Plaster | <5% | <5% | <5% |
| Carbonated sludge | 80% of raw cement | 80% of raw + <20% | 80% of raw + <35% |
| Component | Basic Process | Limestone Substitution and 35% Additives | Data Source |
|---|---|---|---|
| Clinker | Clinker * | ||
| Coal | 4.90 × 10⁻² kg/kg | 4.90 × 10⁻² kg/kg | Factory |
| Petroleum coke | 6.50 × 10⁻² kg/kg | 6.50 × 10⁻² kg/kg | Factory |
| Fuel oil | 0.0122 kg/kg | 0.0122 kg/kg | Factory |
| Diesel | 0.001 kg/kg | 0.001 kg/kg | Factory |
| Natural gas | 1.06 × 10⁻⁴ MJ/kg | 1.06 × 10⁻⁴ MJ/kg | Factory |
| CO2 from fuels | 0.390 kg/kg | 0.390 kg/kg | Ecoinvent |
| CO2 from limestone | 0.295 kg/kg | 0.303 kg/kg | Ecoinvent |
| Slag | 0.213 kg/kg | 0.218 kg/kg | Factory |
| Sandstone | 0.071 kg/kg | 0.072 kg/kg | Factory |
| Lamellae | 0.012 kg/kg | 0.012 kg/kg | Factory |
| Limestone/Marble waste sludge powder | 0.705 kg/kg | 0.698 kg/kg | Factory |
| EE in clinker | 0.0476 KWh/kg | 0.0476 KWh/kg | Ecoinvent |
| EE in raw cement milling | 0.048 KWh/kg | 0.012 KWh/kg | Ecoinvent |
| Process water | 0.00059 m3/kg | 0.00059 m3/kg | Factory |
| Drinking water | 0.000447 ton/kg | 0.000447 ton/kg | Factory |
| Transport by truck | 0.188 tkm/kg | 0.224 tkm/kg | Ecoinvent |
| Transport by boat | 0.17 tkm/kg | - | Ecoinvent |
| CEMENT | CEM I | CEM II/B-LL * | |
| Transport by truck | 0.0606 tkm/kg | 0.1225 tkm/kg | Ecoinvent |
| Total clinker consumed | 0.950 kg/kg | 0.603 kg/kg | Factory |
| Plaster | 0.050 kg/kg | 0.041 kg/kg | Factory |
| Marble waste sludge powder | 0 kg/kg | 0.355 kg/kg | - |
| Electrical energy | 0.052 KWh/kg | 0.0338 KWh/kg | Ecoinvent |
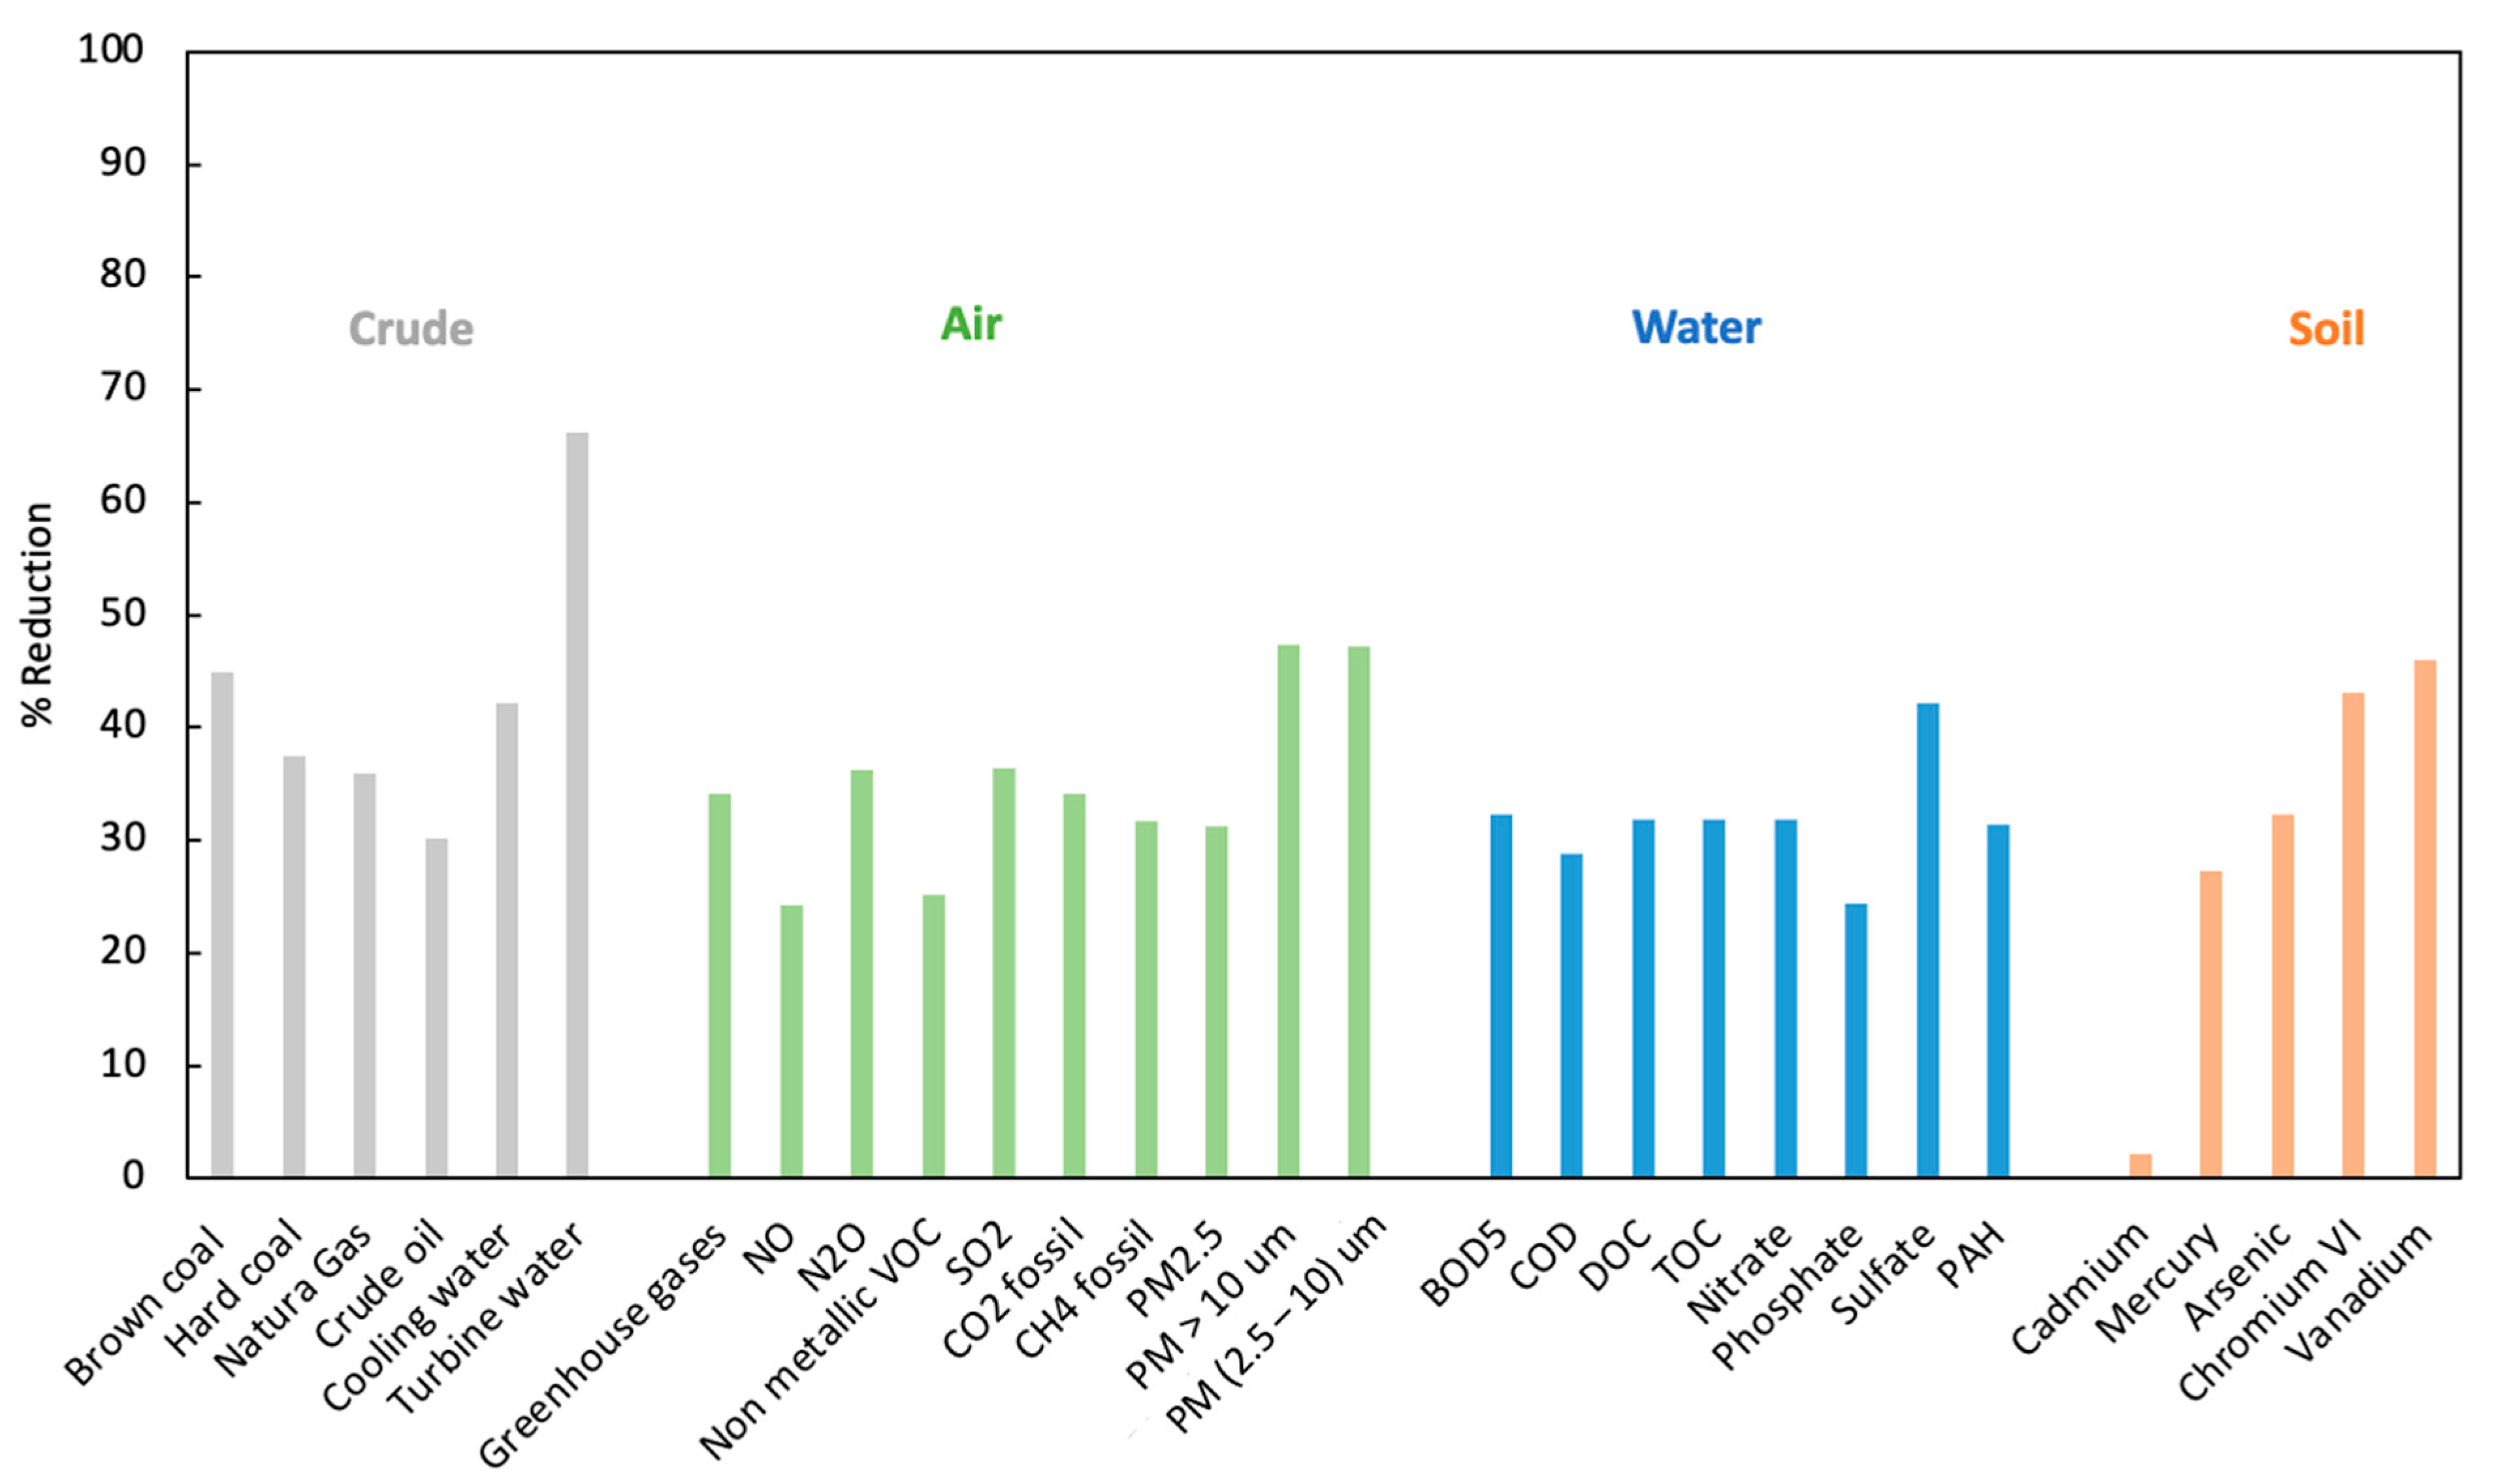
| Substance | Section | Unit | Normal Process | Process with Limestone Substitution and 35% Additives |
|---|---|---|---|---|
| Coal, brown, in soil | Raw | kg | 2.6018 × 10⁻² | 1.4320 × 10⁻² |
| Coal, hard, not specified, in soil | Raw | kg | 8.1269 × 10⁻² | 5.0780 × 10⁻² |
| Gas, natural, in soil | Raw | m3 | 1.6506 × 10⁻² | 1.0564 × 10⁻² |
| Oil, crude, in soil | Raw | kg | 1.1691 × 10⁻¹ | 8.1591 × 10⁻² |
| Water, cooling, natural origin not specified/m3 | Raw | m3 | 3.1323 × 10⁻³ | 1.8084 × 10⁻³ |
| Water, turbine use, natural origin not specified | Raw | m3 | 1.3589 | 4.5948 × 10⁻¹ |
| Carbon dioxide, fossil | Air | kg | 8.4230 × 10⁻¹ | 5.5511 × 10⁻¹ |
| Dinitrogen monoxide | Air | kg | 7.0630 × 10⁻⁶ | 4.4983 × 10⁻⁶ |
| Methane, fossil | Air | kg | 4.7811 × 10⁻⁴ | 3.2678 × 10⁻⁴ |
| GHG | Air | kg | 8.5636 × 10⁻¹ | 5.6462 × 10⁻¹ |
| Nitrogen oxide | Air | kg | 1.5937 × 10⁻³ | 1.2070 × 10⁻³ |
| NMVOC | Air | kg | 2.9612 × 10⁻⁴ | 2.2172 × 10⁻⁴ |
| Particles, <2.5 um | Air | kg | 8.9508 × 10⁻⁵ | 6.1561 × 10⁻⁵ |
| Particles, >10 um | Air | kg | 3.5062 × 10⁻⁴ | 1.8458 × 10⁻⁴ |
| Particles, >2.5 um and <10 um | Air | kg | 1.0298 × 10⁻⁴ | 5.4322 × 10⁻⁵ |
| Sulfur dioxide | Air | kg | 3.3898 × 10⁻³ | 2.1530 × 10⁻³ |
| BOD5, biological oxygen demand | Water | kg | 1.3404 × 10⁻³ | 9.0632 × 10⁻⁴ |
| COD, chemical oxygen demand | Water | kg | 1.5508 × 10⁻³ | 1.1052 × 10⁻³ |
| DOC, dissolved organic carbon | Water | kg | 4.2541 × 10⁻⁴ | 2.8977 × 10⁻⁴ |
| Nitrate | Water | kg | 2.5444 × 10⁻⁶ | 1.7342 × 10⁻⁶ |
| PAH (Polycyclic Aromatic Hydrocarbons) | Water | kg | 3.9898 × 10⁻⁸ | 2.7401 × 10⁻⁸ |
| Phosphate | Water | kg | 5.2351 × 10⁻⁶ | 3.9545 × 10⁻⁶ |
| Sulfate | Water | kg | 4.9035 × 10⁻⁴ | 2.8335 × 10⁻⁴ |
| TOC, total organic carbon | Water | kg | 4.2604 × 10⁻⁴ | 2.9025 × 10⁻⁴ |
| Arsenic | Soil | kg | 1.2491 × 10⁻⁹ | 8.4610 × 10⁻¹⁰ |
| Cadmium | Soil | kg | 1.6440 × 10⁻¹⁰ | 1.6072 × 10⁻¹⁰ |
| Chromium VI | Soil | kg | 3.8321 × 10⁻⁸ | 2.1789 × 10⁻⁸ |
| Mercury | Soil | kg | 1.1348 × 10⁻¹² | 8.2473 × 10⁻¹³ |
| Nickel | Soil | kg | 1.5667 × 10⁻⁹ | 1.7566 × 10⁻⁹ |
| Vanadium | Soil | kg | 1.5897 × 10⁻¹⁰ | 8.5736 × 10⁻¹¹ |
| Zinc | Soil | kg | 3.3479 × 10⁻⁷ | 3.8050 × 10⁻⁷ |
Publisher’s Note: MDPI stays neutral with regard to jurisdictional claims in published maps and institutional affiliations. |
© 2021 by the authors. Licensee MDPI, Basel, Switzerland. This article is an open access article distributed under the terms and conditions of the Creative Commons Attribution (CC BY) license (https://creativecommons.org/licenses/by/4.0/).
Share and Cite
Sánchez, A.R.; Ramos, V.C.; Polo, M.S.; Ramón, M.V.L.; Utrilla, J.R. Life Cycle Assessment of Cement Production with Marble Waste Sludges. Int. J. Environ. Res. Public Health 2021, 18, 10968. https://doi.org/10.3390/ijerph182010968
Sánchez AR, Ramos VC, Polo MS, Ramón MVL, Utrilla JR. Life Cycle Assessment of Cement Production with Marble Waste Sludges. International Journal of Environmental Research and Public Health. 2021; 18(20):10968. https://doi.org/10.3390/ijerph182010968
Chicago/Turabian StyleSánchez, Antonio Ruiz, Ventura Castillo Ramos, Manuel Sánchez Polo, María Victoria López Ramón, and José Rivera Utrilla. 2021. "Life Cycle Assessment of Cement Production with Marble Waste Sludges" International Journal of Environmental Research and Public Health 18, no. 20: 10968. https://doi.org/10.3390/ijerph182010968
APA StyleSánchez, A. R., Ramos, V. C., Polo, M. S., Ramón, M. V. L., & Utrilla, J. R. (2021). Life Cycle Assessment of Cement Production with Marble Waste Sludges. International Journal of Environmental Research and Public Health, 18(20), 10968. https://doi.org/10.3390/ijerph182010968