
Assessment on Temporal and Spatial Variation Analysis of Extreme Temperature Indices: A Case Study of the Yangtze River Basin


Abstract
:1. Introduction
2. Study Area, Data, and Methods
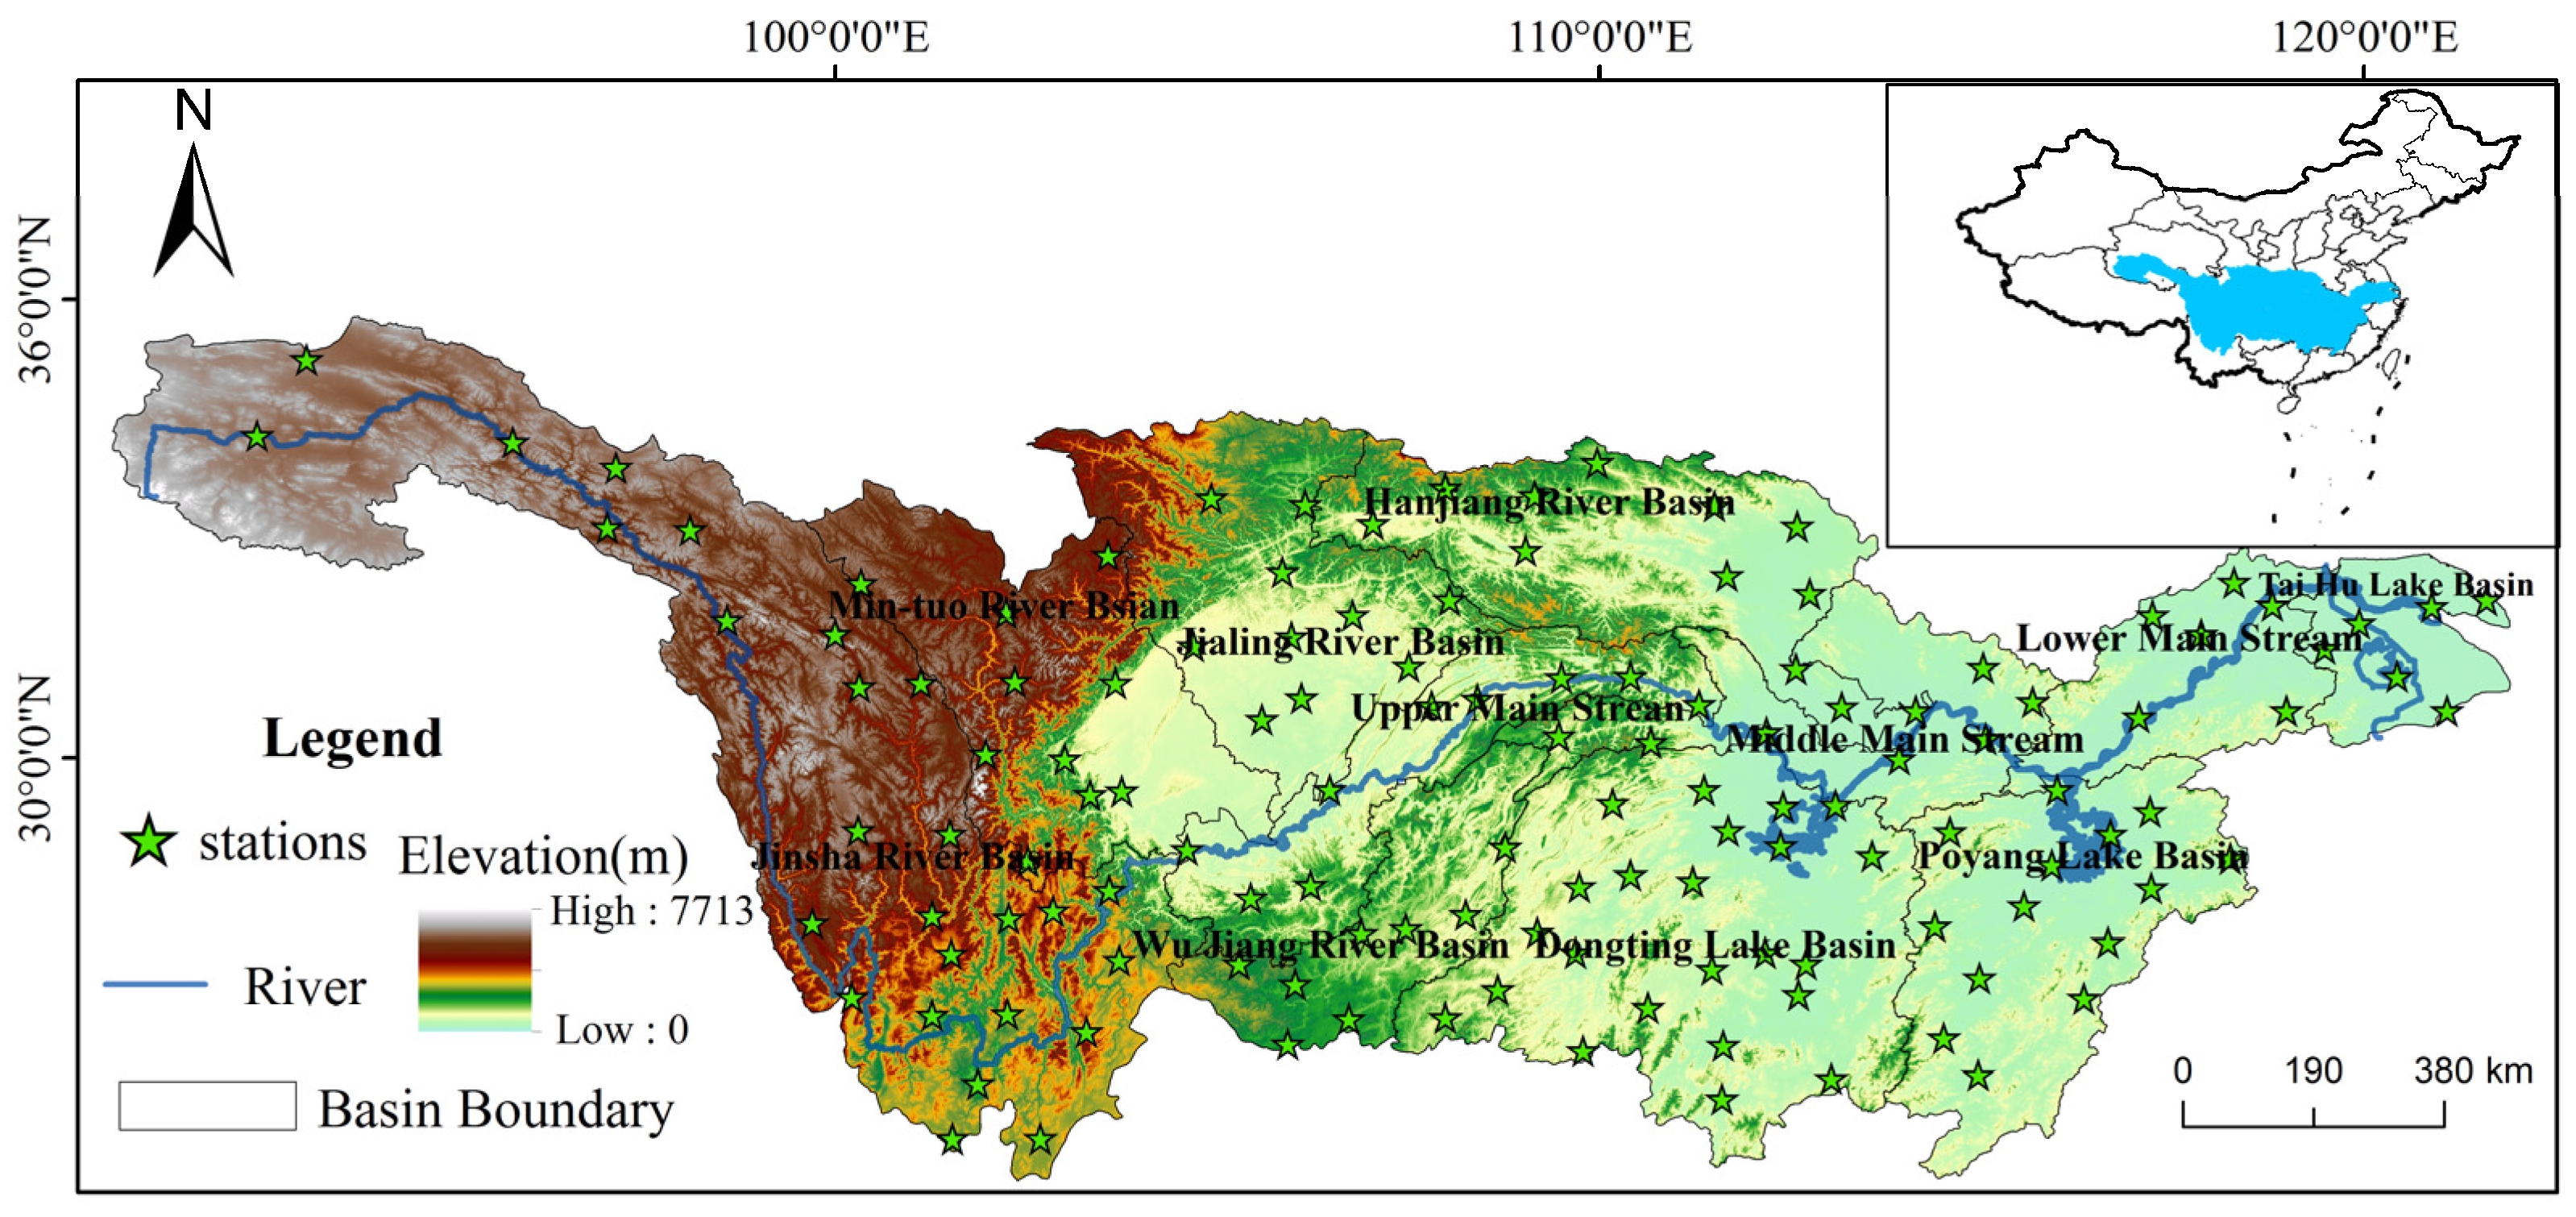
2.1. Study Area
2.2. Data
2.3. Methods
2.3.1. Extreme Temperature Indices
2.3.2. Mann–Kendall (M–K) Trend and Abrupt Changes Analysis
2.3.3. R/S Analysis
2.3.4. The Sliding t-Test
3. Results
3.1. Temporal and Spatial Variations of Extreme Temperatures
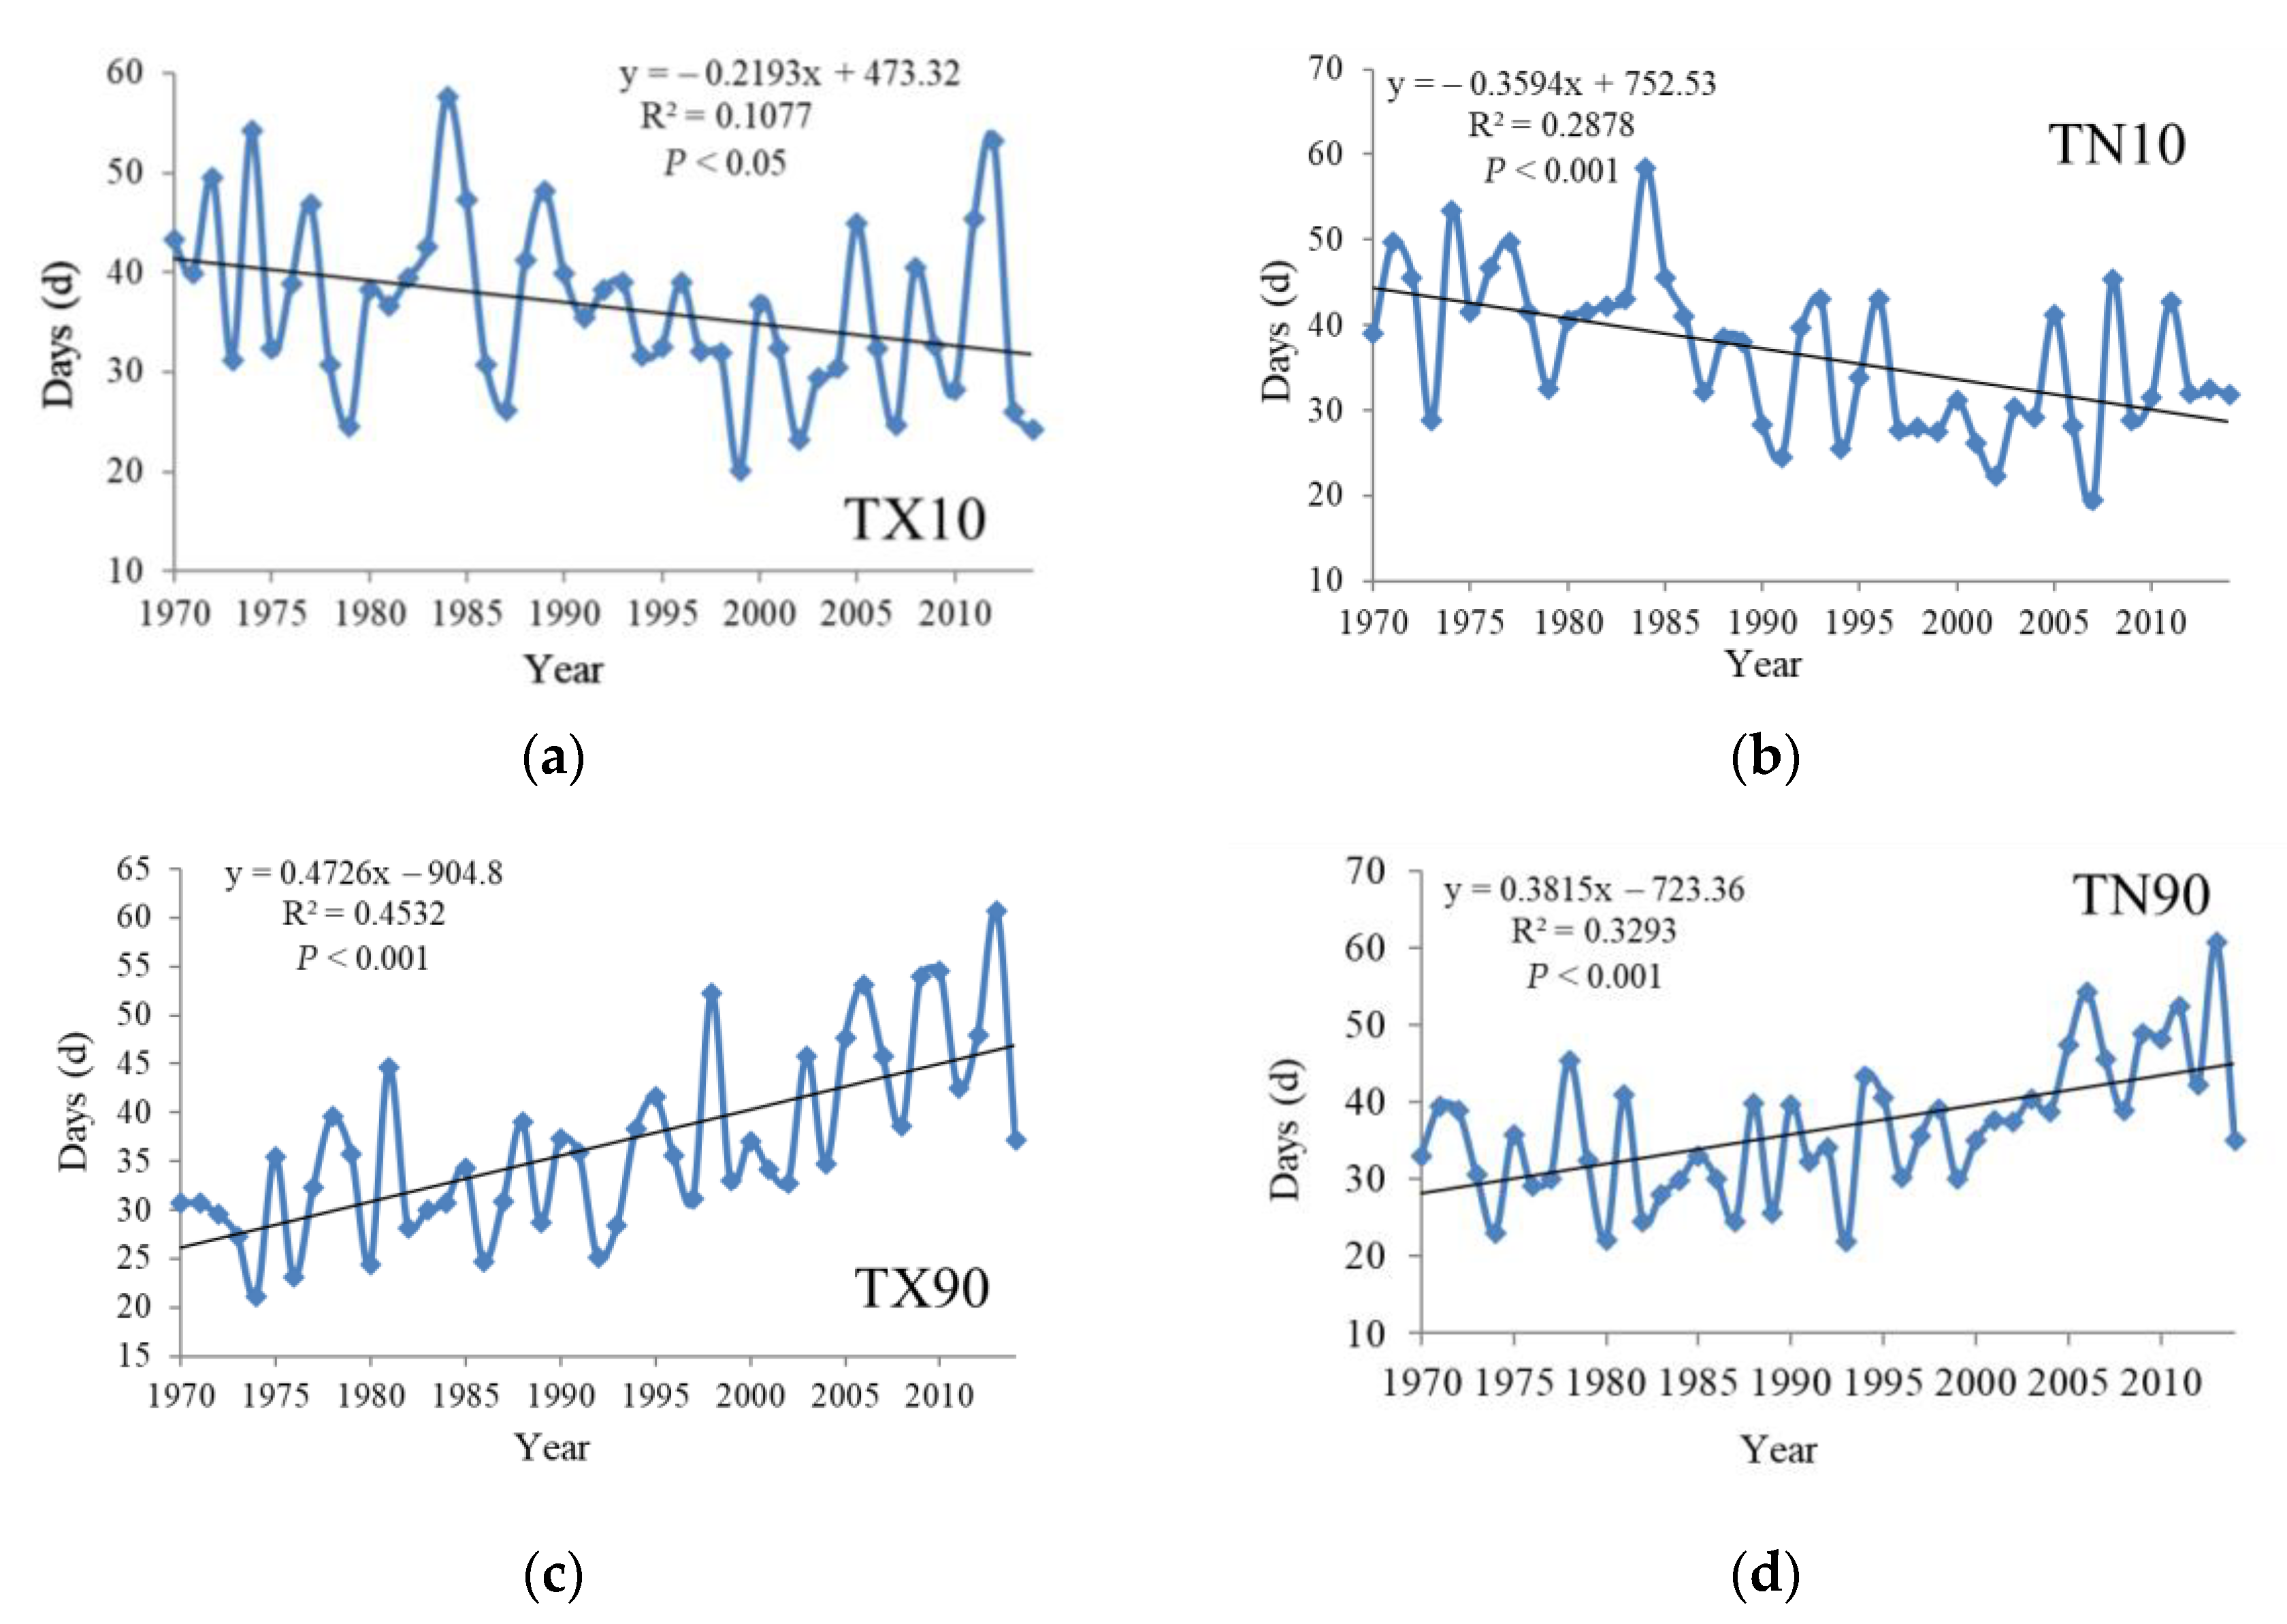
3.1.1. Temporal Variation of Relative Indices
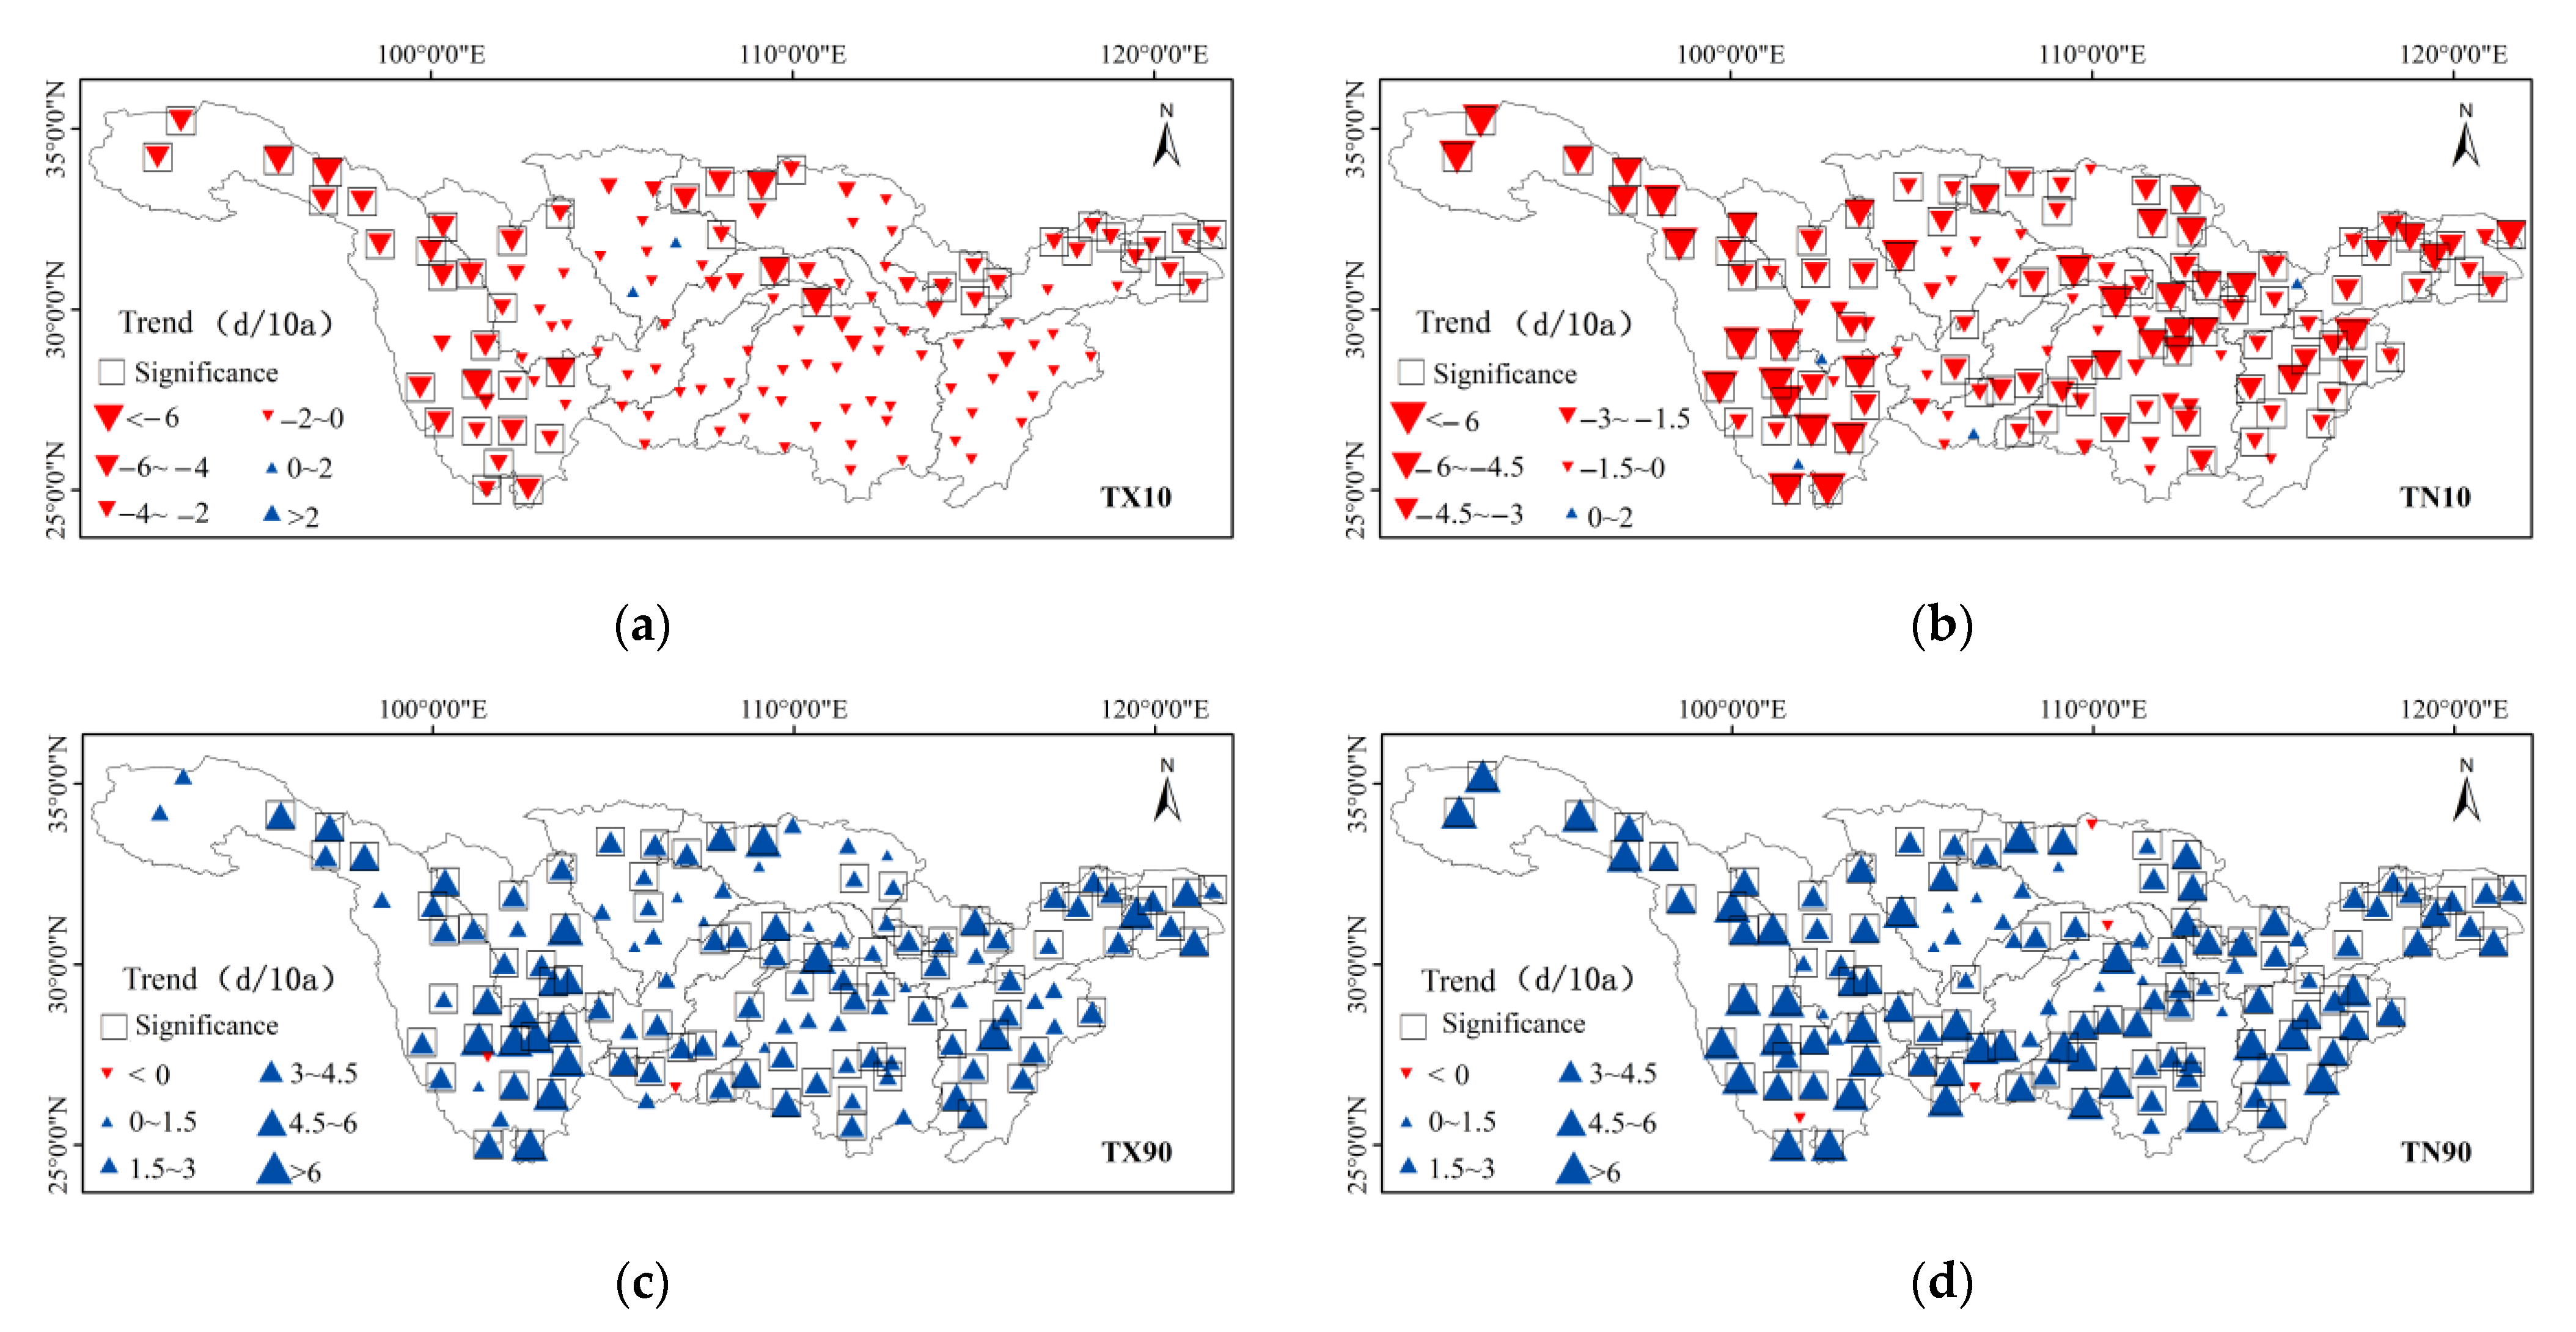
3.1.2. Spatial Variation of Relative Indices
3.2. Temporal and Spatial Variations of Absolute Indices
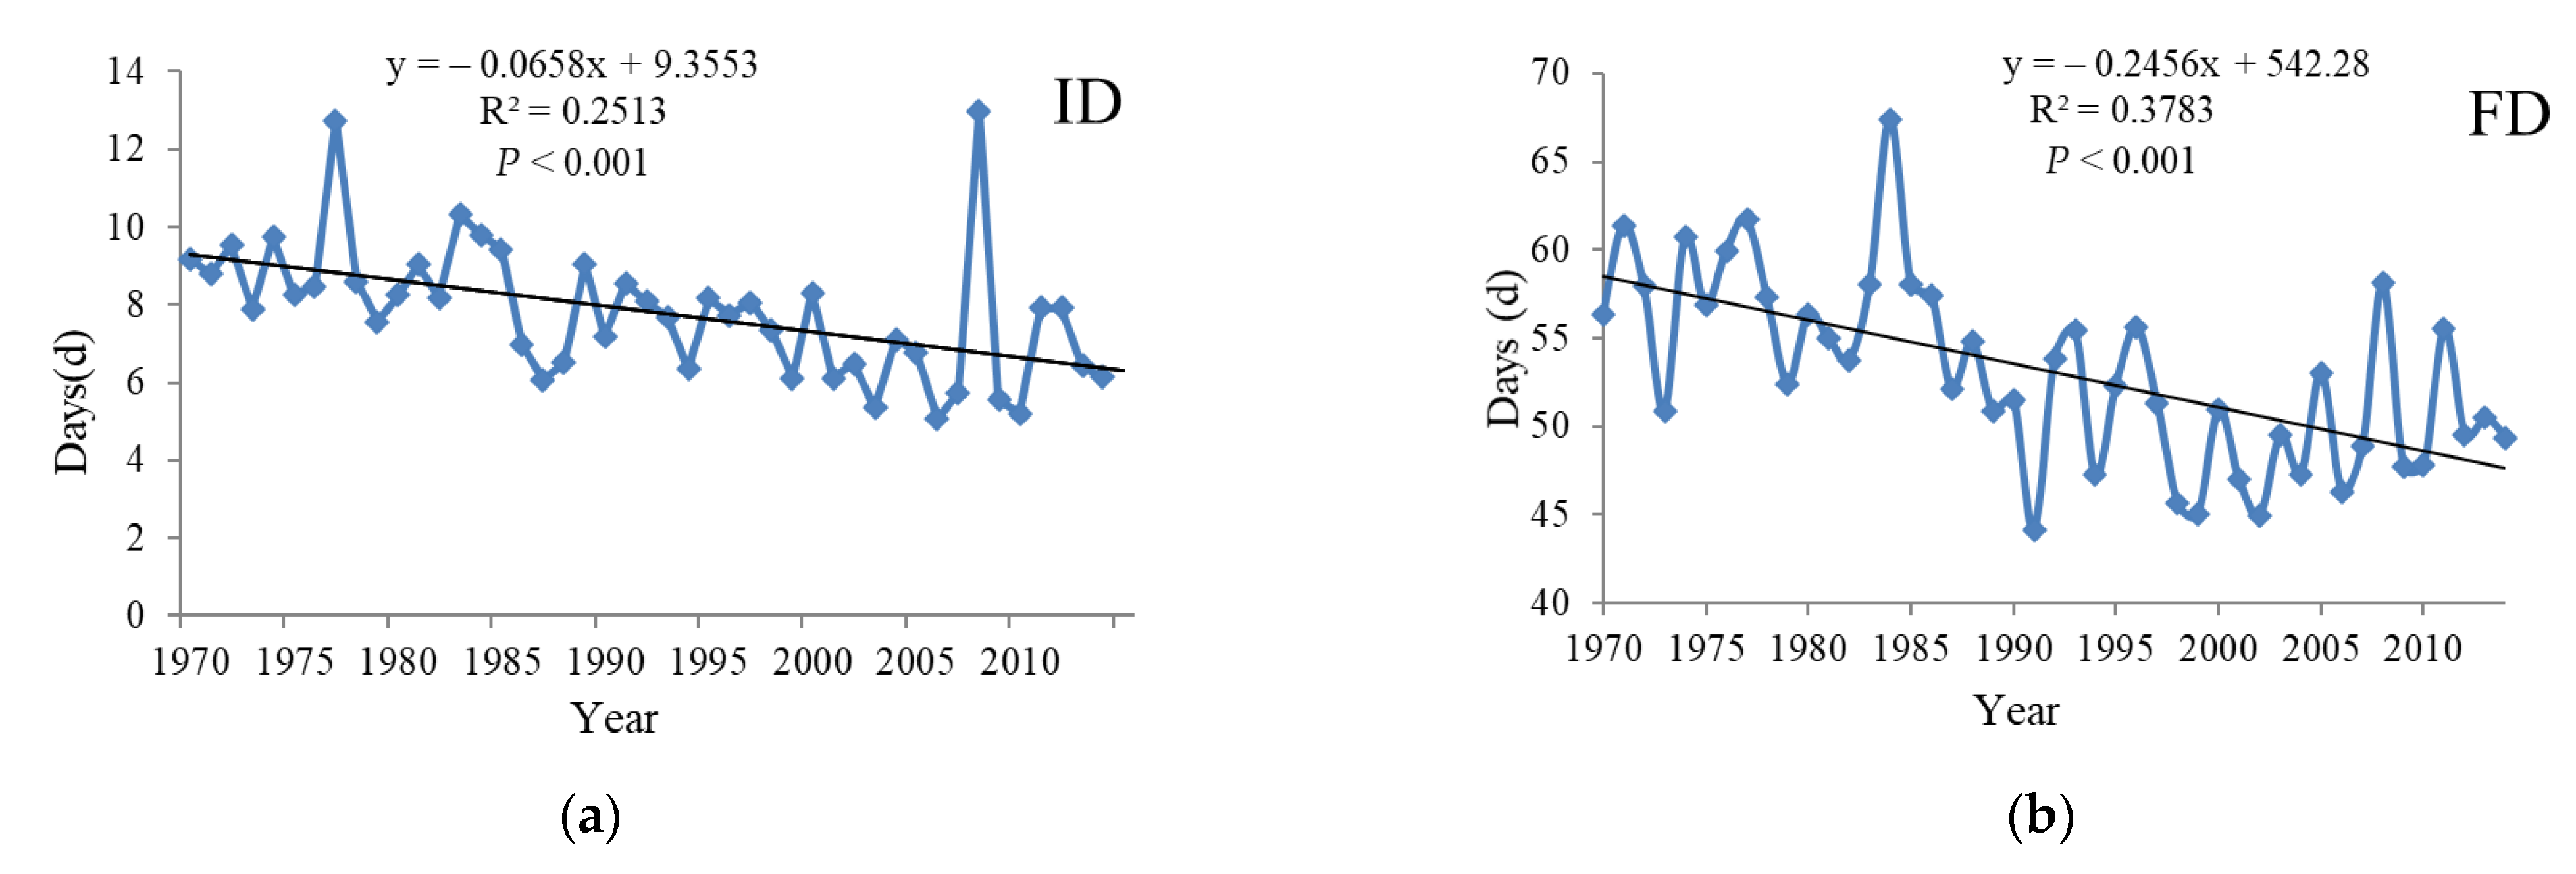
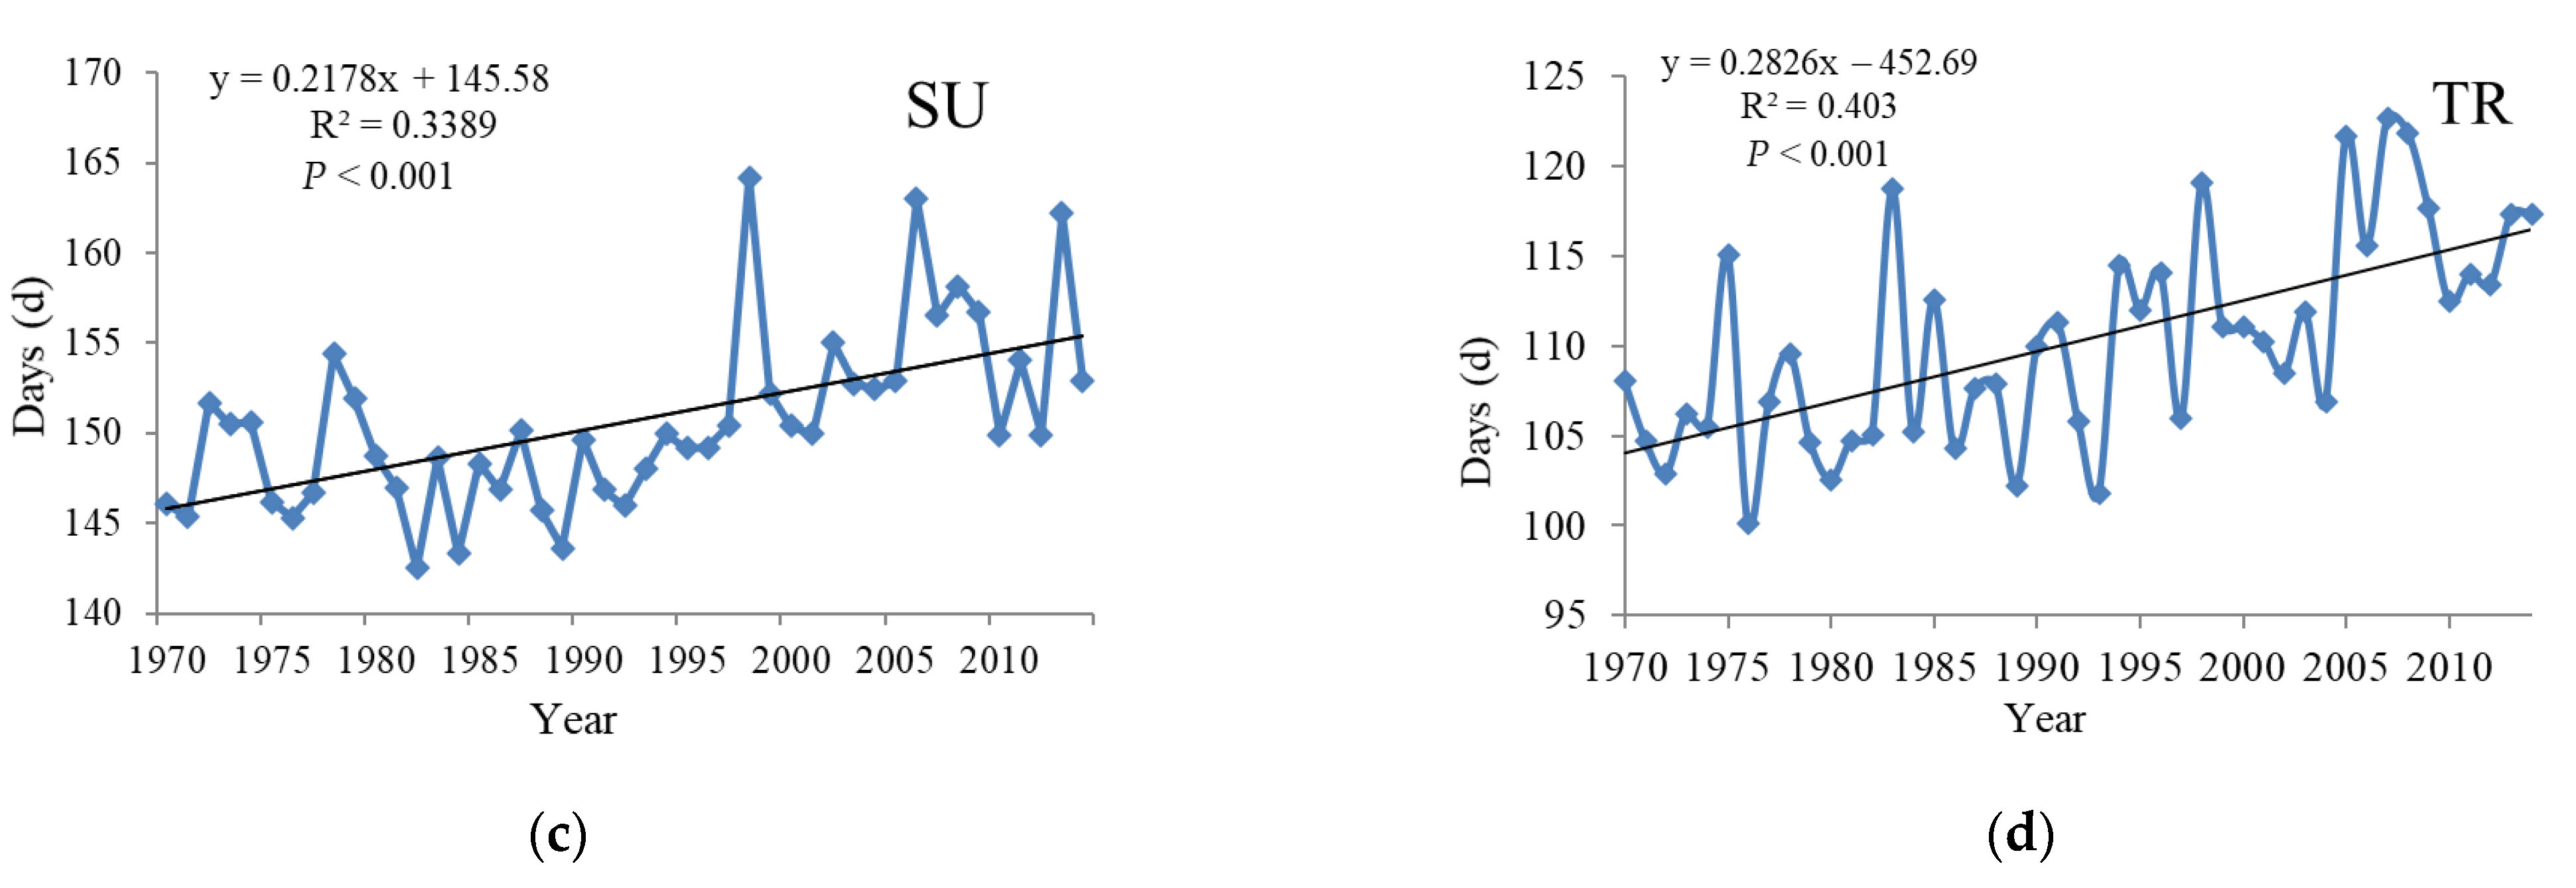
3.2.1. Temporal Variation of Absolute Indices
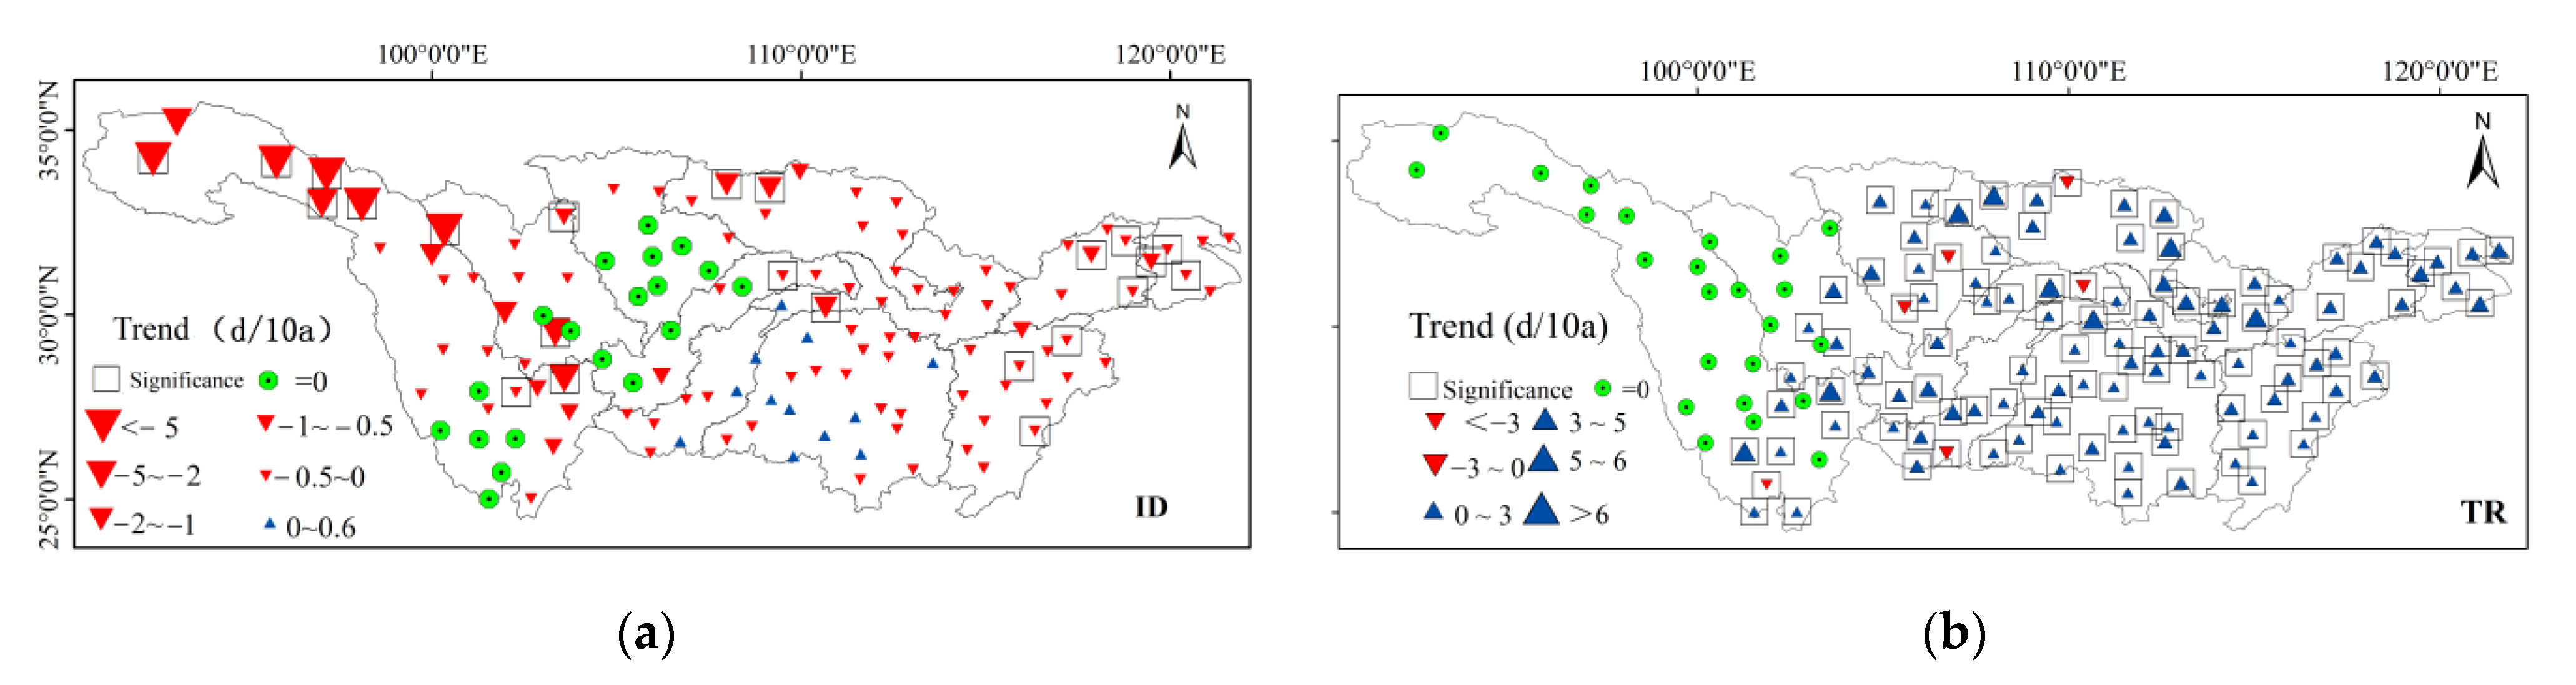
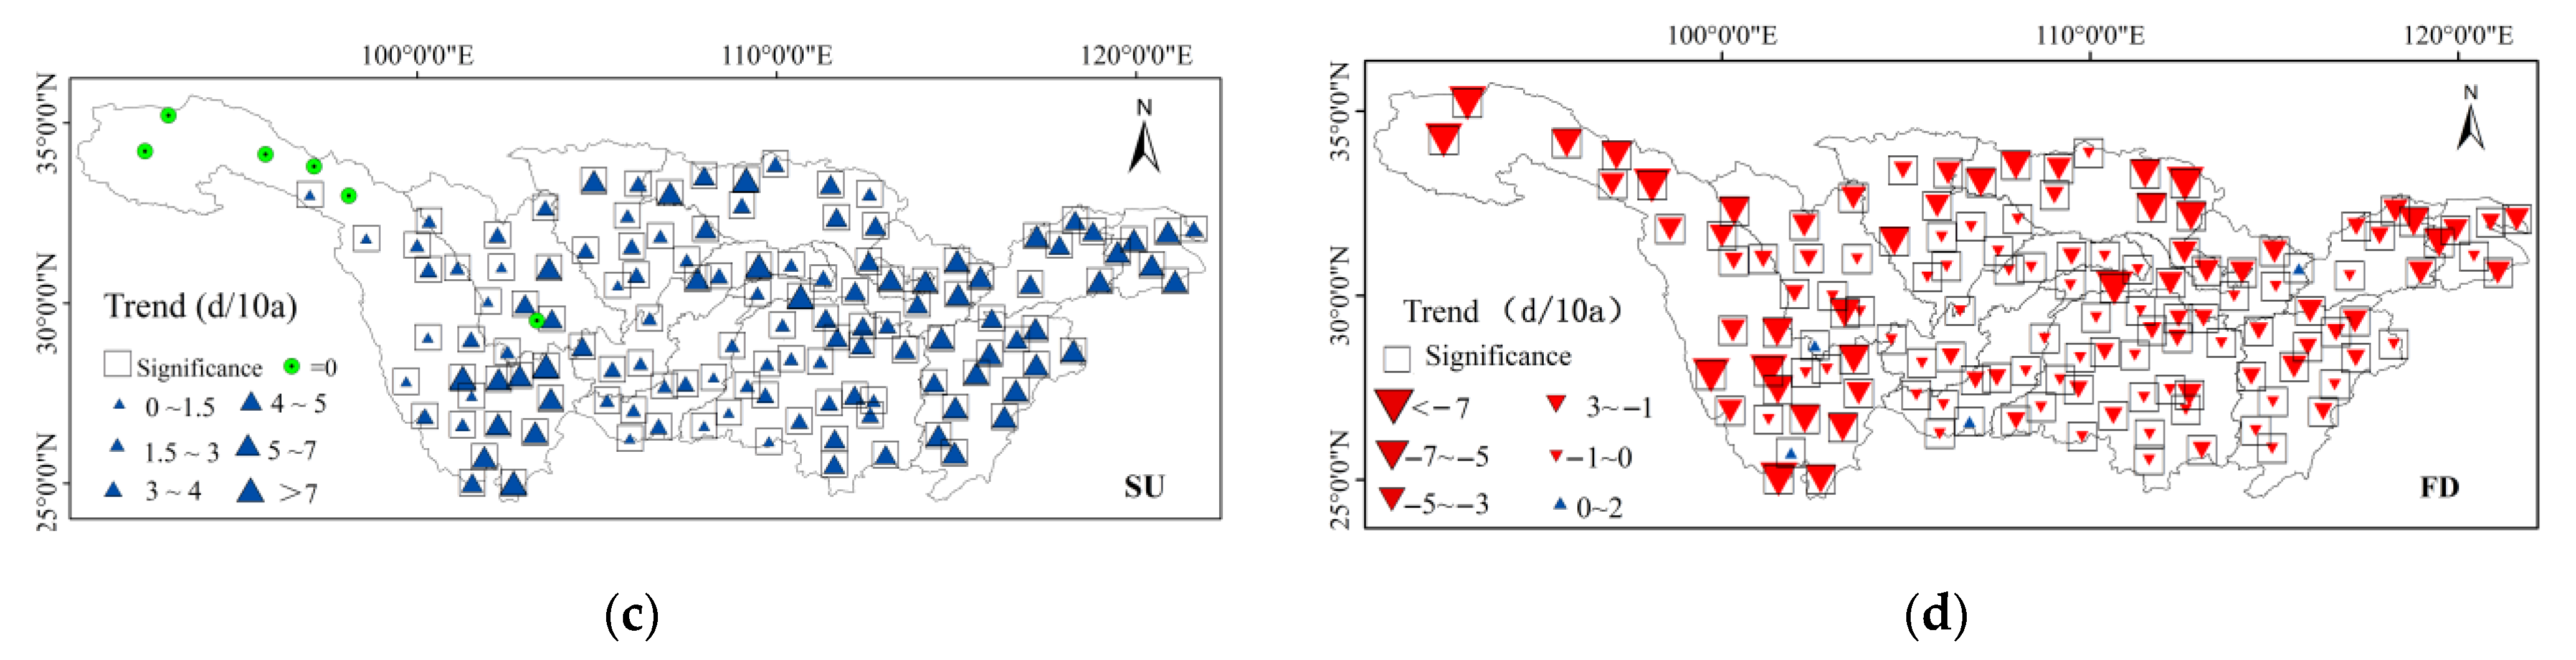
3.2.2. Spatial Variation of Absolute Indices
3.3. Temporal and Spatial Variations of the Extremal Indices
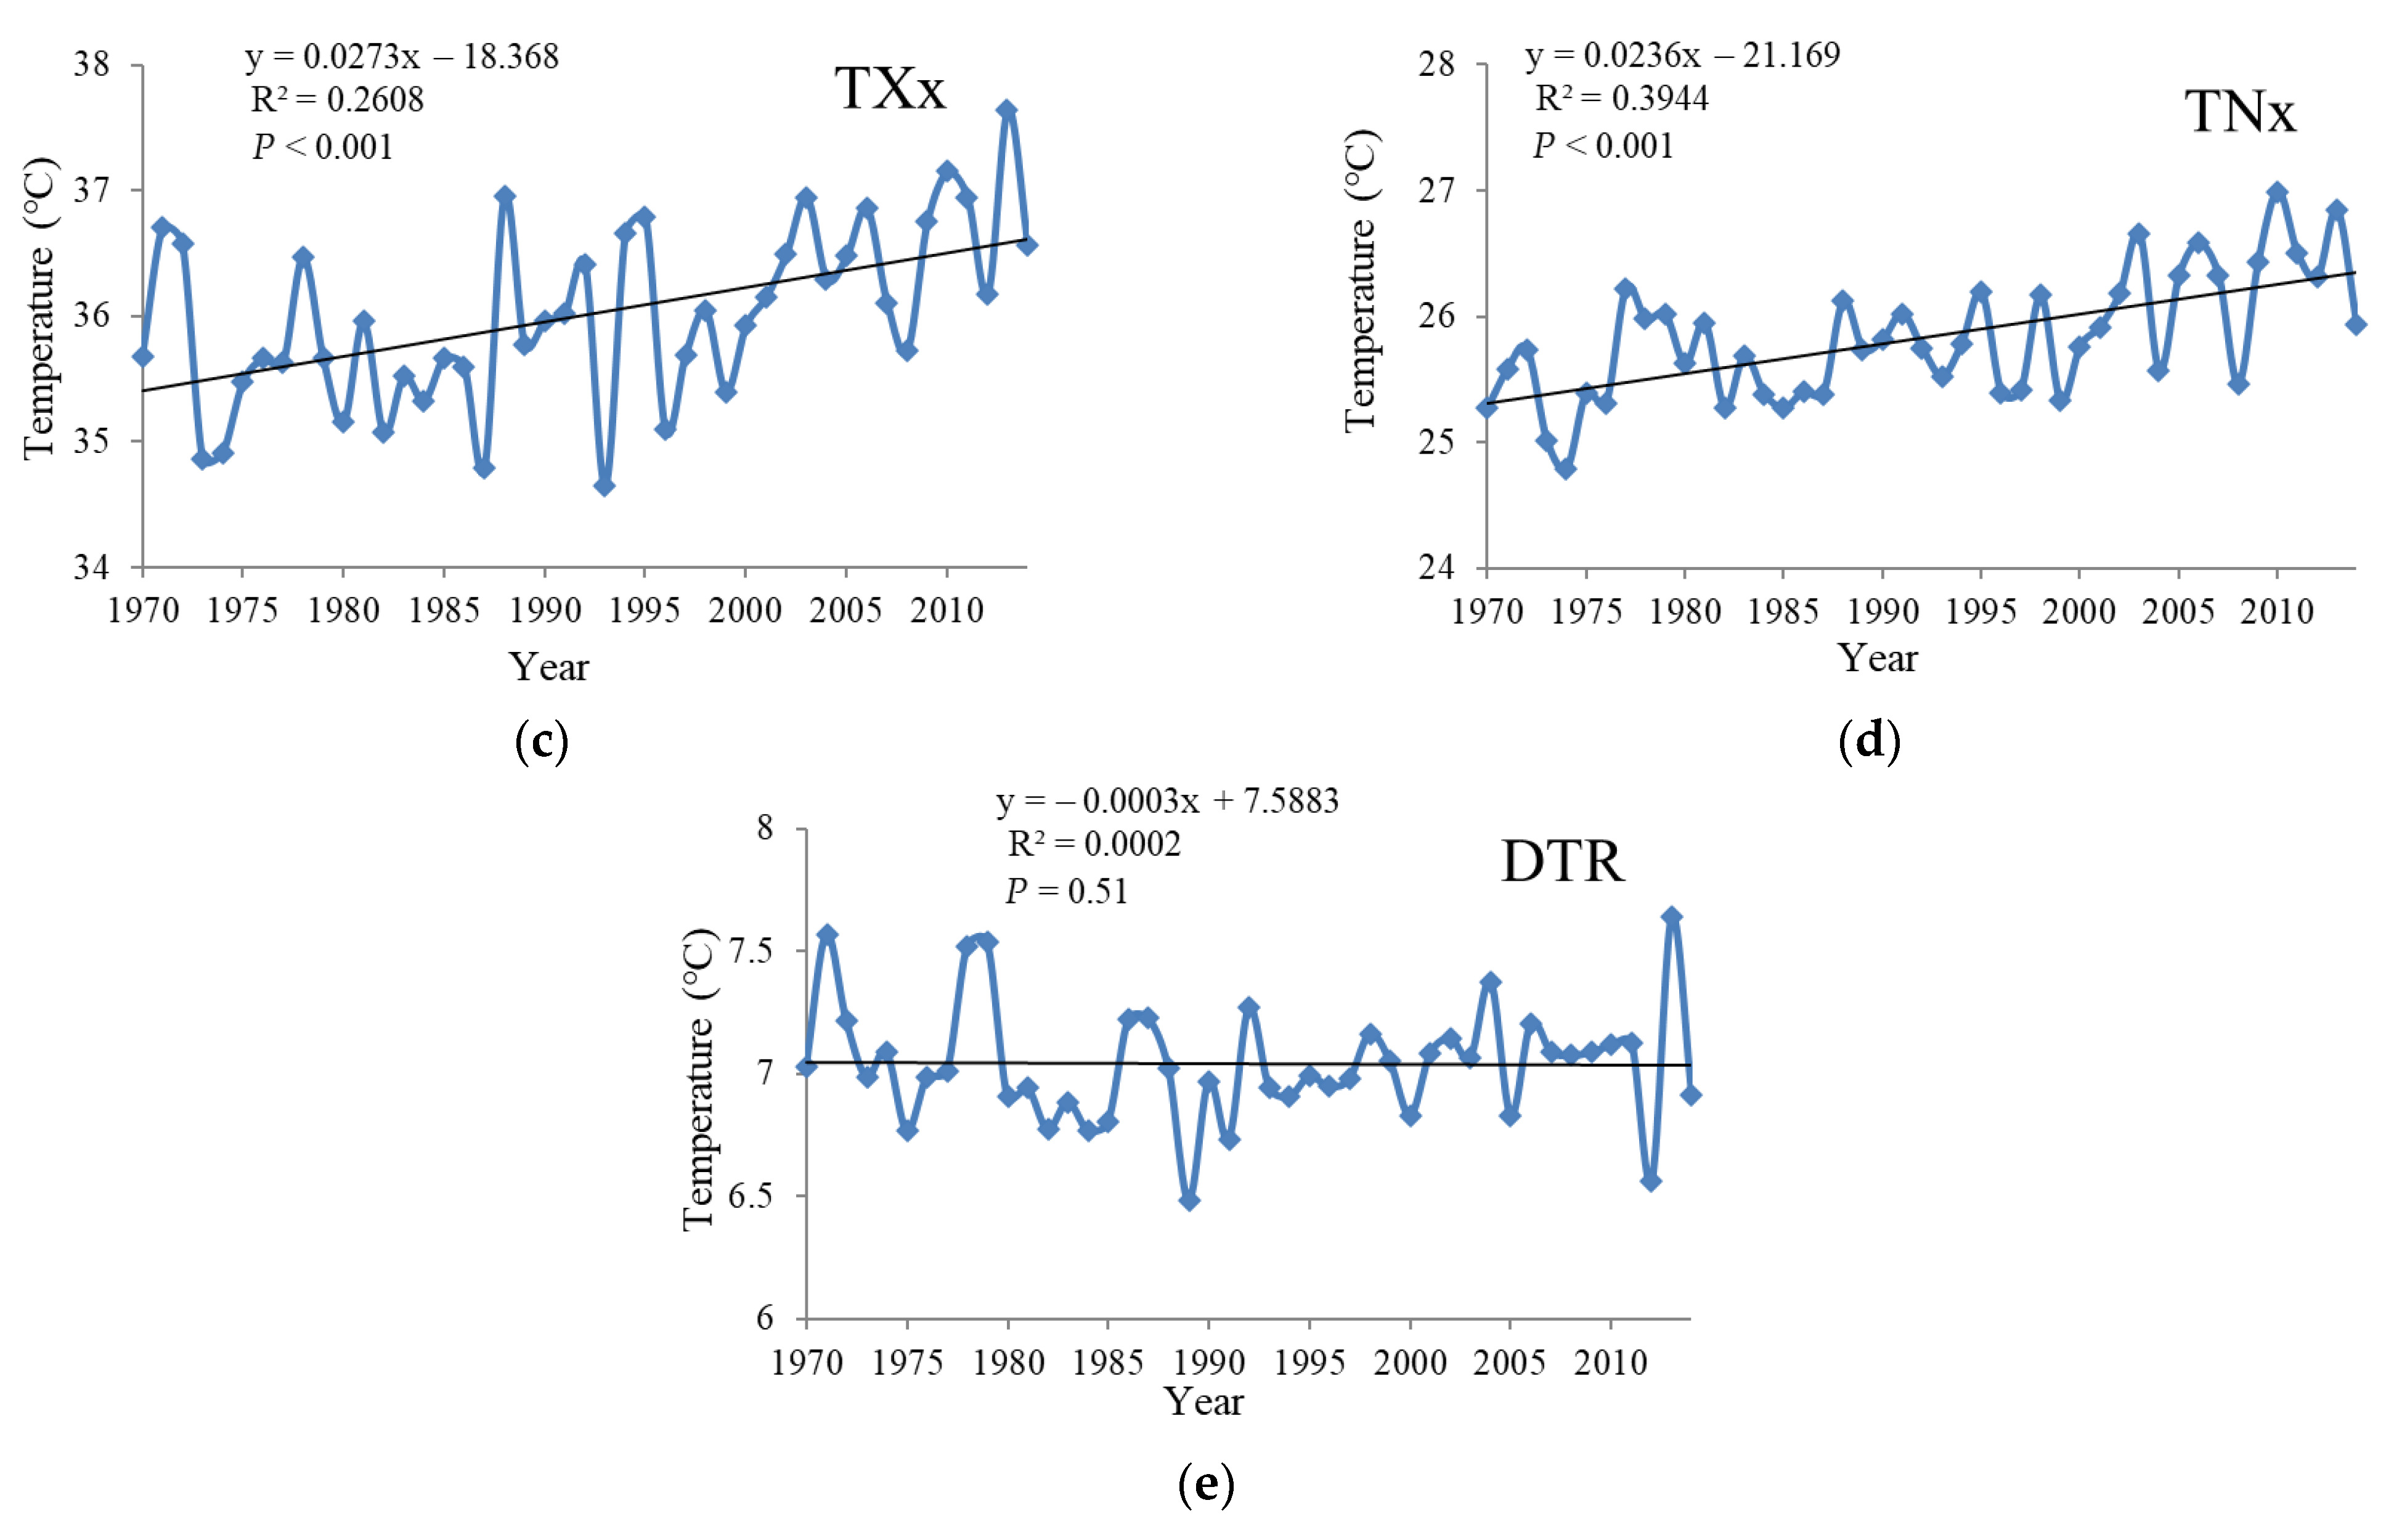
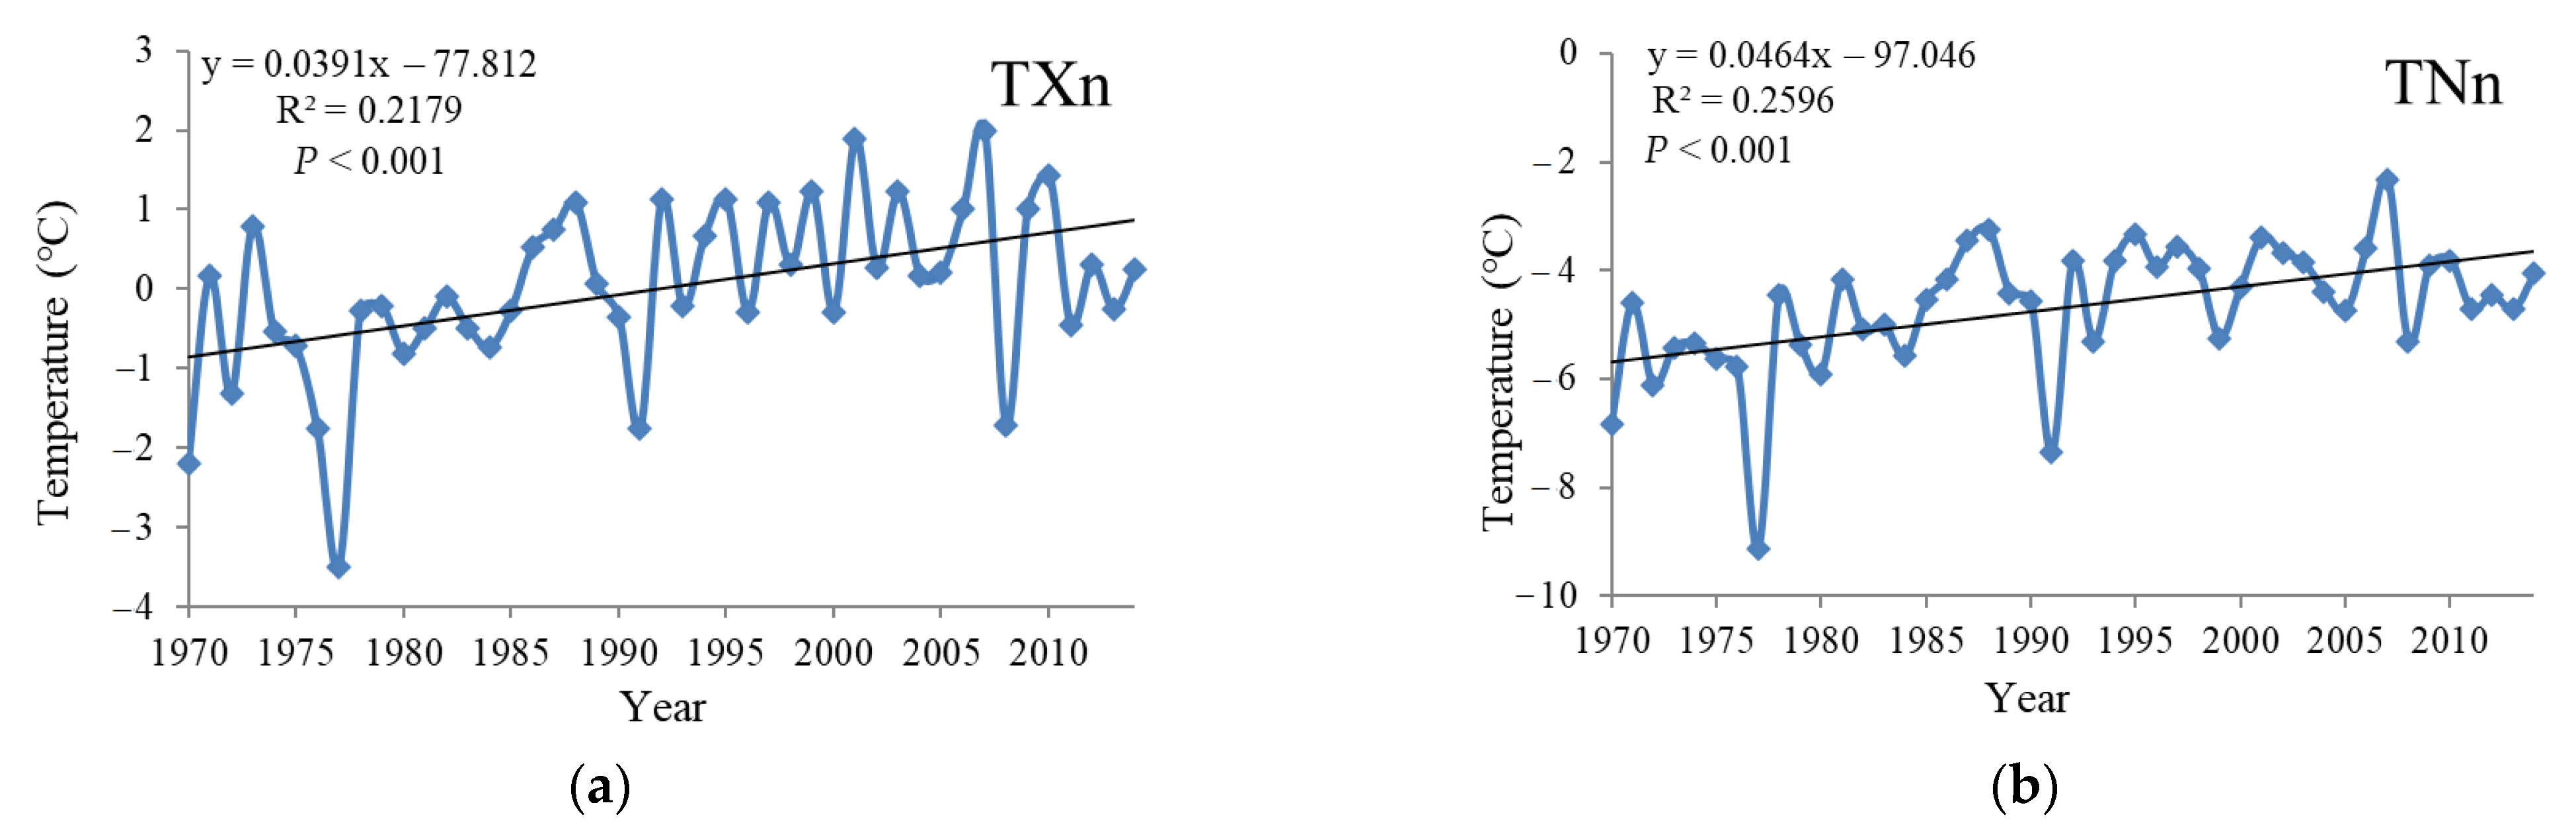
3.3.1. Temporal Variation of the Extremal Indices
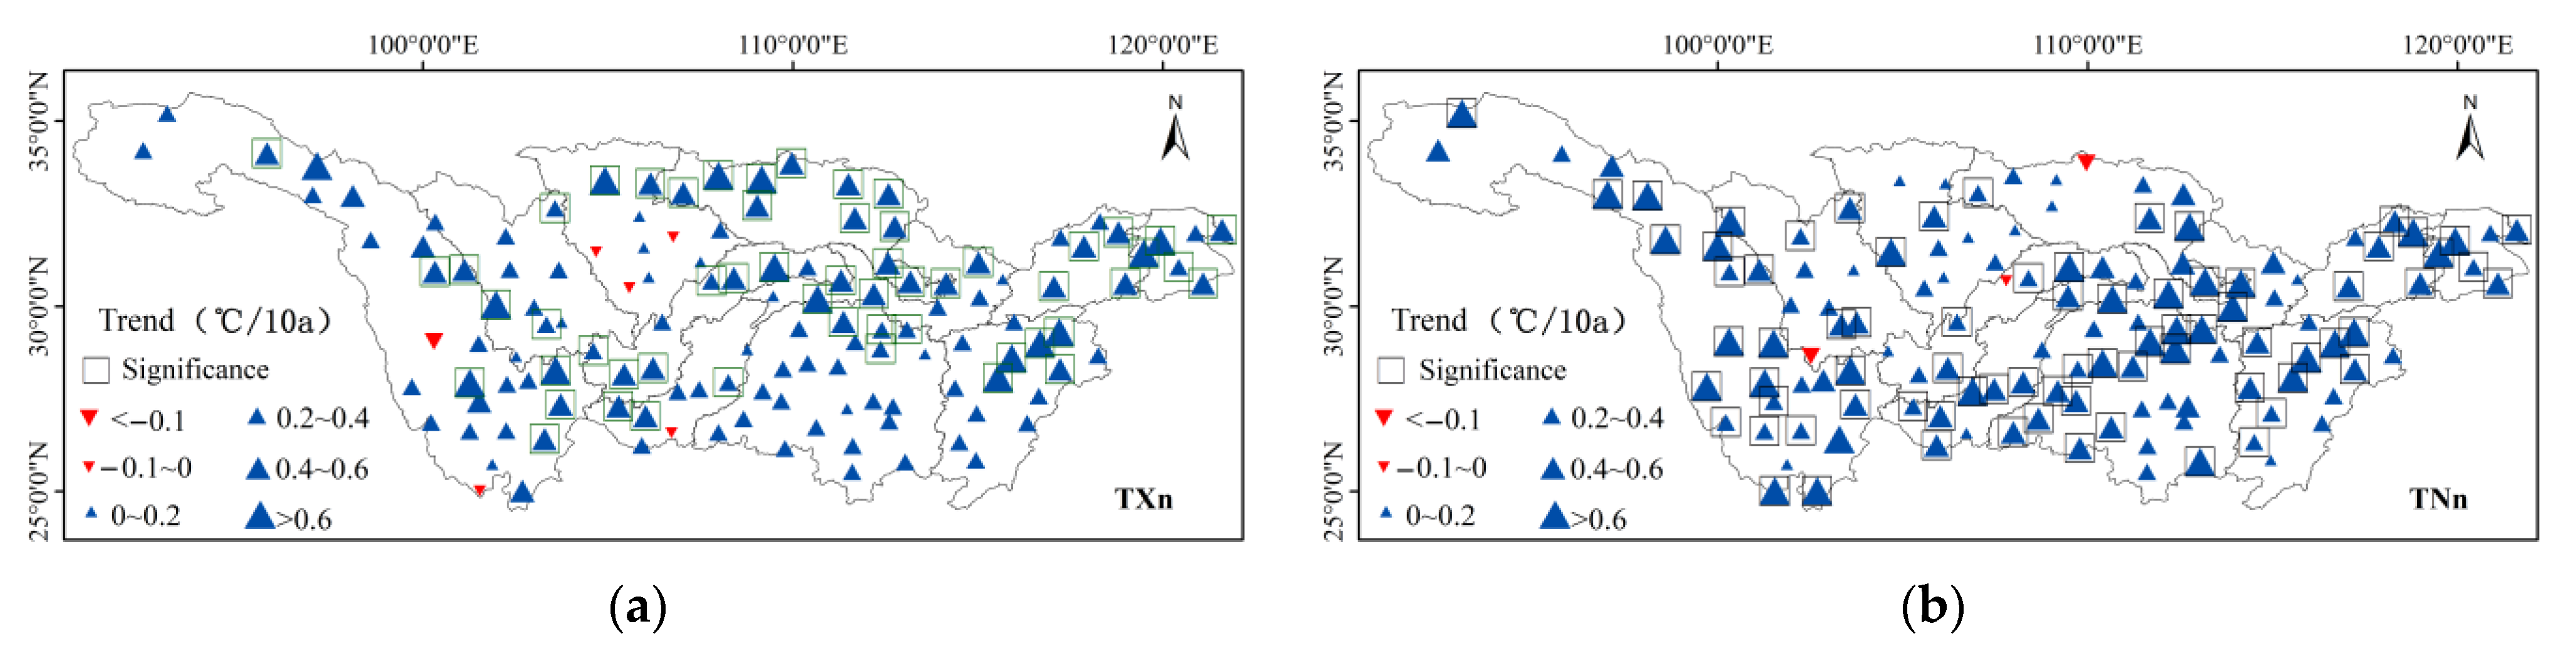
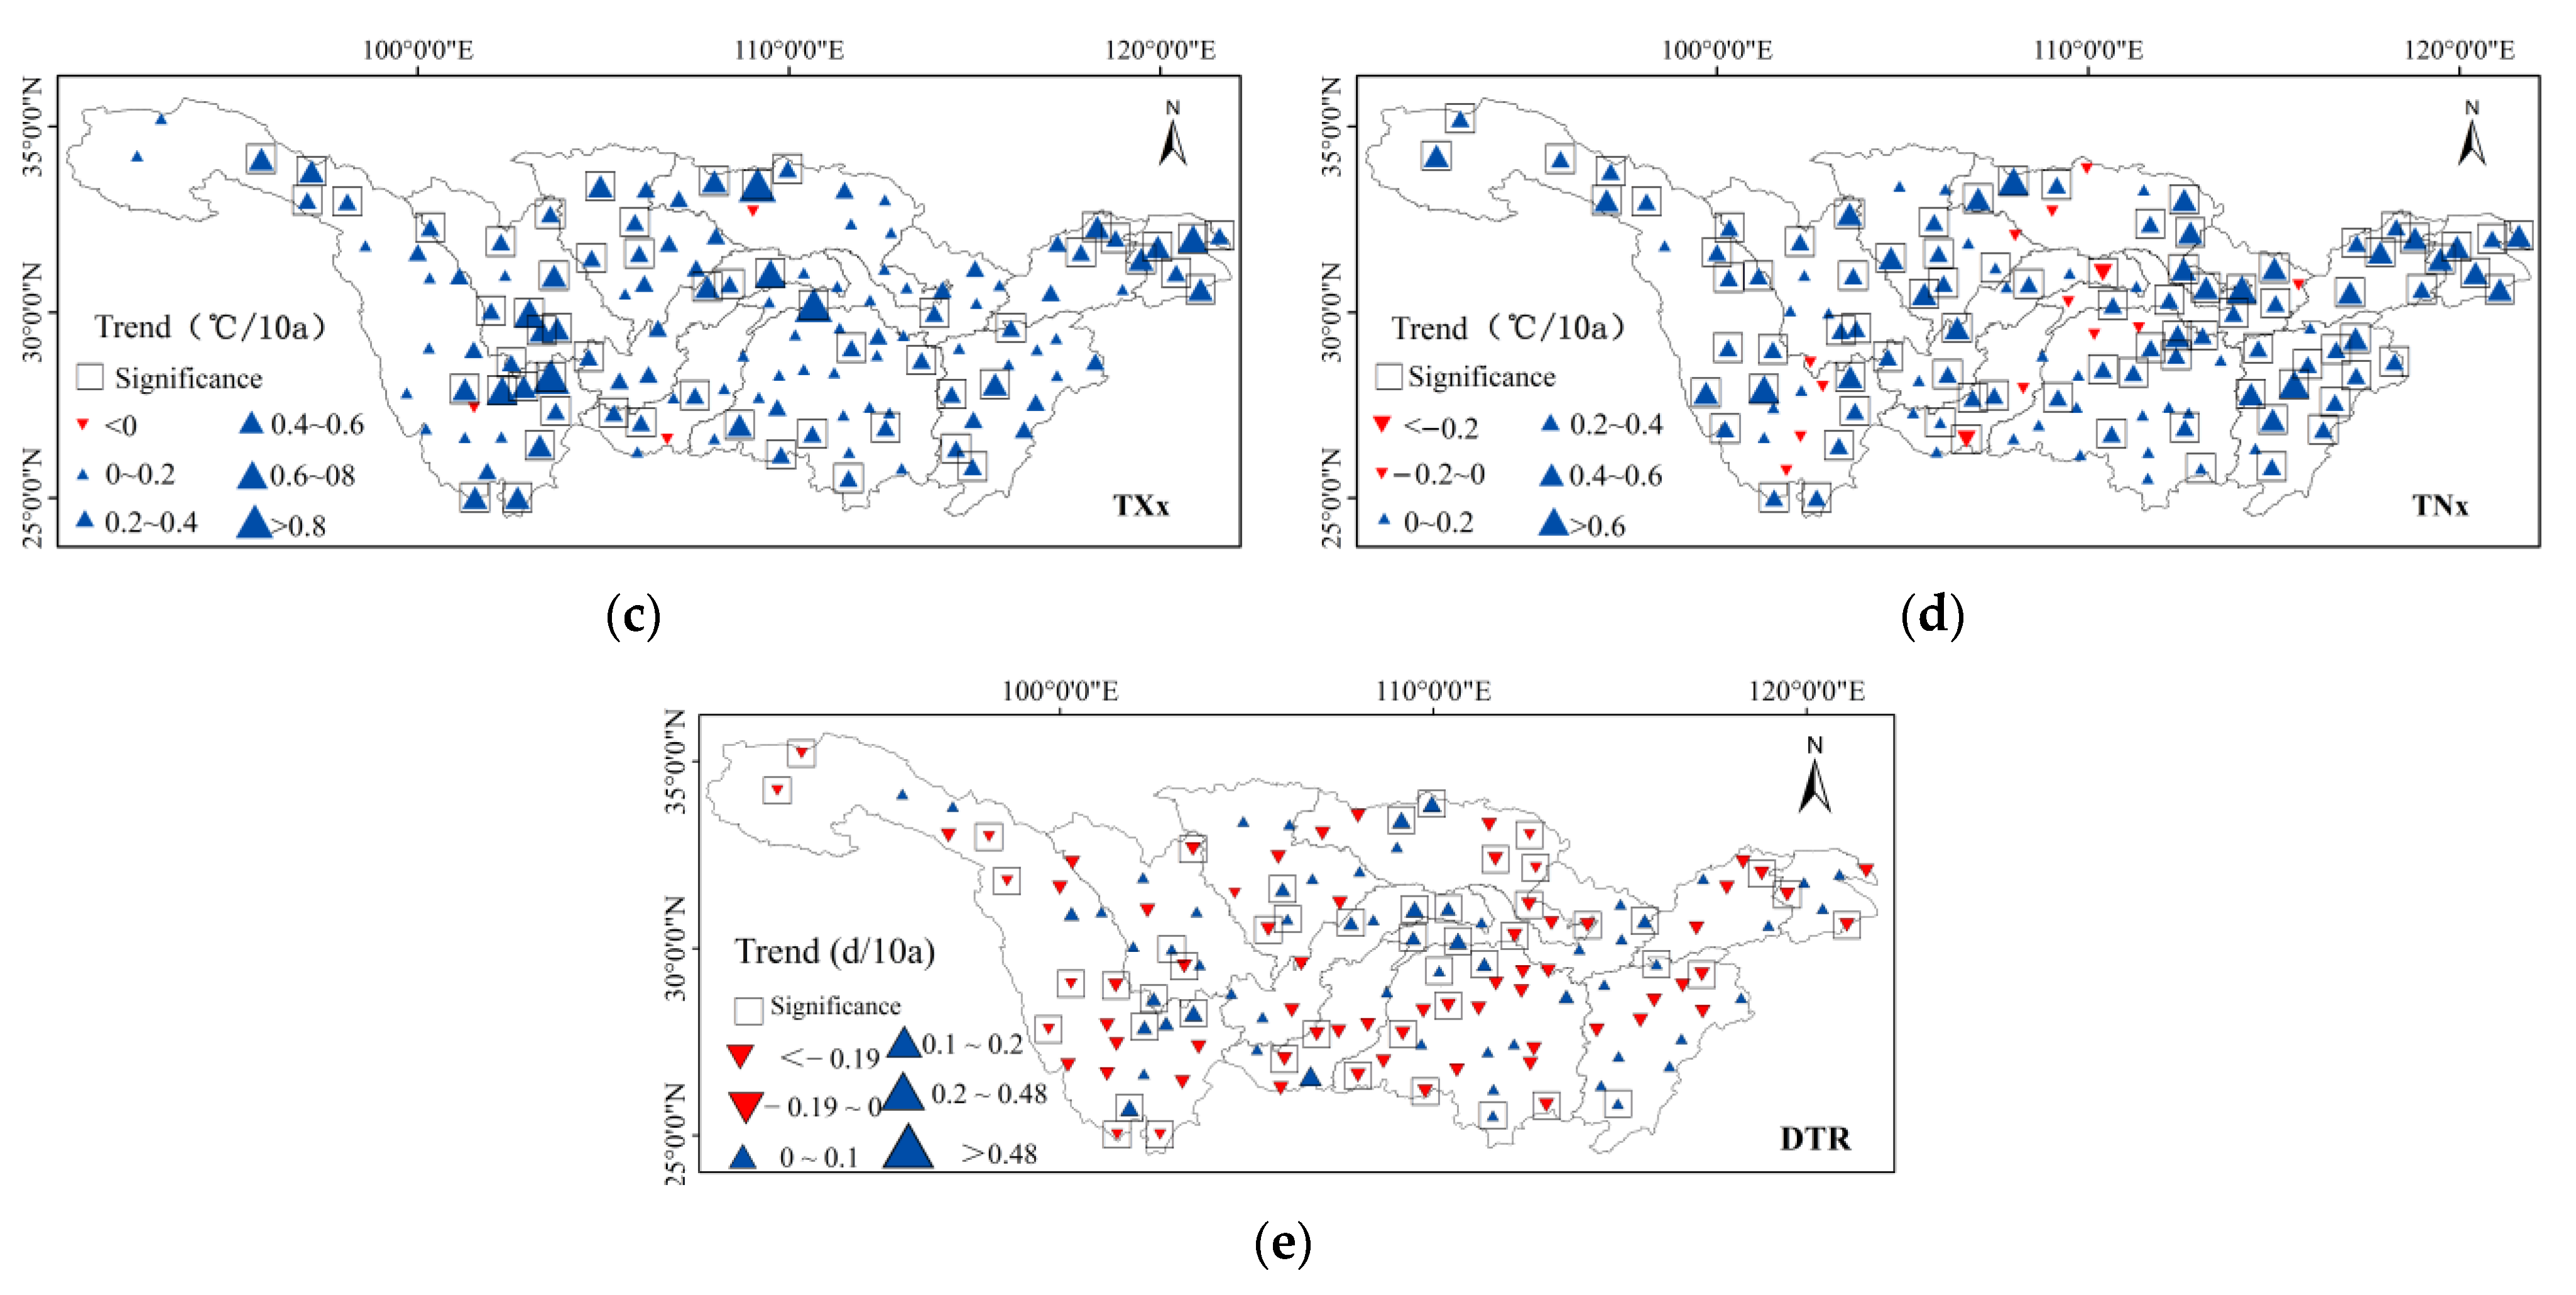
3.3.2. Spatial Variation of Extremal Indices
3.4. Analysis of Abrupt Changes of Extreme Temperature Indices
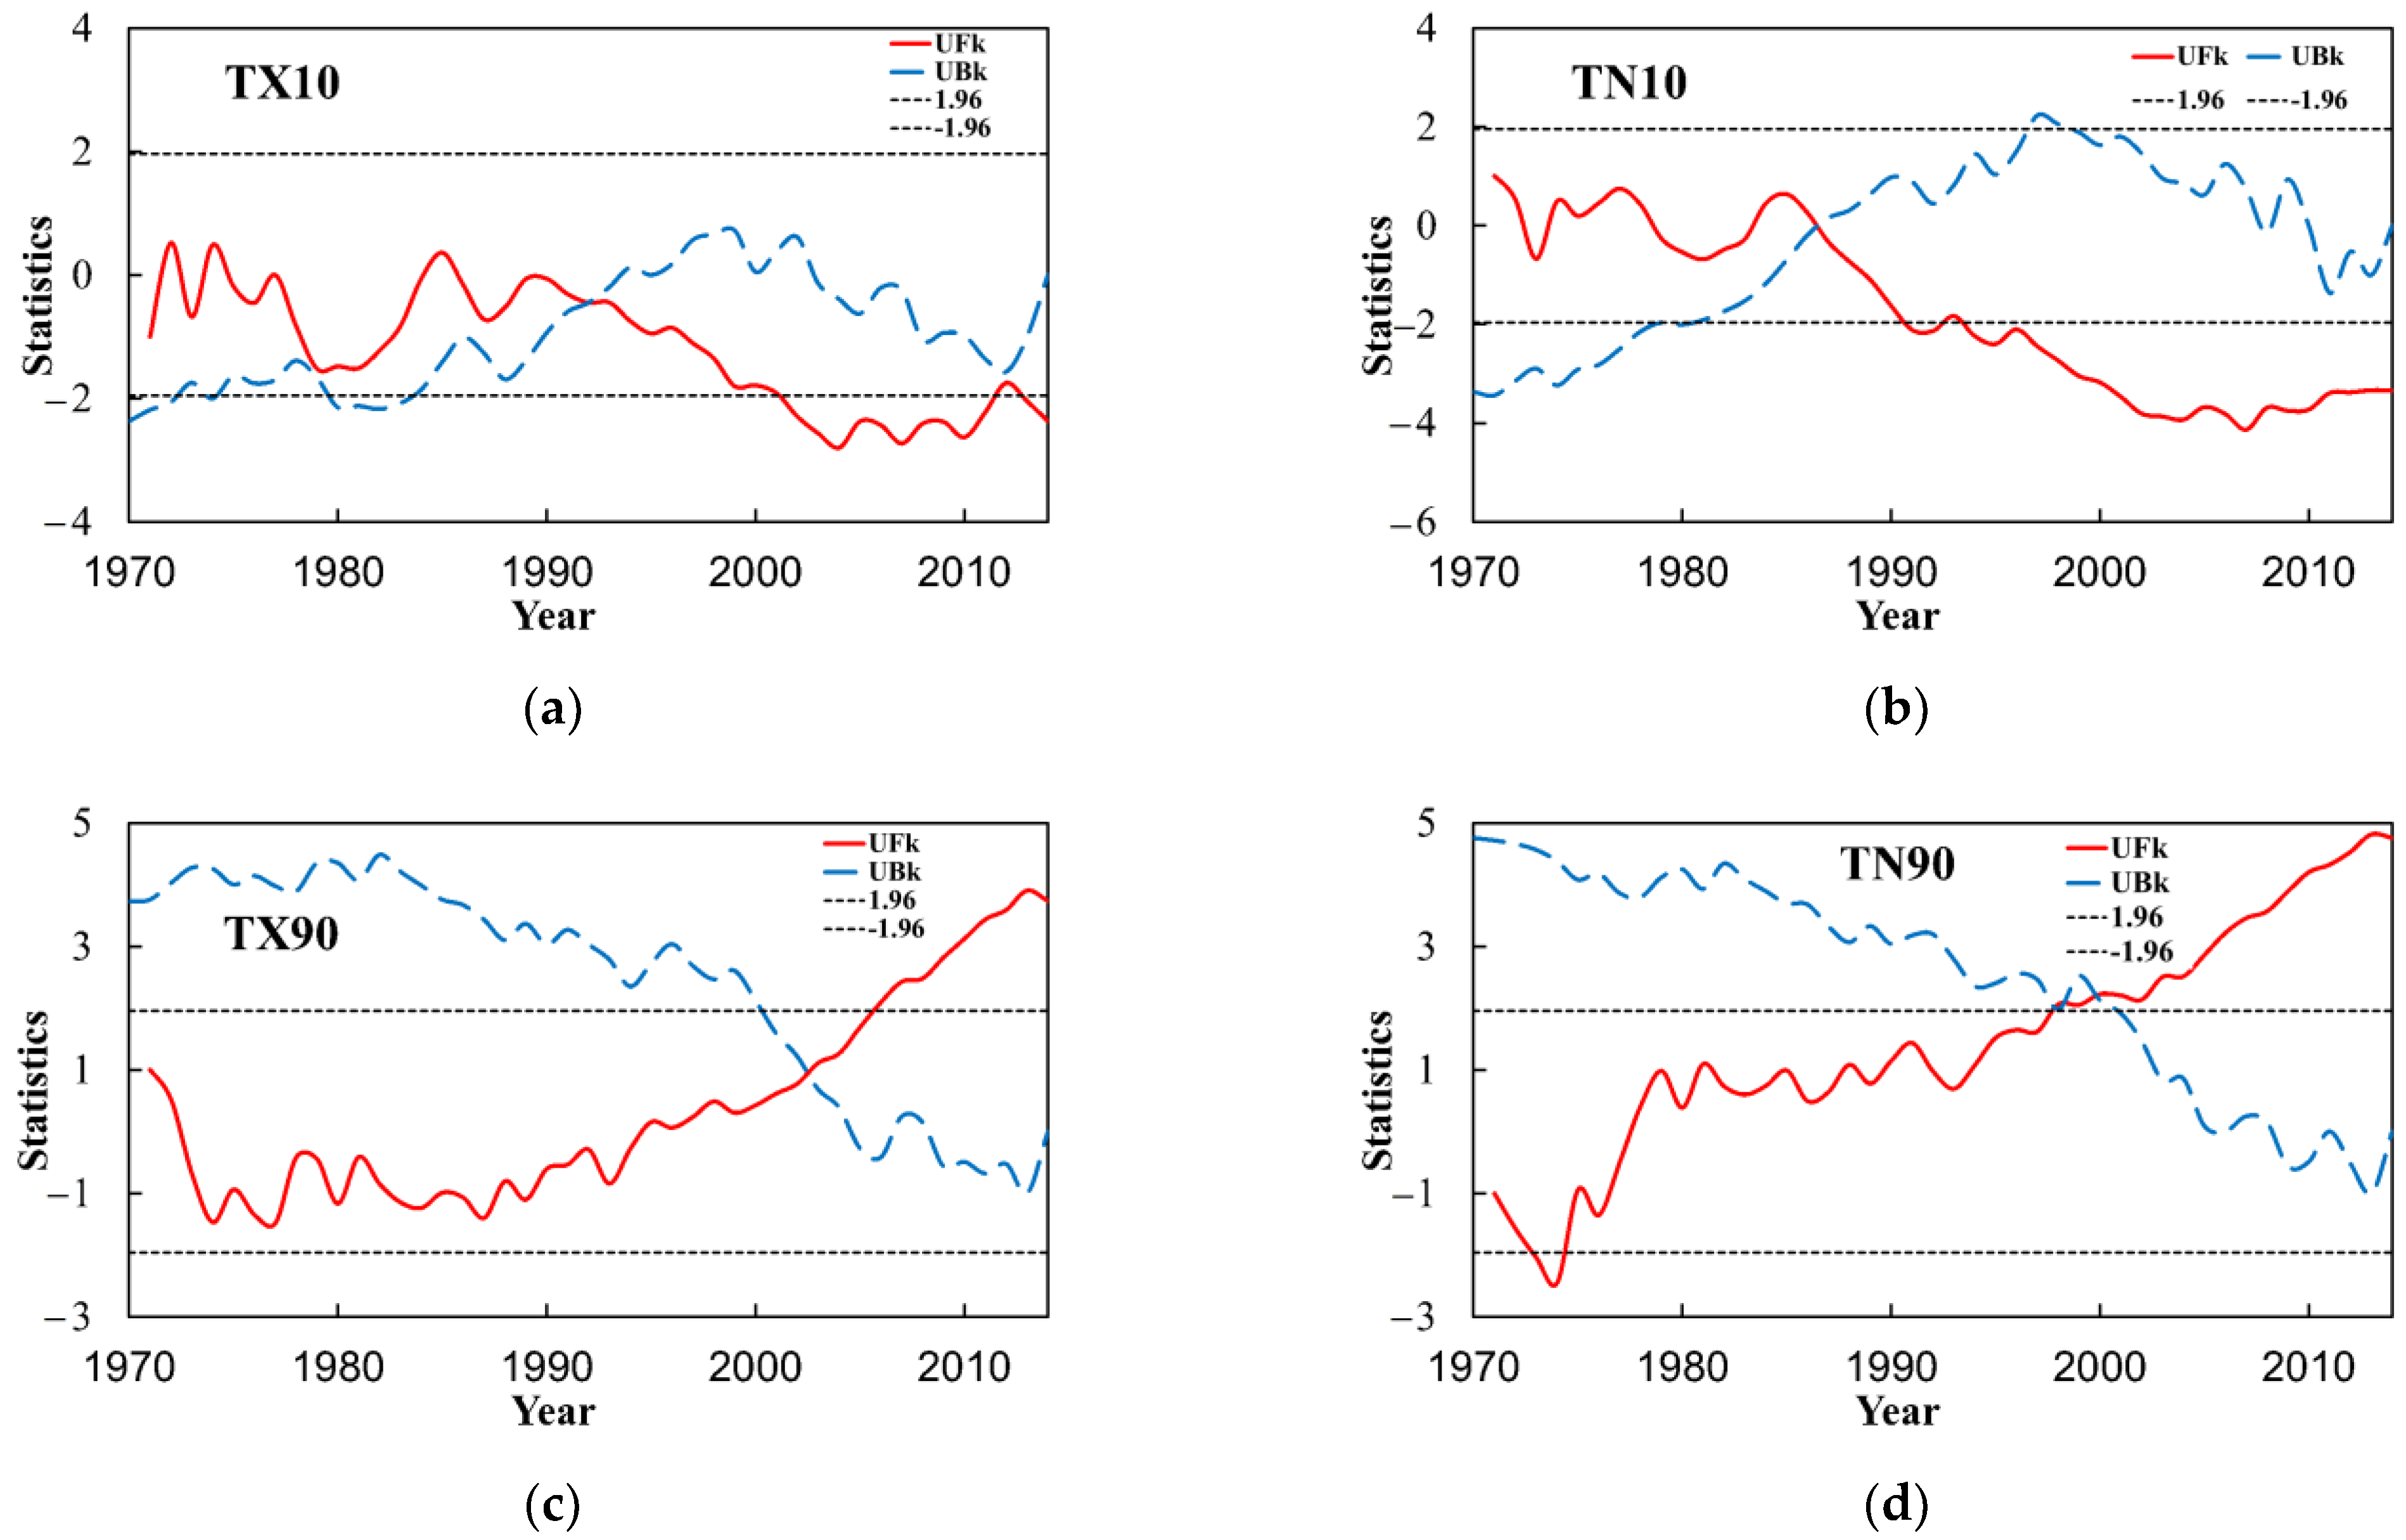
3.4.1. Relative Indices
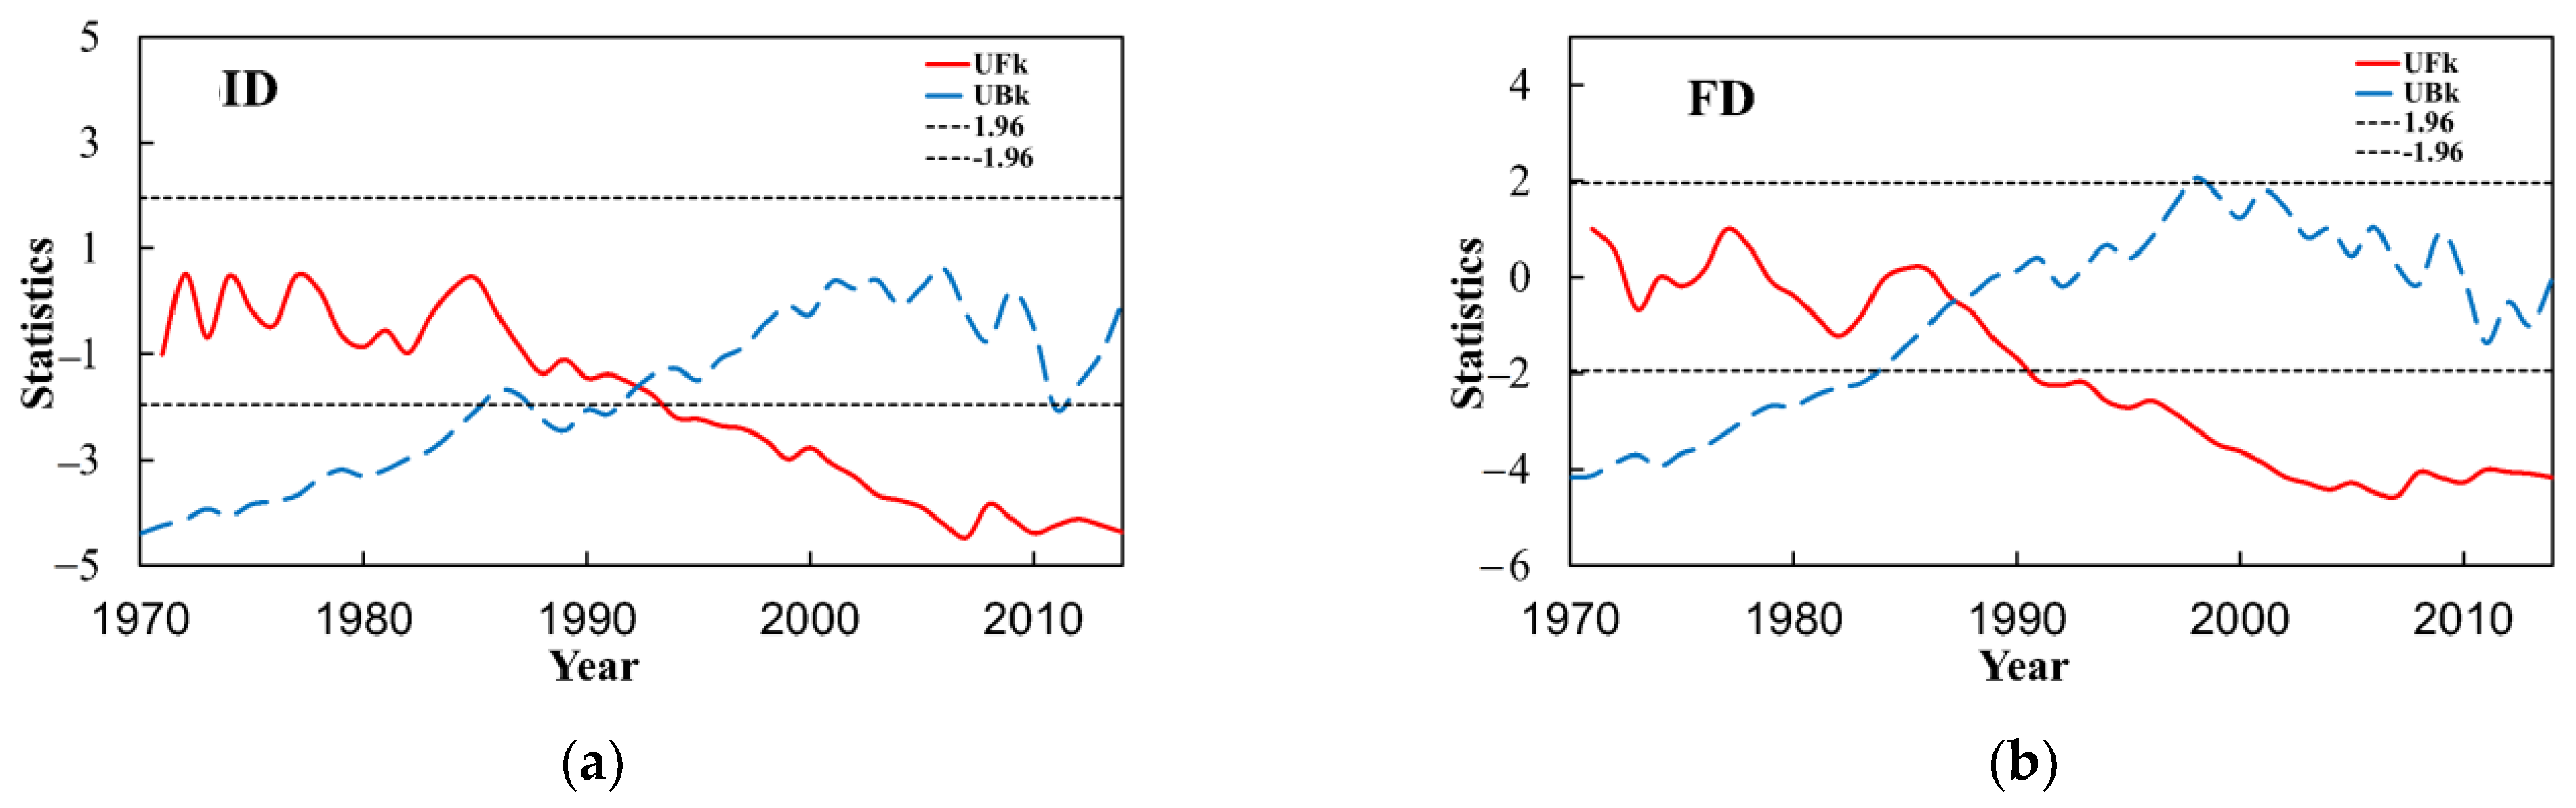
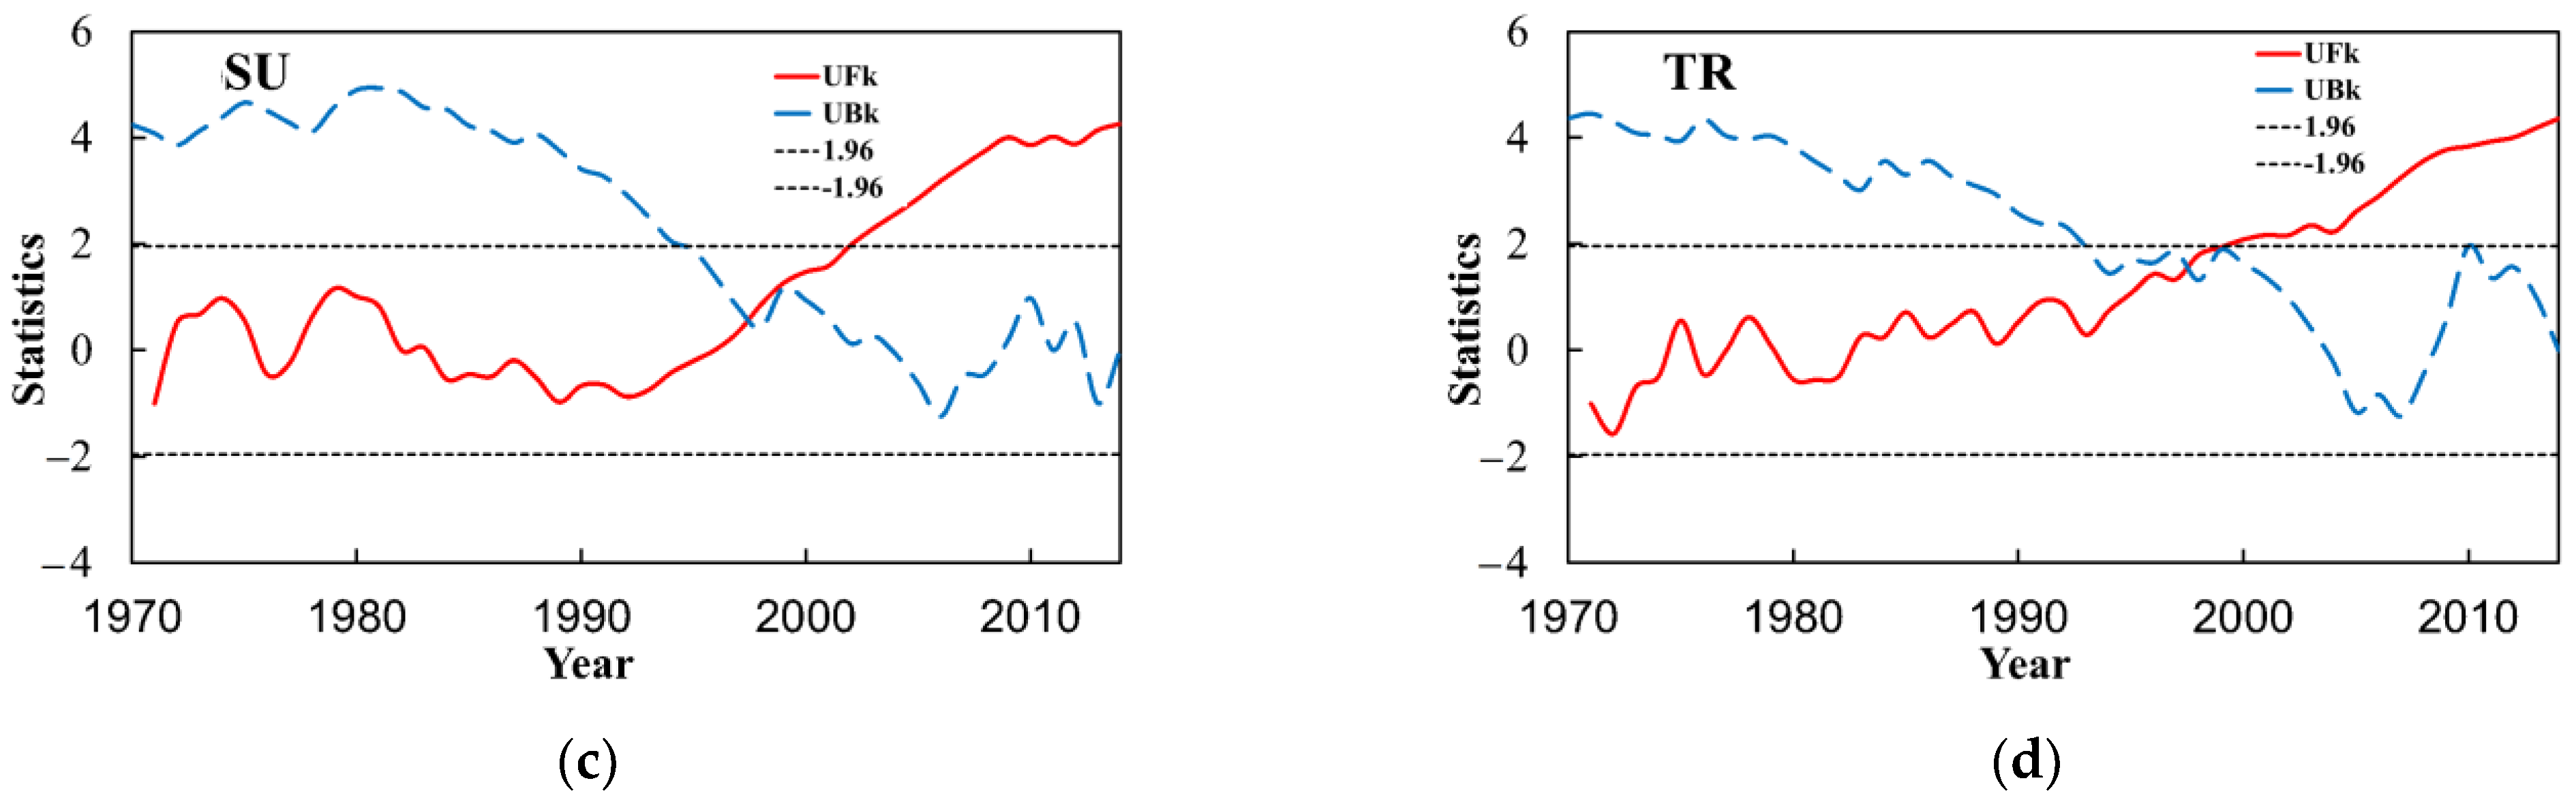
3.4.2. Absolute Indices
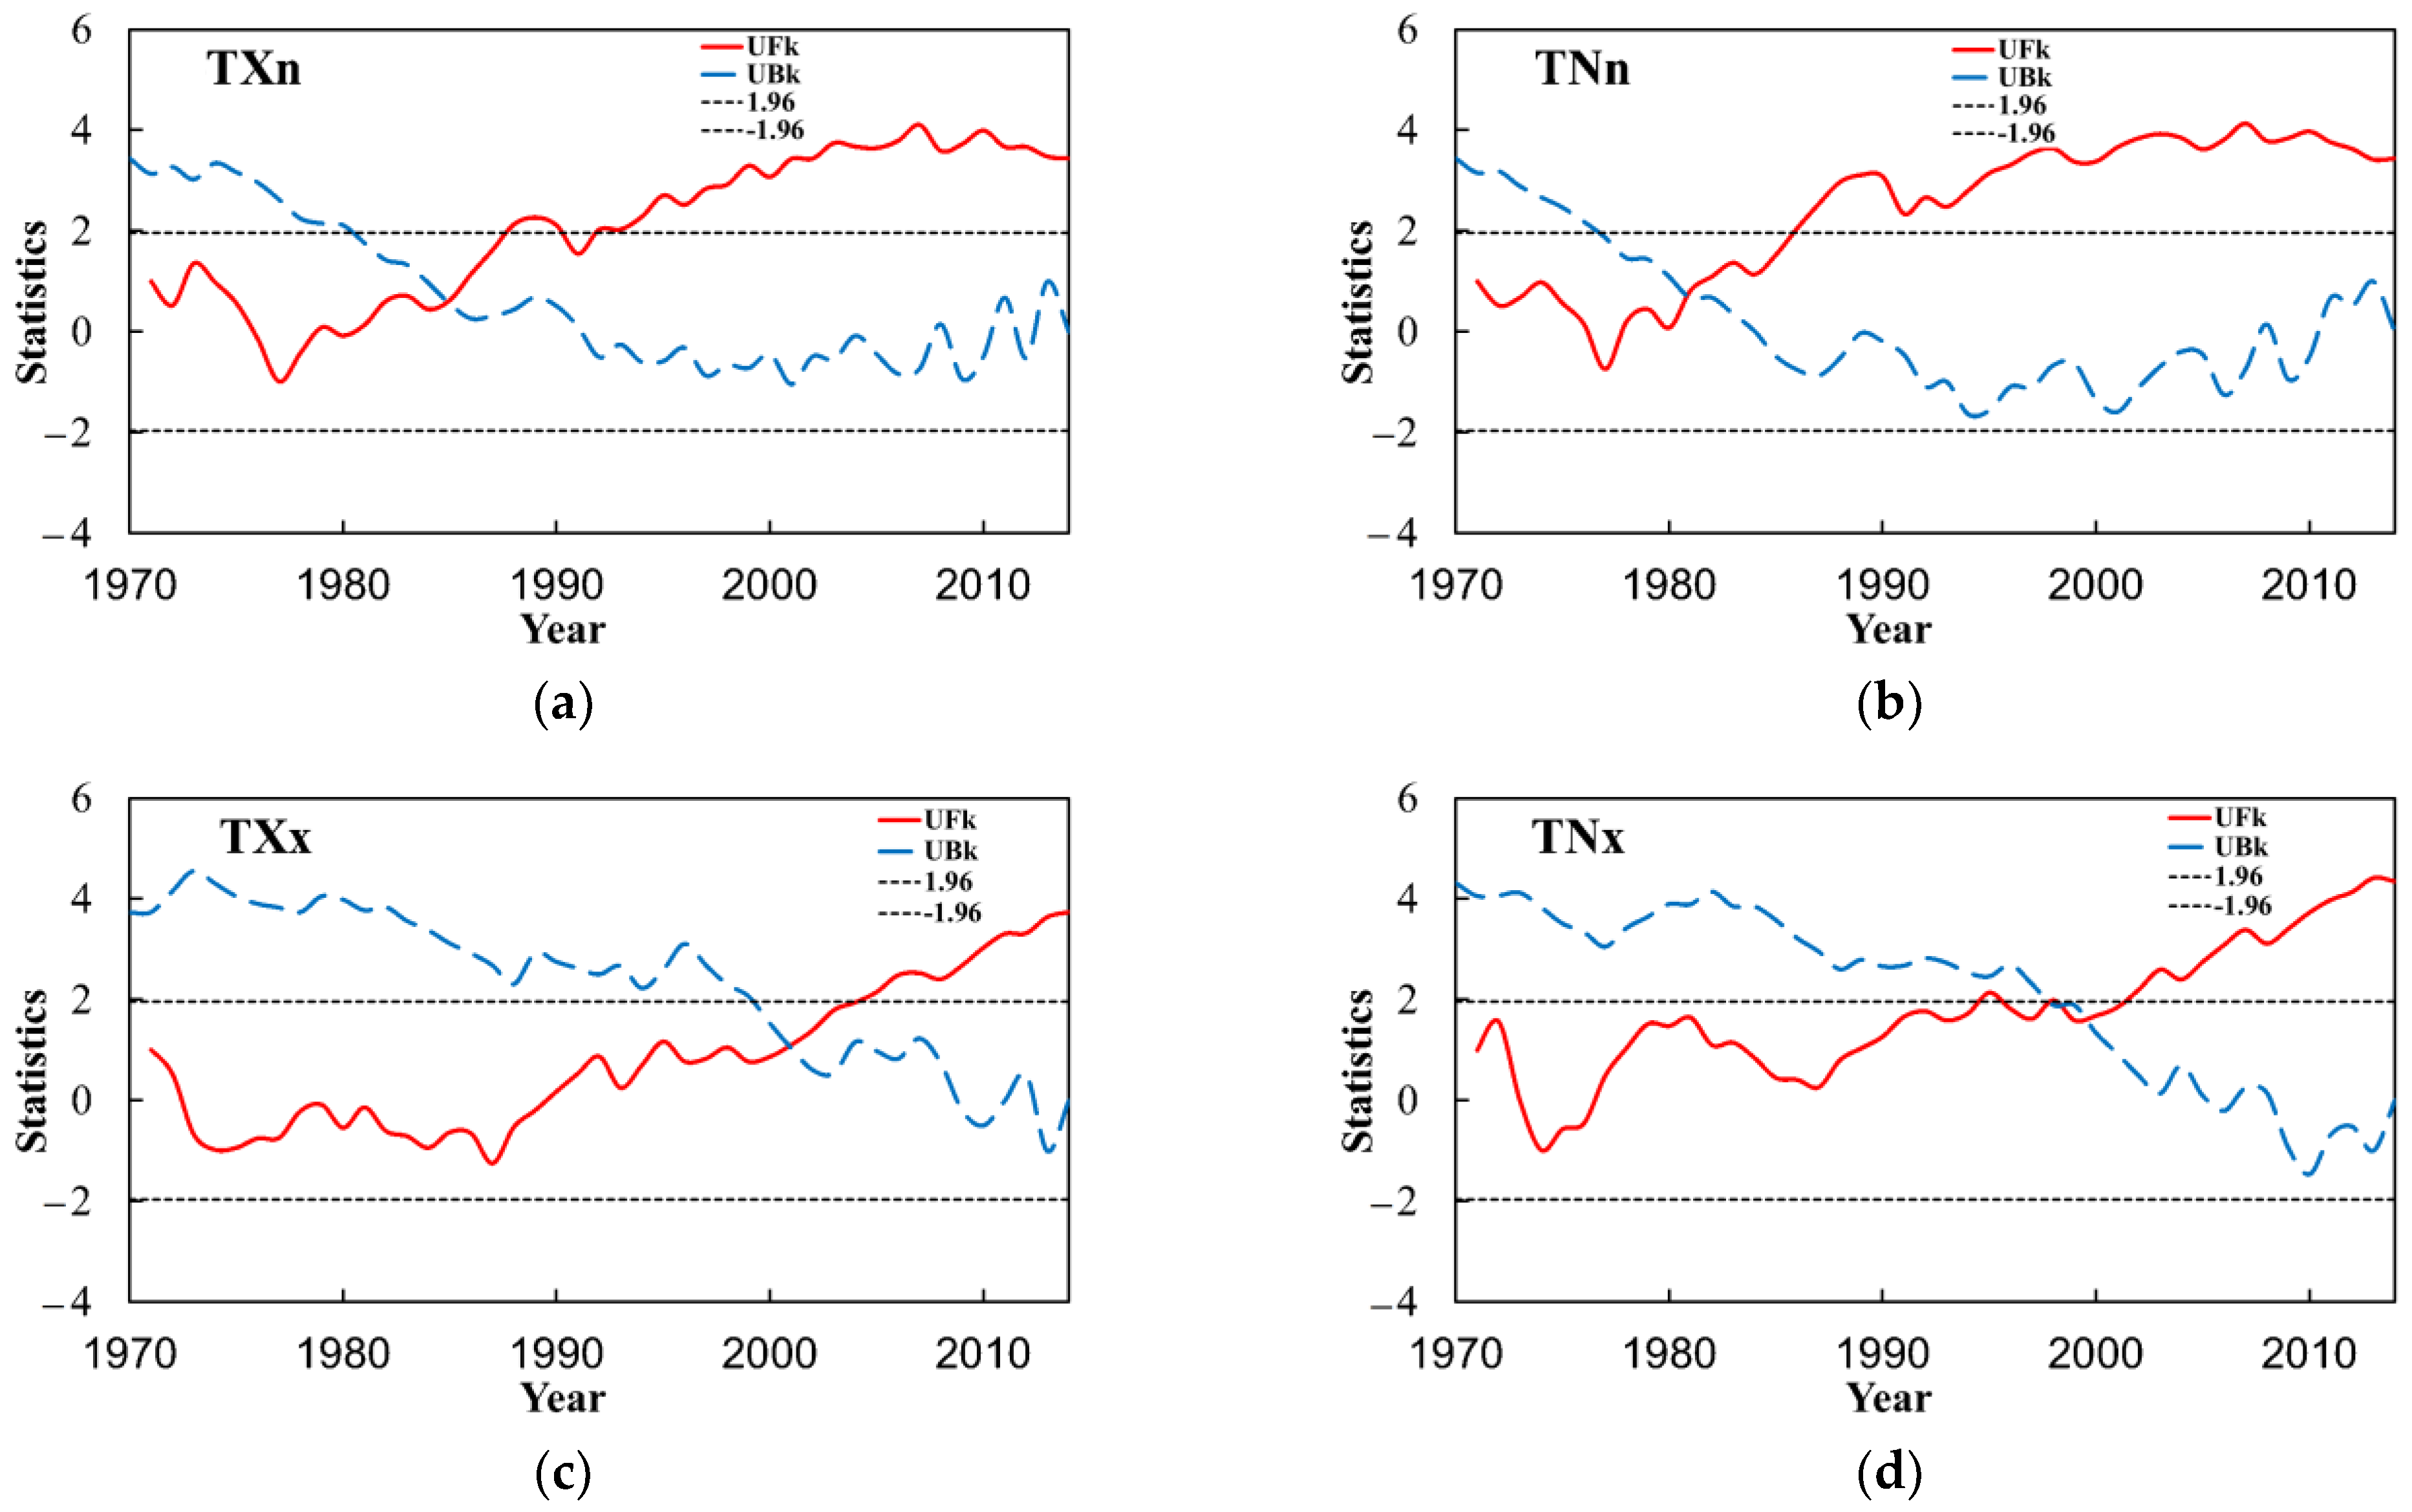
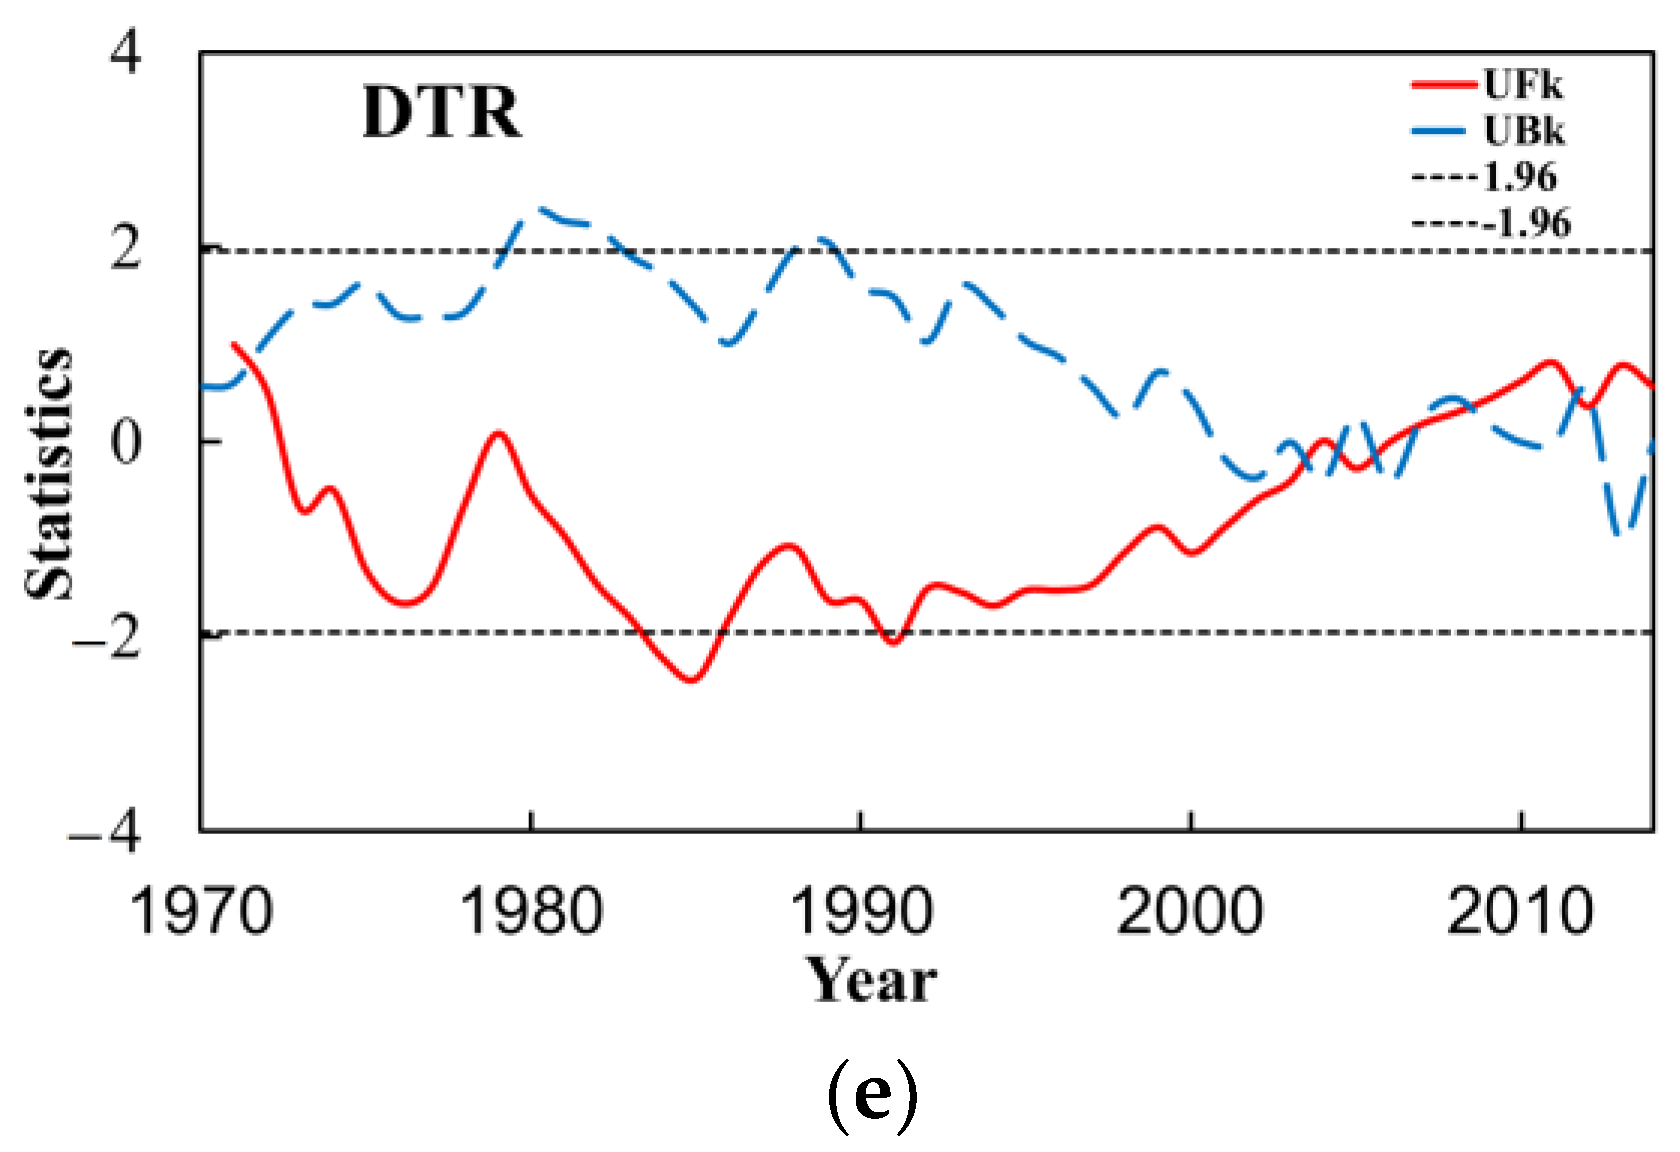
3.4.3. Extremal Indices
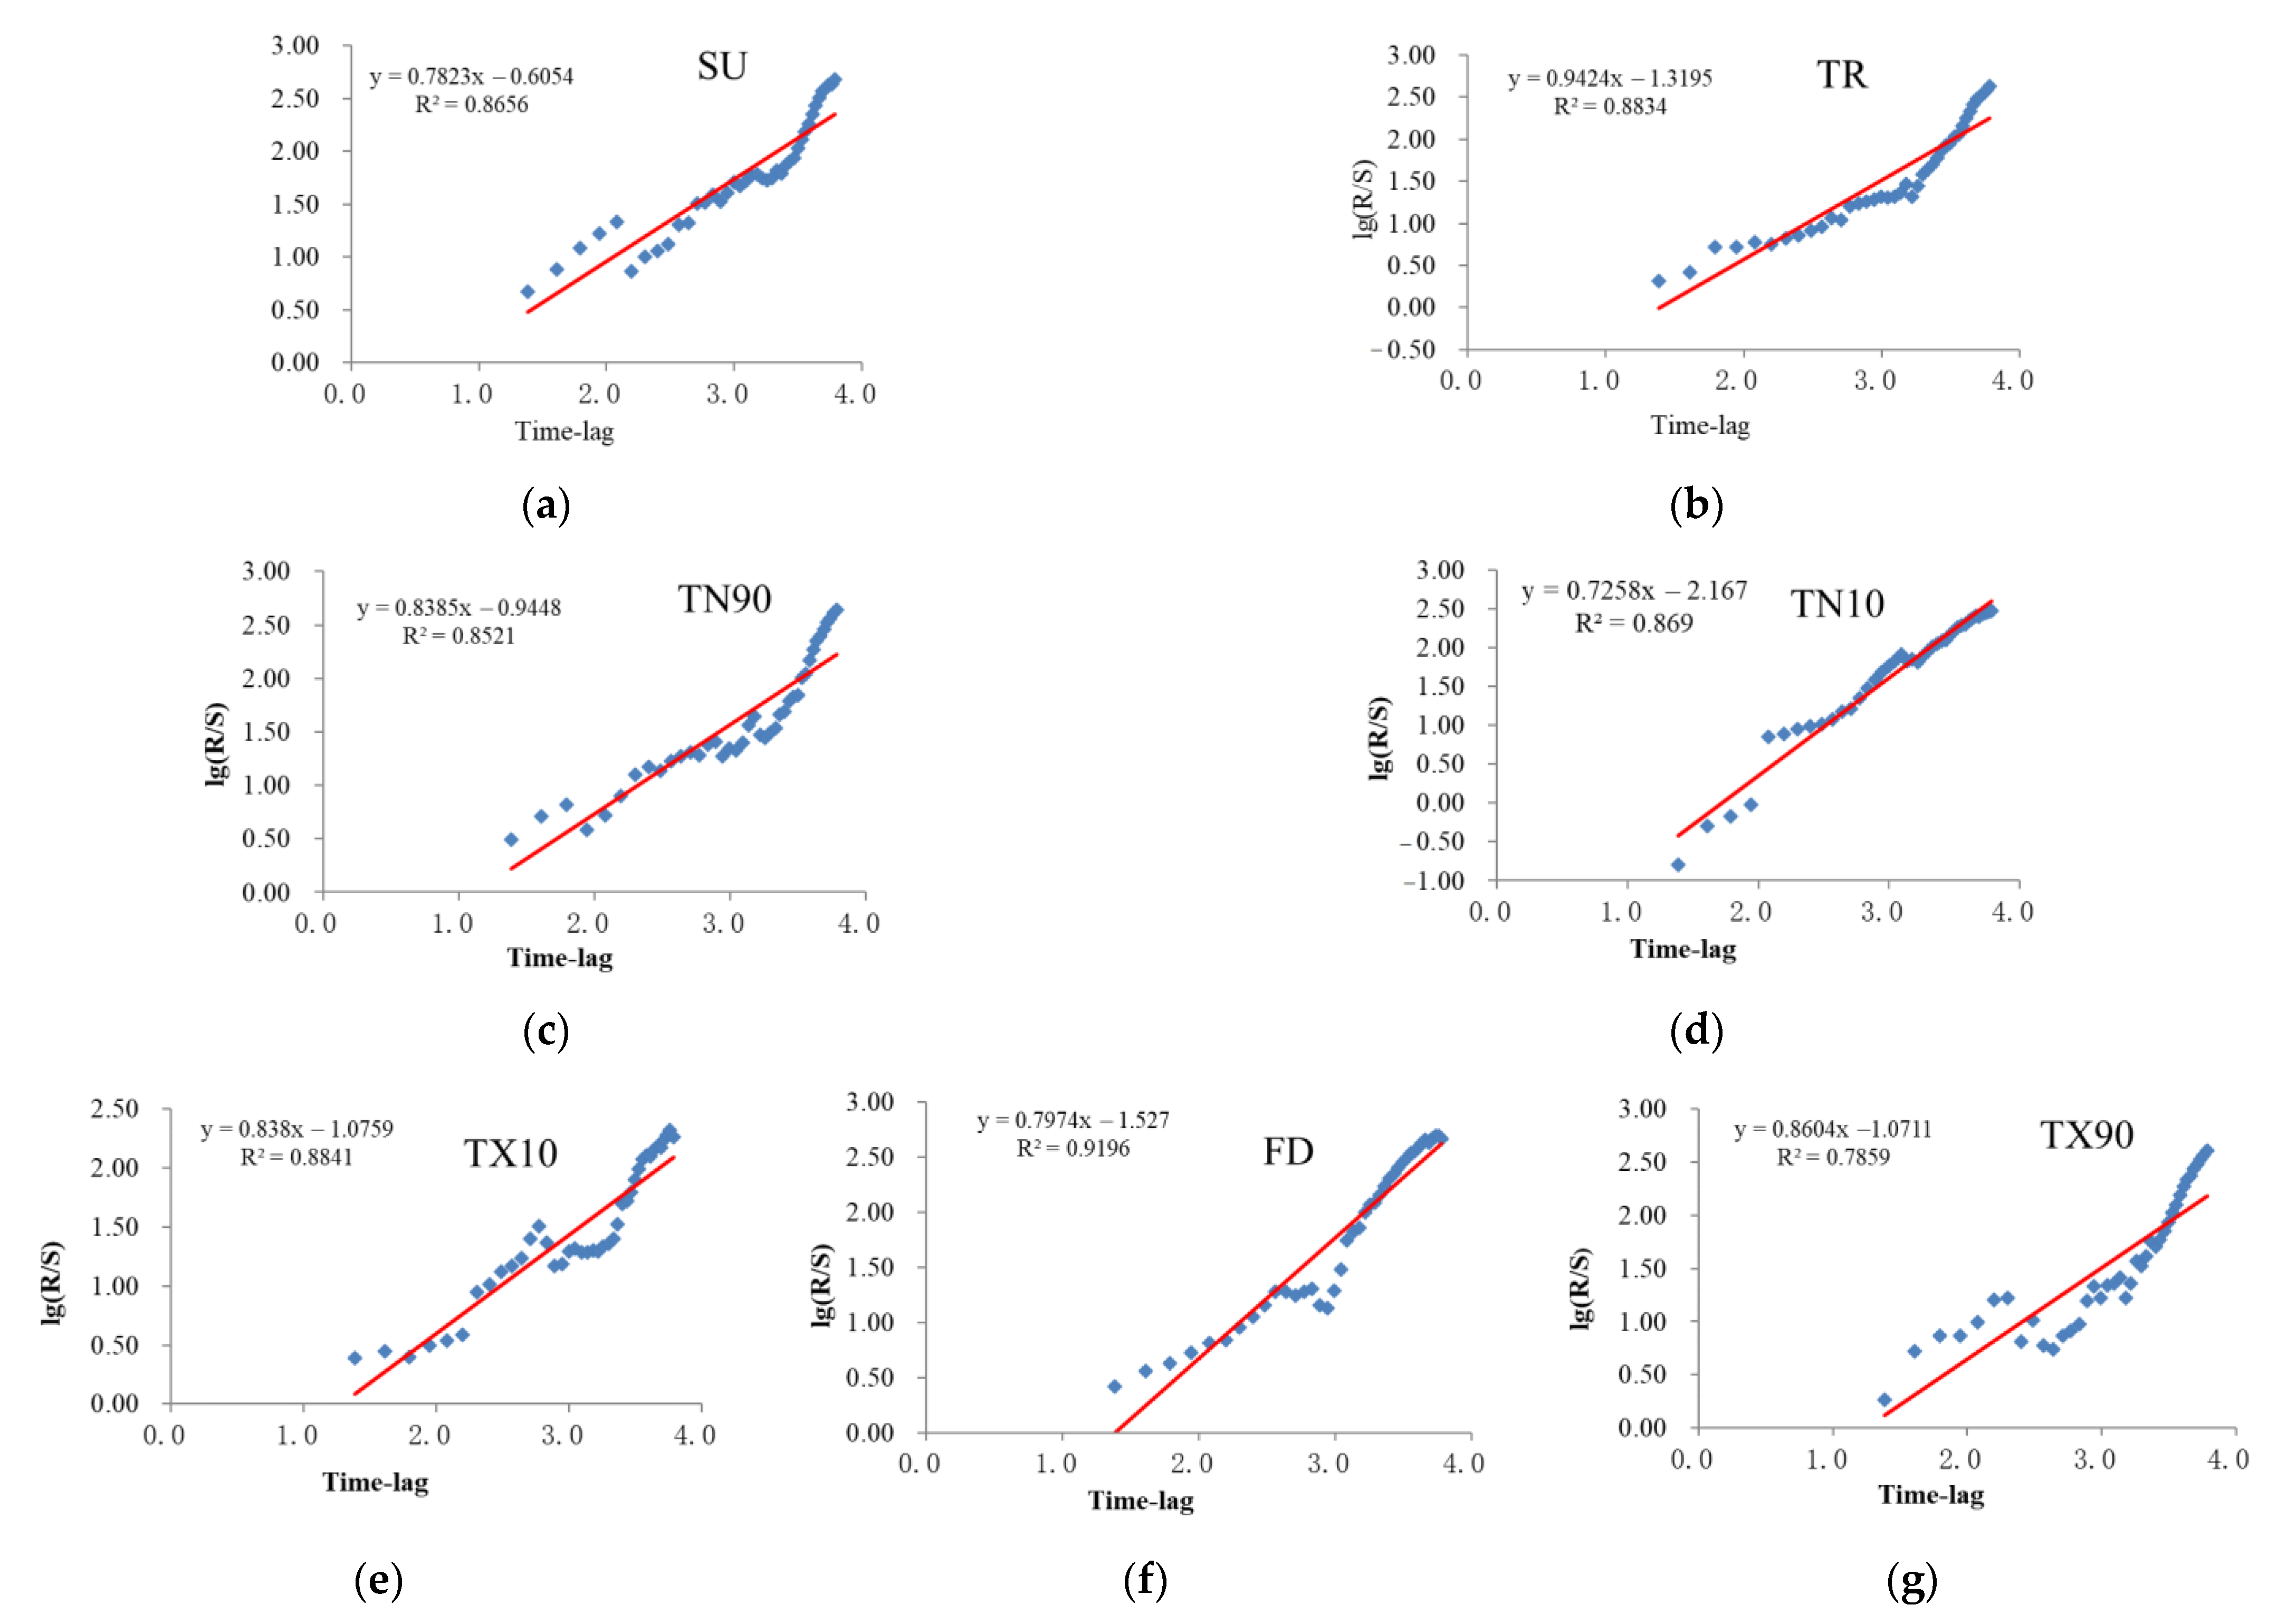
3.5. The Prediction of Extreme Temperature Indices
3.6. Possible Causes of Observed Changes in Temperature Extremes
4. Discussions
4.1. Comparison with Previous Studies
4.2. The Effects of Extreme Temperature Indices
5. Conclusions
- (1)
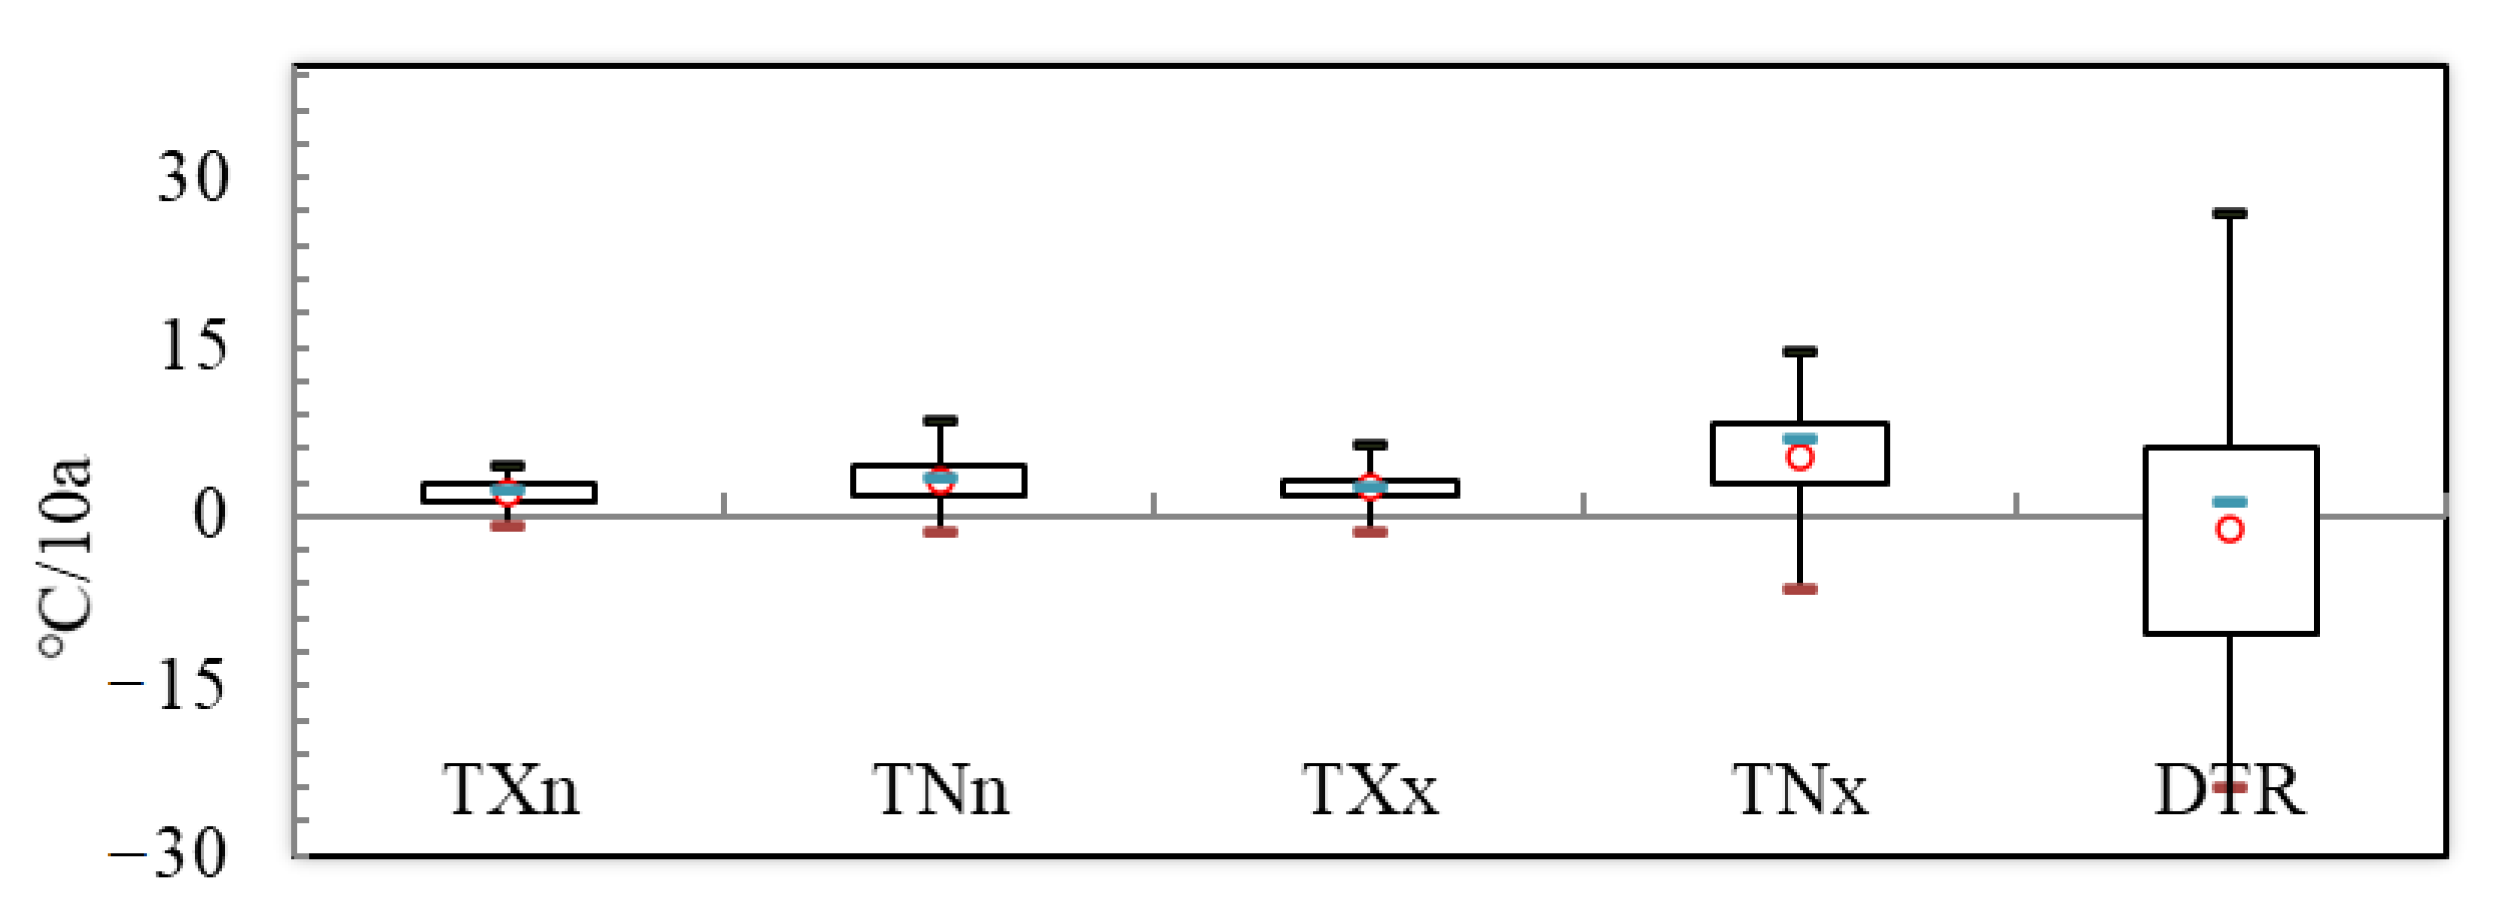
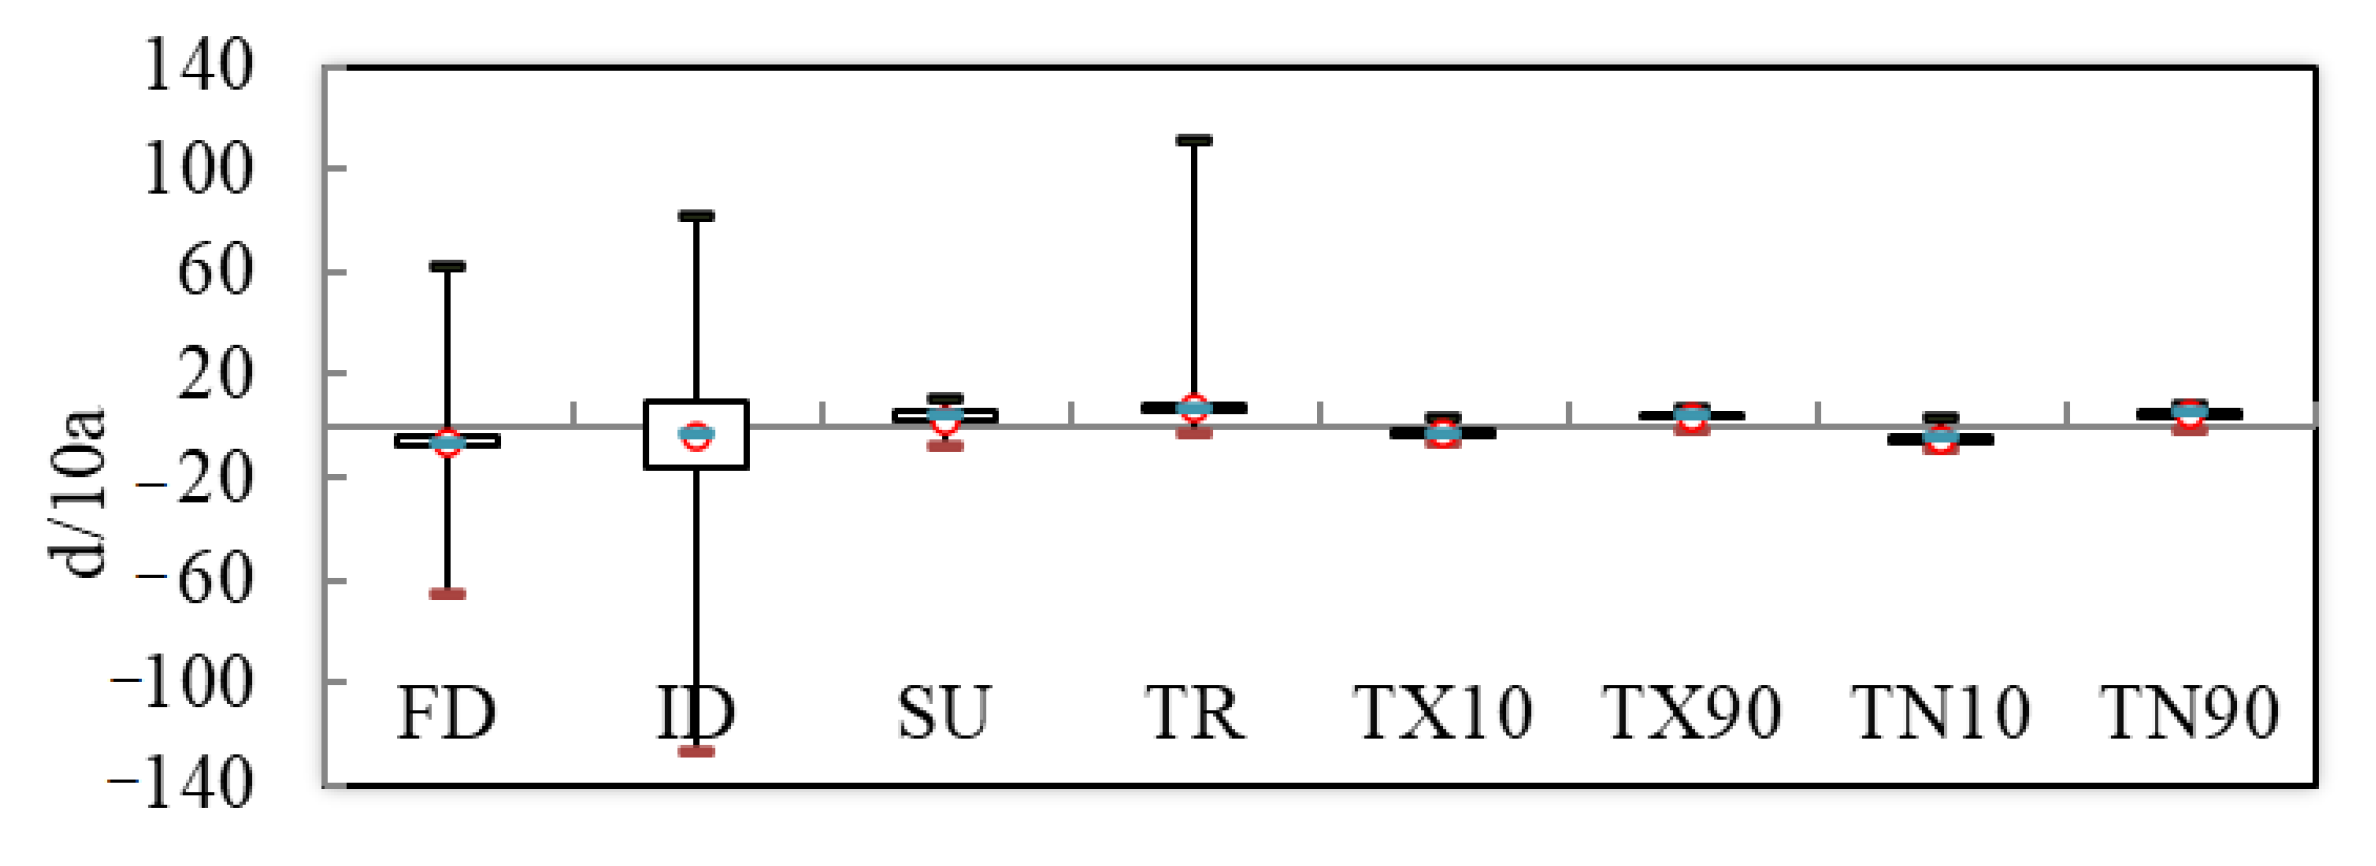
- The trend of cold days, cold nights, ice days, and frost days decreased by −2.2, −3.6, −0.66, and −2.5 d/10a, respectively, while the trend of TX90, TN90, SU, TXx, and TR shows trends of 4.73, 3.82, 2.2, 0.27, and 2.8 d/10a, respectively. The tendency rates of TXn, TNn, TNx, and DTR range is 0.39, 0.5, 0.24, and −0.003 °C/10a, respectively. Spatially, the main extremely warm indices of meteorological stations were increasing, while the extremely cold indices were decreasing in the Yangtze River Basin.
- (2)
- Except for DTR and TN90, there were no abrupt changes; the other 11 extreme temperature indicators all had abrupt changes. TX10 changed abruptly in 1987 and TN10 changed abruptly in 2003; ID changed abruptly in 1982 and FD changed abruptly in 1988; SU had an abrupt change point in 1988 and TR had an abrupt change point in 1985; the occurrences of abrupt changes of TXn and TNx were in 2001 and 1998, respectively. The main cold indices changed abruptly in the 1980s and the main warm indices changed abruptly in the late 1990s and early 2000s.
- (3)
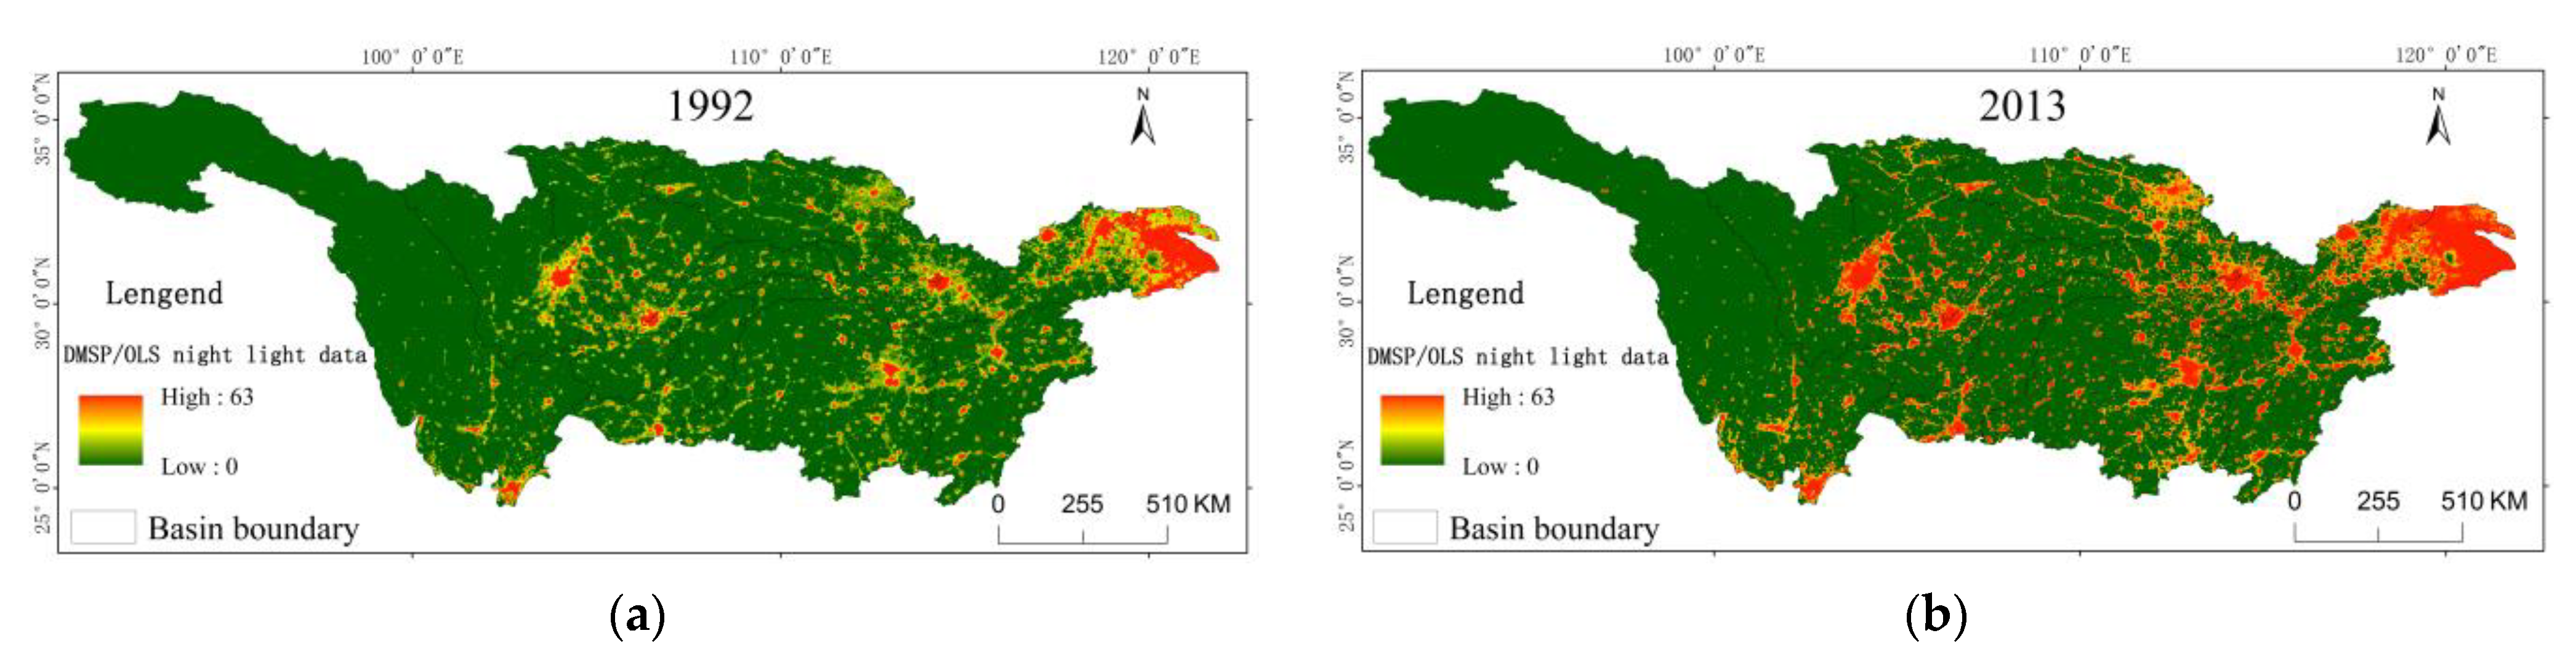
- The extreme temperature indices are affected by the atmospheric circulation and urban heat island effect in the Yangtze River Basin. Relative indices and absolute indices will continue to maintain the present trend in the future, which has a certain guiding significance for agricultural and social economic development.
Author Contributions
Funding
Institutional Review Board Statement
Informed Consent Statement
Data Availability Statement
Acknowledgments
Conflicts of Interest
References
- IPCC. Working Group I Contribution to the IPCC Fifth Assessment Report, Climate Change 2013: The Physical Science Basis: Summary for Policymakers. Available online: http://www.cmcc.it/wp-content/uploads/2012/12/lista-autori-wgi-ar5.pdf (accessed on 25 July 2021).
- IPCC. Managing the Risks of Extreme Events and Disasters to Advance Climate Change Adaptation: Special Report of the Intergovernmental Panel on Climate Change. Available online: https://www.ipcc.ch/site/assets/uploads/2018/03/SREX_Full_Report-1.pdf (accessed on 10 August 2021).
- Alexander, L.V.; Zhang, X.; Peterson, T.C.; Caesar, J.; Gleason, B.; Klein Tank, A.M.G.; Haylock, M.; Collins, D.; Trewin, B.; Rahimzadeh, F.; et al. Global observed changes in daily climate extremes of temperature and precipitation. J. Geophys. Res. Atmos. 2006, 111, 1–22. [Google Scholar] [CrossRef] [Green Version]
- Collins, D.A.; Della-Marta, P.M.; Plummer, N.; Trewin, B.C. Trends in annual frequencies of extreme temperature events in Australia. Aust. Meteorol. Mag. 2000, 49, 277–292. [Google Scholar]
- Bonsal, B.R.; Zhang, X.; Vincent, L.A.; Hogg, W.D. Characteristics of daily and extreme temperatures over Canada. J. Clim. 2001, 14, 1959–1976. [Google Scholar] [CrossRef]
- Rusticucci, M.; Renom, M. Variability and trends in indices of quality-controlled daily temperature extremes in Uruguay. Int. J. Climatol. 2010, 28, 1083–1095. [Google Scholar] [CrossRef]
- Tank, A.K.; Können, G.P. Trends in indices of daily temperature and precipitation extremes in Europe, 1946–1999. J. Clim. 2003, 16, 3665–3680. [Google Scholar] [CrossRef]
- Filahi, S.; Tanarhte, M.; Mouhir, L.; El Morhit, M.; Tramblay, Y. Trends in indices of daily temperature and precipitations extremes in Morocco. Theor. Appl. Climatol. 2016, 124, 959–972. [Google Scholar] [CrossRef]
- Tank, A.M.; Peterson, T.C.; Quadir, D.A.; Dorji, S.; Zou, X.; Tang, H.; Santhosh, K.; Joshi, U.R.; Jaswal, A.K.; Kolli, R.K.; et al. Changes in daily temperature and precipitation extremes in central and south Asia. J. Geophys. Res. Atmos. 2006, 111, 709–720. [Google Scholar]
- Guo, J.; Ren, G.Y.; Ren, Y. Changes of mean and extreme temperatures in Tianjin in recent 100 years. Plateau Meteorol. 2011, 30, 1399–1405. [Google Scholar]
- Li, S.; Yang, S. Changes of extreme temperature events in Beijing during 1960–2014. Chin. Geogr. Sci. 2015, 35, 1640–1647. [Google Scholar]
- Fischer, T.; Gemmer, M.; Lüliu, L.; Buda, S. Temperature and precipitation trends and dryness/wetness pattern in the Zhujiang River Basin, South China, 1961–2007. Quat. Int. 2011, 244, 138–148. [Google Scholar] [CrossRef]
- Wang, B.; Zhang, M.; Wei, J.; Wang, S.; Li, S.; Ma, Q.; Li, X.; Pan, S. Changes in extreme events of temperature and precipitation over Xinjiang, northwest China, during 1960–2009. Quat. Int. 2013, 298, 141–151. [Google Scholar] [CrossRef]
- Liang, K.; Bai, P.; Li, J.; Liu, C. Variability of temperature extremes in the Yellow River basin during 1961–2011. Quat. Int. 2014, 336, 52–64. [Google Scholar] [CrossRef]
- Wang, Q.X.; Wang, M.B.; Fan, X.H.; Zhang, F.; Zhu, S.Z.; Zhao, T.L. Trends of temperature and precipitation extremes in the Loess Plateau Region of China, 1961–2010. Theor. Appl. Climatol. 2017, 129, 949–963. [Google Scholar] [CrossRef]
- Ling, H.; Chen, A.F.; Zhu, Y.H.; Wang, H.L.; He, B. Trends of temperature extremes in summer and winter during 1971–2013 in China. Atmos. Ocean. Sci. Lett. 2015, 8, 220–225. [Google Scholar] [CrossRef]
- Fang, S.; Qi, Y.; Han, G.; Li, Q.; Zhou, G. Changing trends and abrupt features of extreme temperature in mainland China from 1960 to 2010. Atmosphere 2016, 7, 22. [Google Scholar] [CrossRef] [Green Version]
- Chen, X. The formation, evolvement and reorganization of spatial structure in Yangtze River Economic Zone. Acta Geogr. Sin. 2007, 62, 1266–1273. [Google Scholar]
- Deng, X.; Huang, J.; Rozelle, S.; Uchida, E. Growth, population and industrialization, and urban land expansion of China. J. Urban Econ. 2008, 63, 96–115. [Google Scholar] [CrossRef]
- Liu, Z.; He, C.; Zhang, Q.; Huang, Q.; Yang, Y. Extracting the dynamics of urban expansion in China using DMSP-OLS nighttime light data from 1992 to 2008. Landsc. Urban Plan. 2012, 106, 62–72. [Google Scholar] [CrossRef]
- Sang, Y.F.; Wang, Z.; Liu, C. Spatial and temporal variability of daily temperature during 1961–2010 in the Yangtze River Basin, China. Quat. Int. 2013, 304, 33–42. [Google Scholar] [CrossRef]
- Su, B.D.; Jiang, T.; Jin, W.B. Recent trends in observed temperature and precipitation extremes in the Yangtze River basin, China. Theor. Appl. Climatol. 2006, 83, 139–151. [Google Scholar] [CrossRef]
- Sang, Y.F. Spatial and temporal variability of daily temperature in the Yangtze River Delta, China. Atmos. Res. 2012, 112, 12–24. [Google Scholar] [CrossRef]
- Cui, L.; Wang, L.; Qu, S.; Singh, R.P.; Lai, Z.; Yao, R. Spatiotemporal extremes of temperature and precipitation during 1960–2015 in the Yangtze River Basin (China) and impacts on vegetation dynamics. Theor. Appl. Climatol. 2019, 136, 675–692. [Google Scholar] [CrossRef]
- Wang, Q.; Zhang, M.; Wang, S.; Ma, Q.; Sun, M. Changes in temperature extremes in the Yangtze River Basin, 1962–2011. J. Geogr. Sci. 2014, 24, 59–75. [Google Scholar] [CrossRef]
- Guan, Y.; Zhang, X.; Zheng, F.; Wang, B. Trends and variability of daily temperature extremes during 1960–2012 in the Yangtze River Basin, China. Glob. Planet. Chang. 2015, 124, 79–94. [Google Scholar] [CrossRef] [Green Version]
- Niu, Z.; Wang, L.; Fang, L.; Li, J.; Yao, R. Analysis of spatiotemporal variability in temperature extremes in the Yellow and Yangtze River basins during 1961–2014 based on high-density gauge observations. Int. J. Climatol. 2020, 40, 1–21. [Google Scholar] [CrossRef]
- Xia, F.; Liu, X.; Xu, J.; Wang, Z.; Huang, J.; Brookes, P.C. Trends in the daily and extreme temperatures in the Qiantang River basin, China. Int. J. Climatol. 2015, 35, 57–68. [Google Scholar] [CrossRef]
- Chen, X.; Zhou, T. Relative contributions of external SST forcing and internal atmospheric variability to July–August heat waves over the Yangtze River valley. Clim. Dynam. 2018, 51, 4403–4419. [Google Scholar] [CrossRef]
- Chen, R.; Wen, Z.; Lu, R.; Wang, C. Causes of the extreme hot midsummer in central and South China during 2017: Role of the western tropical Pacific warming. Adv. Atmos. Sci. 2019, 36, 465–478. [Google Scholar] [CrossRef]
- Kovats, R.; Hajat, S. Heat Stress and Public Health: A Critical Review. Annu. Rev. Public Health 2008, 29, 41–55. [Google Scholar] [CrossRef] [PubMed]
- Amengual, A.; Homar, V.; Romero, R.; Brooks, H.E.; Ramis, C.; Gordaliza, M.; Alonso, S. Projections of heat waves with high impact on human health in Europe. Glob. Planet. Chang. 2014, 119, 71–84. [Google Scholar] [CrossRef]
- Sherbakov, T.; Malig, B.; Guirguis, K.; Gershunov, A.; Basu, R. Ambient temperature and added heat wave effects on hospitalizations in California from 1999 to 2009. Environ. Res. 2018, 160, 83–90. [Google Scholar] [CrossRef]
- Martiello, M.A.; Giacchi, M.V. High temperatures and health outcomes: A review of the literature. Scand. J. Public Health 2010, 38, 826–837. [Google Scholar] [CrossRef]
- Liu, G.; Zhang, L.; He, B.; Jin, X.; Zhang, Q.; Razafindrabe, B.; You, H. Temporal changes in extreme high temperature, heat waves and relevant disasters in Nanjing metropolitan region, China. Nat. Hazards 2015, 76, 1415–1430. [Google Scholar] [CrossRef]
- Xu, X.; Ge, Q.; He, S.; Zhang, X.; Xu, X.; Liu, G. Impact of high temperature on the mortality in summer of Wuhan, China. Environ. Earth Sci. 2016, 75, 543. [Google Scholar]
- Sun, X.; Sun, Q.; Yang, M.; Zhou, X.; Li, X.; Yu, A.; Geng, F.; Guo, Y. Effects of temperature and heat waves on emergency department visits and emergency ambulance dispatches in Pudong New Area, China: A time series analysis. Environ. Health 2014, 13, 76. [Google Scholar] [CrossRef] [PubMed] [Green Version]
- Wang, H.; Tu, S.; Chen, Z. Interpolating Method for Missing Data of Daily Air Temperature and Its Error Analysis. Meteorol. Mon. 2008, 34, 83–91. [Google Scholar]
- Yang, G.; Xu, X.; Li, P. Research on the construction of green ecological corridors in the Yangtze River Economic Belt. Prog. Geogr. 2015, 34, 1356–1367. [Google Scholar]
- Moberg, A.; Jones, P.D. Trends in indices for extremes in daily temperature and precipitation in central and western Europe, 1901–1999. Int. J. Climatol. 2005, 25, 1149–1171. [Google Scholar] [CrossRef]
- Toreti, A.; Desiato, F. Changes in temperature extremes over Italy in the last 44 years. Int. J. Climatol. 2008, 28, 733–745. [Google Scholar] [CrossRef]
- Mann, H.B. Nonparametric tests against trend. Econometrica 1945, 13, 245–259. [Google Scholar] [CrossRef]
- Wei, F. Modern Diagnosis and Prediction of Climate Statistics, 2nd ed.; Chinse Meteorological Press: Beijing, China, 2007. [Google Scholar]
- Hurst, H.E. Long-term storage capacity of reservoirs. Trans. Am. Soc. Civ. Eng. 1951, 116, 770–799. [Google Scholar] [CrossRef]
- Wang, G.; Pang, Z.; Boisvert, J.B.; Hao, Y.; Cao, Y.; Qu, J. Quantitative assessment of mineral resources by combining geostatistics and fractal methods in the Tongshan porphyry Cu deposit (China). J. Geochem. Explor. 2013, 134, 85–98. [Google Scholar] [CrossRef]
- Li, S.; Bates, G.T. Influence of the Atlantic multidecadal oscillation on the winter climate of East China. Adv. Atmos. Sci. 2007, 24, 126–135. [Google Scholar] [CrossRef]
- Wang, Y.; Li, S.; Luo, D. Seasonal response of Asian monsoonal climate to the Atlantic Multidecadal Oscillation. J. Geophys. Res. Atmos. 2009, 114, 1–15. [Google Scholar] [CrossRef]
- Deng, H.; Zhao, F.; Zhao, X. Changes of extreme temperature events in Three Gorges area, China. Environ. Earth Sci. 2012, 66, 1783–1790. [Google Scholar] [CrossRef]
- Chen, T.; Ao, T.; Zhang, X.; Li, X.; Yang, K. Climate change characteristics of extreme temperature in the Minjiang river basin. Adv. Meteorol. 2019, 2019, 1935719. [Google Scholar] [CrossRef] [Green Version]
- Chan, J.C.L.; Gray, W.M. Tropical cyclone movement and surrounding flow relationships. Mon. Weather Rev. 1982, 110, 1354–1374. [Google Scholar] [CrossRef] [Green Version]
- Zhong, S.; Qian, Y.; Zhao, C.; Leung, R.; Wang, H.; Yang, B.; Fan, J.; Yan, H.; Yang, X.; Liu, D. Urbanization-induced urban heat island and aerosol effects on climate extremes in the Yangtze River Delta region of China. Atmos. Chem. Phys. 2017, 17, 5439–5457. [Google Scholar] [CrossRef] [Green Version]
- Yao, R.; Wang, L.; Huang, X.; Zhang, W.; Li, J.; Niu, Z. Interannual variations in surface urban heat island intensity and associated drivers in China. J. Environ. Manag. 2018, 222, 86–94. [Google Scholar] [CrossRef]
- Yao, R.; Wang, L.; Gui, X.; Zheng, Y.; Zhang, H.; Huang, X. Urbanization effects on vegetation and surface urban heat islands in China’s Yangtze River Basin. Remote Sens. 2017, 9, 540. [Google Scholar] [CrossRef] [Green Version]
- Chen, W.; Huang, C.; Wang, L.; Li, D. Climate Extremes and Their Impacts on Interannual Vegetation Variabilities: A Case Study in Hubei Province of Central China. Remote Sens. 2018, 10, 477. [Google Scholar] [CrossRef] [Green Version]
- Liu, X.; Chen, B. Climatic warming in the Tibetan Plateau during recent decades. Int. J. Climatol. 2000, 20, 1729–1742. [Google Scholar] [CrossRef]
- IPCC. Contribution of Working Group I to the Fourth Assessment Report of the Intergovernmental Panel on Climate Change, Climate Change 2007: The Physical Science Basis. Available online: http://amper.ped.muni.cz/eave/old/SPM2feb07.pdf (accessed on 11 August 2021).
- Huang, C.; Barnett, A.G.; Xu, Z.; Chu, C.; Wang, X.; Turner, L.R.; Tong, S. Managing the health effects of temperature in response to climate change: Challenges ahead. Environ. Health Perspect. 2013, 121, 415–419. [Google Scholar] [CrossRef] [PubMed] [Green Version]
- Krishnan, P.; Ramakrishnan, B.; Reddy, K.R.; Reddy, V.R. High-temperature effects on rice growth, yield, and grain quality. Adv. Agron. 2011, 111, 87–206. [Google Scholar]
- Xie, Z.Q.; Du, Y.; Gao, P.; Zeng, Y. Impact of high-temperature on single cropping rice over Yangtze-Huaihe River Valley and response measures. Meteorol. Mon. 2013, 39, 774–781. [Google Scholar]
- Rapacz, M. Physiological effects of winter rape (Brassica napus var. oleifera) prehardening to frost. II. Growth, energy partitioning and water status during cold acclimation. J. Agron. Crop Sci. 1998, 181, 81–87. [Google Scholar] [CrossRef]
- Allen, H.M.; Pumpa, J.K.; Batten, G.D. Effect of frost on the quality of samples of Janz wheat. Aust. J. Exp. Agric. 2001, 41, 641–647. [Google Scholar] [CrossRef]
- Li, Y.; Wang, C.; Zhao, B.; Liu, W. Effects of climate change on agricultural meteorological disaster and crop insects diseases. Trans. Chin. Soc. Agric. Eng. 2010, 26, 263–271. [Google Scholar]
- Jeffs, C.T.; Lewis, O.T. Effects of climate warming on host–parasitoid interactions. Ecol. Entomol. 2013, 38, 209–218. [Google Scholar] [CrossRef]


| Category (1) 1 | Indices | Descriptive Name | Definitions | Units |
|---|---|---|---|---|
| Relative indices | TX10 | Cold days | Number of days with Tmax < 10th percentile | days |
| TN10 | Cold nights | Number of days with Tmin < 10th percentile | days | |
| TX90 | Warm days | Number of days with Tmax > 90th percentile | days | |
| TN90 | Warm nights | Number of days with Tmin > 90th percentile | days | |
| Absolute indices | ID | Ice days | Annual count when TX (daily minimum temperature) < 0 °C | days |
| FD | Frost days | Annual count when TN (daily maximum temperature) < 0 °C | days | |
| SU | Summer days | Annual count when TX > 25 °C | days | |
| TR | Tropical nights | Annual count when TN > 20 °C | days | |
| Extremal indices | TXn | Coldest day | Annual lowest TX | °C |
| TNn | Coldest night | Annual lowest TN | °C | |
| TXx | Warmest day | Annual highest TX | °C | |
| TNx | Warmest night | Annual highest TN | °C | |
| DTR | Diurnal temperature range | Monthly mean difference between TX and TN | °C |
| Extreme Temperature Indices | H | R2 |
|---|---|---|
| FD | 0.7974 | 0.9196 |
| SU | 0.7823 | 0.8656 |
| TR | 0.9424 | 0.8834 |
| TX10 | 0.8380 | 0.8841 |
| TX90 | 0.8604 | 0.7859 |
| TN90 | 0.8385 | 0.8521 |
| TN10 | 0.7258 | 0.8690 |
| Extreme Temperature Indices | Historical Change Tendency | H | Future Change Tendency |
|---|---|---|---|
| FD | decrease | 0.7974 | decrease |
| SU | increase | 0.7823 | increase |
| TR | increase | 0.9424 | increase |
| TX10 | decrease | 0.8380 | decrease |
| TX90 | increase | 0.8604 | increase |
| TN90 | increase | 0.8385 | increase |
| TN10 | decrease | 0.7258 | decrease |
| Indices | 1970–1992 | 1993–2014 |
|---|---|---|
| FD | −3.13 d/10a | −0.098 d/10a |
| ID | −0.729 d/10a | −0.27 d/10a |
| SU | −1 d/10a | 2.74 d/10a |
| TR | 1 d/10a | 0.4 d/10a |
| TNX | 0.62 °C/10a | −0.16 °C/10a |
| TXX | 0.092 °C/10a | 0.62 °C/10a |
| TXn | 0.19 °C/10a | 0.443 °C/10a |
| TNn | 0.789 °C/10a | −0.092 °C/10a |
| DTR | −0.129 °C/10a | 0.066 °C/10a |
| TX10 | −0.989 d/10a | 0.865 d/10a |
| TX90 | −0.788 d/10a | 8.479 d/10a |
| TN10 | −4.51 d/10a | 0.375 d/10a |
| TN90 | 1.49 d/10a | 7.837 d/10a |
Publisher’s Note: MDPI stays neutral with regard to jurisdictional claims in published maps and institutional affiliations. |
© 2021 by the authors. Licensee MDPI, Basel, Switzerland. This article is an open access article distributed under the terms and conditions of the Creative Commons Attribution (CC BY) license (https://creativecommons.org/licenses/by/4.0/).
Share and Cite
Shi, G.; Ye, P. Assessment on Temporal and Spatial Variation Analysis of Extreme Temperature Indices: A Case Study of the Yangtze River Basin. Int. J. Environ. Res. Public Health 2021, 18, 10936. https://doi.org/10.3390/ijerph182010936
Shi G, Ye P. Assessment on Temporal and Spatial Variation Analysis of Extreme Temperature Indices: A Case Study of the Yangtze River Basin. International Journal of Environmental Research and Public Health. 2021; 18(20):10936. https://doi.org/10.3390/ijerph182010936
Chicago/Turabian StyleShi, Guangxun, and Peng Ye. 2021. "Assessment on Temporal and Spatial Variation Analysis of Extreme Temperature Indices: A Case Study of the Yangtze River Basin" International Journal of Environmental Research and Public Health 18, no. 20: 10936. https://doi.org/10.3390/ijerph182010936
APA StyleShi, G., & Ye, P. (2021). Assessment on Temporal and Spatial Variation Analysis of Extreme Temperature Indices: A Case Study of the Yangtze River Basin. International Journal of Environmental Research and Public Health, 18(20), 10936. https://doi.org/10.3390/ijerph182010936