Article

Associations between Temperature and Influenza Activity: A National Time Series Study in China

1
State Key Laboratory for Diagnosis and Treatment of Infectious Diseases, National Clinical Research Center for Infectious Diseases, Collaborative Innovation Center for Diagnosis and Treatment of Infectious Diseases, The First Affiliated Hospital, Zhejiang University School of Medicine, Hangzhou 310058, China
2
Subject Teaching (English), College of Foreign Languages, Fujian Normal University, Fujian 350117, China
*
Authors to whom correspondence should be addressed.
These authors contributed equally.
Int. J. Environ. Res. Public Health 2021, 18(20), 10846; https://doi.org/10.3390/ijerph182010846
Submission received: 4 September 2021 / Revised: 10 October 2021 / Accepted: 12 October 2021 / Published: 15 October 2021

Abstract

:
Previous studies have reported that temperature is the main meteorological factor associated with influenza activity. This study used generalized additive models (GAMs) to explore the relationship between temperature and influenza activity in China. From the national perspective, the average temperature (AT) had an approximately negative linear correlation with the incidence of influenza, as well as a positive rate of influenza H1N1 virus (A/H1N1). Every degree that the monthly AT rose, the influenza cases decreased by 2.49% (95%CI: 1.24%–3.72%). The risk of influenza cases reached a peak at −5.35 °C with RRs of 2.14 (95%CI: 1.38–3.33) and the monthly AT in the range of −5.35 °C to 18.31 °C had significant effects on the incidence of influenza. Every degree that the weekly AT rose, the positive rate of A/H1N1 decreased by 5.28% (95%CI: 0.35%–9.96%). The risk of A/H1N1 reached a peak at −3.14 °C with RRs of 4.88 (95%CI: 1.01–23.75) and the weekly AT in the range of −3.14 °C to 17.25 °C had significant effects on the incidence of influenza. Our study found that AT is negatively associated with influenza activity, especially for A/H1N1. These findings indicate that temperature could be integrated into the current influenza surveillance system to develop early warning systems to better predict and prepare for the risks of influenza.

1. Introduction

Seasonal influenza is a common infectious disease of the respiratory tract, which causes 3–5 million infections and 290,000–650,000 deaths worldwide annually [1,2]. Previous studies have reported that the timing of the influenza epidemic peak varies in latitude, and complex interactions have been found between meteorological factors, human activity patterns, and influenza virus activities [3]. Meteorological factors are considered to link with the spatiotemporal distribution of influenza, including incidences, seasonality, and periodicity [4,5]. In temperate areas, influenza activities typically peak during winter, while in tropical and subtropical zones, the peaks might differ greatly. Some subtropical areas span a single peak per year, in winter or spring/summer, whereas some in both summer and winter, or even last for the whole year [6,7,8,9,10]. In temperate, subtropical, and tropical regions, it has been shown that the low temperature is associated with high levels of influenza activity [11]. It has been reported that low daily temperatures of 0–5 °C significantly increase the risk of influenza incidence [12]. Meanwhile, high temperature can reduce influenza viral replication [13]. An animal study suggested that low temperature could enhance the transmission of the influenza virus, and the duration of virus shedding for the infected hosts housed at 5 °C was significantly longer than that at 20 °C [14]. An Israeli study showed that when the minimum temperature rose by approximately 1.2 °C, influenza activity decreased by 22.0–42.9% [4]. In addition, the impact of weather conditions may vary by influenza virus. A Japanese study showed that only a high proportion of influenza A virus cases is observed during low temperatures and there is not a statistical association with the influenza B virus [15].
Research on the relationship between temperature and influenza activity, including incidence of influenza and susceptible influenza subtypes was limited in China. The discovery and understanding of the impact of temperature on influenza infections could help forecast the influenza epidemic through the surveillance of fluctuating temperature, which is favorable to the preliminary preparations by administrations for disease control [16]. Therefore, in this study, we aimed to explore the effects of temperature on influenza activity in China.

2. Materials and Methods

2.1. Influenza Epidemiological and Virological Data

In the 1950s, the Chinese government established a routine reporting system for selected infectious diseases, and the available data from 31 provinces in China cover approximately 1.3 billion people. This system has been web-based since 2003 [17]. Influenza belongs to the Class C notifiable infectious diseases in China. In this study, we extracted influenza case data from the notifiable infectious disease report database, which is open and available from the data center of China’s public health sciences [18]. We obtained incidence and mortality data for the influenza cases from 2004 to 2017, stratified by date (month and year) and province. Weekly influenza surveillance virological data stratified by region (northern and southern China) and subtypes (e.g., H1, H3, and B) from 2010 to 2019 were collected from China’s National Influenza Center.

2.2. Meteorological Data

Monthly and weekly meteorological data from 839 climate monitor stations during 2004–2019, covering China, were downloaded from the China Meteorological Data Sharing Service System (CMDSSS) (www.data.cma.cn, accessed on 17 April 2021). The monthly and weekly meteorological factors for each monitor station, including average temperature (AT; °C), monthly average relative humidity (ARH; %), monthly average wind speed (AWS; cm/s), monthly average cumulative precipitation (ACP; mm), and monthly average air pressure (AAP; hPa), were collected (Table 1). The meteorological and influenza case data and the meteorological and influenza virological data from the same province were combined to obtain influenza case–weather and influenza virological–weather databases, respectively. These influenza case–weather and influenza virological–weather databases for China were further divided into northern and southern China (Figure 1B).

2.3. Generalized Additive Models (GAMs)

Then, the influenza case–weather and influenza virological–weather databases were classified into several subgroups, including region (northern and Southern China), age (≤14 years, 15–59 years, and ≥60 years). Spearman correlation analysis was conducted, and only one of the highly-correlated variables (r > 0.6) was selected to avoid multicollinearity among meteorological factors (Supplementary Figure S1). For the influenza case–weather database, we developed two GAMs, and for the influenza virological database, we developed three GAMs. We used these GAMs with a negative binomial distribution to initially fit the exposure–response between each meteorological factor and the incidence of influenza. Relative risk (RR) with its 95% confidence interval (CI) was calculated to evaluate the risk of influenza with changes in meteorological factors. An almost linear relationship was found between meteorological factors and the incidence of influenza. Then, we removed the spline function and used the following GAMs:
For the influenza case–weather database:
Model1: Log[[E(Yt)]] = β0 + β1(ATt) + β2(ARHt) + β3(MOYt) + s(time,df)+ et;
Model2: Log[[E(Yt)]] = β0 + β1(ATt) + β2(AWSt) + β3(MOYt) + s(time,df)+ et;
For the influenza virological–weather database:
Model1: Log[[E(Yt)]] = β0 + β1(ATt) + β2(ARHt) + β3(AWSt) + β4(MOYt) + s(time,df)+ et;
Model2: Log[[E(Yt)]] = β0 + β1(ATt) + β2(ARHt) + β3(MOYt) + s(time,df)+ et;
Model3: Log[[E(Yt)]] = β0 + β1(ATt) + β2(AWSt) + β3(MOYt) + s(time,df)+ et;
where Yt denotes the month’s number of influenza cases and weekly positive of influenza virus at time t, respectively; β0 is the intercept; β(AT), β(ARH), β(AWS), and β(MOY) denote the corresponding regression coefficients of AT, ARH, AWS, and MOY (month of year), respectively; MOY is the month ordinal used to control seasonal trends; s (time) is the penalized spline to control the long-term trend; and et is the error term. Then, we calculated the excess risk (ER%, (exp(β) − 1) × 100%) to indicate the effects of meteorological factors on the incidence of influenza. All analyses were performed by R software (R Core Team, Vienna, Austria) with the mgcv package for GAMs.

3. Results

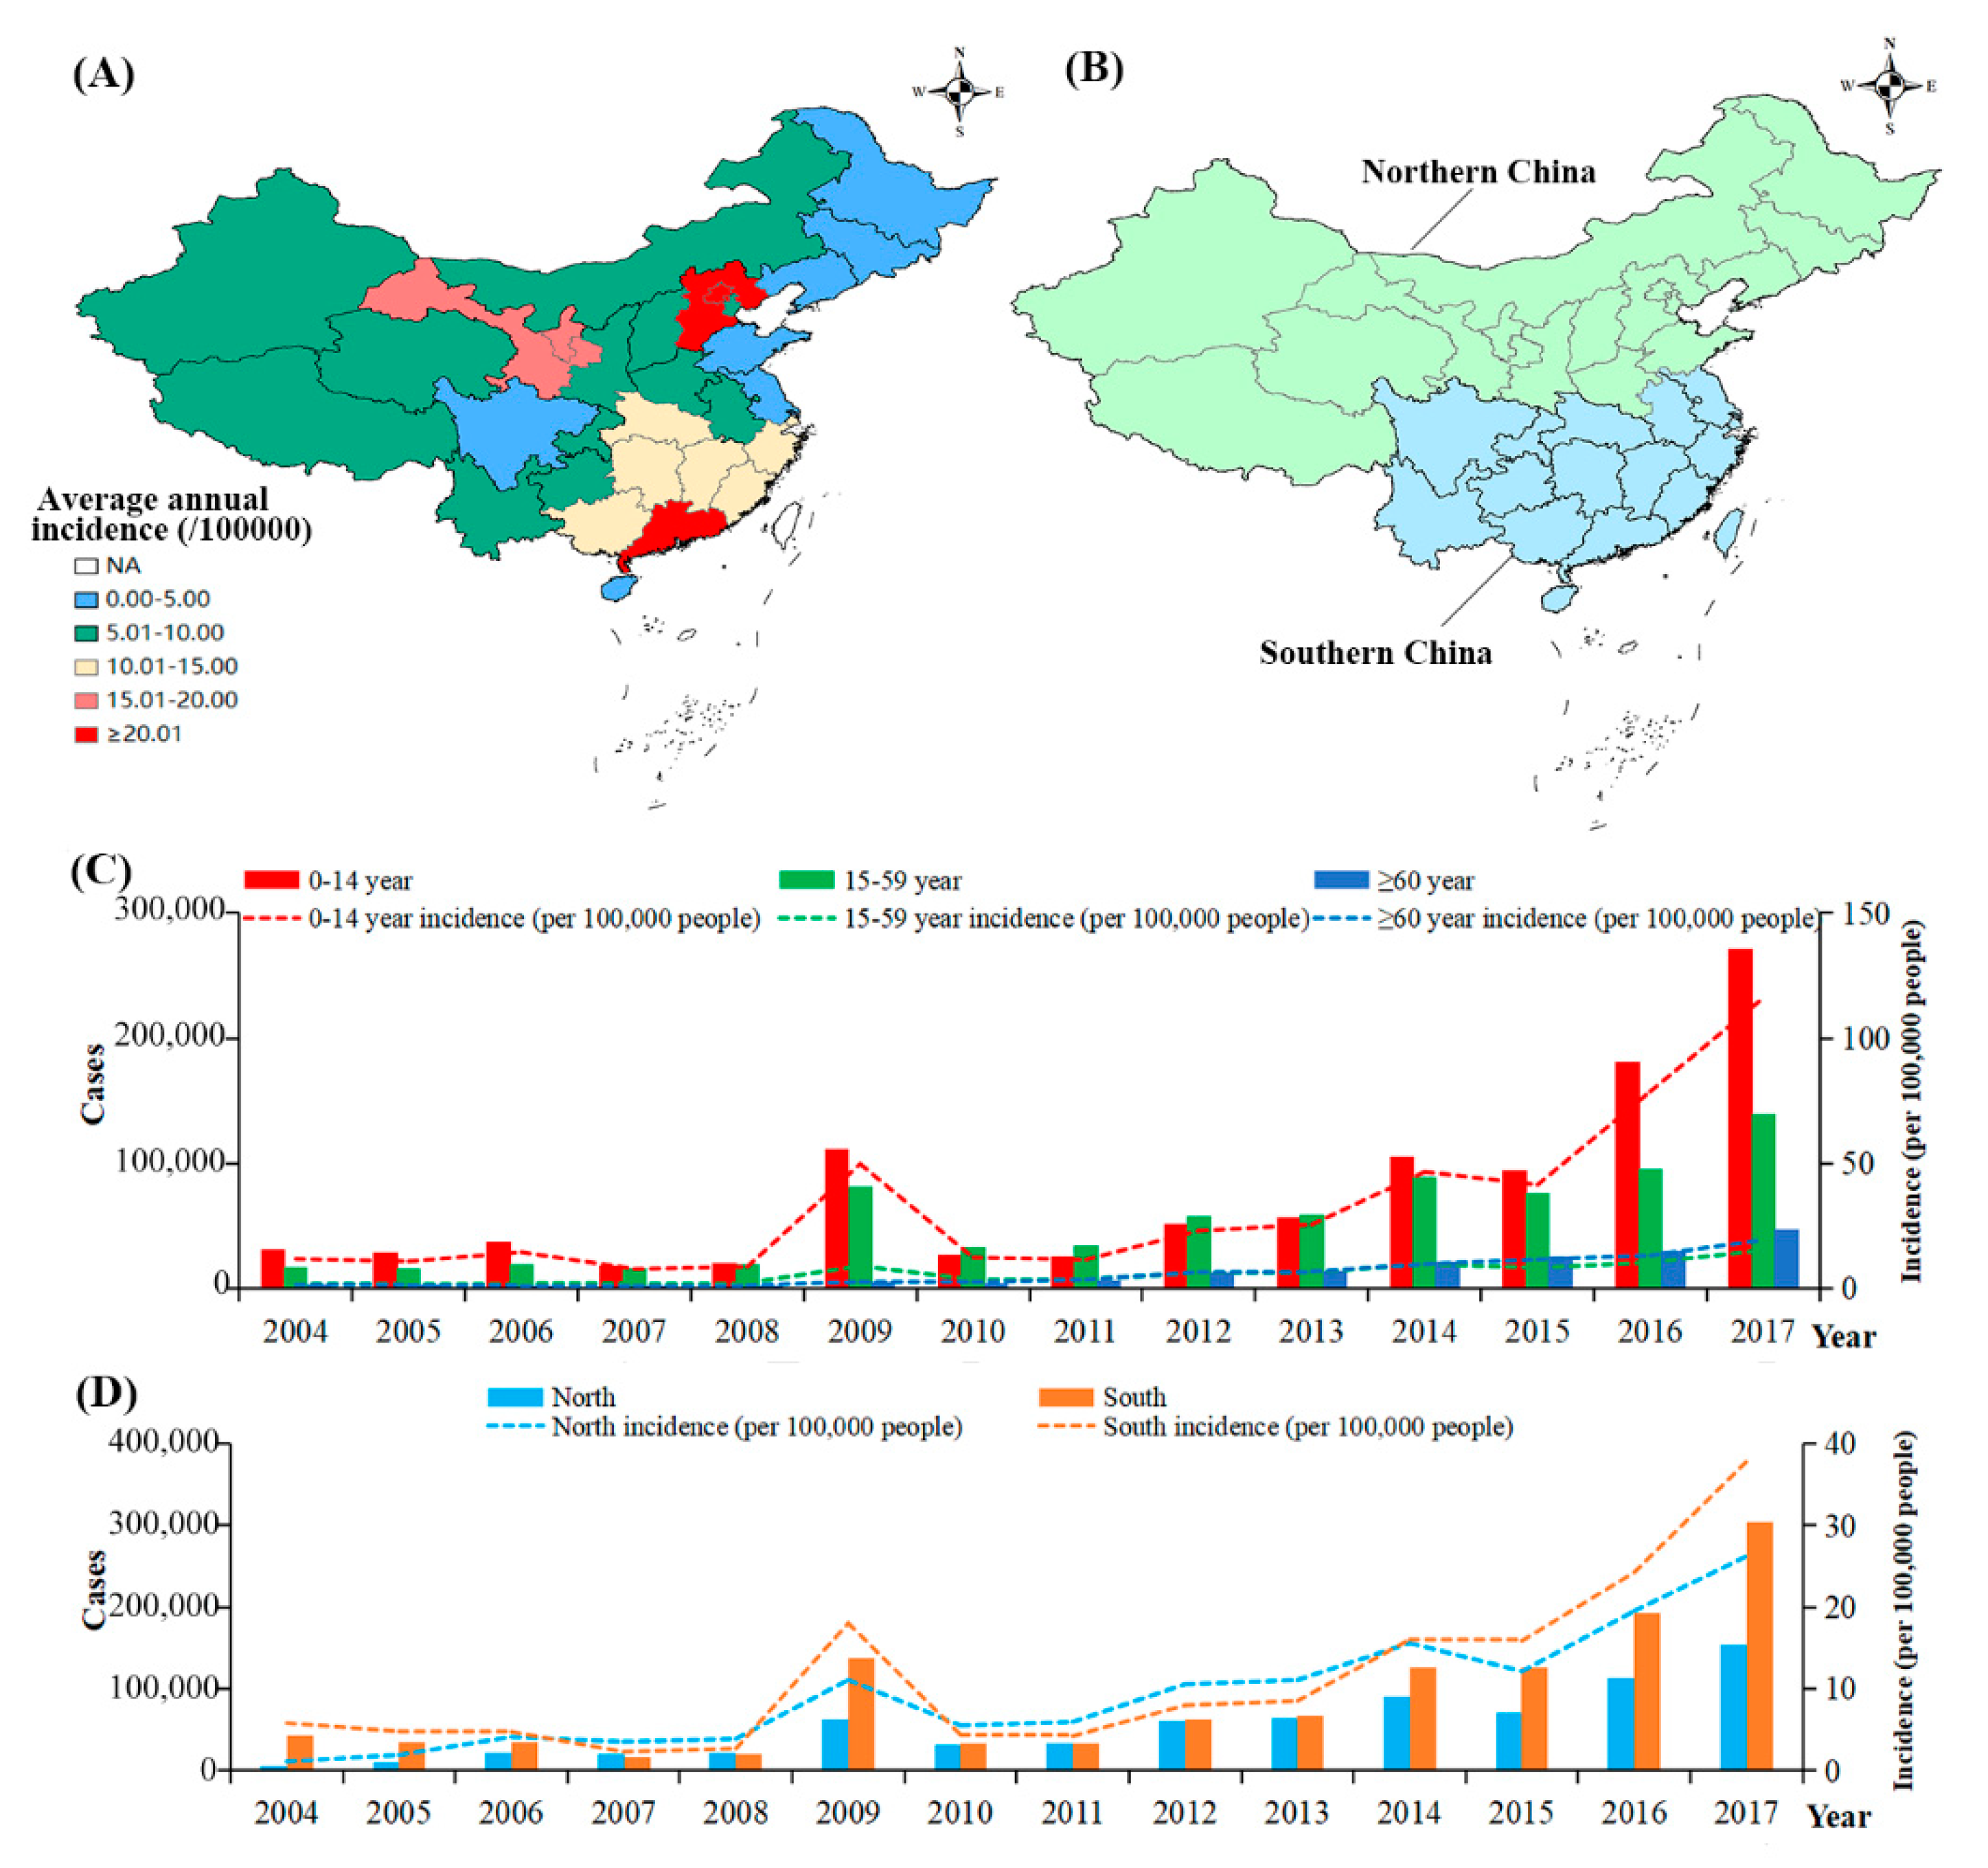
3.1. The Incidences of Influenza in China

A total of 1,986,536 influenza cases were reported in China from 1 January 2004 to 31 December 2017, with an average annual incidence 10.41/100,000 (Figure 1A). The incidence of influenza in the ≤14 years age group (32.72/100,000) was higher than those in the 15–59 years (5.82/100,000) and ≥60 years (5.80/100,000) groups (Figure 1C). The rate in southern China (11.22/100,000) was higher than that in northern China (9.43/100,000) (Figure 1D).

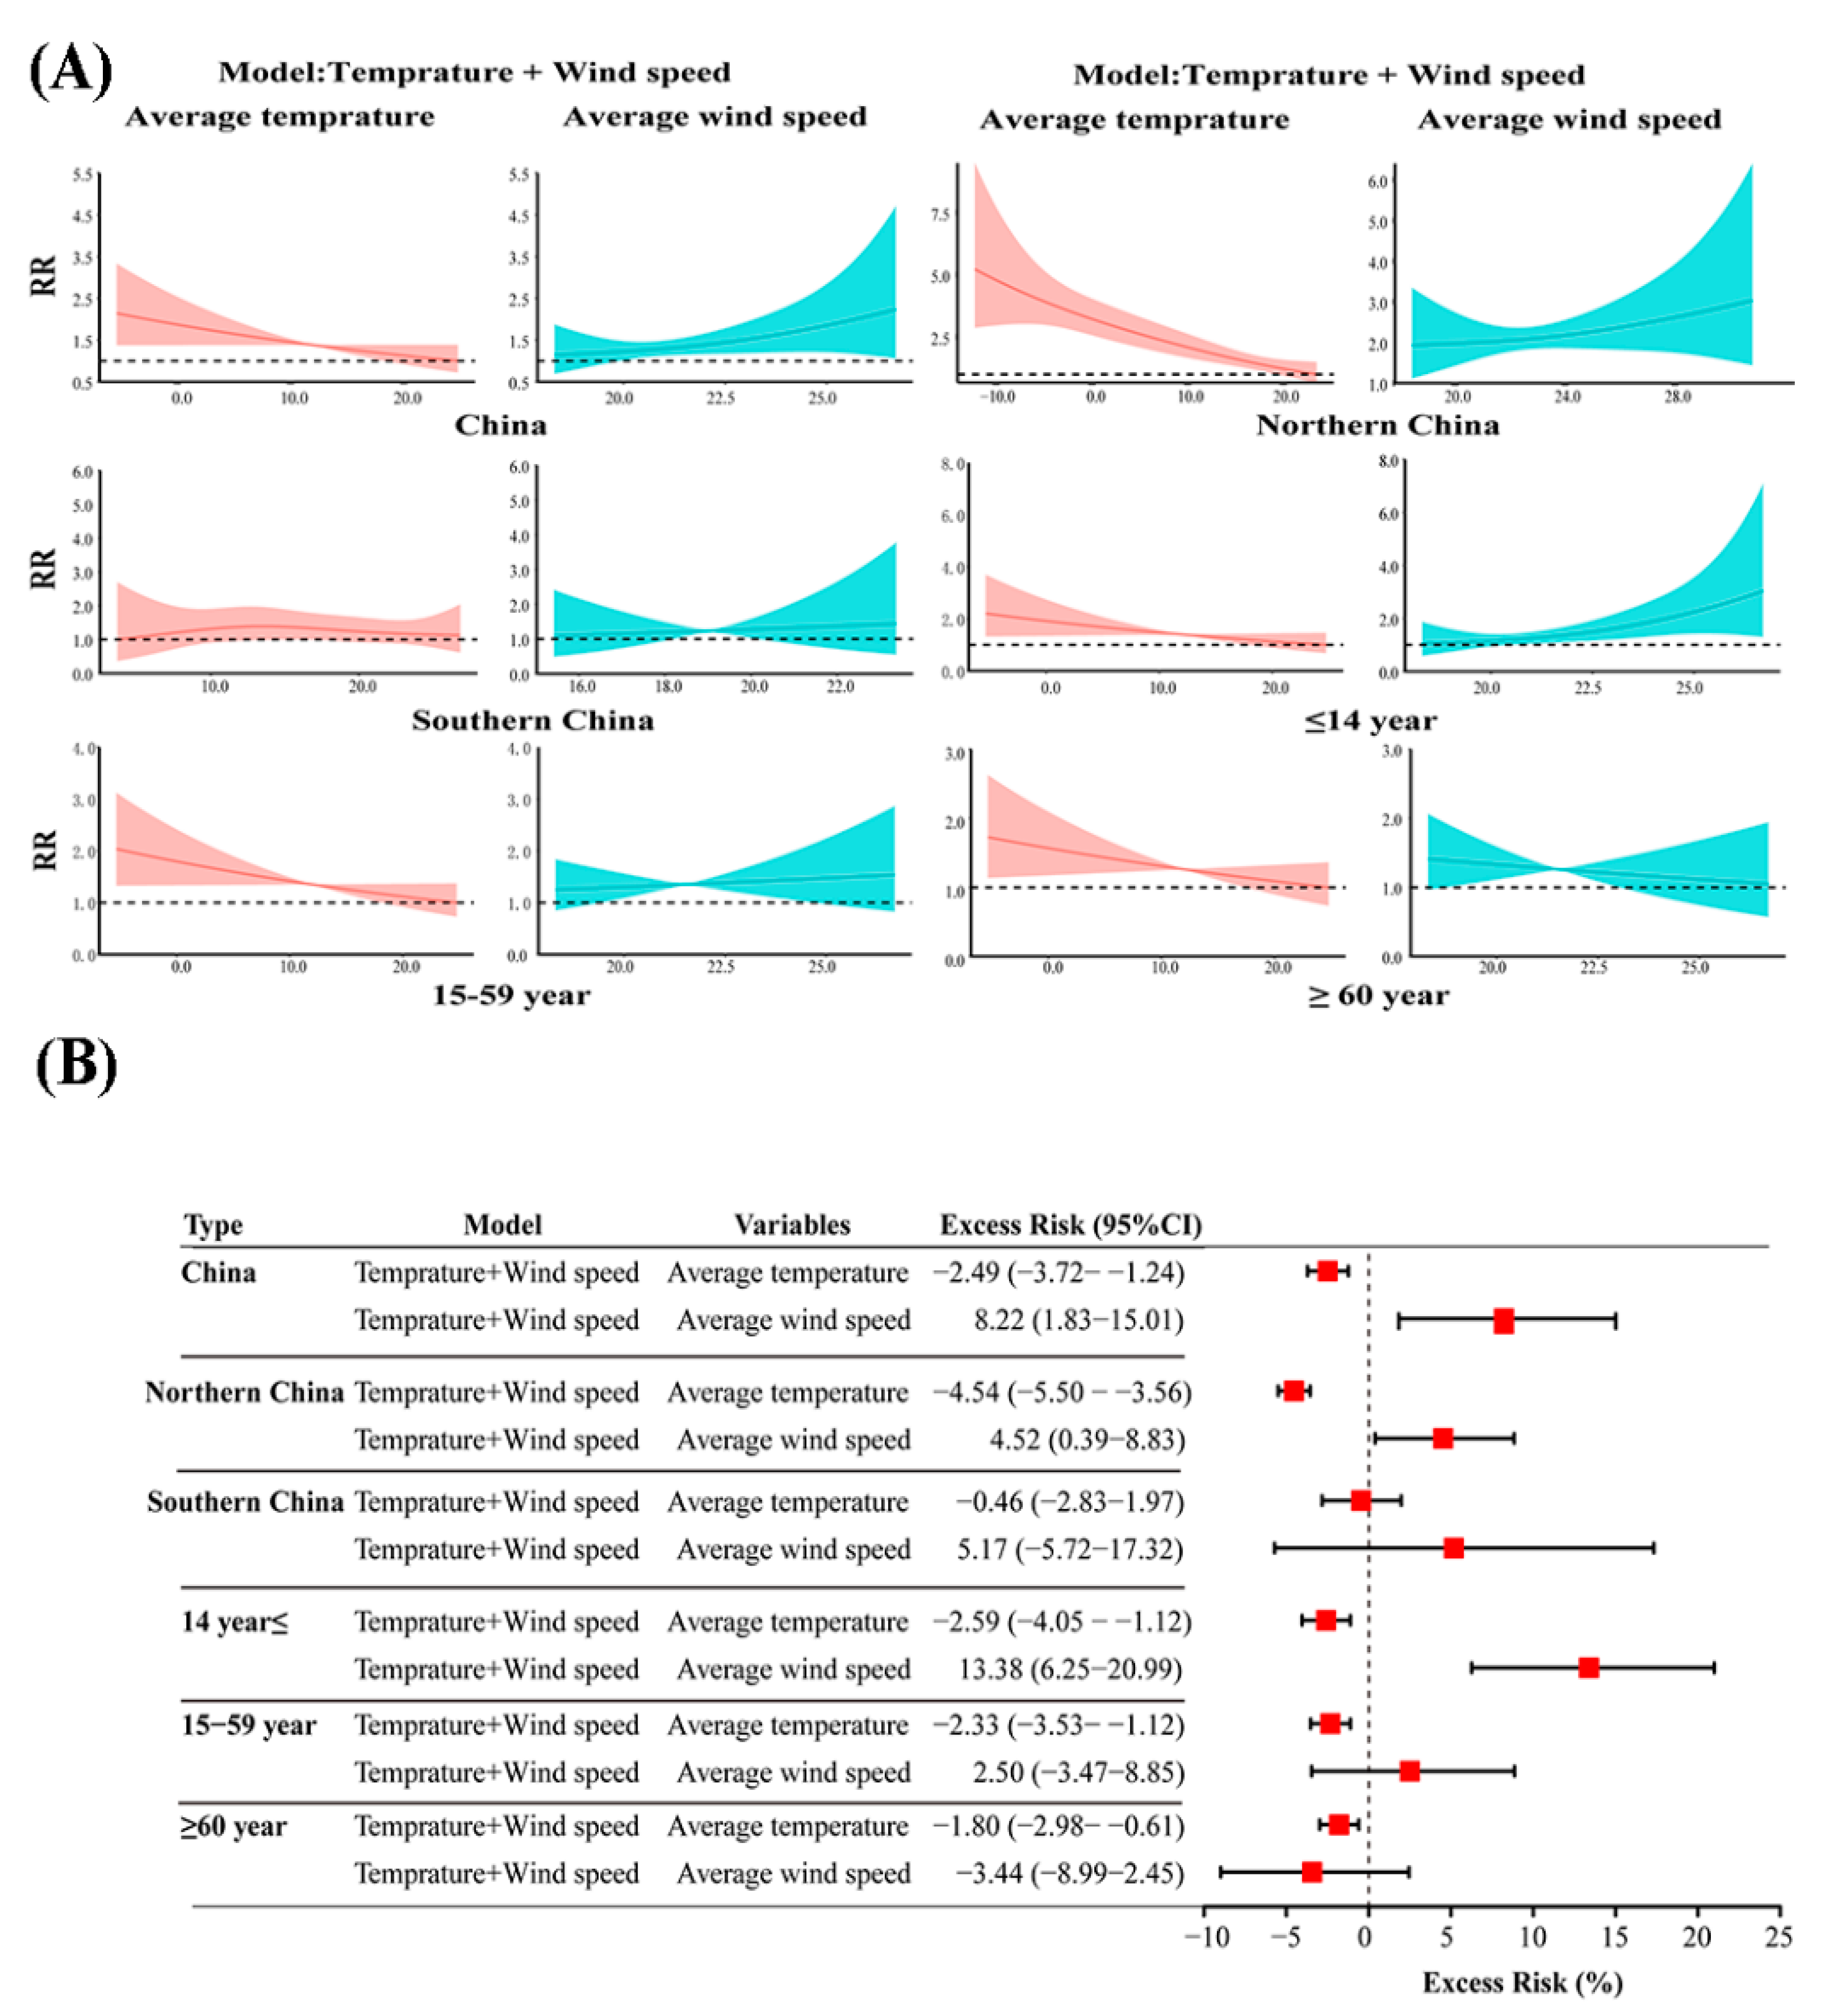
3.2. The Exposure–Response and Excess Risk of Monthly AT to the Incidence of Influenza

The GAMs found that there was an approximately negative linear correlation between AT and influenza incidences in China with an ER of −2.49% (95%CI: −3.72% to −1.24%). An AT in the range of −5.35 to 18.31 °C had a significant effect on the incidence of influenza, and the risk of influenza cases reached a peak at −5.35 °C (AT) with RRs of 2.14 (95%CI: 1.38–3.33). After stratification analysis, the temperature was negatively associated with the incidence of influenza in all age groups. The contributions of temperature for influenza activity were significant in northern China, with an ER of −4.54% (95%CI: −3.72% to −1.24%). An AT in the range of −12.22 to 19.39 °C had a significant effect on the incidence of influenza, and the risk incidence of influenza cases reached a peak at −12.22 °C with RRs of 5.22 (95%CI: 2.87–9.49) in northern China (Figure 2).

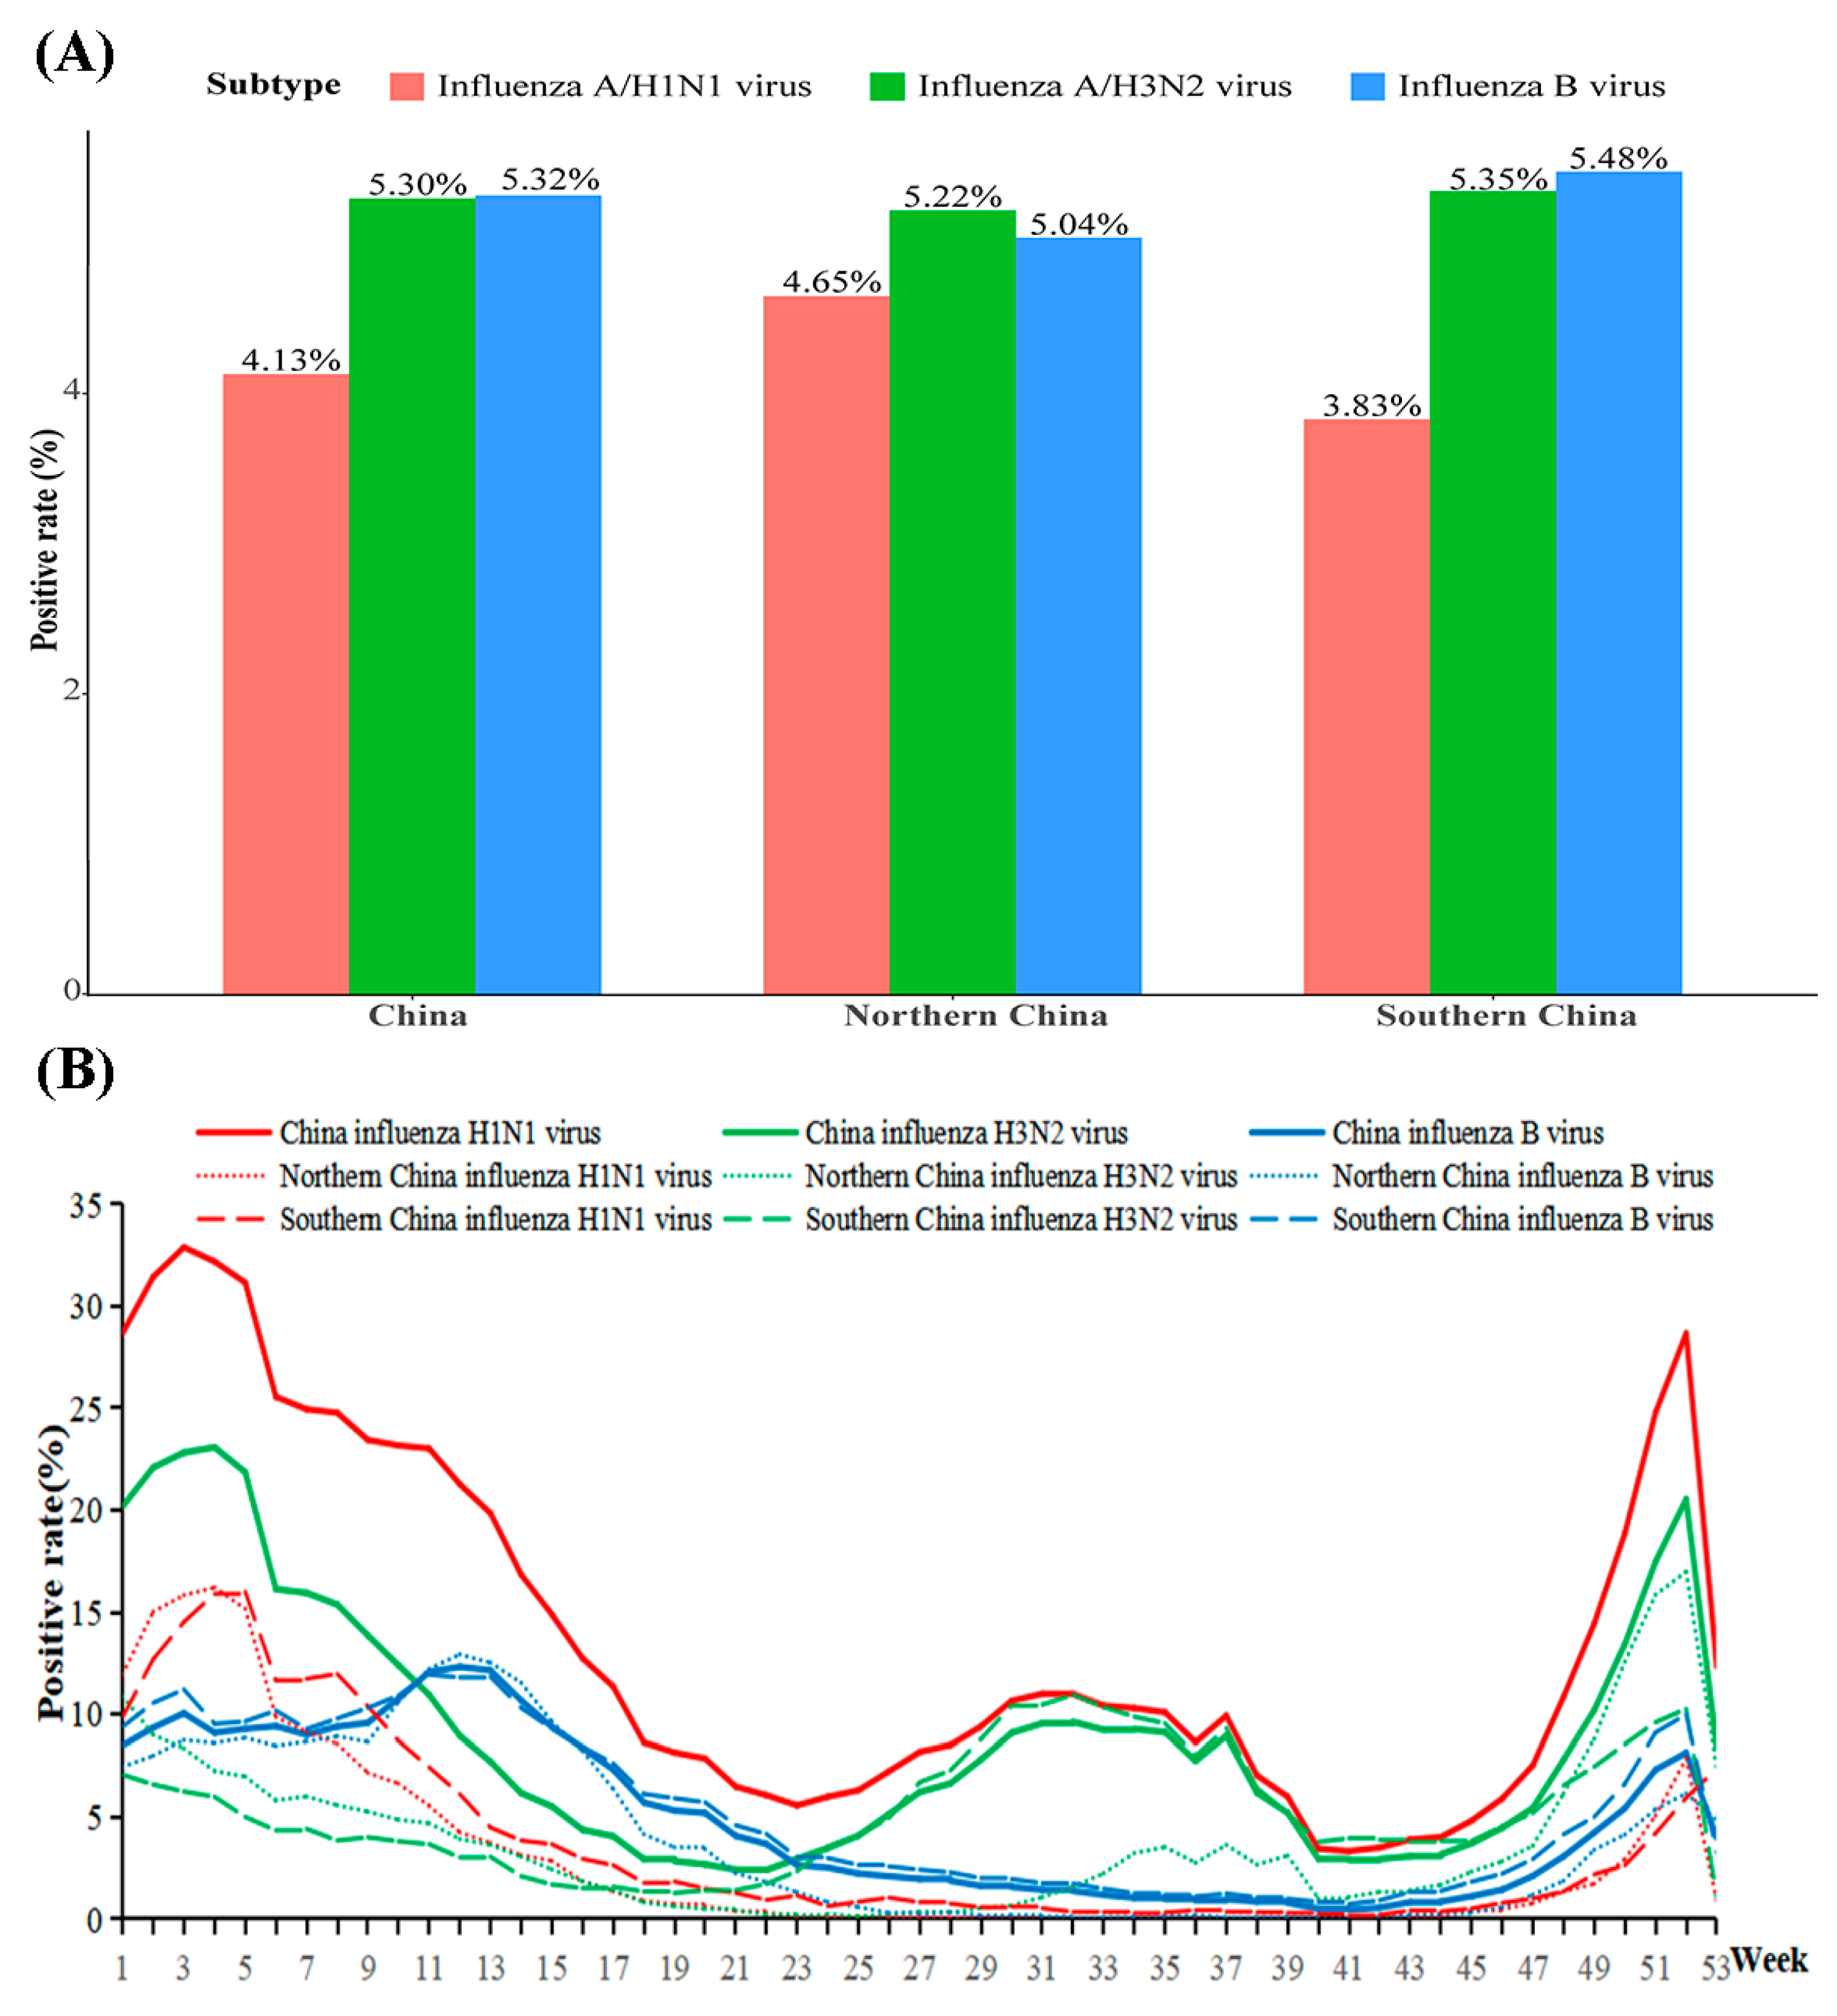
3.3. The Activity of Influenza Virus in China

From the first week of 2010 to the last week of 2019, a total of 2,070,967 samples were tested. The positive rate of total influenza virus including A/H1N1, A/H3N2, A/unsubtyped, and influenza B virus (B/Victoria lineage, B/Yamagata lineage and B/unsubtyped) reached 15.01%.The influenza A H3N2 virus (5.30%) was the dominant subtype in mainland China. In northern China, 761,627 samples were tested, with a 15.10% positive rate of total influenza virus; meanwhile, in southern China, 1,309,340 were tested, with a 14.96% positive rate of total influenza virus (Figure 3).

3.4. The Exposure–Response and Excess Risk of Weekly AT to the Positive Rate of Influenza Virus

From the national perspective, weekly AT had an approximately negative linear correlation with the positive rate of A/H1N1, with an ER of −5.28% (95%CI: −9.96% to −0.35%). A weekly AT in the range of −3.14 to 17.25 °C had a significant effect on the positive rate of H1N1. The risk of A/H1N1 reached a peak at −3.14 °C (AT) with RRs of 4.88 (95%CI: 1.01–23.75) (Supplementary Figure S2). After region stratification analysis, both the positive rate of A/H1N1 and the influenza B virus were significantly negatively associated with weekly AT in northern China; however, there was no significant finding in southern China (Figure 4).

4. Discussion

In 2017, influenza was ranked as a third-class C notifiable disease in China [19]. It poses a great threat to the public health of all age groups, especially in the ≤14-year-old group. The influenza H3N2 virus is the dominant subtype in China. An approximately negative linear correlation between temperature and influenza activity was found in China, and this association was more significant in northern China and for the influenza H1N1 virus.
AT was negatively associated with the incidence of influenza in our study. This finding is consistent with previous studies. Liu indicated that a 5 °C decrease in the minimum temperature causes an increase of 8% in influenza cases after a one-week lag [20]. It was also previously observed that a 1 °C decrease in temperature increases the estimated risk of influenza occurrence by 11% among military conscripts in Finland [21]. The spread of influenza virus is more stable and efficient under colder conditions. At the same time, people may reduce their outdoor activities and gather in crowded indoor environments with closed windows and doors on cold days, which may increase the risk of influenza virus transmission [8].
In a previous study, the associations between temperature and different influenza viruses were not conclusive. In Germany, the negative association of temperature with Flu-A hospitalization was found, but not with Flu-B [22]. In Hong Kong (a city in southern China), the occurrence of Flu-B decreased when temperature increased; however, there was no significant finding for Flu-A [23]. In our study, AT was negatively associated with the activity of the influenza H1N1 virus in China. In Uganda, compared to influenza H3N2 and B virus, a lower temperature was also marginally significantly associated with higher H1N1 activity [15]. Flu-A virus seems to change its antigen more frequent than Flu-B virus [24], which may influence the sensitivity to climate variability. In a study investigating the association between environment and social conditions and H1N1 mutation, the author found that temperature was the main factor associated with the mutation of A/H1N1 viruses [25]. However, there is still limited information on the interaction of temperature, evolution of the influenza virus, and human activity on influenza transmission. Further research is needed to explore the roles of atmospheric factors, human behavior, and pathogeny of the influenza virus on influenza transmission and to evaluate the contributions of each part.
In northern China, weekly AT was negatively associated with the activity of B virus. This result is similar to a study conducted in a northern Chinese city, Shanghai. Both influenza A and B viruses had negative linear correlations with temperature and both the risk of Flu-A and Flu-B reached a peak at 1.4 °C [26].
Compared to southern China, the effects of temperature on influenza activities were more significant in northern China. In southern China, the seasonality of influenza was also complex. Southern China has a subtropical climate and is warmer than northern China. In winter, in northern China, the typical moderate climate with lower temperature and higher air pressure facilitate the survival and spread of the virus. Furthermore, the temperature in northern China usually drops faster than in southern China. Under these conditions, people could be more susceptible to influenza infection because they do not have enough time to adapt to the sudden fall in temperature [27].
Additionally, high AWS was found to increase the risk of influenza case in this study. This finding was also reported by Jean-Baptist du Prel [22]. A field study in horses indicated that there is an increased impact of influenza as the wind speed increases to 30 km/h [28]. This observation may support the hypothesis that high wind speed could accelerate air circulation, thus resulting in longer travel of airborne aerosols and increasing the risk of influenza virus transmission [29,30,31]. Another possible explanation is that strong wind could increase body susceptibility to influenza through lowering the body temperature, along with vasoconstriction in the respiratory tract mucosa. Innate immune responses would be inhibited in this case.
However, our study has several limitations. First, data on human behaviors in response to different weather conditions were not available for this study. We could not assess the role of human behavior changes in different weather conditions on influenza transmission. Further research is needed to include data on meteorological factors, human behaviors, and influenza to explore the potential relationship between them. Second, the data collected and analyses performed were from a national perspective, which might not capture the heterogeneity at the regional level. We therefore divided the data into southern China and northern China to account for regional differences.

5. Conclusions

The average annual incidence of influenza was 10.41/100,000 in China and was high in the ≤14-year-old age group. The influenza H3N2 virus was shown to be the dominant subtype in China. AT was approximately negatively linearly associated with the incidence of influenza, as well as A/H1N1 activity from the domestic perspective. Monthly AT in the range of −5.35 to 18.31 °C had significant effects on the incidence of influenza. Weekly AT in the range of −3.14 to 17.25 °C had significant effects on the positive rate of A/H1N1. These findings indicate that temperature could be integrated into the current influenza surveillance system to develop early warning systems to better predict and prepare for the risks of influenza.

Supplementary Materials

The following are available online at https://www.mdpi.com/article/10.3390/ijerph182010846/s1, Figure S1: Spearman correlation analysis of meteorological factors; Figure S2: The exposure–response of weekly AT to the positive rate of influenza virus.

Author Contributions

S.Y. and L.L. (Lanjuan Li) designed the study; C.C., X.Z., D.J., D.Y., Z.G., Y.Z., X.L., and C.H. collected data; C.C. analyzed data; C.D. and L.L. (Lei Lan) checked the data and results; C.C., X.Z., and D.J. interpreted the data and wrote the report; X.H. modified the language; S.Y. revised the report from the preliminary draft to submission. All authors have read and agreed to the published version of the manuscript.

Funding

This research was funded by the National Natural Science Foundation of China (grant numbers: 82173577, 81672005, U1611264, and 81001271) and the Mega-Project of National Science and Technology for the 12th and 13th Five-Year Plan of China (grant numbers: 2018ZX10715-014-002 and 2014ZX10004008).

Institutional Review Board Statement

Not applicable.

Informed Consent Statement

Not applicable.

Data Availability Statement

The raw data supporting the conclusions of this article will be made available by the corresponding author, without undue reservation.

Acknowledgments

The authors are thankful to Jianxiong Hu for technical support to improve this work.

Conflicts of Interest

The authors have no conflict of interest relevant to this article to disclose.

References

  1. Liu, X.; Zhang, B.; Wang, Y.; Haymour, H.S.; Zhang, F.; Xu, L.C.; Srinivasarao, M.; Low, P.S. A universal dual mechanism immunotherapy for the treatment of influenza virus infections. Nat. Commun. 2020, 11, 5597. [Google Scholar] [CrossRef]
  2. World Health Organization. Up to 650,000 People Die of Respiratory Diseases Linked to Seasonal Flu Each Year. 2018. Available online: https://www.who.int/news/item/13-12-2017-up-to-650-000-people-die-of-respiratory-diseases-linked-to-seasonal-flu-each-year (accessed on 1 July 2021).
  3. von Klot, S.; Zanobetti, A.; Schwartz, J. Influenza epidemics, seasonality, and the effects of cold weather on cardiac mortality. Environ. Health 2012, 11, 74. [Google Scholar] [CrossRef] [Green Version]
  4. Soebiyanto, R.P.; Gross, D.; Jorgensen, P.; Buda, S.; Bromberg, M.; Kaufman, Z.; Prosenc, K.; Socan, M.; Vega Alonso, T.; Widdowson, M.A.; et al. Associations between Meteorological Parameters and Influenza Activity in Berlin (Germany), Ljubljana (Slovenia), Castile and León (Spain) and Israeli Districts. PLoS ONE 2015, 10, e0134701. [Google Scholar] [CrossRef] [Green Version]
  5. Li, J.; Rao, Y.; Sun, Q.; Wu, X.; Jin, J.; Bi, Y.; Chen, J.; Lei, F.; Liu, Q.; Duan, Z.; et al. Identification of climate factors related to human infection with avian influenza A H7N9 and H5N1 viruses in China. Sci. Rep. 2015, 5, 18094. [Google Scholar] [CrossRef] [Green Version]
  6. Shaman, J.; Pitzer, V.E.; Viboud, C.; Grenfell, B.T.; Lipsitch, M. Absolute humidity and the seasonal onset of influenza in the continental United States. PLoS Biol. 2010, 8, e1000316. [Google Scholar] [CrossRef]
  7. Cox, N.J.; Subbarao, K. Global epidemiology of influenza: Past and present. Annu. Rev. Med. 2000, 51, 407–421. [Google Scholar] [CrossRef]
  8. Tamerius, J.; Nelson, M.I.; Zhou, S.Z.; Viboud, C.; Miller, M.A.; Alonso, W.J. Global influenza seasonality: Reconciling patterns across temperate and tropical regions. Environ. Health Perspect. 2011, 119, 439–445. [Google Scholar] [CrossRef] [Green Version]
  9. Finkelman, B.S.; Viboud, C.; Koelle, K.; Ferrari, M.J.; Bharti, N.; Grenfell, B.T. Global patterns in seasonal activity of influenza A/H3N2, A/H1N1, and B from 1997 to 2005: Viral coexistence and latitudinal gradients. PLoS ONE 2007, 2, e1296. [Google Scholar] [CrossRef]
  10. Azziz Baumgartner, E.; Dao, C.N.; Nasreen, S.; Bhuiyan, M.U.; Mah, E.M.S.; Al Mamun, A.; Sharker, M.A.; Zaman, R.U.; Cheng, P.Y.; Klimov, A.I.; et al. Seasonality, timing, and climate drivers of influenza activity worldwide. J. Infect. Dis. 2012, 206, 838–846. [Google Scholar] [CrossRef] [Green Version]
  11. Li, Y.; Ye, X.; Zhou, J.; Zhai, F.; Chen, J. The association between the seasonality of pediatric pandemic influenza virus outbreak and ambient meteorological factors in Shanghai. Environ. Health 2020, 19, 71. [Google Scholar] [CrossRef]
  12. Park, J.E.; Son, W.S.; Ryu, Y.; Choi, S.B.; Kwon, O.; Ahn, I. Effects of temperature, humidity, and diurnal temperature range on influenza incidence in a temperate region. Influenza Other Respir Viruses 2020, 14, 11–18. [Google Scholar] [CrossRef] [Green Version]
  13. Yamaya, M.; Nishimura, H.; Lusamba Kalonji, N.; Deng, X.; Momma, H.; Shimotai, Y.; Nagatomi, R. Effects of high temperature on pandemic and seasonal human influenza viral replication and infection-induced damage in primary human tracheal epithelial cell cultures. Heliyon 2019, 5, e01149. [Google Scholar] [CrossRef] [Green Version]
  14. Lowen, A.C.; Mubareka, S.; Steel, J.; Palese, P. Influenza virus transmission is dependent on relative humidity and temperature. PLoS Pathog. 2007, 3, 1470–1476. [Google Scholar] [CrossRef]
  15. Yang, W.; Cummings, M.J.; Bakamutumaho, B.; Kayiwa, J.; Owor, N.; Namagambo, B.; Byaruhanga, T.; Lutwama, J.J.; O’Donnell, M.R.; Shaman, J. Dynamics of influenza in tropical Africa: Temperature, humidity, and co-circulating (sub)types. Influenza Other Respir. Viruses 2018, 12, 446–456. [Google Scholar] [CrossRef] [Green Version]
  16. Soebiyanto, R.P.; Adimi, F.; Kiang, R.K. Modeling and predicting seasonal influenza transmission in warm regions using climatological parameters. PLoS ONE 2010, 5, e9450. [Google Scholar] [CrossRef] [Green Version]
  17. Wang, L.; Wang, Y.; Jin, S.; Wu, Z.; Chin, D.P.; Koplan, J.P.; Wilson, M.E. Emergence and control of infectious diseases in China. Lancet 2008, 372, 1598–1605. [Google Scholar] [CrossRef]
  18. China Center for Disease Control and Prevention. The Public Health Science Data Center. Available online: http://www.phsciencedata.cn/Share/index.jsp (accessed on 20 June 2021).
  19. China Center for Disease Control and Prevention. Epidemic Situation of Notifiable Infectious Diseases in China in 2017. Available online: http://www.nhc.gov.cn/jkj/s3578/201802/de926bdb046749abb7b0a8e23d929104.shtml (accessed on 20 June 2021).
  20. Liu, Z.; Zhang, J.; Zhang, Y.; Lao, J.; Liu, Y.; Wang, H.; Jiang, B. Effects and interaction of meteorological factors on influenza: Based on the surveillance data in Shaoyang, China. Environ. Res. 2019, 172, 326–332. [Google Scholar] [CrossRef]
  21. Jaakkola, K.; Saukkoriipi, A.; Jokelainen, J.; Juvonen, R.; Kauppila, J.; Vainio, O.; Ziegler, T.; Rönkkö, E.; Jaakkola, J.J.; Ikäheimo, T.M. Decline in temperature and humidity increases the occurrence of influenza in cold climate. Environ. Health 2014, 13, 22. [Google Scholar] [CrossRef] [Green Version]
  22. du Prel, J.B.; Puppe, W.; Gröndahl, B.; Knuf, M.; Weigl, J.A.; Schaaff, F.; Schmitt, H.J. Are meteorological parameters associated with acute respiratory tract infections? Clin. Infect. Dis. 2009, 49, 861–868. [Google Scholar] [CrossRef] [Green Version]
  23. Tang, J.W.; Lai, F.Y.; Wong, F.; Hon, K.L. Incidence of common respiratory viral infections related to climate factors in hospitalized children in Hong Kong. Epidemiol. Infect. 2010, 138, 226–235. [Google Scholar] [CrossRef] [Green Version]
  24. Bouvier, N.M.; Palese, P. The biology of influenza viruses. Vaccine 2008, 26, D49–D53. [Google Scholar] [CrossRef] [Green Version]
  25. Jiang, D.; Wang, Q.; Bai, Z.; Qi, H.; Ma, J.; Liu, W.; Ding, F.; Li, J. Could Environment Affect the Mutation of H1N1 Influenza Virus? Int. J. Environ. Res. Public Health 2020, 17, 3092. [Google Scholar] [CrossRef]
  26. Zhang, Y.; Ye, C.; Yu, J.; Zhu, W.; Wang, Y.; Li, Z.; Xu, Z.; Cheng, J.; Wang, N.; Hao, L.; et al. The complex associations of climate variability with seasonal influenza A and B virus transmission in subtropical Shanghai, China. Sci. Total Environ. 2020, 701, 134607. [Google Scholar] [CrossRef]
  27. Luan, G.; Zhou, M.G. Correlation between low air temperature and influenza incidence in winter in China, 2004–2016. Chin. J. Epidemiol. 2020, 41, 368–372. [Google Scholar]
  28. Firestone, S.M.; Cogger, N.; Ward, M.P.; Toribio, J.A.; Moloney, B.J.; Dhand, N.K. The influence of meteorology on the spread of influenza: Survival analysis of an equine influenza (A/H3N8) outbreak. PLoS ONE 2012, 7, e35284. [Google Scholar] [CrossRef] [Green Version]
  29. Feng, C.; Li, J.; Sun, W.; Zhang, Y.; Wang, Q. Impact of ambient fine particulate matter (PM2.5) exposure on the risk of influenza-like-illness: A time-series analysis in Beijing, China. Environ. Health 2016, 15, 17. [Google Scholar] [CrossRef] [Green Version]
  30. Hammond, G.W.; Raddatz, R.L.; Gelskey, D.E. Impact of atmospheric dispersion and transport of viral aerosols on the epidemiology of influenza. Rev. Infect. Dis. 1989, 11, 494–497. [Google Scholar] [CrossRef]
  31. Ssematimba, A.; Hagenaars, T.J.; de Jong, M.C. Modelling the wind-borne spread of highly pathogenic avian influenza virus between farms. PLoS ONE 2012, 7, e31114. [Google Scholar] [CrossRef] [Green Version]
Figure 1. The incidence of influenza in China. (A). Geographical distribution of influenza in China; (B). Geographical distribution of Southern and Northern China; (C). The incidence of influenza in three age group; (D). The incidence of influenza in northern and southern China.
Ijerph 18 10846 g001
Figure 2. The exposure–response and excess risk of monthly AT on the incidence of influenza. (A). The exposure–response of monthly AT on the incidence of influenza; (B). The excess risk of monthly AT on the incidence of influenza.
Ijerph 18 10846 g002
Figure 3. The activity of influenza virus in China. (A) The positive rate of influenza virus in China; (B) The activity of influenza virus in China by week.
Ijerph 18 10846 g003
Figure 4. The exposure–response and excess risk of weekly AT to the positive rate of influenza virus.
Ijerph 18 10846 g004
Table 1. Description of the monthly/weekly influenza and meteorological data.
Monthly Influenza Cases and Meteorological Data
RegionsFactorsData SourceNumber of MonthsMin.P (25th)MedianP (75th)Max.
ChinaInfluenza casesNotifiable infectious disease report database168117935677210.513,953135,398
AT, °CCMDSSS168−5.353.8213.1920.1224.77
ARH, %CMDSSS16853.5759.8664.6469.9274.22
AWS, cm/sCMDSSS16818.319.6820.923.0526.7
ACP, mmCMDSSS1686.2228.458.32113.63168.44
AAP, hPaCMDSSS168911.26915.25920.82924.84936.15
Northern ChinaInfluenza casesNotifiable infectious disease report database16815312083106537458,371
AT, °CCMDSSS168−12.22−2.029.317.4323.46
ARH, %CMDSSS16843.4451.8258.0364.5471.08
AWS, cm/sCMDSSS16818.4320.9722.5525.230.82
ACP, mmCMDSSS1681.898.7226.5462.39173.42
AAP, hPaCMDSSS168892896.92902.06906.21924.91
Southern ChinaInfluenza casesNotifiable infectious disease report database16855119363689836077,027
AT, °CCMDSSS1683.6711.4518.2523.5626.85
ARH, %CMDSSS16864.397173.8976.6181.54
AWS, cm/sCMDSSS16815.4217.9718.8820.0723.37
ACP, mmCMDSSS16811.2851.6198.11170.13278.8
AAP, hPaCMDSSS168935.58939.64946.03949.67954.66
Weekly Influenza Virological and Meteorological Data
RegionsFactorsData SourceNumber of WeeksMin.P (25th)MedianP (75th)Max.
ChinaInfluenza H1N1 virus (%)China National Influenza Center52200.090.492.6335.29
Influenza H3N2 virus (%)China National Influenza Center52200.62.446.8832.67
Influenza B virus (%)China National Influenza Center52200.591.716.3538.91
AT, °CCMDSSS522−5.623.6213.7421.1726.08
ARH, %CMDSSS52249.3961.4866.170.6877.93
AWS, cm/sCMDSSS52216.2919.7621.1923.1329.46
ACP, mmCMDSSS5220.246.7915.6326.8755.65
AAP, hPaCMDSSS522913.24919.86925.39929.2941.14
Northern ChinaInfluenza H1N1 virus (%)China National Influenza Center522000.152.0337.68
Influenza H3N2 virus (%)China National Influenza Center52200.151.174.4738.48
Influenza B virus (%)China National Influenza Center52200.090.453.7541.16
AT, °CCMDSSS522−13.65−2.879.6118.4624.52
ARH, %CMDSSS52236.9351.0357.3464.1574.61
AWS, cm/sCMDSSS52216.3221.0123.0425.7634.76
ACP, mmCMDSSS5220.091.775.5214.2750.26
AAP, hPaCMDSSS522884.55892.72898.73902.09917.93
Southern ChinaInfluenza H1N1 virus (%)China National Influenza Center52200.090.52.7340.53
Influenza H3N2 virus (%)China National Influenza Center52200.592.076.9634.16
Influenza B virus (%)China National Influenza Center52200.732.087.1339.7
AT, °CCMDSSS5222.6511.1718.6824.1628.6
ARH, %CMDSSS52257.3872.7876.1279.1685.9
AWS, cm/sCMDSSS52214.1717.7118.9320.3926.38
ACP, mmCMDSSS5220.0311.2524.4139.494.63
AAP, hPaCMDSSS522942.17949.93955.91960.46968.93
Publisher’s Note: MDPI stays neutral with regard to jurisdictional claims in published maps and institutional affiliations.

