Appendix A
Text A1. Chemicals and materials
The nine standard materials (lincomycin, LIN; sulfachloropyridazine, SCP; sulfadiazine, SDZ; sulfadimethoxine, SDX; SMZ; sulfamethoxazole, SMX; sulfaquinoxaline, SQX; sulfathiazole, STZ; and trimethoprim, TMP), and five ISTD materials (SDZ-13C6, SMZ-13C6, SMX-d4, SDX-d6, and TMP-d9) were purchased from Sigma-Aldrich (St. Louis, MO, USA), except for LIN-d3 and STZ-13C6, which were purchased from LGC Standards (Teddington, UK).
LC/MS grade methanol and acetonitrile used in the UHPLC-HRMS analysis were purchased from Fisher Scientific (Fairlawn, NJ, USA) and Merck Millipore (Billerica, MA, USA), respectively. Citric acid, trisodium citrate dehydrate, and ethylenediaminetetraacetic acid disodium salt dehydrate (EDTA) used in the sample pretreatment were purchased from Sigma-Aldrich (St. Louis, MO, USA), and formic acid was acquired from Honeywell Fluka (Morris Plains, NJ, USA).
Text A2. Surface water and groundwater sampling and sample preparation for analysis of antibiotic content.
Polypropylene bottles (2 and 1 L) were used after rinsing with surface water or groundwater 3–4 times. Surface water was sampled at ~0.1 m below the water surface. Water samples were stored under dark conditions at <4 °C until analysis. To remove suspended solids, the samples were centrifuged at 4 °C and 24,600× g for 5 min. Subsequently, the supernatant was filtered using a 0.2-μm polyvinylidene fluoride syringe filter, and the pH of the sample was adjusted to 6.5 using 0.5 mL of 1.5 M citrate buffer solution per 50 mL of sample, following which 5% EDTA solution (0.5 mL per 50 mL of sample) was added. Finally, 25 mL (500 ng·L−1) of a mixture solution containing seven ISTDs was added to the 50-mL sample. The pre-treated samples were analyzed within seven days.
Text A3. Analysis of the surface water and groundwater samples.
Hypersil GOLD aQ and Reversed Xbridge C18 columns (2.1 mm × 50 mm i.d., 2.5 μm, Waters, Milford, MA, USA) were used to extract and analyze the antibiotics present in the samples, respectively. Total analysis time was 30 min, and 5 mL of the sample was injected over a duration of 5 min. The detailed equipment conditions for antibiotics are listed in
Table A1. The Xcalibur V. 4.0 (Thermo Fisher Scientific, Bremen, Germany) software was used for analysis of the control sample and for data collection.
Text A4. Quality assurance and control considered for surface water and groundwater sample data.
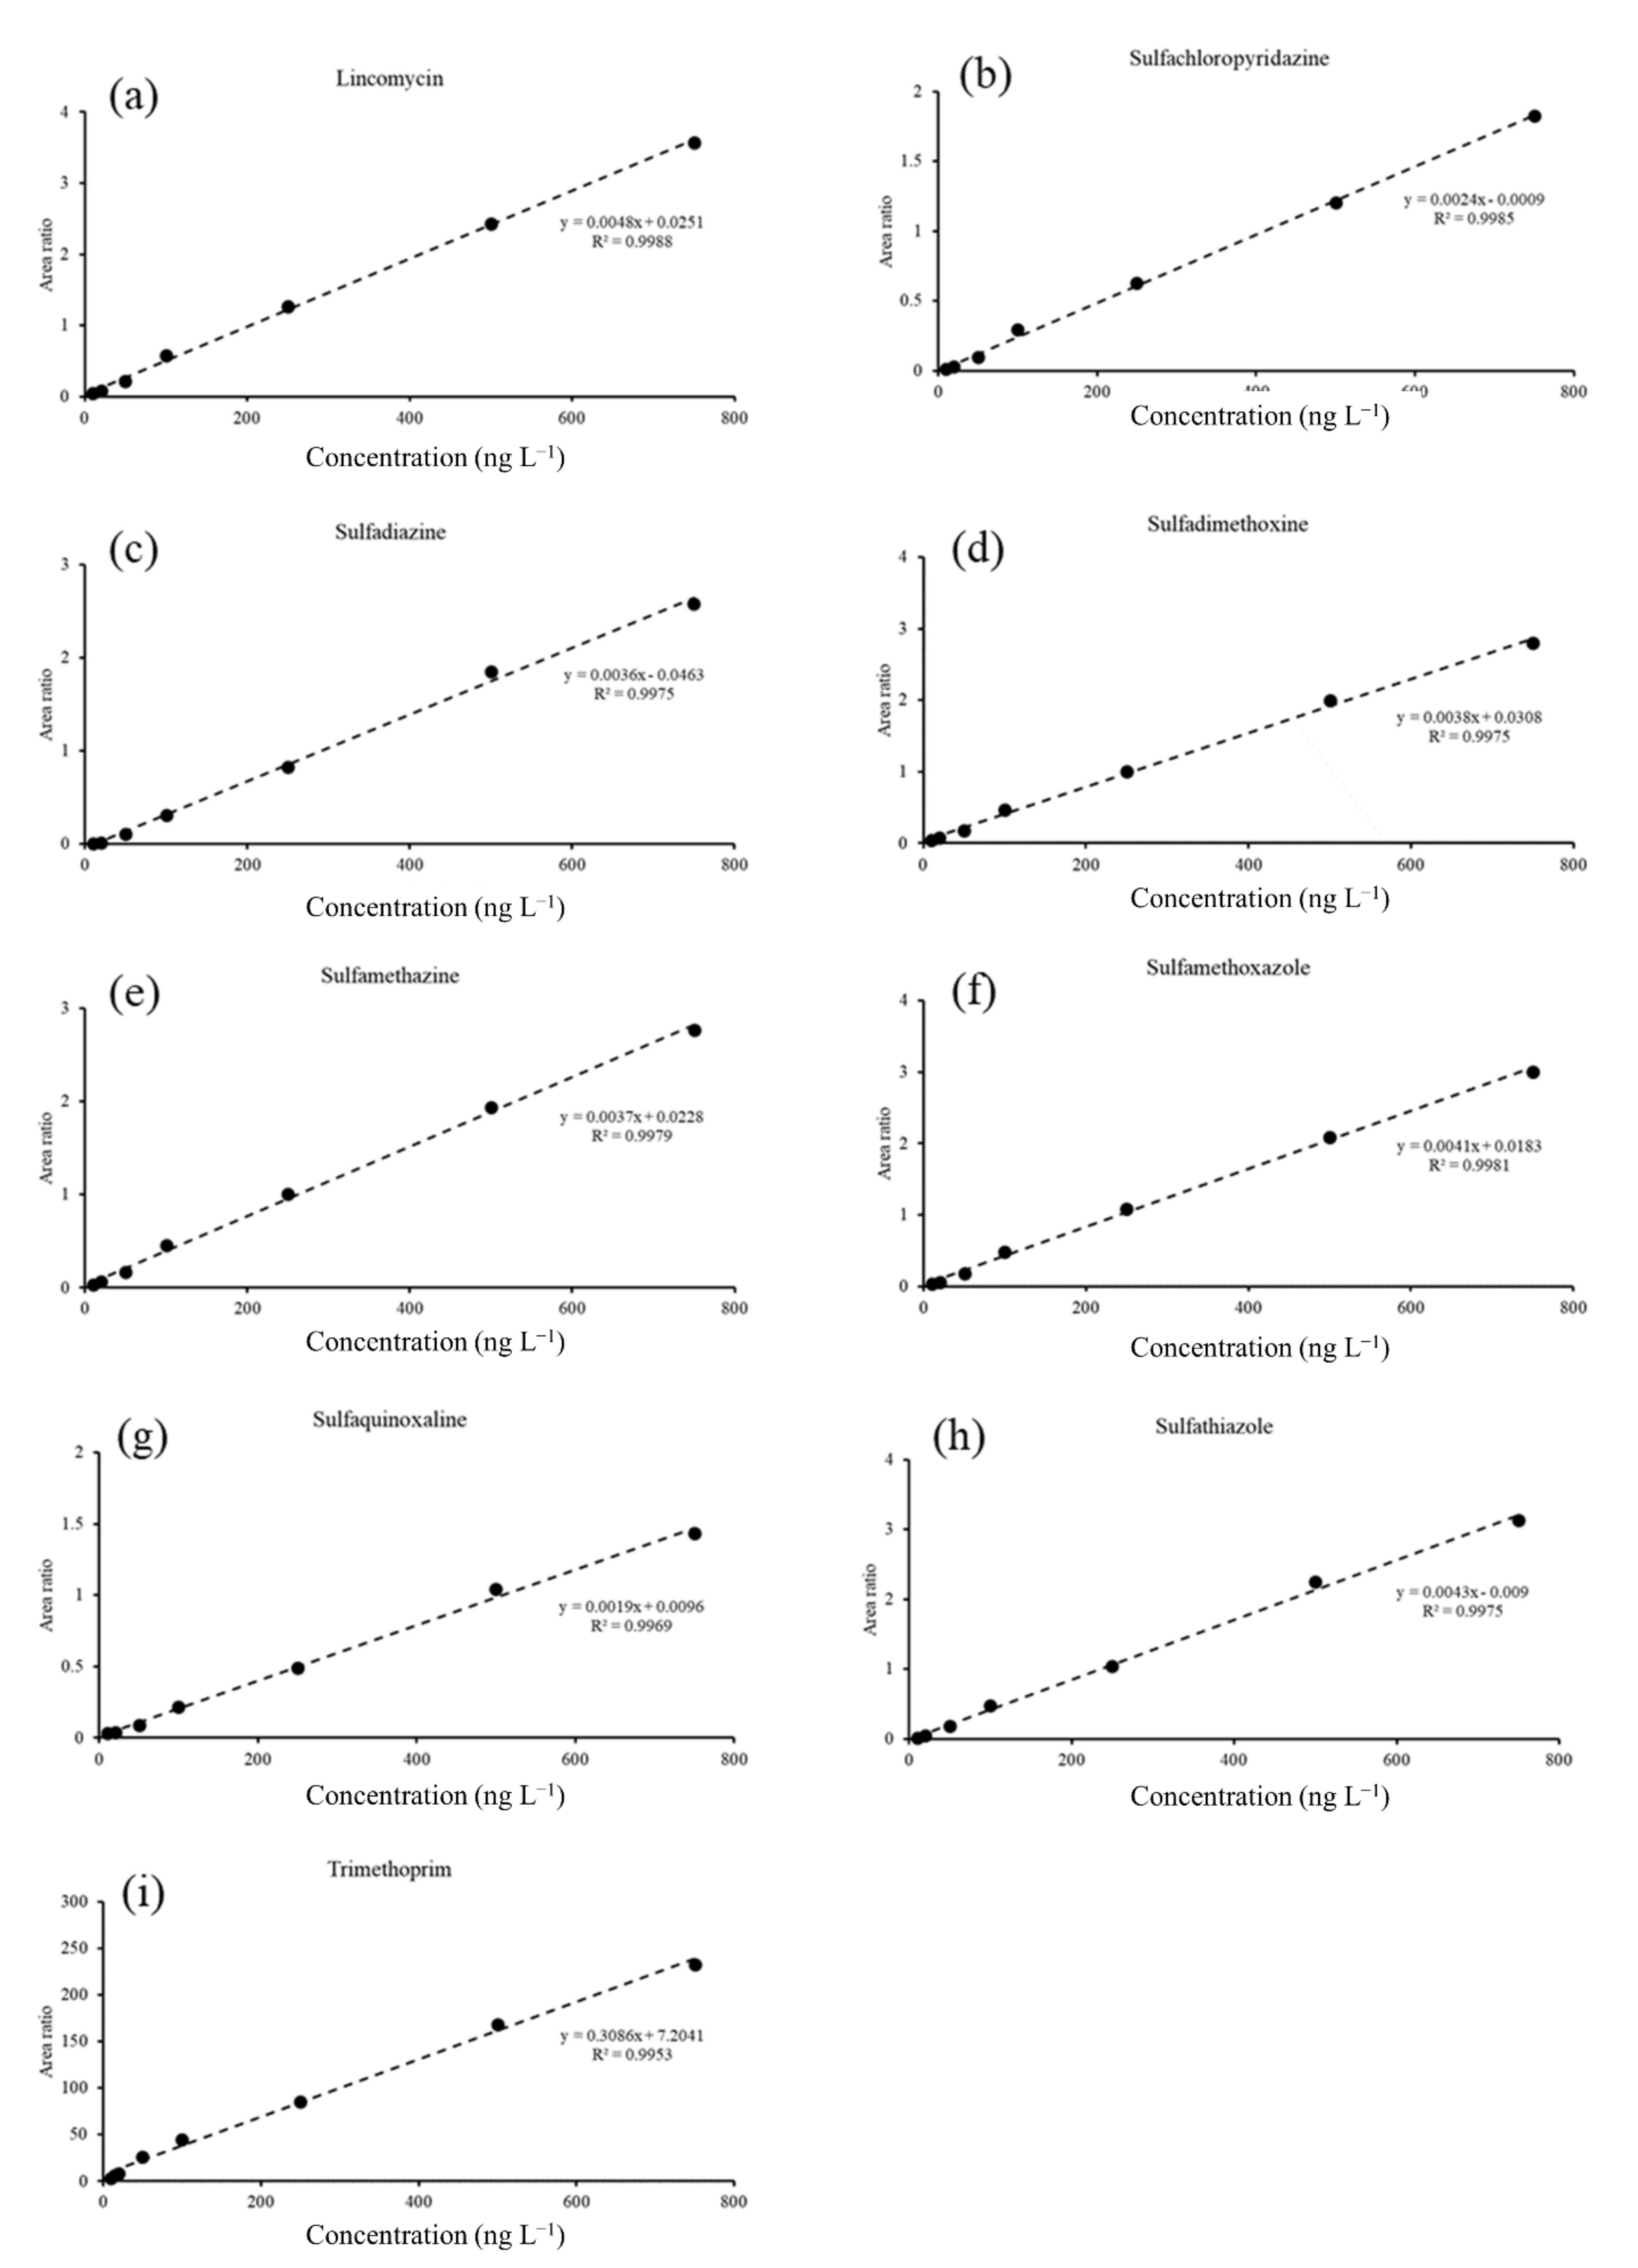
Each sample was analyzed three times, and the blanks and solvent blanks were analyzed after every analysis of six samples. The calibration curve was obtained using the results obtained for seven solutions in the range of 10–750 ng·L
−1, with each solution containing 250 ng·L
−1 of the ISTD mixture solvent. The coefficient of determination (R
2) for each antibiotic was estimated to be >0.99 (
Figure A1). The method detection limit (MDL) and method quantification limit (MQL) of the antibiotics were determined by multiplying the standard deviation value obtained by analyzing the 10 ng·L
−1 standard solution seven times, by 3.14 and 10, respectively (
Table A2).
Table A1.
Instrument conditions for the selected veterinary antibiotics.
Table A1.
Instrument conditions for the selected veterinary antibiotics.
| SPE Column | Hypersil GOLD aQ (2.1 × 20 mm; particle size, 12 μm) (Thermo Scientific Fisher, Bremen, Germany) |
| HPLC Column | XBridge C18 column (2.1 mm × 50 mm i.d., 2.5 μm, Waters, Milford, MA, USA) |
| Injection Volume (μL) | 5000 |
| Mobile Phase | (A) 0.1% formic acid in DW |
| (B) Acetonitrile |
| Chromatography Condition |
| UHPLC | Online SPE |
| Time (min) | Flow rate (mL·min−1) | A (%) | B (%) | Time (min) | Flow rate (mL·min−1) | A (%) | B (%) |
| 0 | 0.2 | 98 | 2 | 0 | 1 | 98 | 2 |
| 5.1 | 98 | 2 | 5.1 | 1 |
| 10 | 35 | 65 | 5.2 | 0.1 |
| 18.5 | 35 | 65 | 27.3 | 0.1 |
| 26 | 2 | 98 | 27.4 | 1 |
| 26.1 | 98 | 2 | 30 | 1 |
| 30 | 98 | 2 | | | | |
| Orbitrap MS Condition |
| Ionization mode | Positive | Resolving power | 17,500 FWHM (m/z 200) | Flow rate of sheath gas | 45 arb |
| Spray voltage | 3.5 kV | Automatic gain control (AGC) | 5 × 10⁵ | Flow rate of sweep gas | 2 arb |
| Capillary temperature | 250 | Maximum injection time (IT) | 100 ms | Flow rate of auxiliary gas | 10 arb |
| Auxiliary gas temperature | 400 | Normalized collision energy (NCE) | 30 | | |
Table A2.
Method detection limit (MDL) and method quantification limit (MQL) of the nine target antibiotics.
Table A2.
Method detection limit (MDL) and method quantification limit (MQL) of the nine target antibiotics.
| Chemical Name | Method Detection Limit (ng·L−1) | Method Quantification Limit (ng·L−1) |
|---|
| Lincomycin (LIN) | 0.44 | 1.40 |
| Sulfachloropyridazine (SCP) | 0.36 | 1.16 |
| Sulfadiazine (SDZ) | 1.59 | 5.07 |
| Sulfadimethoxine (SDX) | 0.48 | 1.53 |
| Sulfamethazine (SMZ) | 0.52 | 1.66 |
| Sulfamethoxazole (SMX) | 0.89 | 2.82 |
| Sulfaquinoxaline (SQX) | 0.67 | 2.15 |
| Sulfathiazole (STZ) | 1.07 | 3.41 |
| Trimethoprim (TMP) | 0.44 | 1.41 |
Table A3.
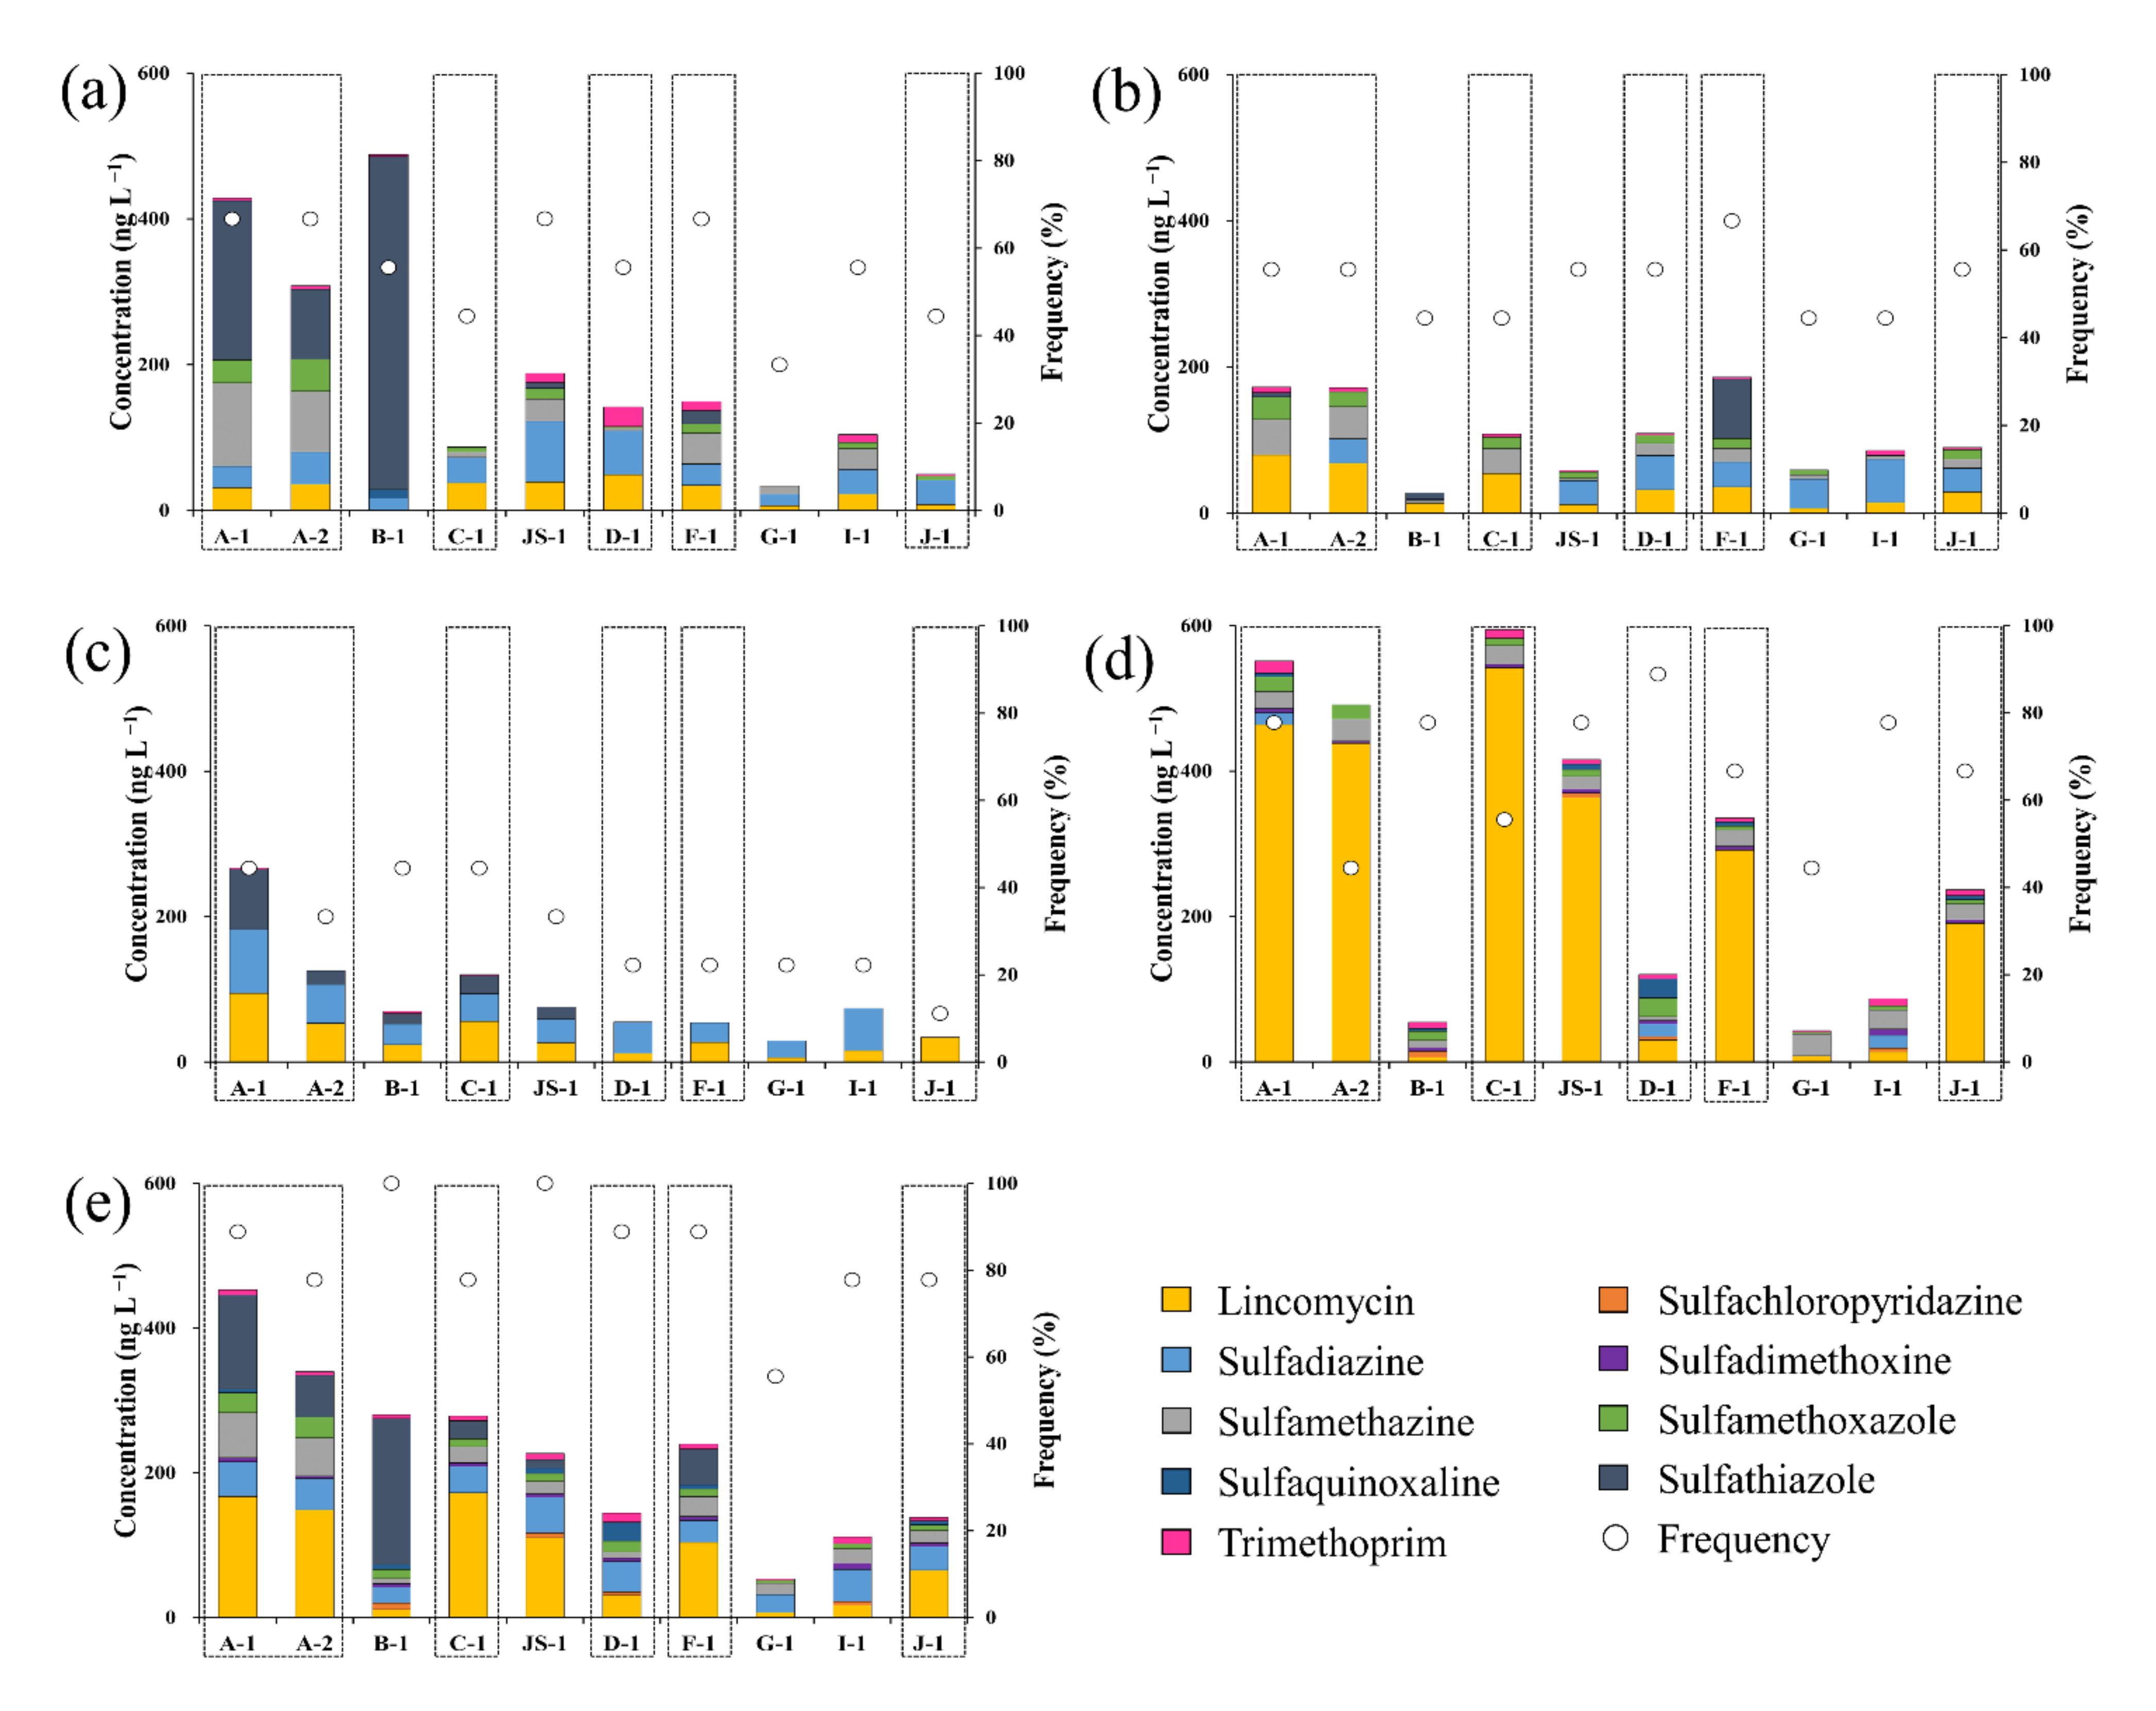
Residual concentrations of antibiotics in the surface water samples (ng·L−1). Blank cells indicate samples where no antibiotic could be detected.
Table A3.
Residual concentrations of antibiotics in the surface water samples (ng·L−1). Blank cells indicate samples where no antibiotic could be detected.
| | | LIN | SCP | SDZ | SDX | SMZ | SMX | SQX | STZ | TMP |
|---|
| March | A-1 | 31.1 | | 29.4 | | 114.6 | 31.6 | | 218.3 | 3.5 |
| A-2 | 35.8 | | 44.2 | | 83.7 | 43.6 | | 96.1 | 5.1 |
| B-1 | 0.8 | | 15.8 | | | | 12.1 | 457.0 | 2.5 |
| C-1 | 37.8 | | 35.0 | | 7.5 | 6.7 | | | |
| D-1 | 48.8 | | 60.7 | | 3.5 | 2.4 | | | 26.6 |
| JS-1 | 39.0 | | 83.3 | | 30.5 | 14.8 | | 8.1 | 12.6 |
| F-1 | 34.6 | | 29.1 | | 42.2 | 13.0 | | 18.1 | 12.5 |
| G-1 | 6.4 | | 16.1 | | 11.1 | | | | |
| I-1 | 22.5 | | 33.6 | | 28.7 | 8.2 | | | 11.0 |
| J-1 | 8.0 | | 33.3 | | | 5.8 | | | 2.6 |
| June | A-1 | 79.3 | | | | 48.9 | 30.8 | | 6.0 | 7.7 |
| A-2 | 68.4 | | 33.2 | | 44.0 | 20.3 | | | 5.3 |
| B-1 | 13.4 | | | | 4.1 | | 1.7 | 8.5 | |
| C-1 | 54.1 | | | | 34.2 | 15.5 | | | 4.3 |
| D-1 | 32.0 | | 46.8 | | 16.7 | 11.4 | | | 2.3 |
| JS-1 | 11.5 | | 32.8 | | 3.3 | 8.6 | | | 2.2 |
| F-1 | 35.8 | | 34.2 | | 18.6 | 13.5 | | 81.2 | 2.8 |
| G-1 | 6.5 | | 39.9 | | 5.8 | 6.9 | | | |
| I-1 | 14.5 | | 59.0 | | 5.4 | | | | 6.8 |
| J-1 | 28.8 | | 32.6 | | 12.7 | 12.4 | | | 3.4 |
| August | A-1 | 94.4 | | 87.8 | | | | | 82.9 | 1.6 |
| A-2 | 53.4 | | 52.9 | | | | | 19.3 | |
| B-1 | 24.0 | | 28.2 | | | | | 14.7 | 2.8 |
| C-1 | 55.9 | | 38.0 | | | | | 25.0 | 1.8 |
| D-1 | 11.7 | | 43.4 | | | | | | |
| JS-1 | 26.5 | | 32.2 | | | | | 17.0 | |
| F-1 | 26.9 | | 27.1 | | | | | | |
| G-1 | 5.8 | | 23.3 | | | | | | |
| I-1 | 15.6 | | 58.4 | | | | | | |
| J-1 | 33.9 | | | | | | | | |
| December | A-1 | 463.9 | | 16.4 | 5.8 | 23.1 | 20.3 | 5.0 | | 16.9 |
| A-2 | 438.0 | | | 3.3 | 30.4 | 19.4 | | | |
| B-1 | 6.0 | 8.8 | | 4.7 | 10.2 | 12.4 | 3.9 | | 8.7 |
| C-1 | 542.0 | | | 4.8 | 26.0 | 10.0 | | | 11.6 |
| D-1 | 30.1 | 4.6 | 17.6 | 4.7 | 5.5 | 25.6 | 26.4 | | 6.1 |
| JS-1 | 363.5 | 6.5 | | 4.9 | 17.9 | 9.1 | 7.6 | | 6.7 |
| F-1 | 291.2 | | | 5.6 | 22.2 | 5.3 | 5.7 | | 5.5 |
| G-1 | 8.2 | | | | 30.2 | 2.7 | | | 1.8 |
| I-1 | 13.6 | 5.3 | 17.7 | 8.6 | 25.9 | 5.9 | | | 10.2 |
| J-1 | 190.7 | | | 4.7 | 21.8 | 6.0 | 5.7 | | 7.9 |
| Average 2018 | A-1 | 167.1 | | 48.1 | 5.8 | 62.2 | 27.6 | 5.0 | 129.9 | 7.1 |
| A-2 | 148.9 | | 43.4 | 3.3 | 52.7 | 28.7 | | 57.7 | 5.2 |
| B-1 | 11.0 | 8.8 | 22.0 | 4.7 | 7.1 | 12.4 | 6.8 | 202.5 | 4.9 |
| C-1 | 172.5 | | 36.5 | 4.8 | 22.6 | 10.6 | | 25.0 | 6.4 |
| D-1 | 30.6 | 4.6 | 42.1 | 4.7 | 8.6 | 14.9 | 26.4 | | 12.4 |
| JS-1 | 110.1 | 6.5 | 49.4 | 4.9 | 17.2 | 10.8 | 7.6 | 11.6 | 8.6 |
| F-1 | 103.5 | | 30.5 | 5.6 | 27.7 | 10.2 | 5.7 | 49.6 | 6.9 |
| G-1 | 6.7 | | 24.7 | | 15.7 | 4.1 | | | 1.8 |
| I-1 | 16.6 | 5.3 | 44.4 | 8.6 | 20.0 | 7.0 | | | 9.2 |
| J-1 | 65.4 | | 32.9 | 4.7 | 17.2 | 7.8 | 5.7 | | 4.6 |
Table A4.
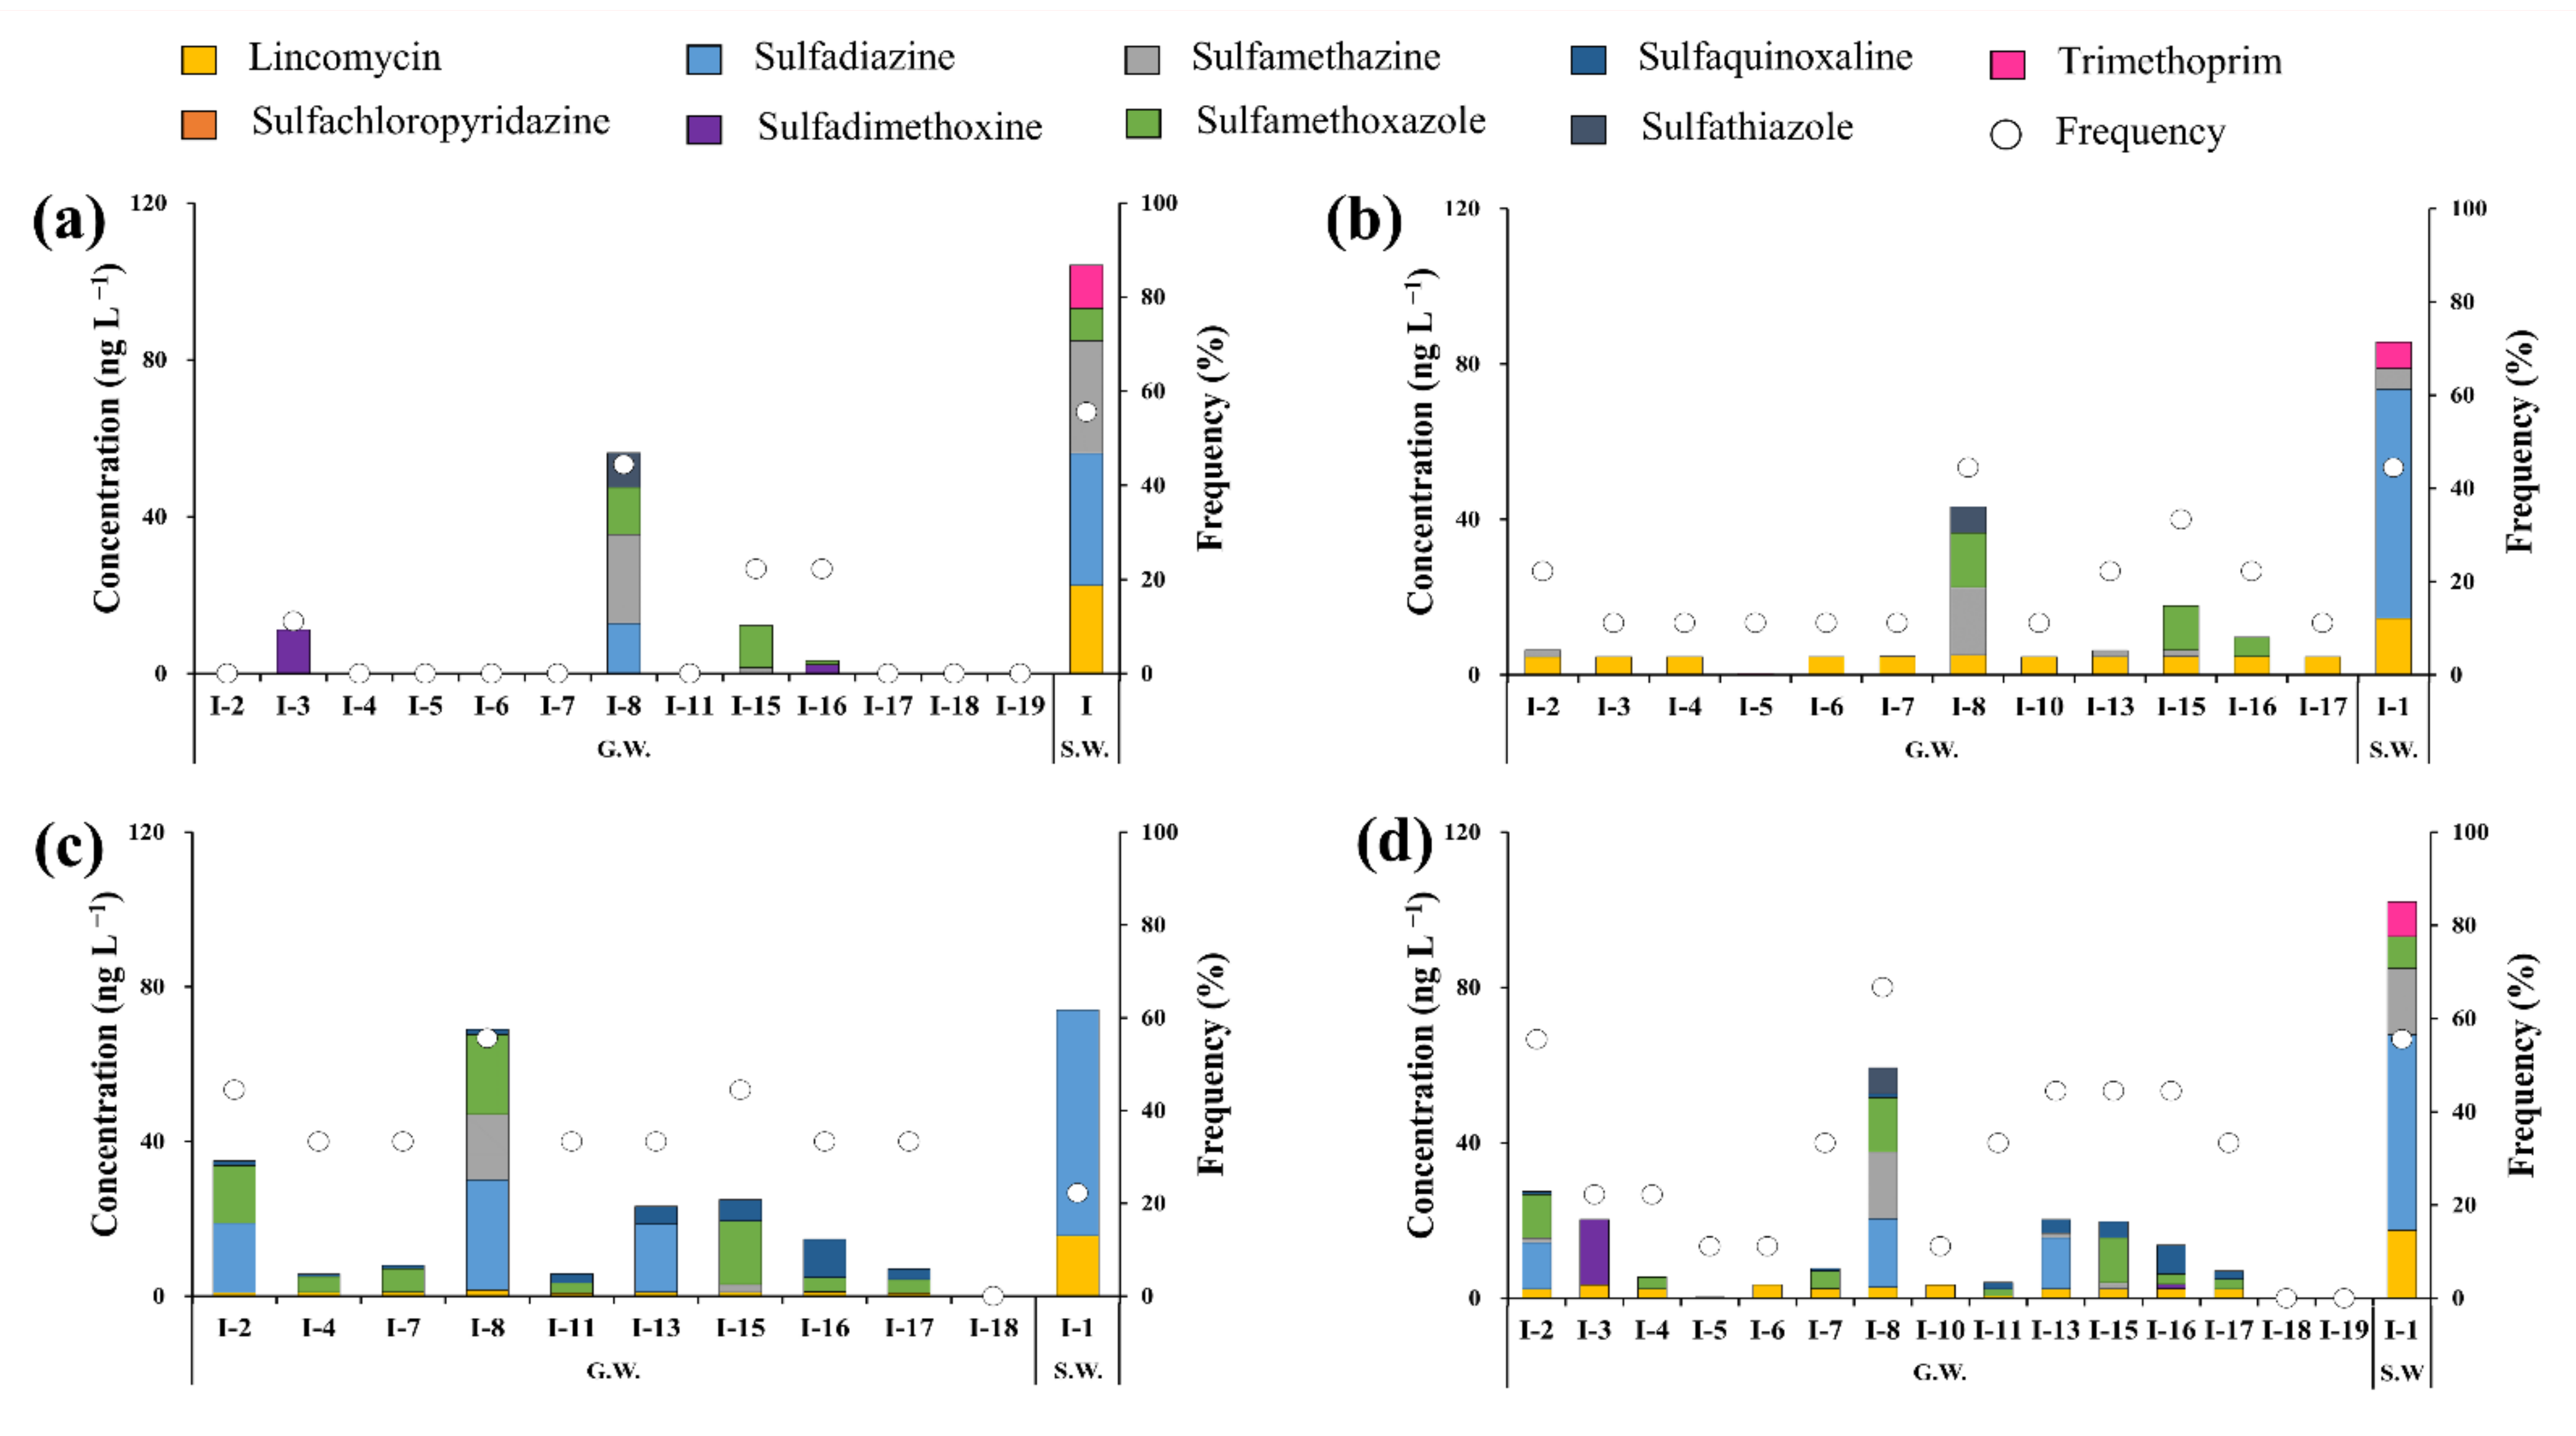
Residual concentrations of antibiotics in the groundwater samples (ng Lࢤ1). Blank cells indicate samples where no antibiotic could be detected.
Table A4.
Residual concentrations of antibiotics in the groundwater samples (ng Lࢤ1). Blank cells indicate samples where no antibiotic could be detected.
| | | LIN | SCP | SDZ | SDX | SMZ | SMX | SQX | STZ | TMP |
|---|
| March | I-2 | | | | | | | | | |
| I-3 | | | | 11.2 | | | | | |
| I-4 | | | | | | | | | |
| I-5 | | | | | | | | | |
| I-6 | | | | | | | | | |
| I-7 | | | | | | | | | |
| I-8 | | | 12.8 | | 22.7 | 12.0 | | 8.8 | |
| I-10 | | | | | | | | | |
| I-11 | | | | | | | | | |
| I-13 | | | | | | | | | |
| I-15 | | | | | 1.6 | 10.8 | | | |
| I-16 | | | | 2.3 | | 1.0 | | | |
| I-17 | | | | | | | | | |
| I-18 | | | | | | | | | |
| I-19 | | | | | | | | | |
| June | I-2 | 4.6 | | | | 1.8 | | | | |
| I-3 | 4.6 | | | | | | | | |
| I-4 | 4.7 | | | | | | | | |
| I-5 | | | | | | | | | 0.4 |
| I-6 | 4.7 | | | | | | | | |
| I-7 | 4.8 | | | | | | | | |
| I-8 | 5.1 | | | | 17.5 | 14.0 | | 6.7 | |
| I-10 | 4.6 | | | | | | | | |
| I-11 | | | | | | | | | |
| I-13 | 4.7 | | | | 1.6 | | | | |
| I-15 | 4.7 | | | | 1.7 | 11.4 | | | |
| I-16 | 4.7 | | | | | 4.9 | | | |
| I-17 | 4.6 | | | | | | | | |
| I-18 | | | | | | | | | |
| I-19 | | | | | | | | | |
| August | I-2 | 0.9 | | 18.0 | | | 14.9 | 1.2 | | |
| I-3 | | | | | | | | | |
| I-4 | 1.0 | | | | | 4.1 | 0.6 | | |
| I-5 | | | | | | | | | |
| I-6 | | | | | | | | | |
| I-7 | 1.1 | | | | | 6.1 | 0.8 | | |
| I-8 | 1.6 | | 28.4 | | 16.9 | 20.7 | 1.3 | | |
| I-10 | | | | | | | | | |
| I-11 | 0.8 | | | | | 2.6 | 2.4 | | |
| I-13 | 1.1 | | 17.6 | | | | 4.6 | | |
| I-15 | 1.0 | | | | 2.1 | 16.4 | 5.5 | | |
| I-16 | 1.1 | | | | | 3.7 | 9.9 | | |
| I-17 | 0.8 | | | | | 3.5 | 2.8 | | |
| I-18 | | | | | | | | | |
| I-19 | | | | | | | | | |
| Average 2018 | I-2 | 5.5 | | 18.0 | | 1.8 | 14.9 | 1.2 | | |
| I-3 | 4.6 | | | 11.2 | | | | | |
| I-4 | 5.7 | | | | | 4.1 | 0.6 | | |
| I-5 | | | | | | | | | 0.4 |
| I-6 | 4.7 | | | | | | | | |
| I-7 | 5.8 | | | | | 6.1 | 0.8 | | |
| I-8 | 6.7 | | 41.2 | | 57.1 | 46.7 | 1.3 | 15.5 | |
| I-10 | 4.6 | | | | | | | | |
| I-11 | 0.8 | | | | | 2.6 | 2.4 | | |
| I-13 | 5.7 | | 17.6 | | 1.6 | | 4.6 | | |
| I-15 | 5.7 | | | | 5.3 | 38.6 | 5.5 | | |
| I-16 | 5.8 | | | 2.3 | | 9.6 | 9.9 | | |
| I-17 | 5.5 | | | | | 3.5 | 2.8 | | |
| I-18 | | | | | | | | | |
| I-19 | | | | | | | | | |
Table A5.
Ecological risk assessment for antibiotics in the surface water samples during each sampling campaign. Blank cells indicate samples where no antibiotic could be detected.
Table A5.
Ecological risk assessment for antibiotics in the surface water samples during each sampling campaign. Blank cells indicate samples where no antibiotic could be detected.
| | LIN | SCP | SDZ | SDX | SMZ | SMX | SQX | STZ | TMP | |
| March | 7.0 × 10⁻³ | | 6.2 × 10⁻² | | 1.3 | 2.3 | 9.2 × 10⁻⁵ | 9.1 × 10⁻² | 6.7 × 10⁻¹ | |
| June | 1.1 × 10⁻² | | 4.4 × 10⁻² | | 5.6 × 10⁻¹ | 1.6 | 1.3 × 10⁻⁵ | 1.6 × 10⁻² | 1.9 × 10⁻¹ | |
| August | 1.3 × 10⁻² | | 6.5 × 10⁻² | | | | | 1.7 × 10⁻² | 6.9 × 10⁻² | |
| December | 7.7 × 10⁻² | 3.3 × 10⁻⁴ | 1.3 × 10⁻² | 1.6 × 10⁻³ | 3.5 × 10⁻¹ | 1.3 | 2.0 × 10⁻⁴ | | 4.2 × 10⁻¹ | |
| | A-1 | A-2 | B-1 | C-1 | JS-1 | D-1 | F-1 | G-1 | I-1 | J-1 |
| March | 3.1 | 3.4 | 1.6 × 10⁻¹ | 4.7 × 10⁻¹ | 1.5 | 8.8 × 10⁻¹ | 1.5 | 1.4 × 10⁻¹ | 1.1 | 4.0 × 10⁻¹ |
| June | 2.4 | 1.7 | 5.0 × 10⁻² | 1.3 | 5.7 × 10⁻¹ | 8.9 × 10⁻¹ | 1.0 | 4.6 × 10⁻¹ | 2.8 × 10⁻¹ | 9.1 × 10⁻¹ |
| August | 1.3 × 10⁻¹ | 5.1 × 10⁻² | 9.6 × 10⁻² | 8.5 × 10⁻² | 3.1 × 10⁻² | 3.4 × 10⁻² | 2.4 × 10⁻² | 1.8 × 10⁻² | 4.5 × 10⁻² | 4.8 × 10⁻³ |
| December | 1.8 | 1.4 | 9.9 × 10⁻¹ | 1.2 | 9.0 × 10⁻¹ | 1.6 | 7.1 × 10⁻¹ | 5.4 × 10⁻¹ | 8.8 × 10⁻¹ | 7.9 × 10⁻¹ |
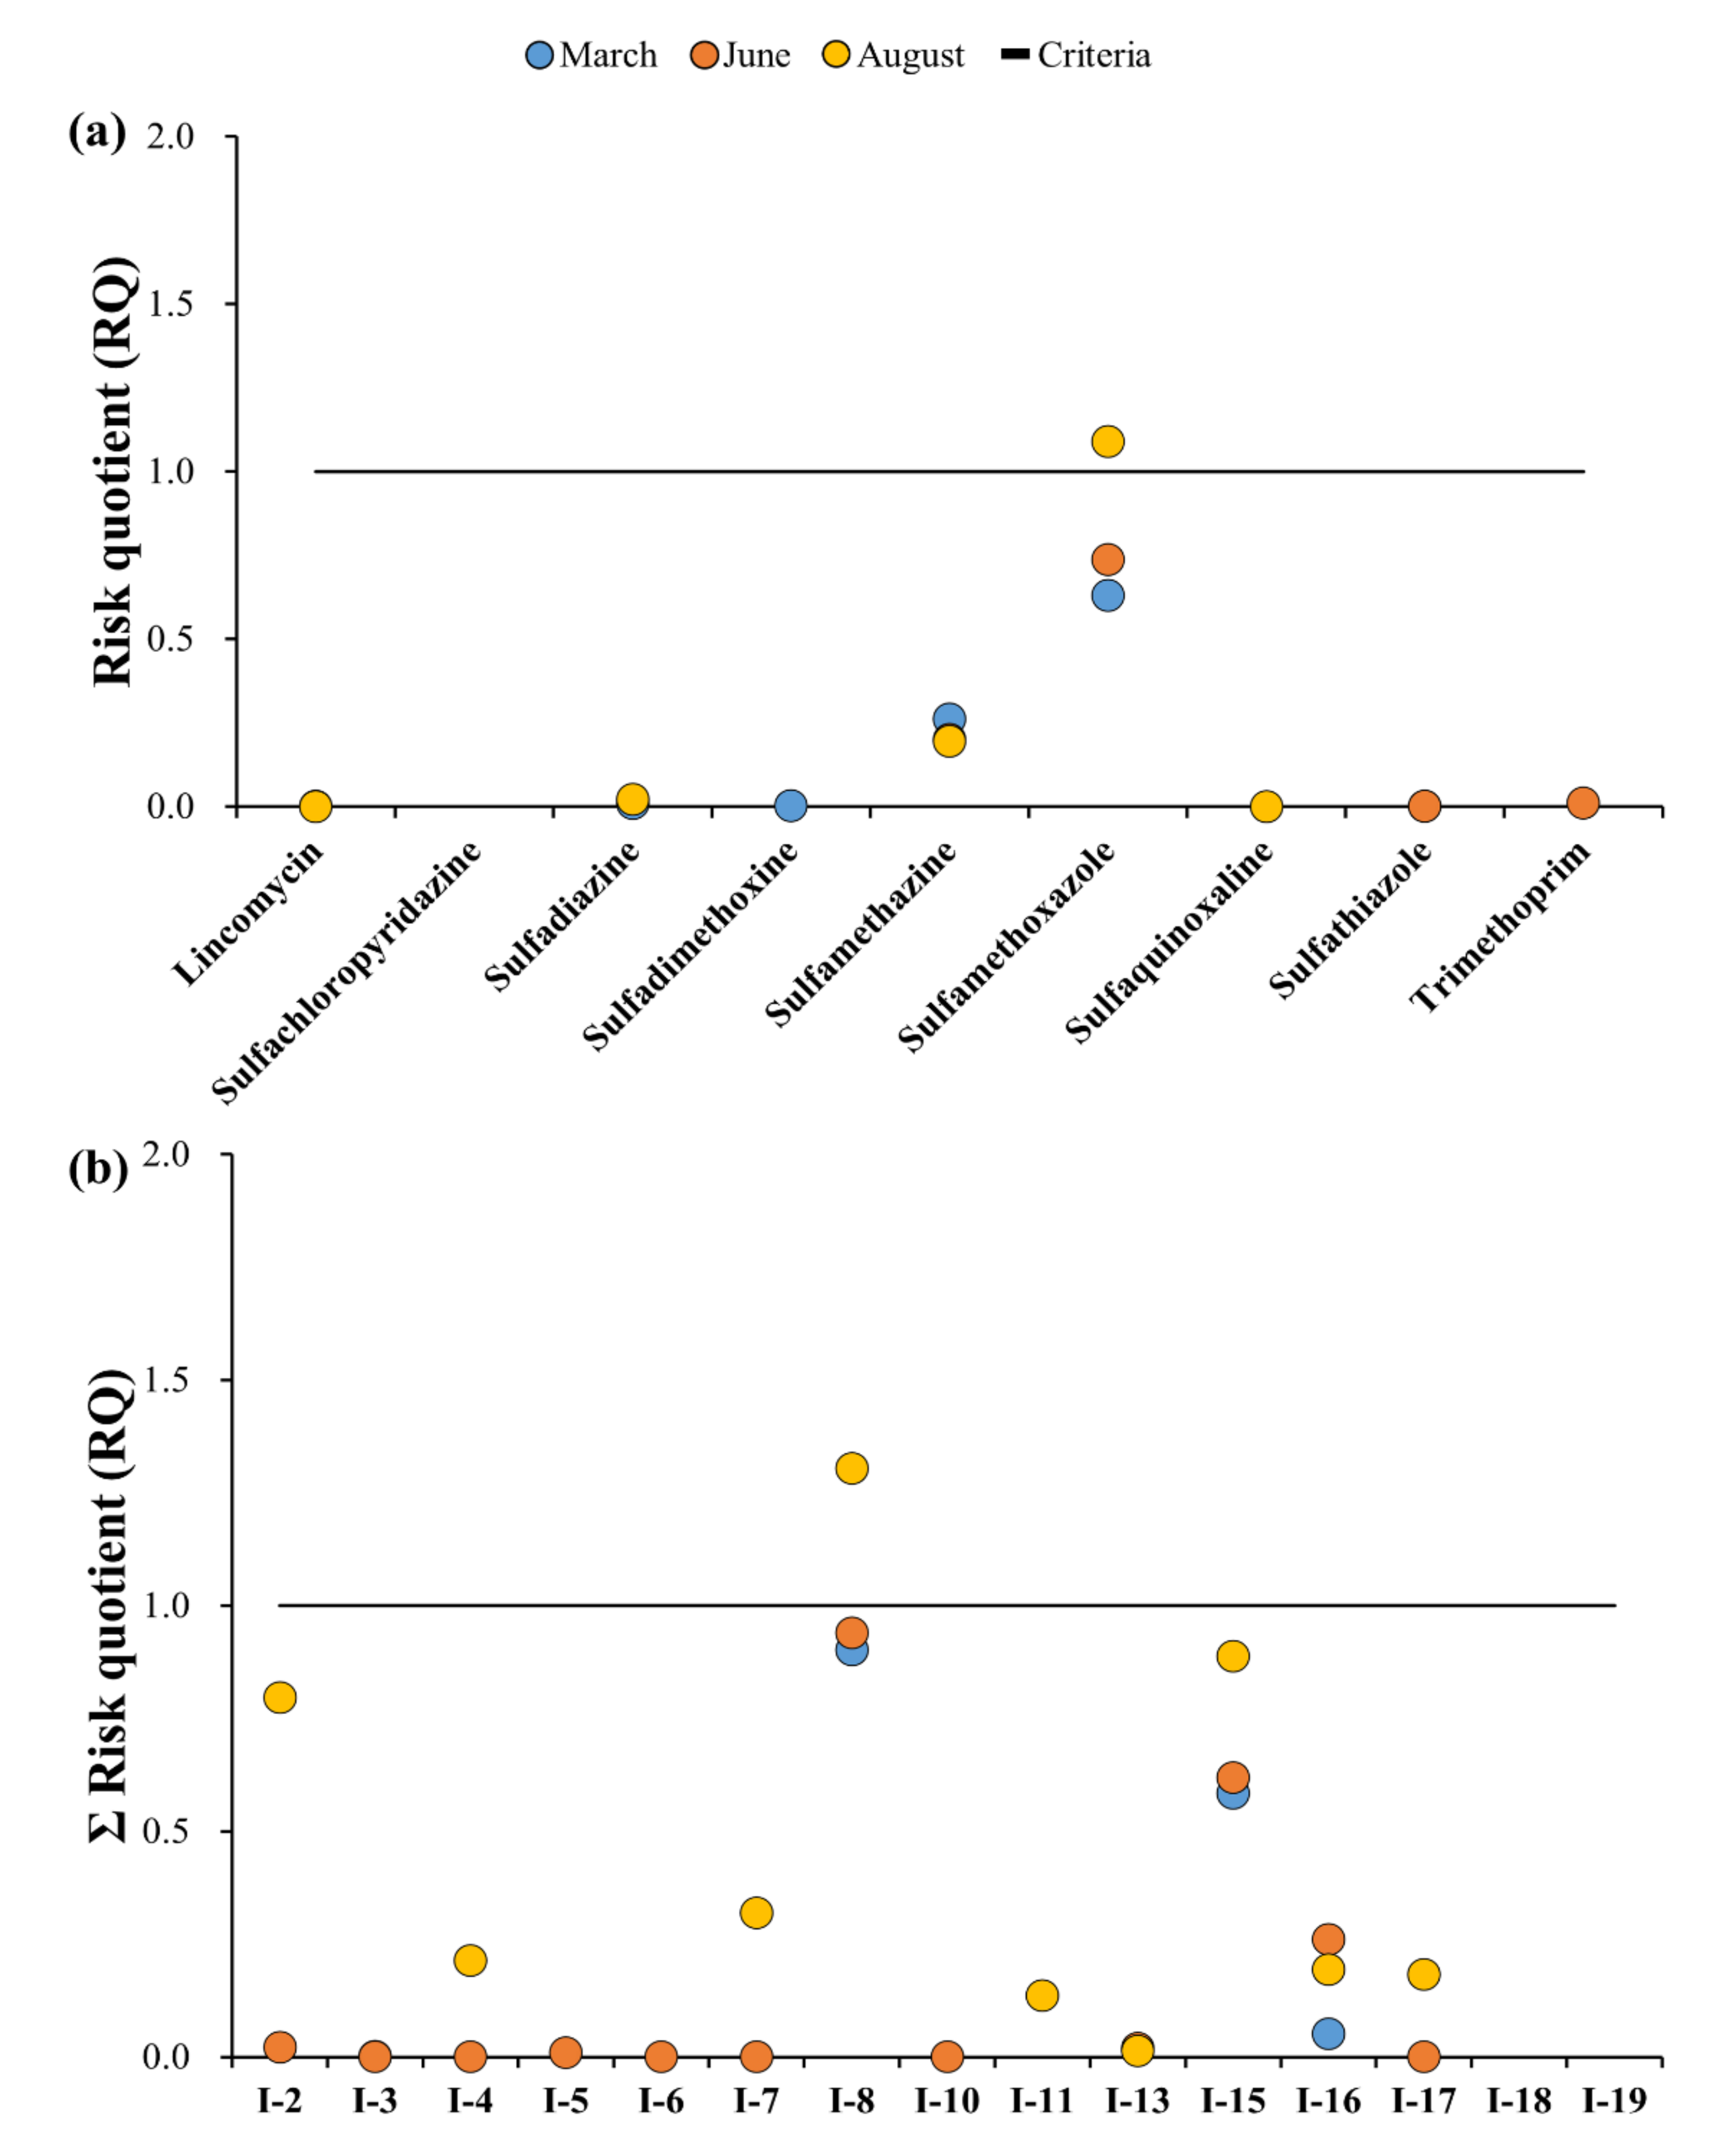
Table A6.
Ecological risk assessment for antibiotics in the groundwater samples during each sampling campaign. Blank cells indicate samples where no antibiotic could be detected.
Table A6.
Ecological risk assessment for antibiotics in the groundwater samples during each sampling campaign. Blank cells indicate samples where no antibiotic could be detected.
| | March | June | August | | March | June | August |
|---|
| LIN | | 7.2 × 10⁻⁴ | 2.3 × 10⁻⁴ | I-2 | | 2.1 × 10⁻² | 8.0 × 10⁻¹ |
| SCP | | | | I-3 | 2.1 × 10⁻³ | 6.6 × 10⁻⁴ | |
| SDZ | 9.5 × 10⁻³ | | 2.1 × 10⁻² | I-4 | | 6.7 × 10⁻⁴ | 2.1 × 10⁻¹ |
| SDX | 2.1 × 10⁻³ | | | I-5 | | 1.0 × 10⁻² | |
| SMZ | 2.6 × 10⁻¹ | 2.0 × 10⁻¹ | 1.9 × 10⁻¹ | I-6 | | 6.6 × 10⁻⁴ | |
| SMX | 6.3 × 10⁻¹ | 7.4 × 10⁻¹ | 1.1 | I-7 | | 6.8 × 10⁻⁴ | 3.2 × 10⁻¹ |
| SQX | | | 7.5 × 10⁻⁵ | I-8 | 9.0 × 10⁻¹ | 9.4 × 10⁻¹ | 1.3 |
| STZ | 1.8 × 10⁻³ | 1.3 × 10⁻³ | | I-10 | | 6.6 × 10⁻⁴ | |
| TMP | | 1.0 × 10⁻² | | I-11 | | | 1.4 × 10⁻¹ |
| | | | | I-13 | | 1.9 × 10⁻² | 1.3 × 10⁻² |
| | | | | I-15 | 5.8 × 10⁻¹ | 6.2 × 10⁻¹ | 8.9 × 10⁻¹ |
| | | | | I-16 | 5.1 × 10⁻² | 2.6 × 10⁻¹ | 1.9 × 10⁻¹ |
| | | | | I-17 | | 6.6 × 10⁻⁴ | 1.8 × 10⁻¹ |
| | | | | I-18 | | | |
| | | | | I-19 | | | |
Table A7.
Risk assessment for resistance to antibiotics in the surface water samples. Blank cells indicate samples where no antibiotic could be detected.
Table A7.
Risk assessment for resistance to antibiotics in the surface water samples. Blank cells indicate samples where no antibiotic could be detected.
| | LIN | SCP | SDZ | SDX | SMZ | SMX | SQX | STZ | TMP | |
| March | 2.4 × 10⁻² | | 4.2 × 10⁻⁵ | | 7.2 × 10⁻³ | 2.7 × 10⁻³ | 4.7 × 10⁻⁵ | 1.8 × 10⁻³ | 5.3 × 10⁻² | |
| June | 4.0 × 10⁻² | | 2.9 × 10⁻⁵ | | 3.1 × 10⁻³ | 1.9 × 10⁻³ | 6.5 × 10⁻⁶ | 3.2 × 10⁻⁴ | 1.5 × 10⁻² | |
| August | 4.7 × 10⁻² | | 4.4 × 10⁻⁵ | | | | | 3.2 × 10⁻⁴ | 5.5 × 10⁻³ | |
| December | 2.7 × 10⁻¹ | 8.8 × 10⁻⁶ | 8.9 × 10⁻⁶ | 1.6 × 10⁻³ | 1.9 × 10⁻³ | 1.6 × 10⁻³ | 1.0 × 10⁻⁴ | | 3.4 × 10⁻² | |
| | A-1 | A-2 | B-1 | C-1 | JS-1 | D-1 | F-1 | G-1 | I-1 | J-1 |
| March | 3.3 × 10⁻² | 3.6 × 10⁻² | 7.1 × 10⁻³ | 2.0 × 10⁻² | 4.8 × 10⁻² | 7.8 × 10⁻² | 3.9 × 10⁻³ | 3.6 × 10⁻² | 4.6 × 10⁻² | 9.5 × 10⁻³ |
| June | 6.0 × 10⁻² | 4.9 × 10⁻² | 7.0 × 10⁻³ | 3.9 × 10⁻² | 1.1 × 10⁻² | 2.2 × 10⁻² | 4.1 × 10⁻³ | 2.1 × 10⁻² | 2.6 × 10⁻² | 2.3 × 10⁻² |
| August | 5.1 × 10⁻² | 2.7 × 10⁻² | 1.8 × 10⁻² | 3.2 × 10⁻² | 1.3 × 10⁻² | 5.9 × 10⁻³ | 2.9 × 10⁻³ | 7.8 × 10⁻³ | 1.3 × 10⁻² | 1.7 × 10⁻² |
| December | 1.0 × 10⁻¹ | 9.1 × 10⁻² | 1.8 × 10⁻² | 1.0× 10⁻¹ | 7.5 × 10⁻² | 4.3 × 10⁻² | 8.2 × 10⁻³ | 3.0 × 10⁻² | 6.9 × 10⁻² | 4.4 × 10⁻² |
Table A8.
Risk assessment for resistance to antibiotics in the groundwater samples. Blank cells indicate samples where no antibiotic could be detected.
Table A8.
Risk assessment for resistance to antibiotics in the groundwater samples. Blank cells indicate samples where no antibiotic could be detected.
| | March | June | August | | March | June | August |
|---|
| LIN | | 2.5 × 10⁻³ | 8.1 × 10⁻⁴ | I-2 | | 2.4 × 10⁻³ | 1.4 × 10⁻³ |
| SCP | | | | I-3 | 2.1 × 10⁻³ | 2.3 × 10⁻³ | |
| SDZ | 6.4 × 10⁻⁶ | | 1.4 × 10⁻⁵ | I-4 | | 2.3 × 10⁻³ | 7.7 × 10⁻⁴ |
| SDX | 7.2 × 10⁻³ | | | I-5 | | 8.1 × 10⁻⁴ | |
| SMZ | 1.4 × 10⁻³ | 1.1 × 10⁻³ | 1.1 × 10⁻³ | I-6 | | 2.3 × 10⁻³ | |
| SMX | 7.5 × 10⁻⁴ | 8.8 × 10⁻⁴ | 1.3 × 10⁻³ | I-7 | | 2.4 × 10⁻³ | 9.2 × 10⁻⁴ |
| SQX | | | 3.9 × 10⁻⁵ | I-8 | 2.2 × 10⁻² | 4.5 × 10⁻³ | 3.2 × 10⁻³ |
| STZ | 3.4 × 10⁻⁵ | 2.6 × 10⁻⁵ | | I-10 | | 2.3 × 10⁻³ | |
| TMP | | 8.1 × 10⁻⁴ | | I-11 | | | 5.9 × 10⁻⁴ |
| | | | | I-13 | | 2.4 × 10⁻³ | 5.6 × 10⁻⁴ |
| | | | | I-15 | 7.7 × 10⁻⁴ | 3.2 × 10⁻³ | 1.7 × 10⁻³ |
| | | | | I-16 | 5.0 × 10⁻⁴ | 2.7 × 10⁻³ | 8.3 × 10⁻⁴ |
| | | | | I-17 | | 2.3 × 10⁻³ | 6.3 × 10⁻⁴ |
| | | | | I-18 | | | |
| | | | | I-19 | | | |
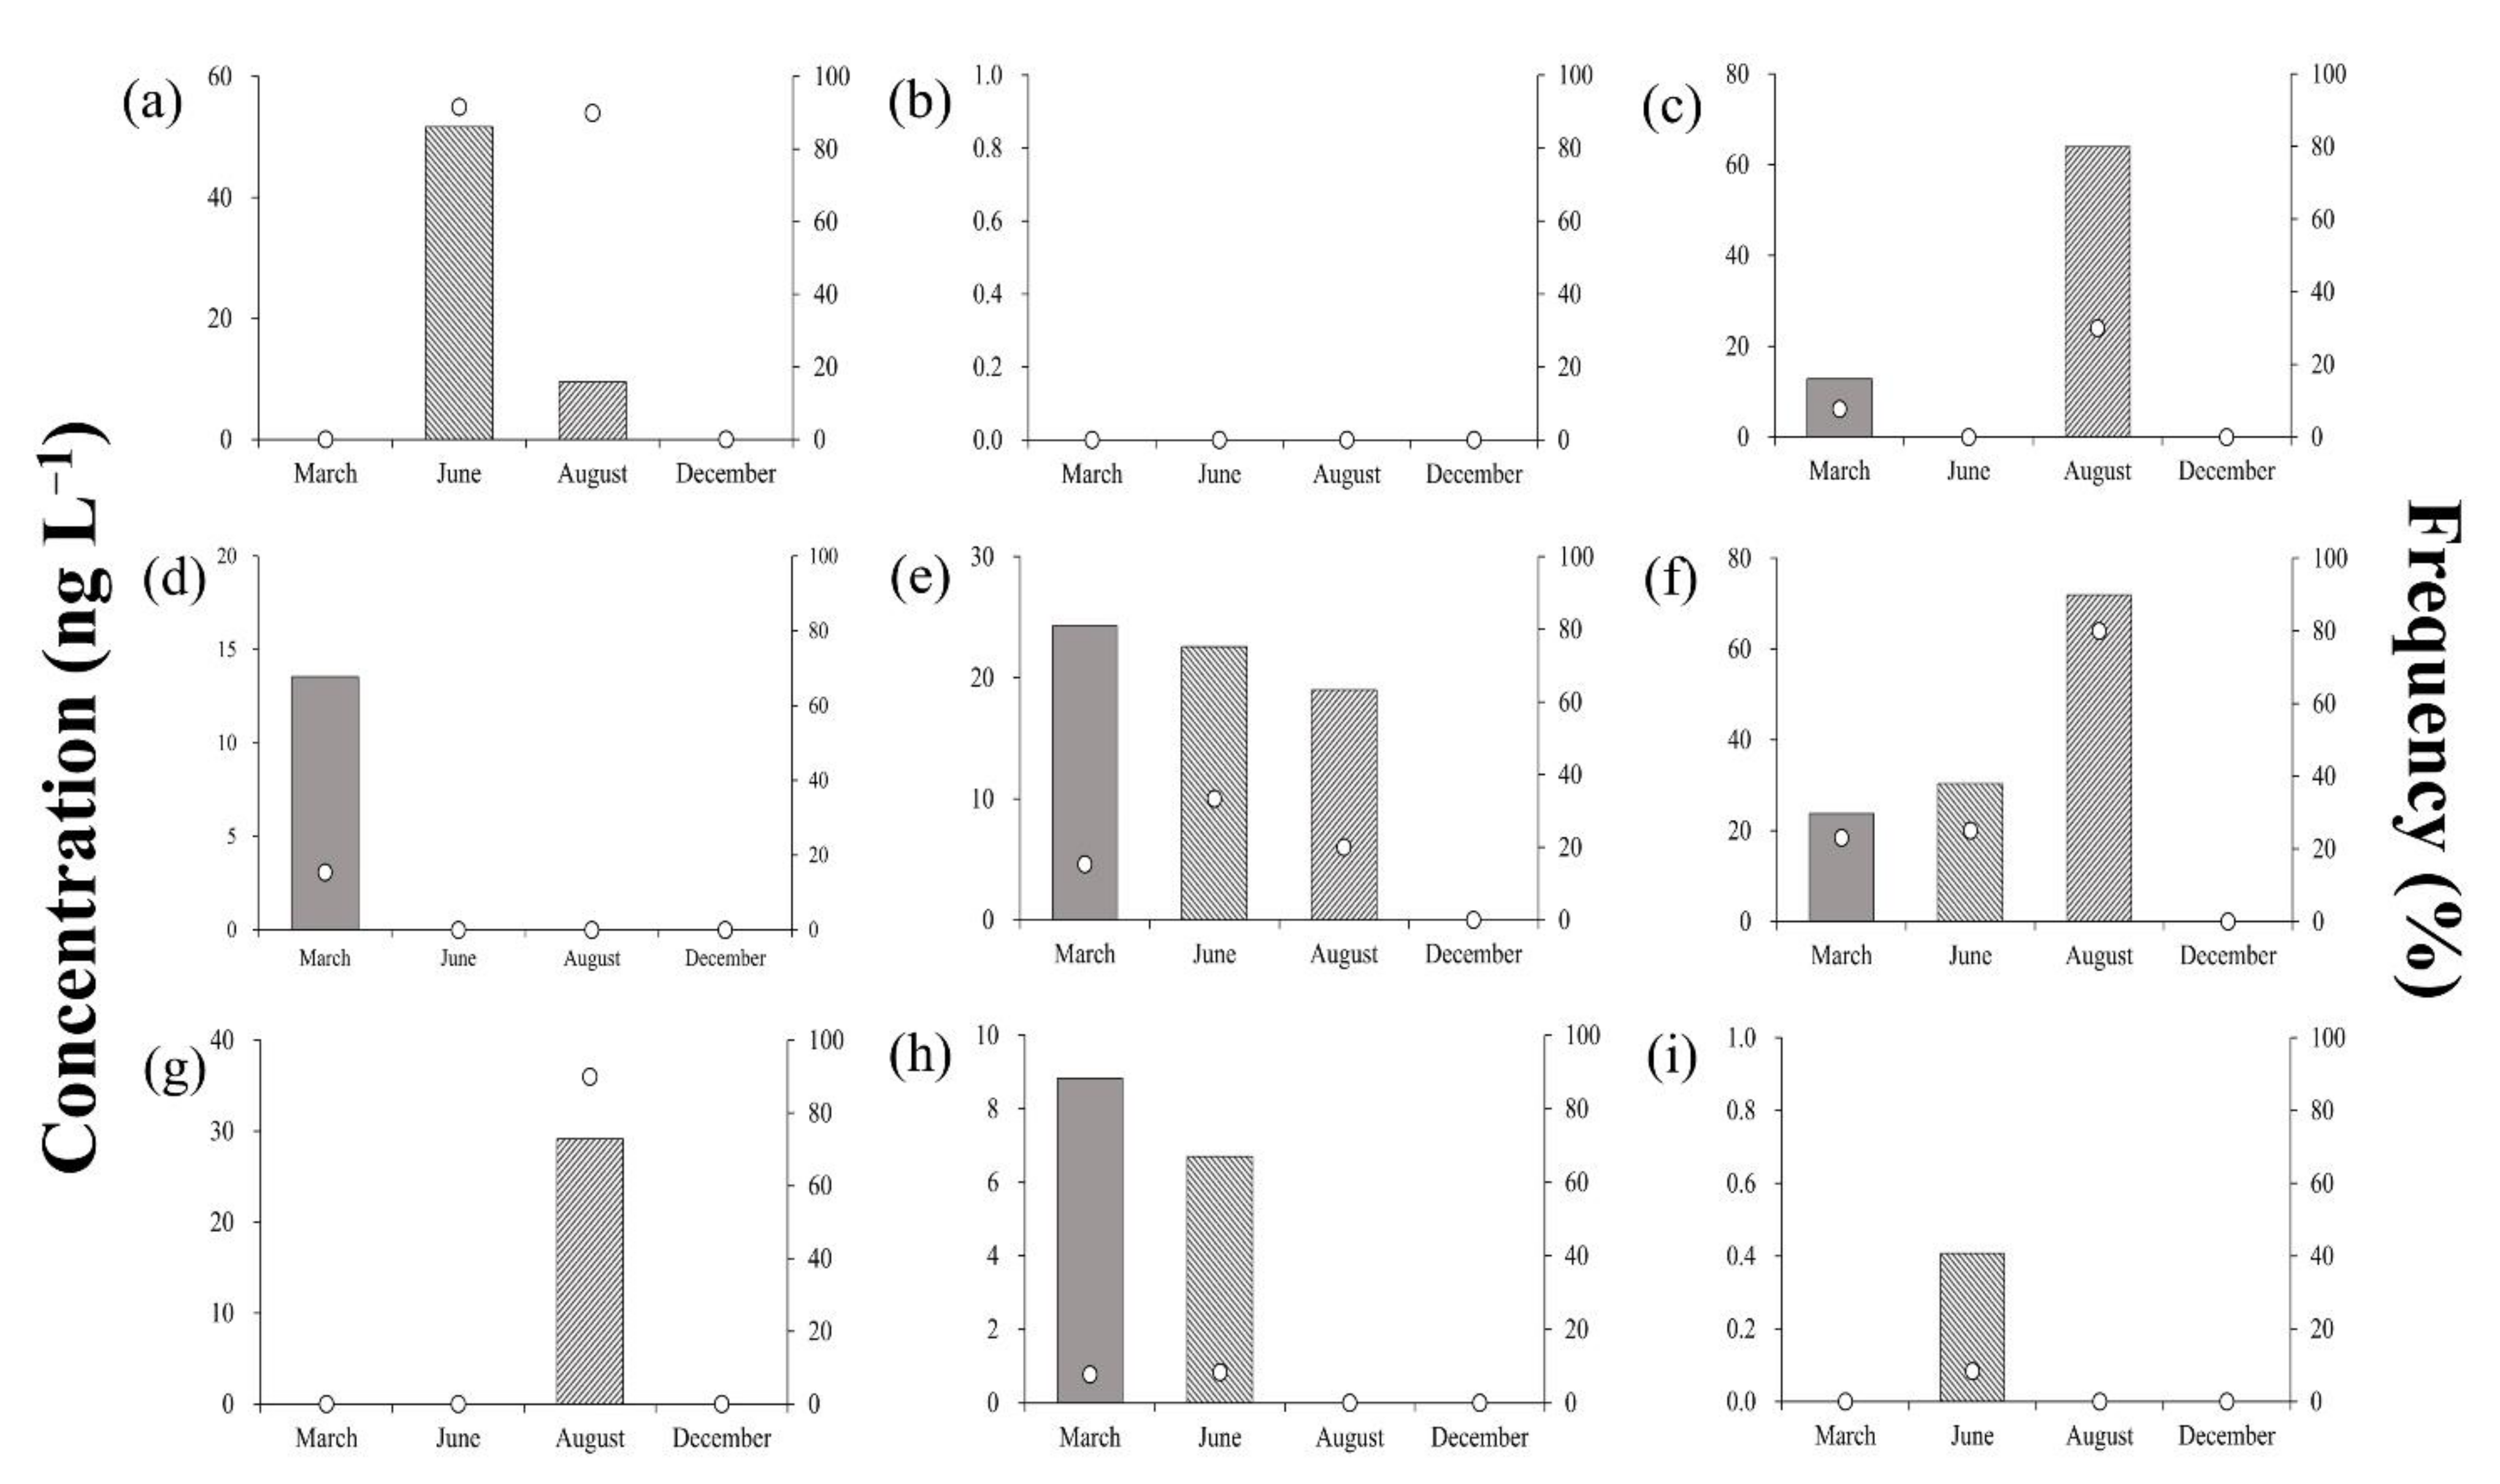
Figure A1.
Calibration curves using UHPLC-q-orbitrap HRMS, combined with an online SPE analysis for the nine antibiotics analyzed. (a) lincomycin, (b) sulfachloropyridazine, (c) sulfadiazine, (d) sulfadimethoxine, (e) sulfamethazine, (f) sulfamethoxazole, (g) sulfaquinoxaline, (h) sulfathiazole, and (i) trimethoprim.
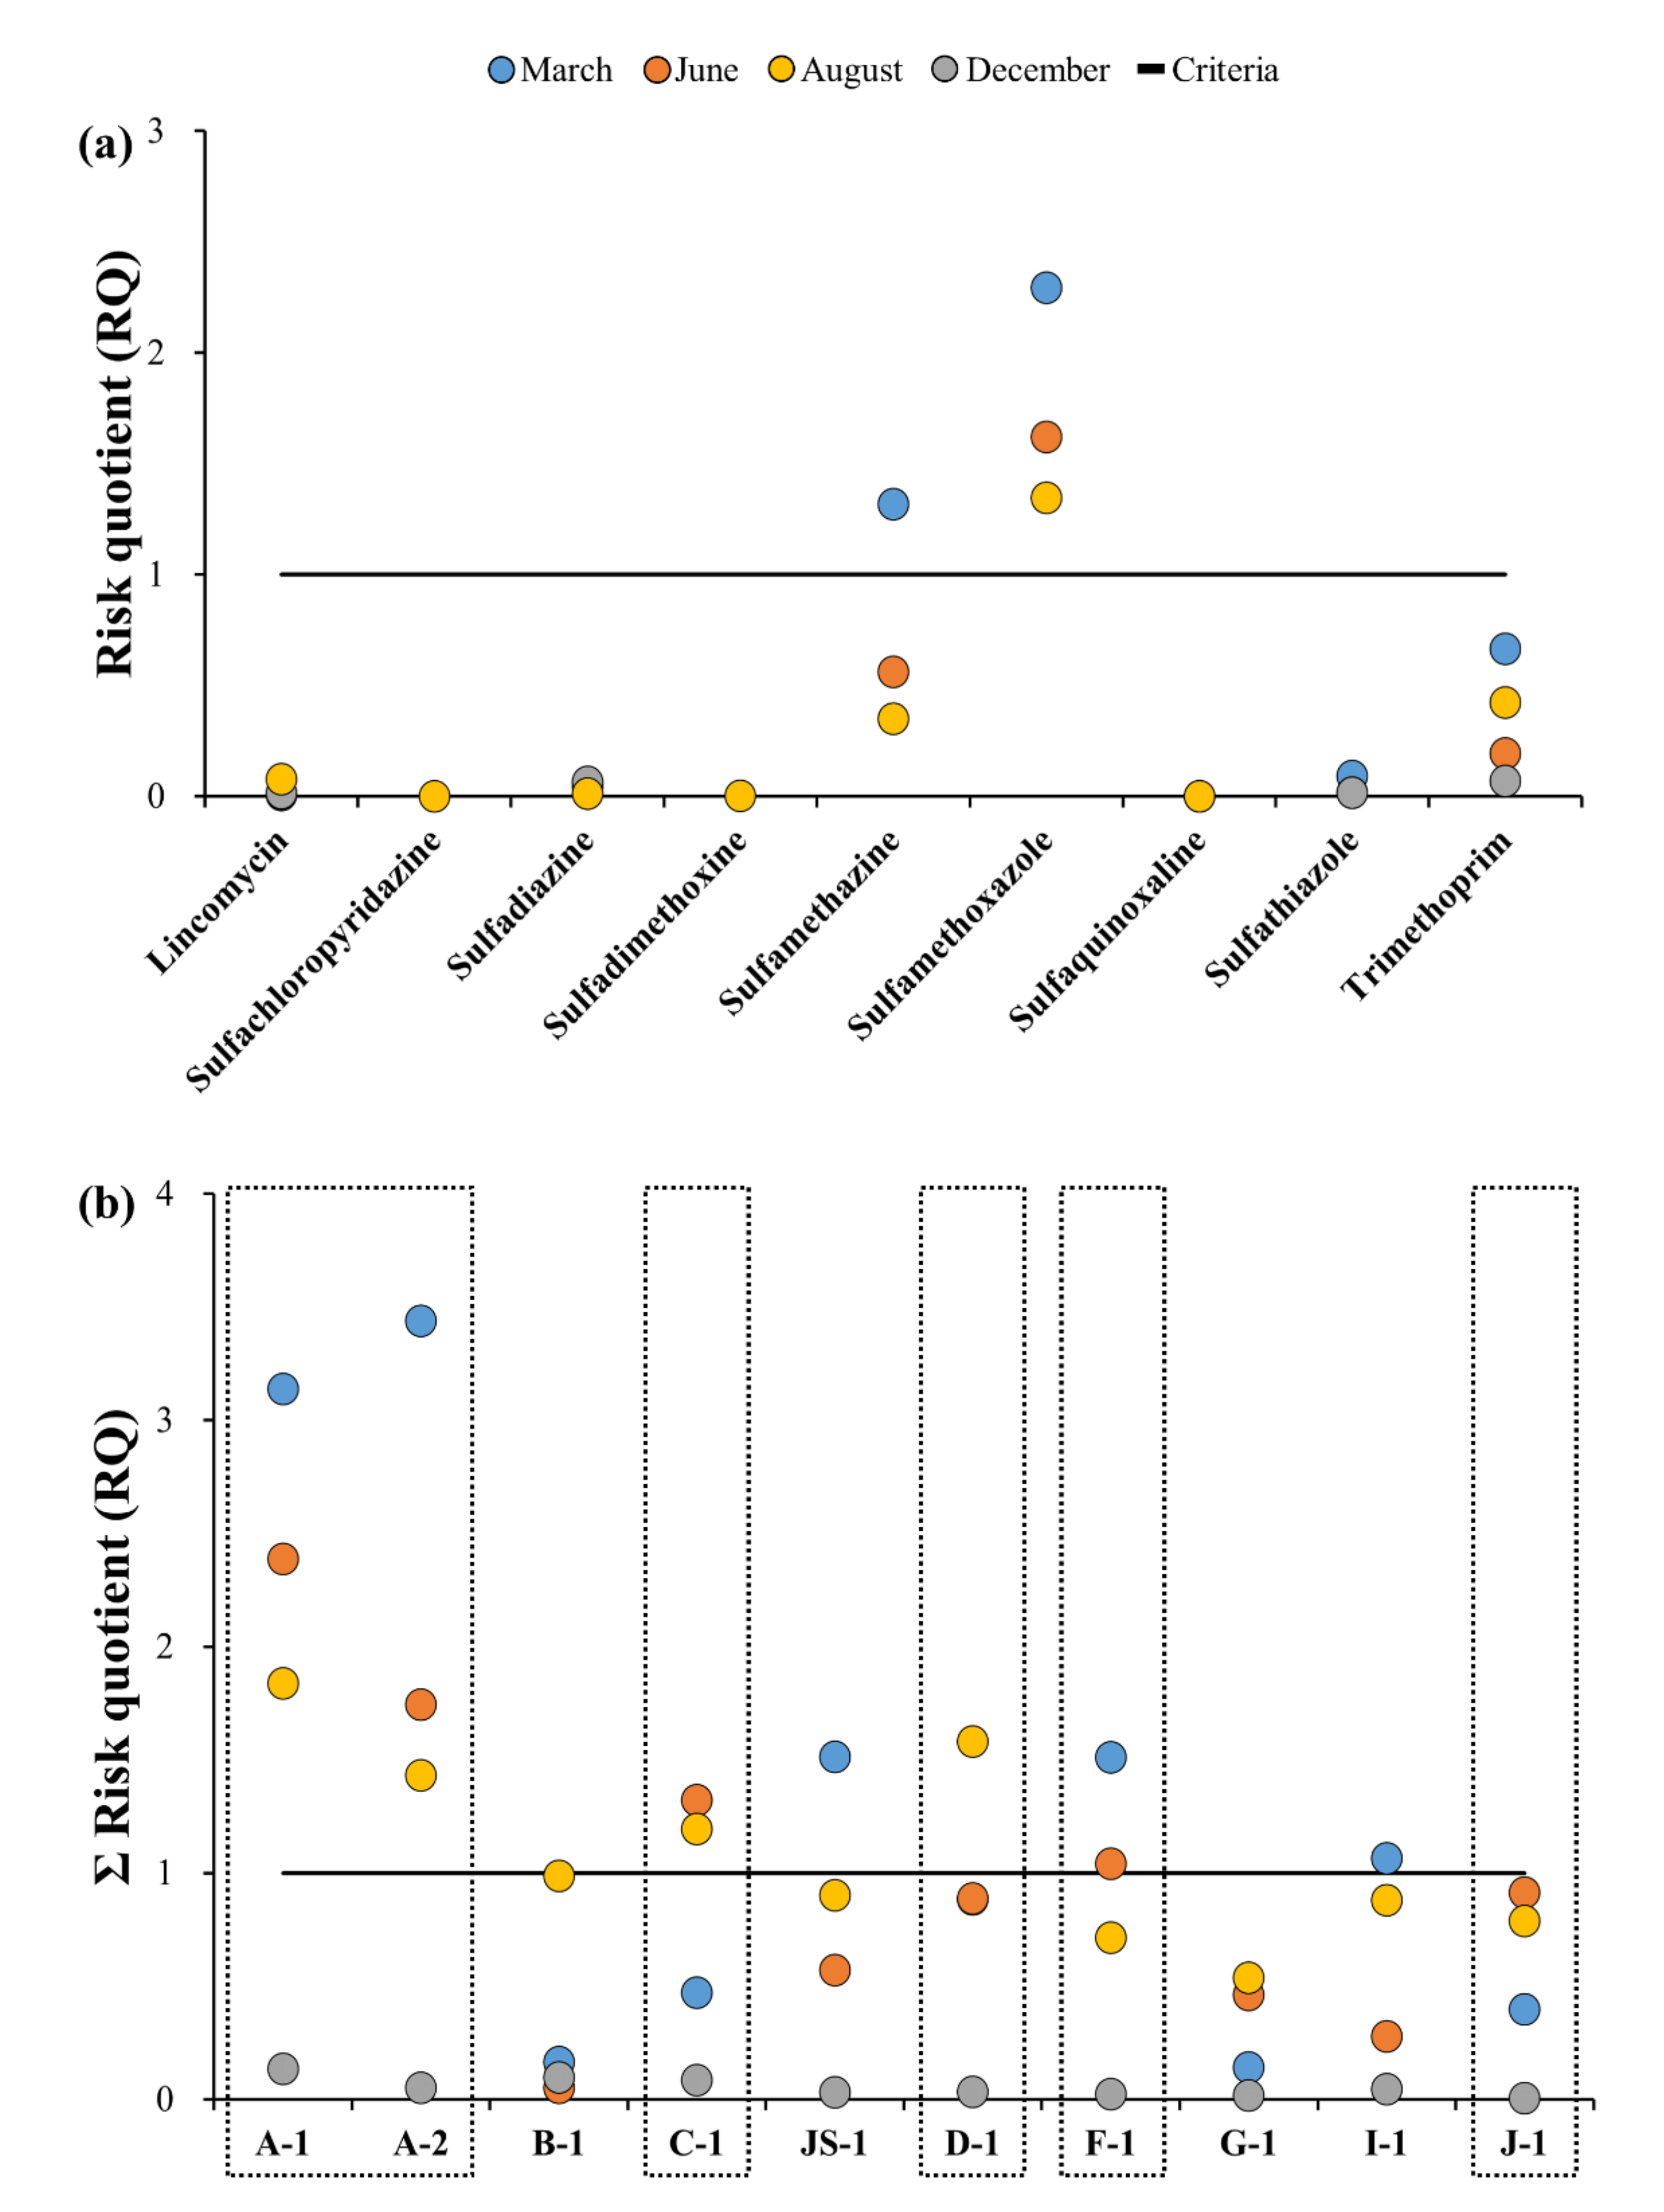
Figure A2.
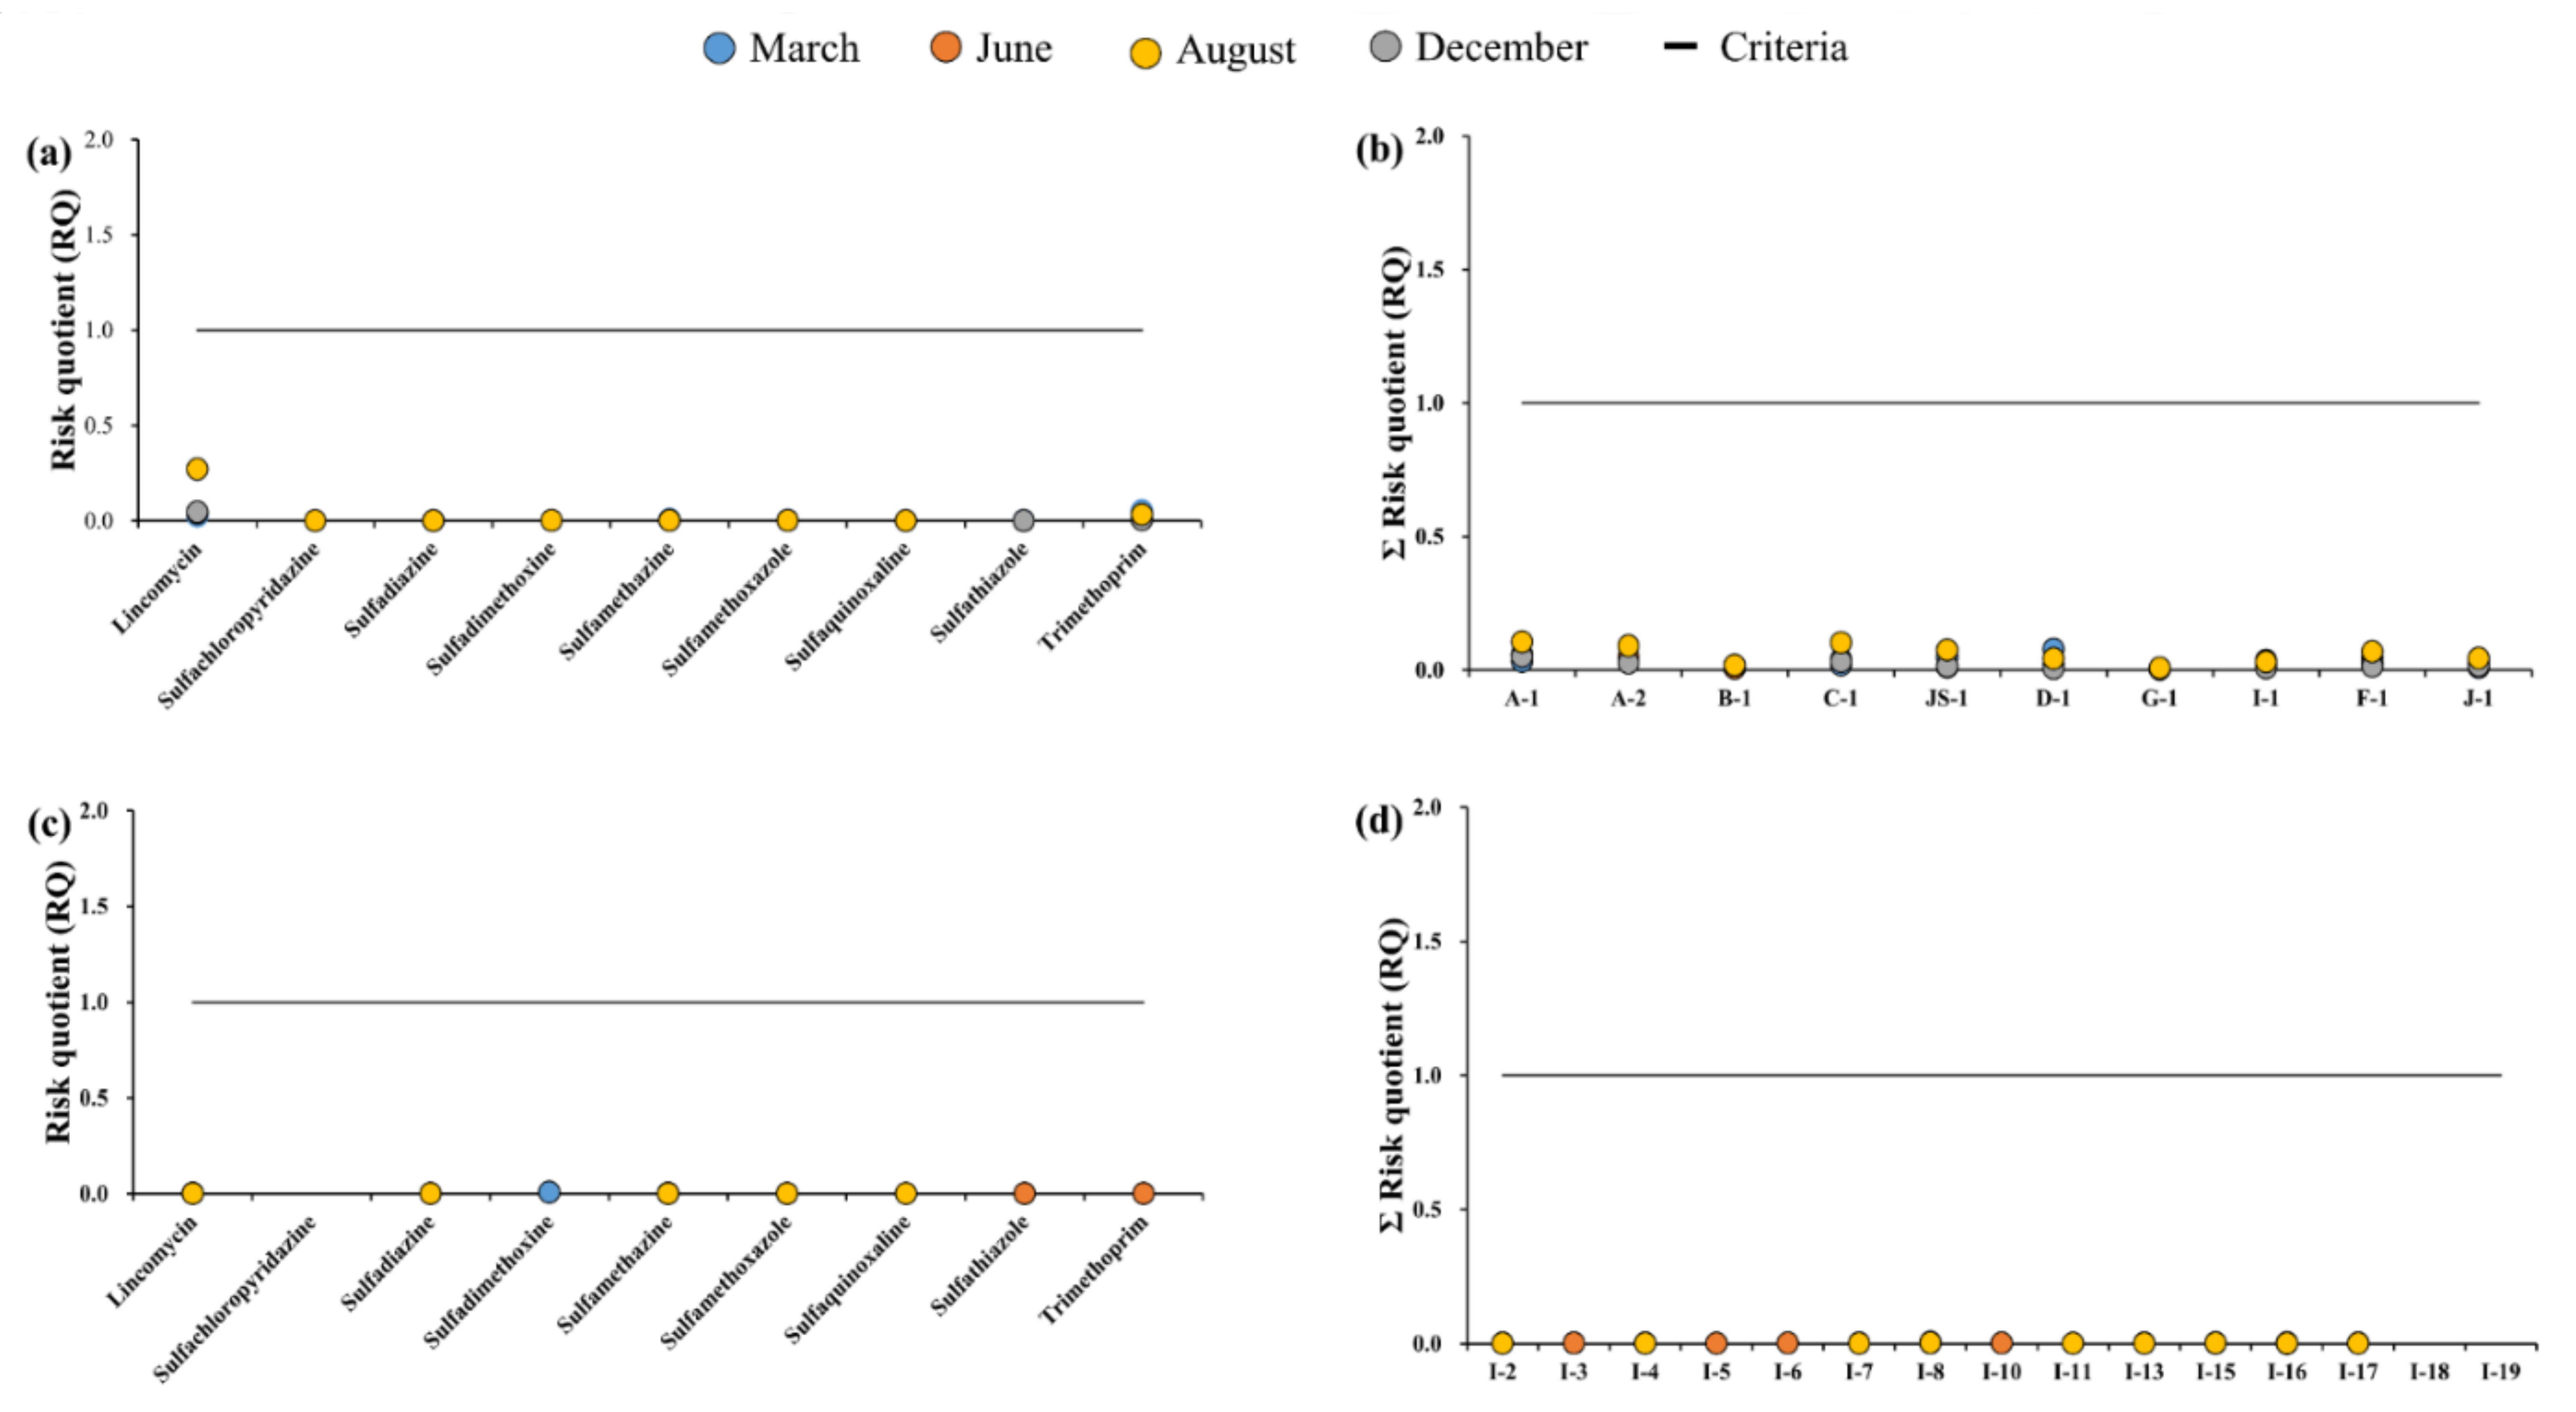
Risk assessment of antibiotic resistance by sampling time for surface water samples: (a) target antibiotics, and (b) sampling points; assessment for groundwater samples: (c) target antibiotics, and (d) sampling points.
Figure A2.
Risk assessment of antibiotic resistance by sampling time for surface water samples: (a) target antibiotics, and (b) sampling points; assessment for groundwater samples: (c) target antibiotics, and (d) sampling points.


 ,
, 


