The Correlation amongst Salty Taste Preference and Overactive Bladder Symptoms in Female Individuals


Abstract
1. Introduction
2. Methods
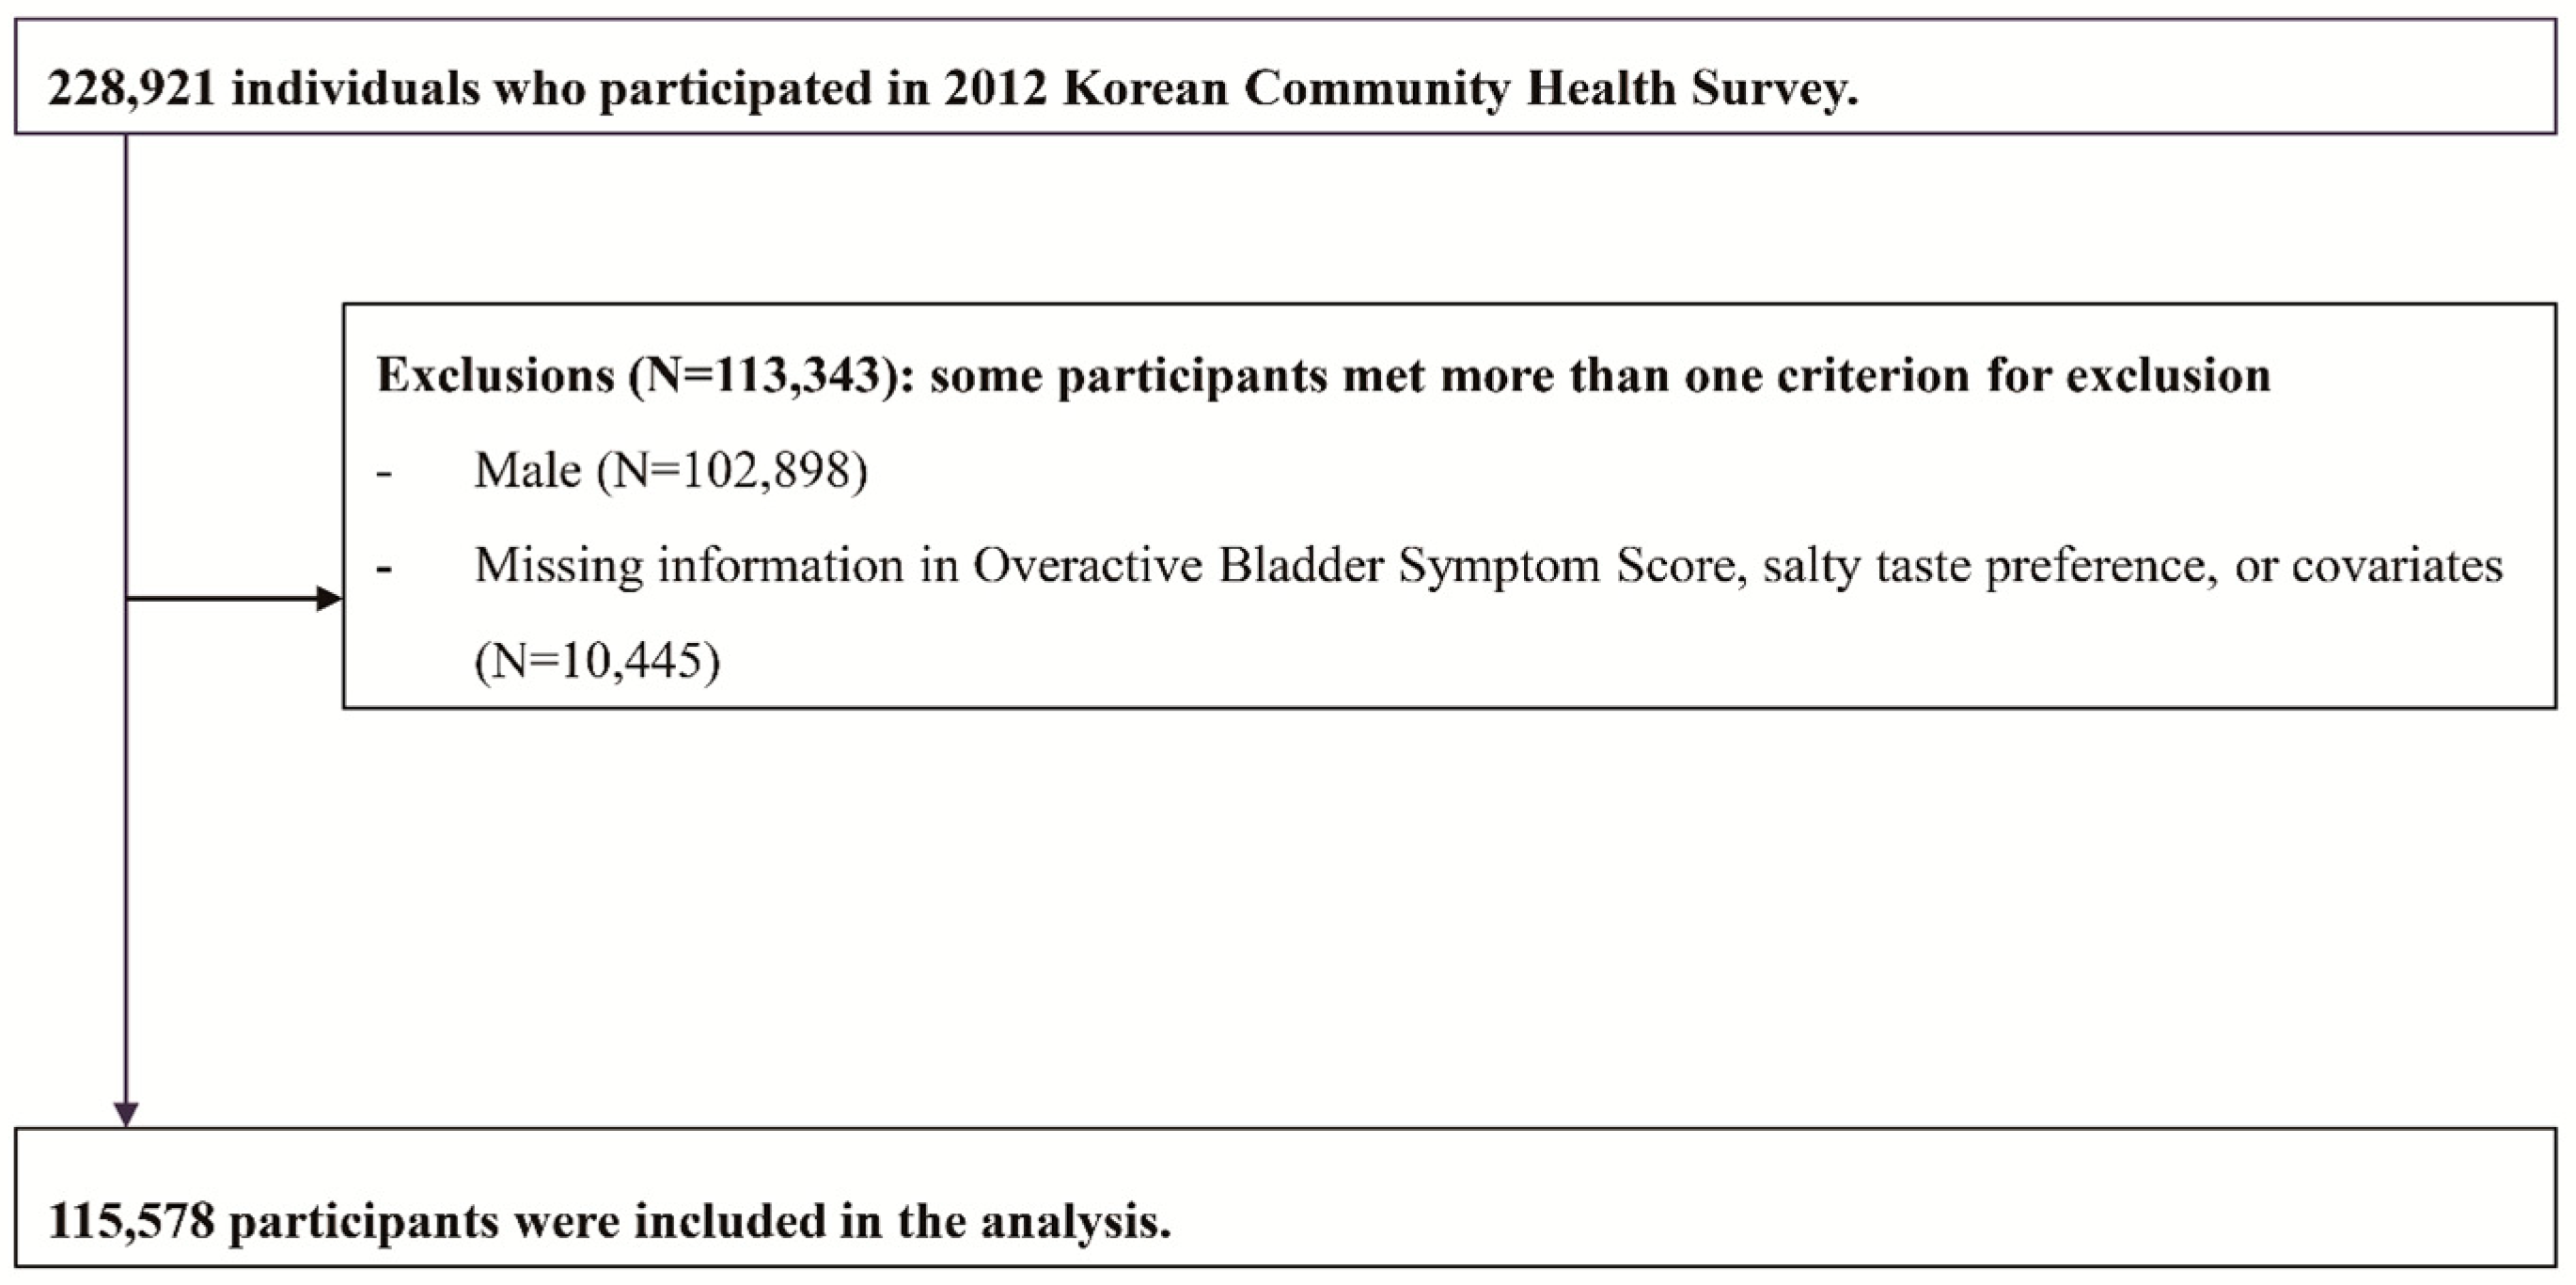
2.1. Data and Subjects
2.2. Measurements
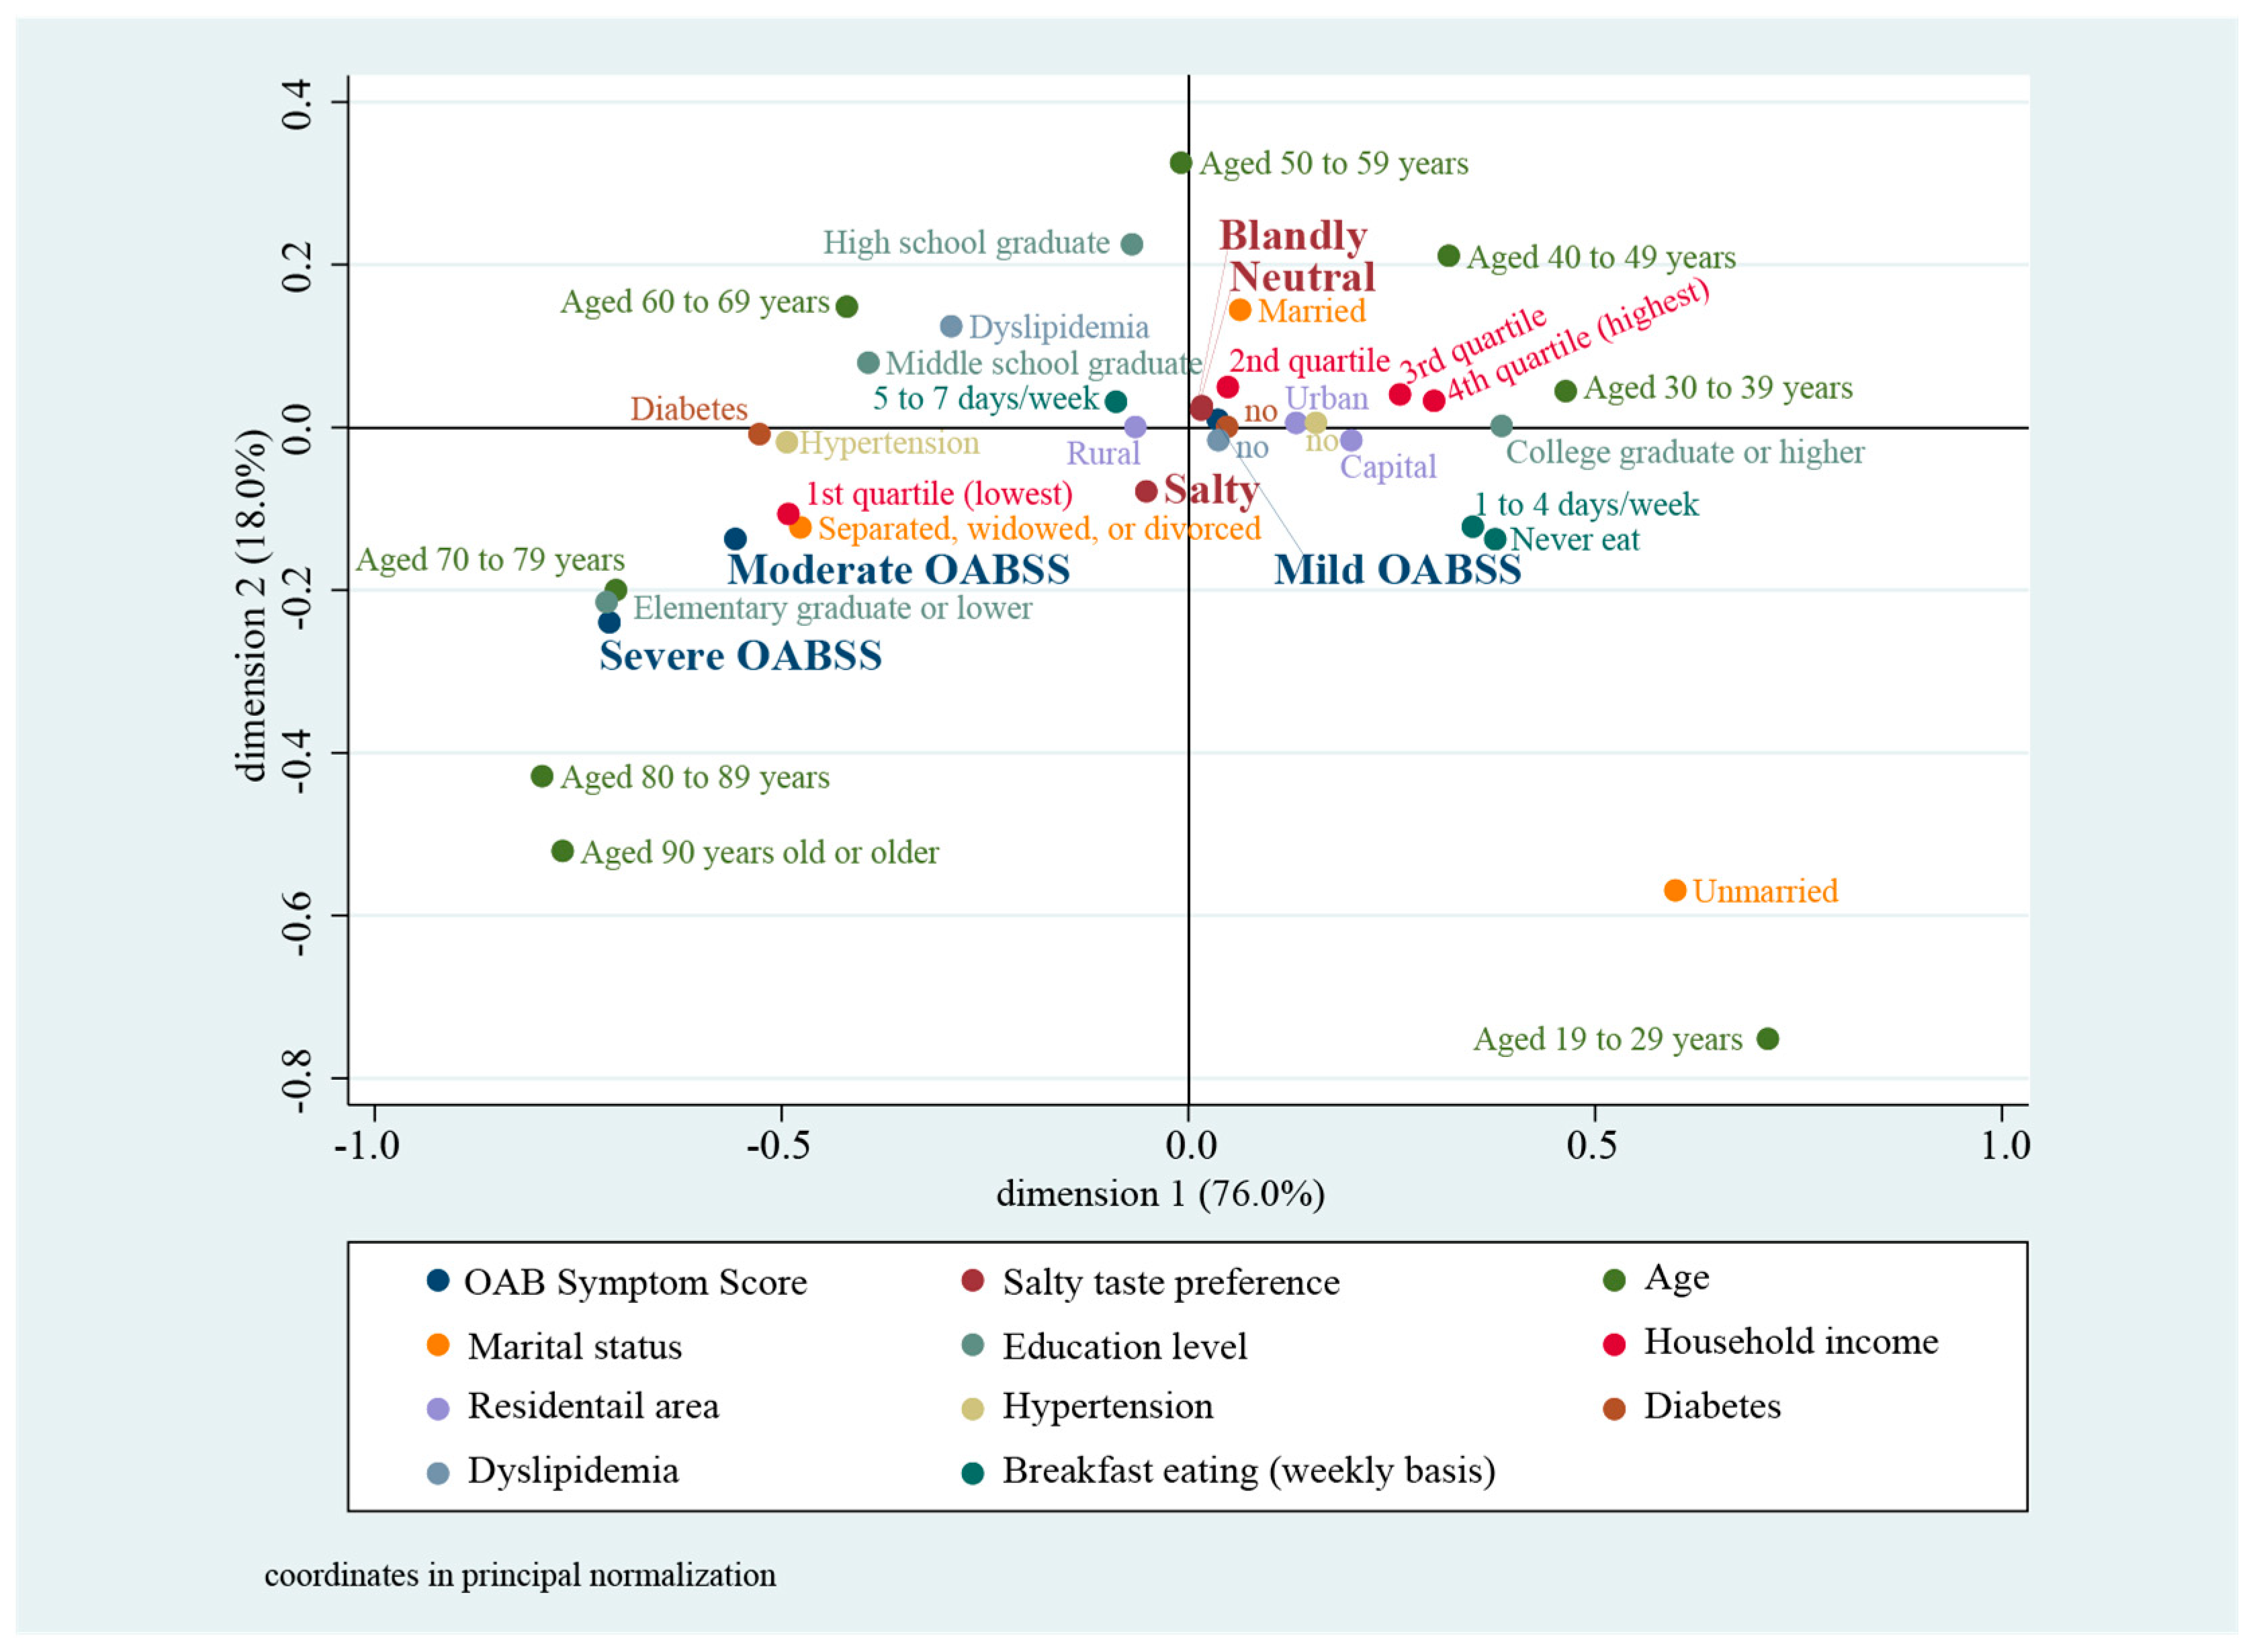
2.3. Statistical Analysis
2.4. Ethics Statement
3. Results
4. Discussion
5. Conclusions
Author Contributions
Funding
Institutional Review Board Statement
Informed Consent Statement
Data Availability Statement
Acknowledgments
Conflicts of Interest
References
- Liu, Z.M.; Wong, C.K.; Chan, D.; Tse, L.A.; Yip, B.; Wong, S.Y. Fruit and Vegetable Intake in Relation to Lower Urinary Tract Symptoms and Erectile Dysfunction Among Southern Chinese Elderly Men: A 4-Year Prospective Study of Mr OS Hong Kong. Medicine (Baltimore) 2016, 95, e2557. [Google Scholar] [CrossRef] [PubMed]
- Maserejian, N.N.; Giovannucci, E.L.; McKinlay, J.B. Dietary macronutrients, cholesterol, and sodium and lower urinary tract symptoms in men. Eur. Urol. 2009, 55, 1179–1189. [Google Scholar] [CrossRef] [PubMed]
- Sugaya, K.; Kadekawa, K.; Ikehara, A.; Nakayama, T.; Gakiya, M.; Nashiro, F.; Goya, M.; Hatano, T.; Ogawa, Y. Influence of hypertension on lower urinary tract symptoms in benign prostatic hyperplasia. Int. J. Urol. 2003, 10, 569–574. [Google Scholar] [CrossRef] [PubMed]
- Yamamoto, S.; Hotta, Y.; Maeda, K.; Kataoka, T.; Maeda, Y.; Hamakawa, T.; Shibata, Y.; Sasaki, S.; Ugawa, S.; Yasui, T.; et al. High salt loading induces urinary storage dysfunction via upregulation of epithelial sodium channel alpha in the bladder epithelium in Dahl salt-sensitive rats. J. Pharmacol. Sci. 2017, 135, 121–125. [Google Scholar] [CrossRef]
- Graudal, N.; Jurgens, G.; Baslund, B.; Alderman, M.H. Compared with usual sodium intake, low- and excessive-sodium diets are associated with increased mortality: A meta-analysis. Am. J. Hypertens. 2014, 27, 1129–1137. [Google Scholar] [CrossRef]
- O’Donnell, M.; Mente, A.; Rangarajan, S.; McQueen, M.J.; Wang, X.; Liu, L.; Yan, H.; Lee, S.F.; Mony, P.; Devanath, A.; et al. Urinary sodium and potassium excretion, mortality, and cardiovascular events. N. Engl. J. Med. 2014, 371, 612–623. [Google Scholar] [CrossRef]
- Yoshimura, K.; Terada, N.; Matsui, Y.; Terai, A.; Kinukawa, N.; Arai, Y. Prevalence of and risk factors for nocturia: Analysis of a health screening program. Int. J. Urol. 2004, 11, 282–287. [Google Scholar] [CrossRef]
- Ito, H.; Yoshiyasu, T.; Yamaguchi, O.; Yokoyama, O. Male Lower Urinary Tract Symptoms: Hypertension as a Risk Factor for Storage Symptoms, but Not Voiding Symptoms. Low. Urin. Tract Symptoms 2012, 4, 68–72. [Google Scholar] [CrossRef]
- Kurokawa, T.; Zha, X.; Ito, H.; Aoki, Y.; Akino, H.; Kobayashi, M.; Yokoyama, O. Underlying mechanisms of urine storage dysfunction in rats with salt-loading hypertension. Life Sci. 2015, 141, 8–12. [Google Scholar] [CrossRef]
- Wyss, J.M. Pathways by which dietary salt affects blood pressure and the nervous system. Hypertension 2006, 47, 638–639. [Google Scholar] [CrossRef]
- Tavani, A.; Longoni, E.; Bosetti, C.; Maso, L.D.; Polesel, J.; Montella, M.; Ramazzotti, V.; Negri, E.; Franceschi, S.; La Vecchia, C. Intake of selected micronutrients and the risk of surgically treated benign prostatic hyperplasia: A case-control study from Italy. Eur. Urol. 2006, 50, 549–554. [Google Scholar] [CrossRef] [PubMed]
- Noh, J.W.; Kim, K.B.; Kwon, Y.D.; Kim, J.H. Association between sodium intake and lower urinary tract symptoms: Does less sodium intake have a favorable effect or not? Transl. Androl. Urol. 2020, 9, 1135–1145. [Google Scholar] [CrossRef] [PubMed]
- Kang, Y.W.; Ko, Y.S.; Kim, Y.J.; Sung, K.M.; Kim, H.J.; Choi, H.Y.; Sung, C.; Jeong, E. Korea Community Health Survey Data Profiles. Osong Public Health Res. Perspect. 2015, 6, 211–217. [Google Scholar] [CrossRef] [PubMed]
- Jeong, S.J.; Homma, Y.; Oh, S.J. Korean version of the overactive bladder symptom score questionnaire: Translation and linguistic validation. Int. Neurourol. J. 2011, 15, 135–142. [Google Scholar] [CrossRef] [PubMed]
- Homma, Y.; Yoshida, M.; Seki, N.; Yokoyama, O.; Kakizaki, H.; Gotoh, M.; Yamanishi, T.; Yamaguchi, O.; Takeda, M.; Nishizawa, O. Symptom assessment tool for overactive bladder syndrome—Overactive bladder symptom score. Urology 2006, 68, 318–323. [Google Scholar] [CrossRef]
- Lim, S.; Shin, H.; Song, J.H.; Kwak, S.H.; Kang, S.M.; Won Yoon, J.; Choi, S.H.; Cho, S.I.; Park, K.S.; Lee, H.K.; et al. Increasing prevalence of metabolic syndrome in Korea: The Korean National Health and Nutrition Examination Survey for 1998–2007. Diabetes Care 2011, 34, 1323–1328. [Google Scholar] [CrossRef]
- Sourial, N.; Wolfson, C.; Zhu, B.; Quail, J.; Fletcher, J.; Karunananthan, S.; Bandeen-Roche, K.; Béland, F.; Bergman, H. Correspondence analysis is a useful tool to uncover the relationships among categorical variables. J. Clin. Epidemiol. 2010, 63, 638–646. [Google Scholar] [CrossRef]
- Higgs, N. Practical and innovative uses of correspondence analysis. J. R. Stat. Soc. Ser. D (Stat.) 1991, 40, 183–194. [Google Scholar] [CrossRef]
- Graudal, N.A.; Hubeck-Graudal, T.; Jurgens, G. Effects of low sodium diet versus high sodium diet on blood pressure, renin, aldosterone, catecholamines, cholesterol, and triglyceride. Cochrane Database Syst. Rev. 2017, 4, CD004022. [Google Scholar] [CrossRef]
- Nerbass, F.B.; Pecoits-Filho, R.; McIntyre, N.J.; McIntyre, C.W.; Taal, M.W. High sodium intake is associated with important risk factors in a large cohort of chronic kidney disease patients. Eur. J. Clin. Nutr. 2015, 69, 786–790. [Google Scholar] [CrossRef]
- Matsuo, T.; Miyata, Y.; Sakai, H. Effect of salt intake reduction on nocturia in patients with excessive salt intake. Neurourol. Urodyn. 2019, 38, 927–933. [Google Scholar] [CrossRef] [PubMed]
- Gonzalez, E.J.; Merrill, L.; Vizzard, M.A. Bladder sensory physiology: Neuroactive compounds and receptors, sensory transducers, and target-derived growth factors as targets to improve function. Am. J. Physiol. Regul. Integr. Comp. Physiol. 2014, 306, R869–R878. [Google Scholar] [CrossRef] [PubMed]
- Araki, I.; Du, S.; Kamiyama, M.; Mikami, Y.; Matsushita, K.; Komuro, M.; Furuya, Y.; Takeda, M. Overexpression of epithelial sodium channels in epithelium of human urinary bladder with outlet obstruction. Urology 2004, 64, 1255–1260. [Google Scholar] [CrossRef] [PubMed]
- Kim, J.H.; Sun, H.Y.; Park, S.Y.; Soh, M.J.; Kim, Y.J.; Song, Y.S. Association between obesity and lower urinary tract symptoms: Propensity score matching study between healthy controls and obese patients seeking bariatric surgery. Surg. Obes Relat. Dis. 2016, 12, 1585–1593. [Google Scholar] [CrossRef] [PubMed]
- Shim, E.; Yang, Y.J.; Yang, Y.K. Relationship between thresholds and self-assessed preference for saltiness and sodium intake in young women. J. Nutr. Health 2016, 49, 88–98. [Google Scholar] [CrossRef]
- Kim, T.H.; Kim, Y.H.; Bae, N.Y.; Kang, S.S.; Lee, J.B.; Kim, S.B. Salty taste thresholds and preference in patients with chronic kidney disease according to disease stage: A cross-sectional study. Nutr. Diet. 2018, 75, 59–64. [Google Scholar] [CrossRef]
- Boer, T.A.; Salvatore, S.; Cardozo, L.; Chapple, C.; Kelleher, C.; van Kerrebroeck, P.; Kirby, M.G.; Koelbl, H.; Espuna-Pons, M.; Milsom, I.; et al. Pelvic organ prolapse and overactive bladder. Neurourol. Urodyn. 2010, 29, 30–39. [Google Scholar] [CrossRef]


| Variable | Subcategory | Salty Taste Preference | Total | Test Statistic | p-Value | |||||
|---|---|---|---|---|---|---|---|---|---|---|
| Neutral | Blandly | Salty | ||||||||
| (n = 60,533) | (n = 27,292) | (n = 27,753) | ||||||||
| n | Proportion | n | Proportion | n | Proportion | n | ||||
| Age | 19–29 | 6017 | 47.6 | 2618 | 20.7 | 4002 | 31.7 | 12,637 | 73.361 | <0.001 |
| 30–39 | 9511 | 53 | 4625 | 25.8 | 3815 | 21.3 | 17,951 | |||
| 40–49 | 12,206 | 56.3 | 5307 | 24.5 | 4180 | 19.3 | 21,693 | |||
| 50–59 | 12,443 | 55.3 | 5647 | 25.1 | 4392 | 19.5 | 22,482 | |||
| 60–69 | 9465 | 51.9 | 3945 | 21.6 | 4833 | 26.5 | 18,243 | |||
| 70–79 | 8101 | 48.6 | 3695 | 22.2 | 4875 | 29.2 | 16,671 | |||
| 80–89 | 2555 | 47.4 | 1325 | 24.6 | 1515 | 28.1 | 5395 | |||
| 90 or higher | 235 | 46.4 | 130 | 25.7 | 141 | 27.9 | 506 | |||
| Marital Status | Married | 40,945 | 54.3 | 18,119 | 24 | 16,318 | 21.6 | 75,382 | 151.429 | <0.001 |
| Separated, divorced, widowed | 13,138 | 49 | 6330 | 23.6 | 7359 | 27.4 | 26,827 | |||
| Unmarried | 6450 | 48.2 | 2843 | 21.3 | 4076 | 30.5 | 13,369 | |||
| Education Level | Elementary graduate or lower | 10,072 | 47.9 | 4370 | 20.8 | 6589 | 31.3 | 21,031 | 75.288 | <0.001 |
| Middle school graduate | 10,716 | 53 | 4170 | 20.6 | 5326 | 26.4 | 20,212 | |||
| High school graduate | 6865 | 55.4 | 2816 | 22.7 | 2709 | 21.9 | 12,390 | |||
| College graduate or higher | 32,880 | 53.1 | 15,936 | 25.7 | 13,129 | 21.2 | 61,945 | |||
| Household income | 1st Quartile (lowest) | 16,326 | 50.2 | 7263 | 22.3 | 8944 | 27.5 | 32,533 | 22.796 | <0.001 |
| 2nd Quartile | 16,770 | 53.1 | 7343 | 23.3 | 7452 | 23.6 | 31,565 | |||
| 3rd Quartile | 13,920 | 54 | 6107 | 23.7 | 5731 | 22.2 | 25,758 | |||
| 4th Quartile (highest) | 13,517 | 52.6 | 6579 | 25.6 | 5626 | 21.9 | 25,722 | |||
| Residential area | Capital | 5882 | 51.8 | 2887 | 25.4 | 2597 | 22.8 | 11,366 | 2.617 | 0.035 |
| Urban | 11,789 | 51.6 | 5606 | 24.5 | 5450 | 23.9 | 22,845 | |||
| Rural | 42,862 | 52.7 | 18,799 | 23.1 | 19,706 | 24.2 | 81,367 | |||
| Hypertension | No | 46,748 | 53.3 | 20,789 | 23.7 | 20,155 | 23 | 87,692 | 37.078 | <0.001 |
| Yes | 13,785 | 49.4 | 6503 | 23.3 | 7598 | 27.2 | 27,886 | |||
| Diabetes | No | 55,878 | 52.7 | 24,833 | 23.4 | 25,318 | 23.9 | 106,029 | 11.9 | <0.001 |
| Yes | 4655 | 48.7 | 2459 | 25.8 | 2435 | 25.5 | 9549 | |||
| Dyslipidemia | No | 54,013 | 52.6 | 24,233 | 23.6 | 24,396 | 23.8 | 102,642 | 4.452 | 0.012 |
| Yes | 6520 | 50.4 | 3059 | 23.6 | 3357 | 26 | 12,936 | |||
| Breakfast eating (weekly) | 5–7 days | 48,928 | 52.8 | 22,685 | 24.5 | 21,140 | 22.8 | 92,753 | 122.33 | <0.001 |
| 1–4 days | 6813 | 52.1 | 2618 | 20 | 3642 | 27.9 | 13,073 | |||
| Never | 4792 | 49.1 | 1989 | 20.4 | 2971 | 30.5 | 9752 | |||
| OABSS—daytime frequency | ≤7 | 47,237 | 53.3 | 20,644 | 23.3 | 20,700 | 23.4 | 88,581 | 20.352 | <0.001 |
| 8~14 | 12,589 | 49.7 | 6223 | 24.6 | 6534 | 25.8 | 25,346 | |||
| ≥15 | 707 | 42.8 | 425 | 25.7 | 519 | 31.4 | 1651 | |||
| OABSS—nighttime frequency) | 0 | 26,636 | 53.8 | 12,218 | 24.7 | 10,672 | 21.5 | 49,526 | 33.066 | <0.001 |
| 1 | 20,560 | 53.4 | 8856 | 23 | 9099 | 23.6 | 38,515 | |||
| 2 | 8227 | 49.8 | 3753 | 22.7 | 4536 | 27.5 | 16,516 | |||
| ≥3 | 5110 | 46.4 | 2465 | 22.4 | 3446 | 31.3 | 11,021 | |||
| OABSS—urgency | None | 51,924 | 53.2 | 23,187 | 23.8 | 22,403 | 23 | 97,514 | 24.416 | <0.001 |
| Less than once a week | 4702 | 49.8 | 2081 | 22 | 2655 | 28.1 | 9438 | |||
| Once a week or more | 1895 | 46.8 | 910 | 22.5 | 1244 | 30.7 | 4049 | |||
| About once a day | 955 | 46.2 | 486 | 23.5 | 626 | 30.3 | 2067 | |||
| 2–4 times a day | 687 | 41.5 | 403 | 24.4 | 564 | 34.1 | 1654 | |||
| 5 times a day or more | 370 | 43.2 | 225 | 26.3 | 261 | 30.5 | 856 | |||
| OABSS—urge incontinence | None | 55,147 | 53 | 24,653 | 23.7 | 24,319 | 23.4 | 104,119 | 15.789 | <0.001 |
| Less than once a week | 3052 | 49 | 1402 | 22.5 | 1772 | 28.5 | 6226 | |||
| Once a week or more | 1186 | 46.3 | 577 | 22.5 | 801 | 31.2 | 2564 | |||
| About once a day | 575 | 43.7 | 305 | 23.2 | 435 | 33.1 | 1315 | |||
| 2–4 times a day | 400 | 41.5 | 258 | 26.8 | 305 | 31.7 | 963 | |||
| 5 times a day or more | 173 | 44.2 | 97 | 24.8 | 121 | 30.9 | 391 | |||
| OAB severity | Mild | 57,529 | 52.9 | 25,655 | 23.6 | 25,585 | 23.5 | 108,769 | 33.409 | <0.001 |
| Moderate | 2645 | 44.5 | 1412 | 23.8 | 1883 | 31.7 | 5940 | |||
| Severe | 359 | 41.3 | 225 | 25.9 | 285 | 32.8 | 869 | |||
| Salty Taste Preference | Overactive Bladder Symptom Score (Score Range = 0 to 15) | |||||||||
|---|---|---|---|---|---|---|---|---|---|---|
| Age-Adjusted | Multivariable Adjusted | |||||||||
| IRR | Linearized SE | p-Value | 95% CI | IRR | Linearized | p-Value | 95% CI | |||
| SE | ||||||||||
| Neutral | (Ref) | (Ref) | ||||||||
| Blandly | 1.065 | 0.013 | <0.001 | 1.039 | 1.092 | 1.071 | 0.013 | <0.001 | 1.045 | 1.097 |
| Salty | 1.236 | 0.012 | <0.001 | 1.207 | 1.267 | 1.205 | 0.015 | <0.001 | 1.177 | 1.234 |
Publisher’s Note: MDPI stays neutral with regard to jurisdictional claims in published maps and institutional affiliations. |
© 2021 by the authors. Licensee MDPI, Basel, Switzerland. This article is an open access article distributed under the terms and conditions of the Creative Commons Attribution (CC BY) license (http://creativecommons.org/licenses/by/4.0/).
Share and Cite
Noh, J.-W.; Kim, K.-B.; Kim, J.H.; Kwon, Y.D. The Correlation amongst Salty Taste Preference and Overactive Bladder Symptoms in Female Individuals. Int. J. Environ. Res. Public Health 2021, 18, 518. https://doi.org/10.3390/ijerph18020518
Noh J-W, Kim K-B, Kim JH, Kwon YD. The Correlation amongst Salty Taste Preference and Overactive Bladder Symptoms in Female Individuals. International Journal of Environmental Research and Public Health. 2021; 18(2):518. https://doi.org/10.3390/ijerph18020518
Chicago/Turabian StyleNoh, Jin-Won, Kyoung-Beom Kim, Jae Heon Kim, and Young Dae Kwon. 2021. "The Correlation amongst Salty Taste Preference and Overactive Bladder Symptoms in Female Individuals" International Journal of Environmental Research and Public Health 18, no. 2: 518. https://doi.org/10.3390/ijerph18020518
APA StyleNoh, J.-W., Kim, K.-B., Kim, J. H., & Kwon, Y. D. (2021). The Correlation amongst Salty Taste Preference and Overactive Bladder Symptoms in Female Individuals. International Journal of Environmental Research and Public Health, 18(2), 518. https://doi.org/10.3390/ijerph18020518