
The First Random Observational Survey of Barrier Gestures against COVID-19

 ,
,  , ,
, , 
Abstract
:1. Introduction
2. Materials and Methods
2.1. Survey Methodology
2.2. Data Analysis
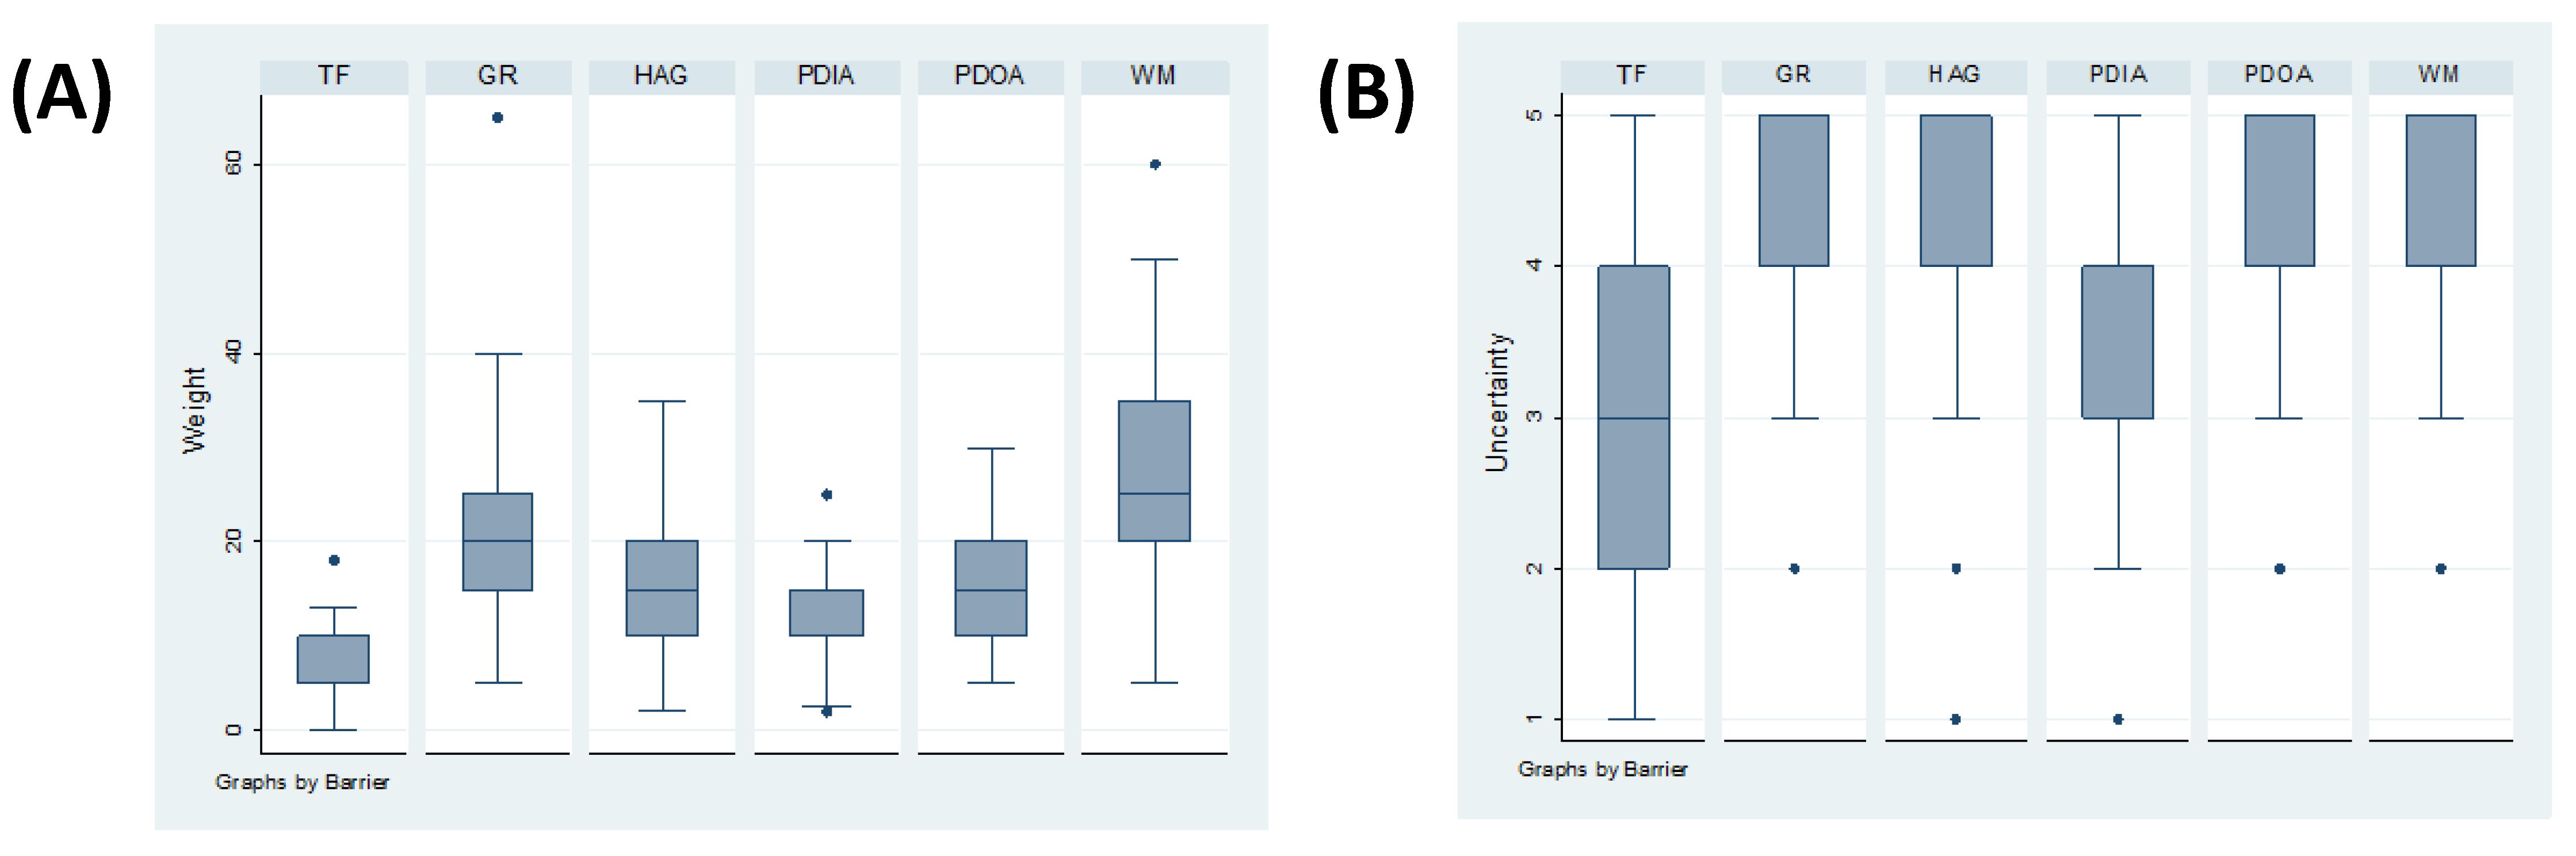
2.3. Expert Elicitation of Knowledge and Weighting System
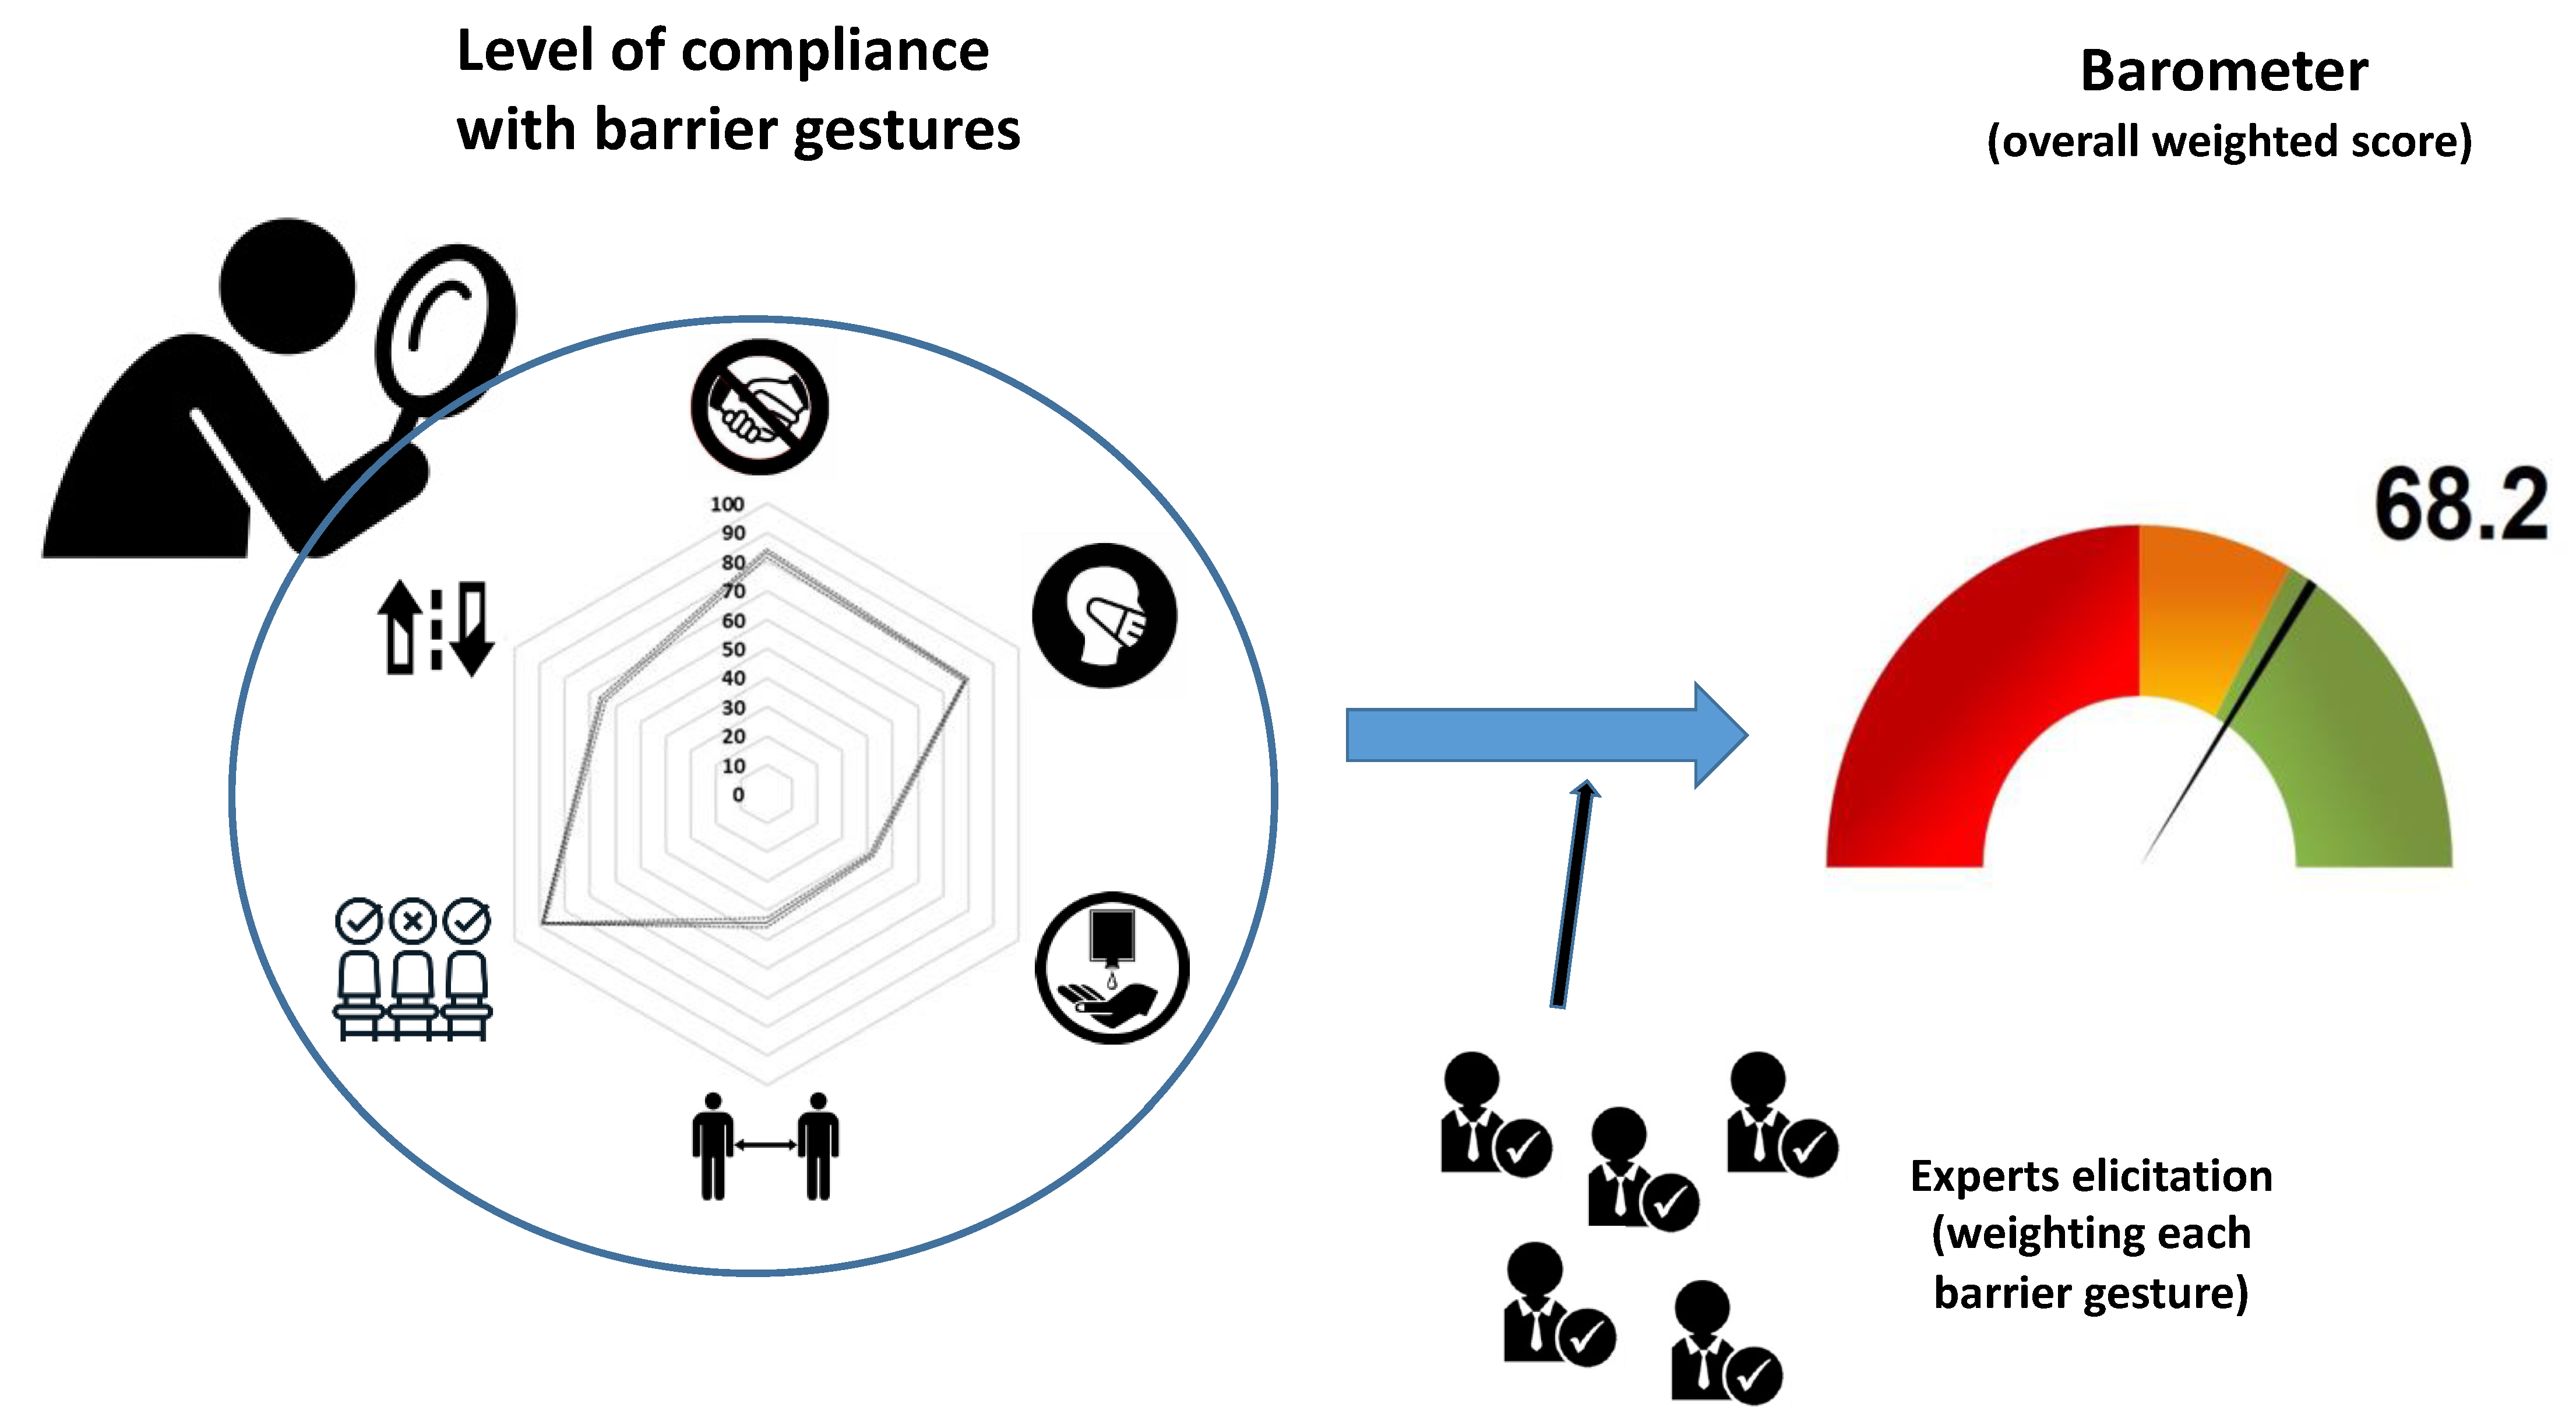
2.4. Calculation of an Overall Weighted Score and Visualisation as a Barometer
2.5. Sensitivity Analysis
3. Results
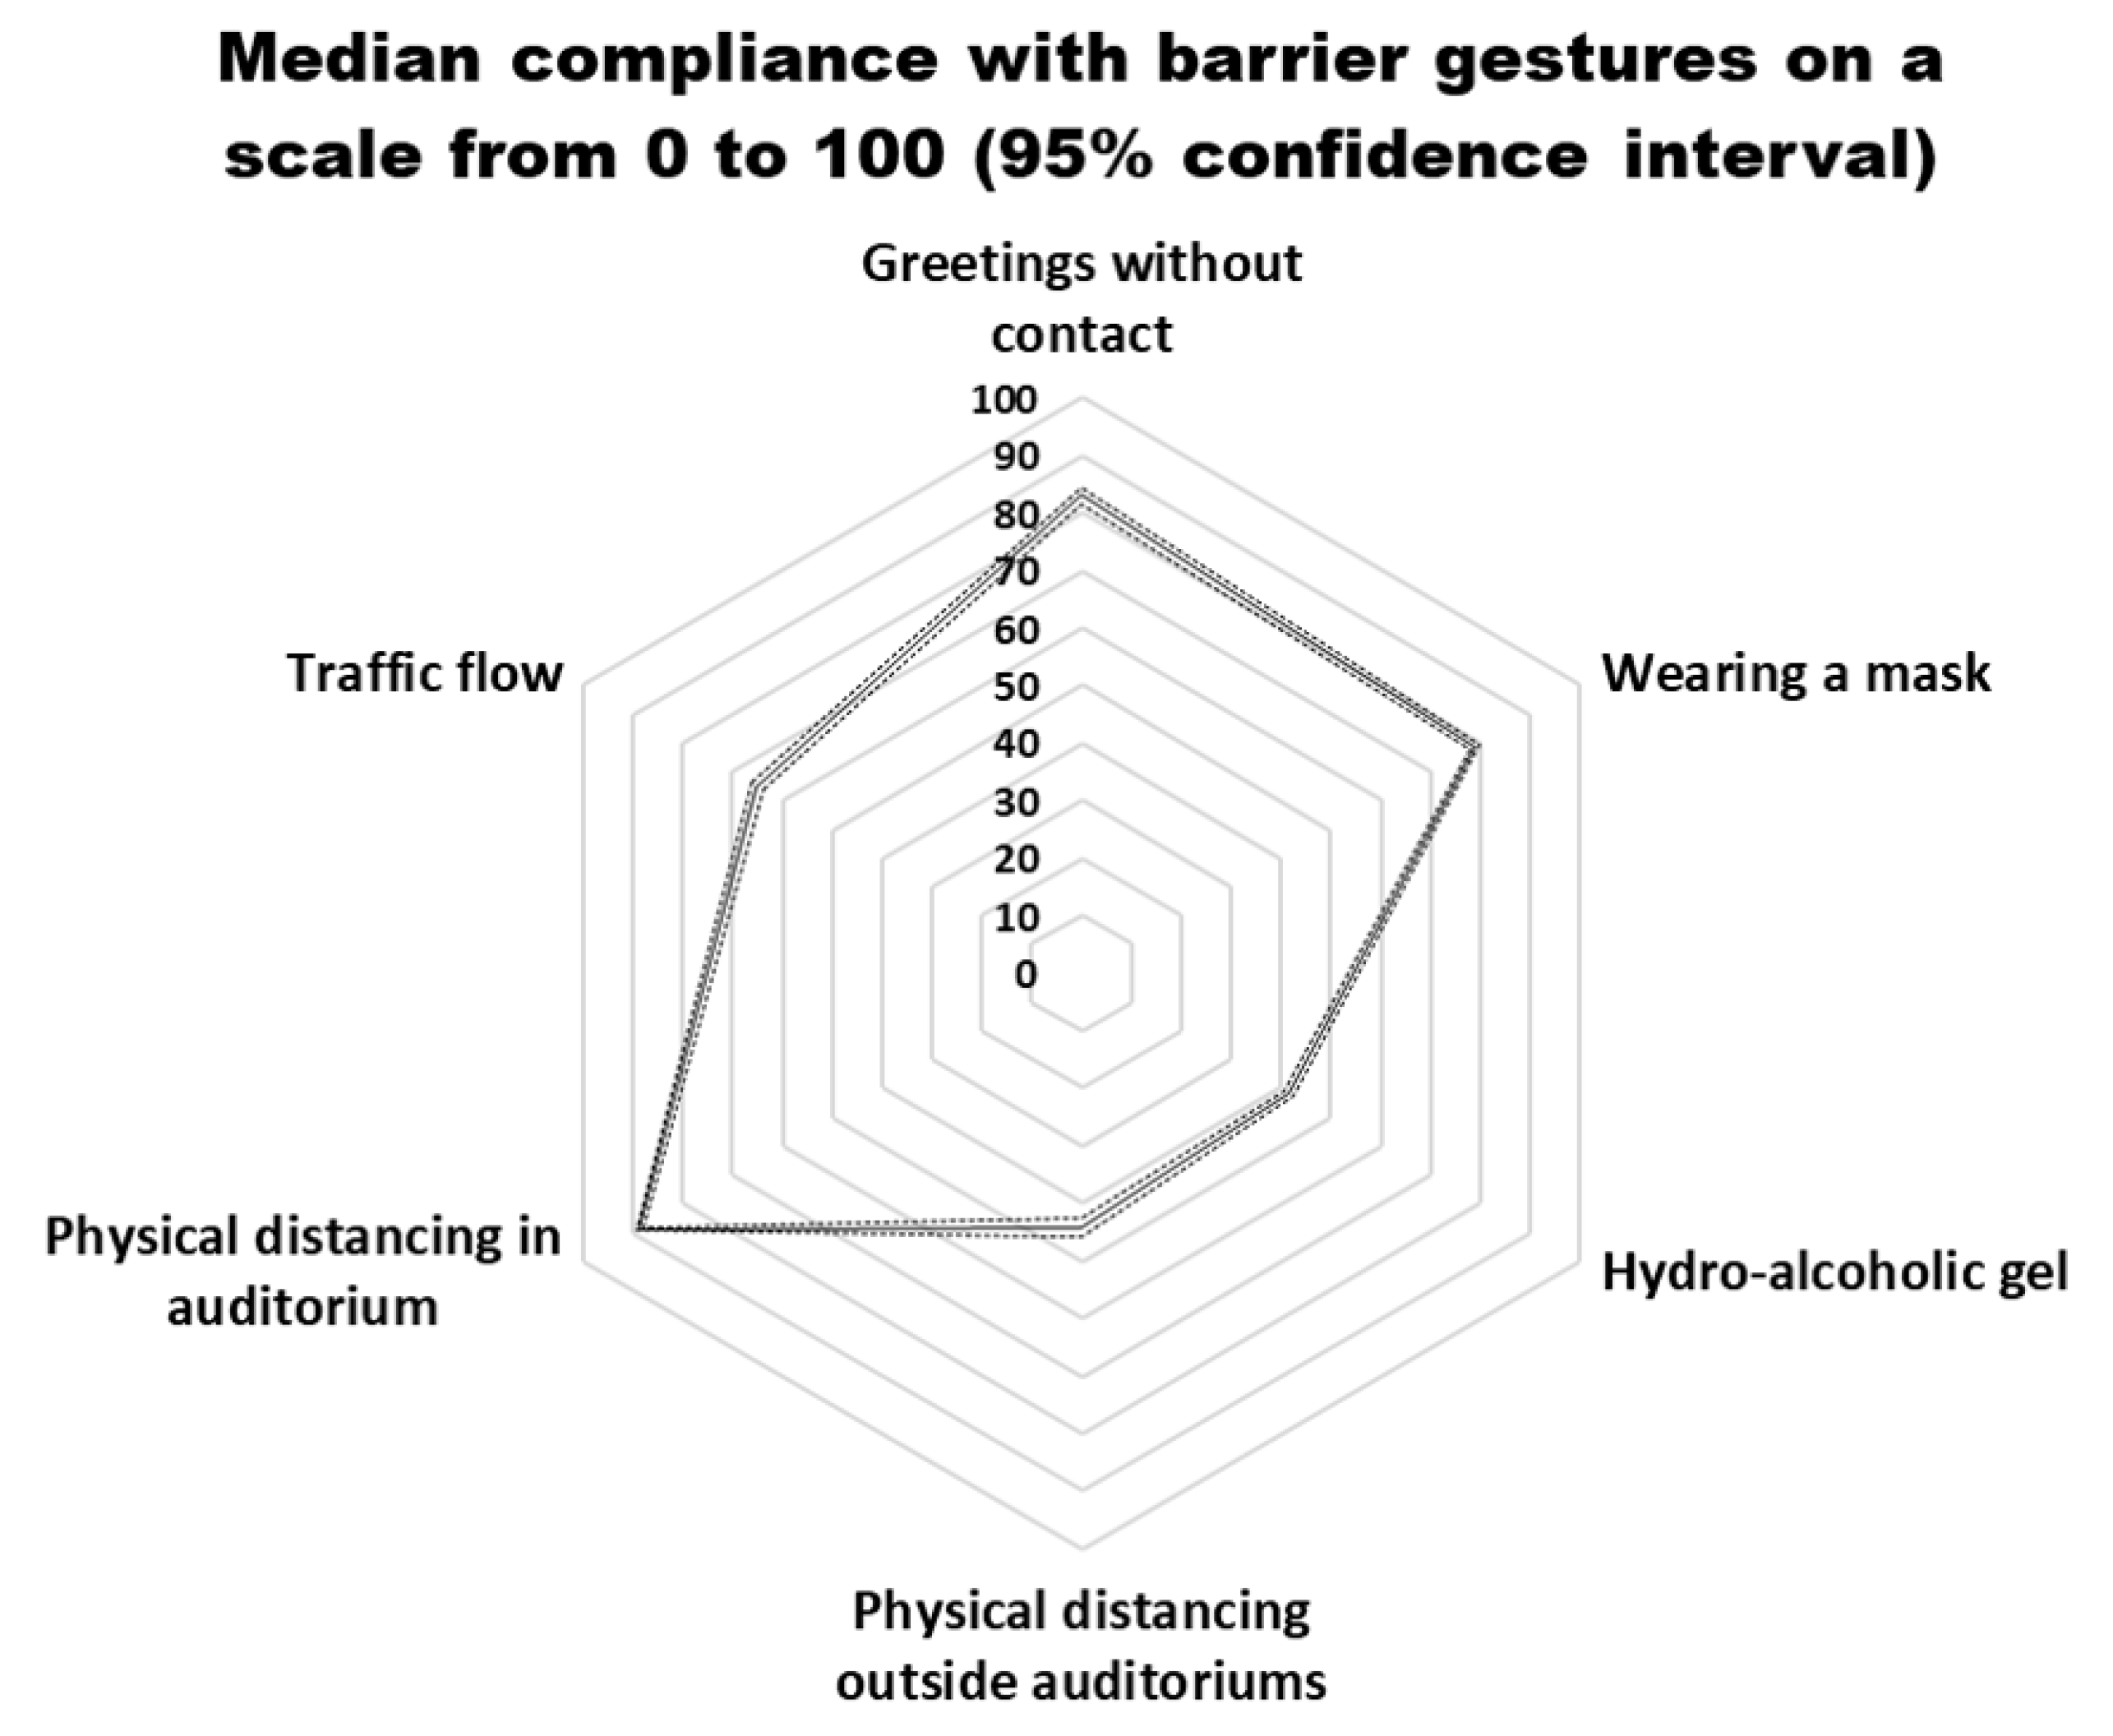
3.1. Compliance with Barrier Gestures
3.2. Calculation of an Overall Weighted Score and Translation as a Barometer
3.3. Sensitivity Analysis
4. Discussion
5. Conclusions
Author Contributions
Funding
Institutional Review Board Statement
Informed Consent Statement
Data Availability Statement
Acknowledgments
Conflicts of Interest
Appendix A

| Green | Yellow | Orange | Red | |
|---|---|---|---|---|
| Risk level | No risk | Low risk | Moderate risk | High risk |
| Interpretation of risk level | Vaccine available and/or herd immunity. Contact may occur. Hand hygiene is still necessary | Limited spread of the virus. Contact is limited, but may occur depending on security conditions | Systematic transmission of the virus. Contacts are limited to the essentials and take place when risk factors are under control | Systematic transmission of the virus, contact is to be avoided as much as possible |
| Occupancy of the premises | Premises open and all services operational | Premises open Limitation to 75% of the maximum number of students possible Services ensured by respecting all hygienic measures | Premises open Limitation to 20% of the maximum number of students possible Services ensured by respecting all hygenic measures | Premises open with minimal services provided |
| Teaching and evaluation activites | Face-to-face activities possible | Face-to-face and distance-learning | Distance learning to be organised whenever possible | Distance learning only |
| Group size ≤ 50 | No restriction | Physical distancing of 1 m. Mandatory mask wearing | Forbidden | |
| Groups of 521–200 | No restriction | Face covering and physical distancing of 1 m or occupation of 1 every 2 seats Professor without mask if a physical distance of 3 m is maintained | Face covering Occupation of 1 every 5 seats Professor without mask if a physical distance of 3 m is maintained | Forbidden |
| Groups > 201 | No restriction | Face covering and physical distancing of 1 m or occupation of 1 every 2 seats Professor without mask if a physical distance of 3 m is maintained | Forbidden | Forbidden |
| Movements | Free | Unique traffic flow designated with arrows Mandatory mask wearing | ||
| Restaurants | Free | Opened with physical distancing of 1.50 m. and outside settings to be prioritised Mandatory mask before and after eating | Not accessible | |
| Nr | Gender | Country | Year of Activity | Main Expertise |
|---|---|---|---|---|
| 1 | Female | Belgium | 16 | Biosecurity |
| 2 | Male | France | 25 | Virology |
| 3 | Male | Burkina Faso | 5 | Health ecology |
| 4 | Male | Belgium | 22 | Public health |
| 5 | Male | Spain | 40 | Epidemiology |
| 6 | Female | Ecuador | 20 | Prevention and control of diseases |
| 7 | Female | Belgium | 13 | Infectious and zoonotic diseases |
| 8 | Female | France | 15 | Virology |
| 9 | Female | Greece | 3 | Epidemiology |
| 10 | Male | Belgium | 29 | Emergency medicine |
| 11 | Female | Belgium | 6 | Medical sciences |
| 12 | Male | Belgium | 20 | Virology |
| 13 | Female | Belgium | 16 | Biosecurity |
| 14 | Female | Belgium | 34 | Prevention and health promotion |
| 15 | Female | France | 37 | Zoonoses |
| 16 | Female | Belgium | 19 | Biosecurity |
| 17 | Female | France | 16 | Epidemiology |
| 18 | Female | Belgium | 12 | Biosecurity |
| 19 | Male | Belgium | 25 | Infectious diseases |
| 20 | Female | France | 15 | Virology |
| 21 | Female | Belgium | 29 | Biosafety |
| 22 | Female | Ecuador | 12 | Ecology |
| 23 | Male | Belgium | 19 | Virology |
| 24 | Male | France | 20 | Virology |
| 25 | Male | France | 25 | Virology |
| 26 | Female | France | 22 | Wildlife/human/domestic animal interface |
| 27 | Male | Belgium | 35 | Immunology |
| 28 | Male | Cameroun | 13 | Control of diseases |
| 29 | Male | Belgium | 19 | Virology |
| 30 | Male | France | 42 | Immunology |
| 31 | Female | France | 15 | Health regulation |
| 32 | Male | Ecuador | 20 | Zoonoses |
| 33 | Female | Belgium | 29 | Control of infectious diseases |
| 34 | Female | France | 30 | Virology |
| 35 | Female | Luxemburg | 13 | Molecular epidemiology |
| 36 | Male | Belgium | 40 | Virology |
| 37 | Male | Canada | 37 | Biosecurity |
| 38 | Male | Belgium | 32 | Virology |
References
- Zhang, R.; Li, Y.; Zhang, A.L.; Wang, Y.; Molina, M.J. Identifying airborne transmission as the dominant route for the spread of COVID-19. Proc. Natl. Acad. Sci. USA 2020, 117, 14857–14863. [Google Scholar] [CrossRef] [PubMed]
- Rahman, H.S.; Aziz, M.S.; Hussein, R.H.; Othman, H.H.; Salih Omer, S.H.; Khalid, E.S.; Abdulrahman, N.A.; Amin, K.; Abdullah, R. The transmission modes and sources of COVID-19: A systematic review. Int. J. Surg. Open 2020, 26, 125–136. [Google Scholar] [CrossRef]
- Fédération Wallonie-Bruxelle Circulaire 7702 du 24/08/2020—Enseignement Supérieur: Protocole Année Académique 2020–2021; Federation Wallonie-Bruxelles: Brussels, Belgium, 2020.
- Soper, G.A. The lessons of the pandemic. Science (80-) 1919, 49, 501–506. [Google Scholar] [CrossRef] [PubMed] [Green Version]
- Bavel, J.J.V.; Baicker, K.; Boggio, P.S.; Capraro, V.; Cichocka, A.; Cikara, M.; Crockett, M.J.; Crum, A.J.; Douglas, K.M.; Druckman, J.N.; et al. Using social and behavioural science to support COVID-19 pandemic response. Nat. Hum. Behav. 2020, 4, 460–471. [Google Scholar] [CrossRef] [PubMed]
- Barari, S.; Caria, S.; Davola, A.; Falco, P.; Fetzer, T.; Fiorin, S.; Hensel, L.; Ivchenko, A.; Jachimowicz, J.; King, G.; et al. Evaluating COVID-19 public health messaging in Italy: Self-reported compliance and growing mental health concerns. medRxiv 2020. [Google Scholar] [CrossRef]
- Aanensen, D.M.; Huntley, D.M.; Feil, E.J.; Al-Own, F.; Spratt, B.G. EpiCollect: Linking smartphones to web applications for epidemiology, ecology and community data collection. PLoS ONE 2009, 4, e0006968. [Google Scholar] [CrossRef] [PubMed] [Green Version]
- Gore, S.M. Biostatistics and the Medical Research Council. MRC News 1987, 35, 19–20. [Google Scholar]
- Saegerman, C.; Bianchini, J.; Renault, V.; Haddad, N.; Humblet, M.F. First expert elicitation of knowledge on drivers of emergence of the COVID-19 in pets. Transbound. Emerg. Dis. 2020, 68, 626–636. [Google Scholar] [CrossRef] [PubMed]
- Petrie, A.; Watson, P. Statistics for Veterinary and Animal Science, 3rd ed.; Wiley-Blackwell, Ed.; John Wiley & Sons, Ltd.: Chichester, UK, 2013. [Google Scholar]
- Pfattheicher, S.; Nockur, L.; Böhm, R.; Sassenrath, C.; Petersen, M.B. The Emotional Path to Action: Empathy Promotes Physical Distancing and Wearing of Face Masks During the COVID-19 Pandemic. Psychol. Sci. 2020, 31, 1363–1373. [Google Scholar] [CrossRef] [PubMed]

| Campus location | Hallways or Corridors | Auditoriums | Restaurants or Cafeterias | Total |
|---|---|---|---|---|
| Arlon | 4 | 30 | 5 | 39 |
| Gembloux | 8 | 23 | 4 | 35 |
| Liege Centre | 30 | 139 | 15 | 184 |
| Liege Sart-Tilman | 64 | 171 | 33 | 268 |
| Total | 106 | 363 | 57 | 526 |
| (a) Presence of Hydro-Alcoholic Gel | ||||||
| Liege Sart-Tilman | Liege Centre | Gembloux | Arlon | Total | ||
| Place | N | 268 | 184 | 35 | 39 | 526 |
| Auditoriums | 363 | 16 | 23 | 4 | 20 | 18 |
| Hallways or corridor | 106 | 14 | 7 | 75 | 50 | 18 |
| Restaurants or cafeterias | 57 | 6 | 27 | 0 | 0 | 11 |
| Total | 526 | 15 | 21 | 20 | 21 | 17 |
| (b) Defined One-Way Traffic Flow | ||||||
| Liege Sart-Tilman | Liege Centre | Gembloux | Arlon | Total | ||
| Place | N | 268 | 184 | 35 | 39 | 526 |
| Auditoriums | 363 | 40 | 50 | 39 | 70 | 46 |
| Hallways or corridors | 106 | 38 | 23 | 50 | 100 | 37 |
| Restaurants or cafeterias | 57 | 18 | 13 | 0 | 100 | 23 |
| Total | 526 | 37 | 43 | 37 | 77 | 42 |
| Gesture | N | Observation with Respect | Percentage of Respect | Standard Error | Binomial Exact (95% Confidence Interval) | |
|---|---|---|---|---|---|---|
| Greetings | 2768 | 2300 | 83 | 0.007 | 82% | 84% |
| Hydro-alcoholic gel | 8822 | 3868 | 44 | 0.005 | 43% | 45% |
| Circulation flow | 7335 | 4773 | 65 | 0.006 | 64% | 66% |
| Wearing mask | 10,856 | 8567 | 79 | 0.004 | 78% | 80% |
| Physical distancing in auditoriums | 7266 | 6452 | 89 | 0.004 | 88% | 90% |
| Physical distancing out of auditorium | 3587 | 1585 | 44 | 0.008 | 43% | 46% |
| (a) Site | ||||||
| Use of Hydro-Alcoholic Gel | Circulation Flow | Wearing Mask | ||||
| Ref = Liege Sart-Tilman | Coeff | p-value | Coeff | p-value | Coeff | p-value |
| Liege Centre | 5.6 | 0.014 | ||||
| Gembloux | −14.9 | <0.001 | ||||
| Arlon | −22.72727 | 0.009 | ||||
| (b) Place of observation | ||||||
| Greetings | Wearing mask | Physical distance | ||||
| Ref = Auditorium | Coeff | p-value | Coeff | p-value | Coeff | p-value |
| Hallway/Corridor | −8.8 | <0.001 | ||||
| Restaurant or cafeteria | −11.11 | 0.005 | −16 | <0.001 | 52.9 | <0.001 |
| (c) Observation of the entries or exits | ||||||
| Use of Hydro-Alcoholic Gel | ||||||
| Coeff | p-value | |||||
| Exits | −34.6 | <0.001 | ||||
| (d) Week | ||||||
| Wearing Mask | ||||||
| Ref = Week 39 | Coeff | p-value | ||||
| Week 42 | 10.0 | 0.003 | ||||
| Week 43 | 10 | 0.005 | ||||
| (e) Code | ||||||
| Use of Hydro-Alcoholic Gel | ||||||
| Ref = Yellow | Coeff | p-value | ||||
| Orange | 12.381 | 0.017 | ||||
| Barrier Gesture | Kruskal–Wallis Test | |
|---|---|---|
| Chi-squared with 9 degrees of freedom | Probability | |
| Greeting | 2.316 | 0.985 |
| Use of hydro-alcoholic gel | 2.752 | 0.973 |
| Traffic flow | 2.362 | 0.984 |
| Mask wearing | 1.573 | 0.997 |
| Physical distancing in auditoriums | 4.043 | 0.909 |
| Physical distancing outside auditoriums | 2.805 | 0.972 |
Publisher’s Note: MDPI stays neutral with regard to jurisdictional claims in published maps and institutional affiliations. |
© 2021 by the authors. Licensee MDPI, Basel, Switzerland. This article is an open access article distributed under the terms and conditions of the Creative Commons Attribution (CC BY) license (https://creativecommons.org/licenses/by/4.0/).
Share and Cite
Renault, V.; Humblet, M.-F.; Parisi, G.; Donneau, A.-F.; Bureau, F.; Gillet, L.; Fontaine, S.; Saegerman, C. The First Random Observational Survey of Barrier Gestures against COVID-19. Int. J. Environ. Res. Public Health 2021, 18, 9972. https://doi.org/10.3390/ijerph18199972
Renault V, Humblet M-F, Parisi G, Donneau A-F, Bureau F, Gillet L, Fontaine S, Saegerman C. The First Random Observational Survey of Barrier Gestures against COVID-19. International Journal of Environmental Research and Public Health. 2021; 18(19):9972. https://doi.org/10.3390/ijerph18199972
Chicago/Turabian StyleRenault, Véronique, Marie-France Humblet, Gianni Parisi, Anne-Françoise Donneau, Fabrice Bureau, Laurent Gillet, Sébastien Fontaine, and Claude Saegerman. 2021. "The First Random Observational Survey of Barrier Gestures against COVID-19" International Journal of Environmental Research and Public Health 18, no. 19: 9972. https://doi.org/10.3390/ijerph18199972
APA StyleRenault, V., Humblet, M.-F., Parisi, G., Donneau, A.-F., Bureau, F., Gillet, L., Fontaine, S., & Saegerman, C. (2021). The First Random Observational Survey of Barrier Gestures against COVID-19. International Journal of Environmental Research and Public Health, 18(19), 9972. https://doi.org/10.3390/ijerph18199972