
Estimation of Lifetime QALYs Based on Lifestyle Behaviors


Abstract
:1. Introduction
2. Materials and Methods
2.1. Study Design and Participants
2.2. Questionnaires
2.3. Statistical Analysis
3. Results
3.1. Characteristics of the Participants
3.2. EQ-5D-5L Scores
3.3. Regression Analysis
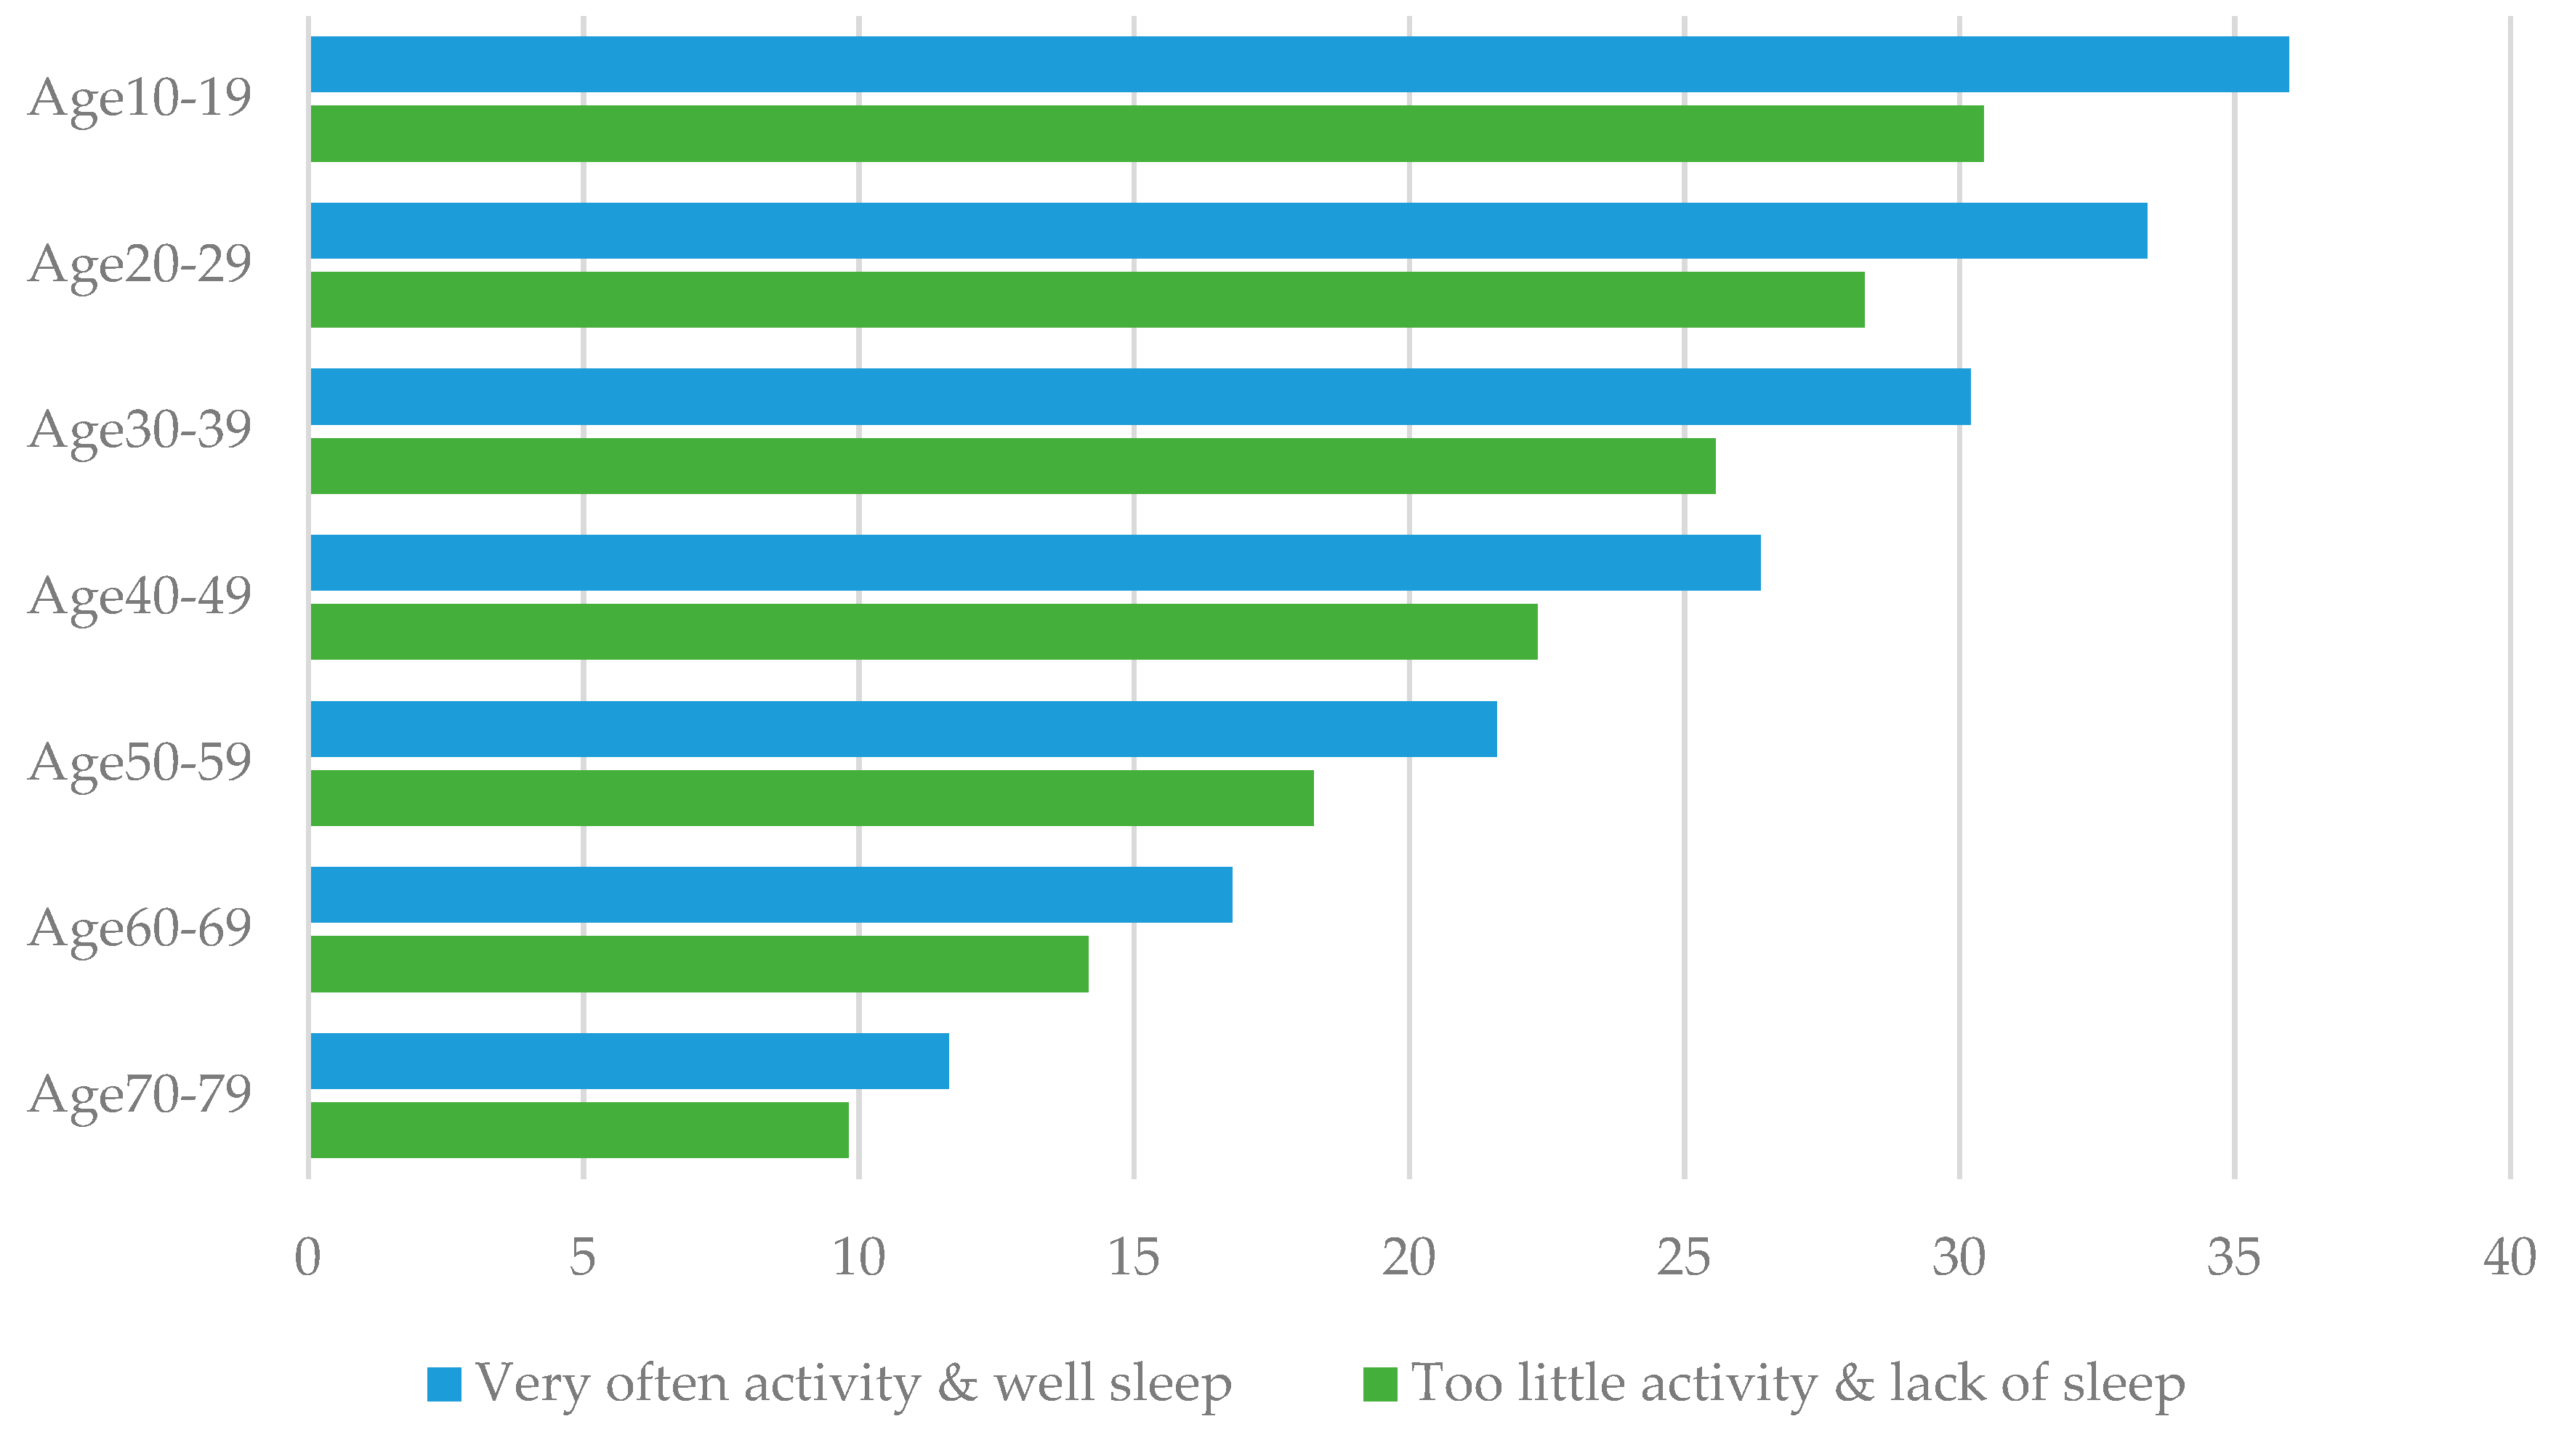
3.4. Microsimulation for Estimating Lifetime QALYs
4. Discussion
5. Conclusions
Supplementary Materials
Author Contributions
Funding
Institutional Review Board Statement
Informed Consent Statement
Data Availability Statement
Conflicts of Interest
References
- Al-Rubaye, A.K.; Johansson, K.; Alrubaiy, L. The association of health behavioral risk factors with quality of life in northern Sweden–A cross–sectional survey. J. Gen. Fam. Med. 2020, 21, 167–177. [Google Scholar] [CrossRef] [PubMed]
- Choi, M.; Prieto–Merino, D.; Dale, C.; Nüesch, E.; Amuzu, A.; Bowling, A.; Ebrahim, S.; Casas, J.P. Effect of changes in moderate or vigorous physical activity on changes in health–related quality of life of elderly British women over seven years. Qual. Life Res. 2013, 22, 2011–2020. [Google Scholar] [CrossRef]
- Noto, S.; Takahashi, O.; Kimura, T.; Moriwaki, K.; Masuda, K. The relationship between preference–based health–related quality of life and lifestyle behavior: A cross–sectional study on a community sample of adults who had undergone a health check–up. Health Qual. Life Outcomes 2020, 18, 267. [Google Scholar] [CrossRef] [PubMed]
- Li, Y.; Pan, A.; Wang, D.D.; Liu, X.; Dhana, K.; Franco, O.H.; Kaptoge, S.; Angelantonio, E.D.; Stampfer, M.; Willett, W.C.; et al. Impact of healthy lifestyle factors on life expectancies in the US population. Circulation 2018. [Google Scholar] [CrossRef] [PubMed]
- Larrick, J.W. Mendelsohn AR. Finally, a Regimen to Extend Human Life Expectancy. Rejuvenation Res. 2018, 21, 278–282. [Google Scholar] [CrossRef] [PubMed]
- Kastorini, C.M.; Milionis, H.J.; Esposito, K.; Giugliano, D.; Goudevenos, J.A.; Panagiotakos, D.B. The effect of mediterranean diet on metabolic syndrome and its components: A meta–analysis of 50 studies and 534,906 individuals. J. Am. Coll. Cardiol. 2011, 57, 1299–1313. [Google Scholar] [CrossRef] [Green Version]
- Horton, E.S. Effects of lifestyle changes to reduce risks of diabetes and associated cardiovascular risks: Results from large scale efficacy trials. Obesity 2009, 17 (Suppl. 3), S43–S48. [Google Scholar] [CrossRef]
- Isomaa, B.; Almgren, P.; Tuomi, T.; Forsén, B.; Lahti, K. Cardiovascular morbidity and mortality associated with the metabolic syndrome. Diabetes Care 2001, 24, 683–689. [Google Scholar] [CrossRef] [Green Version]
- Lorenzo, C.; Okoloise, M.; Williams, K.; Stern, M.P.; Haffner, S.M. The Metabolic Syndrome as Predictor of Type 2 Diabetes: The San Antonio Heart Study. Diabetes Care 2003, 26, 3153–3159. [Google Scholar] [CrossRef] [Green Version]
- Eriksson, M.K.; Hagberg, L.; Lindholm, L.; Malmgren–Olsson, E.B.; Osterlind, J.; Eliasson, M. Quality of life and cost–effectiveness of a 3–year trial of lifestyle intervention in primary health care. Arch. Intern. Med. 2010, 13, 1470–1479. [Google Scholar] [CrossRef]
- Saha, S.; Carlsson, K.S.; Gerdtham, U.G.; Eriksson, M.K.; Hagberg, L.; Eliasson, M.; Johansson, P. Are lifestyle interventions in primary care cost–effective? -An analysis based on a Markov model, differences–in–differences approach and the Swedish Björknäs study. PLoS ONE 2013, 14, e80672. [Google Scholar] [CrossRef]
- Vargas–Martínez, A.M.; Romero–Saldaña, M.; De Diego–Cordero, R. Economic evaluation of workplace health promotion interventions focused on Lifestyle: Systematic review and meta–analysis. J. Adv. Nurs. 2021, 77, 3657–3691. [Google Scholar] [CrossRef]
- S.C. Government of Canada, Microsimulation Approaches. Strengths and Drawbacks. 2009. Available online: https://www.statcan.gc.ca/eng/microsimulation/modgen/new/chap1/chap1–4 (accessed on 26 August 2021).
- Igarashi, A.; Hirose, E.; Kobayashi, Y.; Yonemoto, N.; Lee, B. Cost–effectiveness analysis for PCV13 in adults 60 years and over with underlying medical conditions which put them at an elevated risk of pneumococcal disease in Japan. Expert Rev. Vaccines 2021, 20, 1–13. [Google Scholar] [CrossRef] [PubMed]
- Huang, H.L.; Leung, C.Y.; Saito, E.; Katanoda, K.; Hur, C.; Kong, C.Y.; Nomura, S.; Shibuya, K. Effect and cost–effectiveness of national gastric cancer screening in Japan: A microsimulation modeling study. BMC Med. 2020, 18, 257. [Google Scholar] [CrossRef] [PubMed]
- Herdman, M.; Gudex, C.; Lloyd, A.; Janssen, M.; Kind, P.; Parkin, D.; Bonsel, G.; Badia, X. Development and preliminary testing of the new five–level version of EQ–5D (EQ–5D–5L). Qual. Life Res. 2011, 20, 1727–1736. [Google Scholar] [CrossRef] [PubMed] [Green Version]
- Shiroiwa, T.; Ikeda, S.; Noto, S.; Igarashi, A.; Fukuda, T.; Saito, S.; Shimozuma, K. Comparison of Value Set Based on DCE and/or TTO Data: Scoring for EQ–5D–5L Health States in Japan. Value Health 2016, 19, 648–654. [Google Scholar] [CrossRef] [PubMed] [Green Version]
- Muennig, P.; Bounthavong, M. Cost–Effectiveness Analysis in Health: A Practical Approach; John Wiley & Sons Inc.: Hoboken, NJ, USA, 2016. [Google Scholar]
- Shiroiwa, T.; Fukuda, T.; Ikeda, S.; Igarashi, A.; Noto, S.; Saito, S.; Shimozuma, K. Japanese population norms for preference–based measures: EQ–5D–3L, EQ–5D–5L, and SF–6D. Qual. Life Res. 2016, 3, 707–719. [Google Scholar] [CrossRef] [Green Version]
- Shiroiwa, T.; Noto, S.; Fukuda, T. Japanese population norms of EQ–5D–5L and HUI 3: Disutility catalogue by disease and symptoms in community settings. Value Health 2021, 24, 1193–1202. [Google Scholar] [CrossRef] [PubMed]
- Hidaka, Y.; Imamura, K.; Watanabe, K.; Tsutsumi, A.; Shimazu, A.; Inoue, A.; Hiro, H.; Odagiri, Y.; Asai, Y.; Yoshikawa, T.; et al. Associations between work–related stressors and QALY in a general working population in Japan: A cross–sectional study. Int. Arch. Occup. Environ. Health 2021, 94, 1375–1383. [Google Scholar] [CrossRef]
- Maheswaran, H.; Petrou, S.; Rees, K.; Stranges, S. Estimating EQ–5D utility values for major health behavioural risk factors in England. J. Epidemiol. Community Health 2013, 2, 172–180. [Google Scholar] [CrossRef] [Green Version]
- Saarni, S.I.; Joutsenniemi, K.; Koskinen, S.; Suvisaari, J.; Pirkola, S.; Sintonen, H.; Poikolainen, K.; Lönnqvist, J. Alcohol consumption, abstaining, health utility, and quality of life—A general population survey in Finland. Alcohol Alcohol. 2008, 43, 376–386. [Google Scholar] [CrossRef] [PubMed] [Green Version]
- Jing, Z.; Li, J.; Wang, Y.; Yuan, Y.; Zhao, D.; Hao, W.; Yu, C.; Zhou, C. Association of smoking status and health–related quality of life: Difference among young, middle–aged, and older adults in Shandong, China. Qual. Life Res. 2021, 2, 521–530. [Google Scholar] [CrossRef]
- Song, F.; Bachmann, M.O.; Aveyard, P.; Barton, G.R.; Brown, T.J.; Maskrey, V.; Blyth, A.; Notley, C.; Holland, R.; Sutton, S.; et al. Relapse to smoking and health–related quality of life: Secondary analysis of data from a study of smoking relapse prevention. PLoS ONE 2018, 13, e0205992. [Google Scholar] [CrossRef] [Green Version]
- National Institute for Clinical Excellence (NICE). Guide to the Methods of Technology Appraisal. 2013. Available online: https://www.nice.org.uk/process/pmg9/resources/guide-to-the-methods-of-technology-appraisal-2013-pdf-2007975843781 (accessed on 26 August 2021).
- Pharmaceutical Benefits Advisory Committee (PBAC). Guidelines for Preparing Submissions to the Pharmaceutical Benefits Advisory Committee. 2016. Available online: https://pbac.pbs.gov.au/content/information/files/pbac-guidelines-version-5.pdf (accessed on 26 August 2021).
- Canadian Agency for Drugs and Technologies in Health (CADTH). Guidelines for the Economic Evaluation of Health Technologies: Canada. 2021. Available online: https://www.cadth.ca/guidelines-economic-evaluation-health-technologies-canada (accessed on 26 August 2021).
- Shiroiwa, T.; Fukuda, T.; Ikeda, S.; Takura, T.; Moriwaki, K. Development of an Official Guideline for the Economic Evaluation of Drugs/Medical Devices in Japan. Value Health 2017, 3, 372–378. [Google Scholar] [CrossRef] [Green Version]
- Barbosa, C.; Taylor, B.; Godfrey, C.; Rehm, J.; Parrott, S.; Drummond, C. Modelling lifetime QALYs and health care costs from different drinking patterns over time: A Markov model. Int. J. Methods Psychiatr. Res. 2010, 2, 97–109. [Google Scholar] [CrossRef] [PubMed]
- Xu, X.; Fiacco, L.; Rostron, B.; Homsi, G.; Salazar, E.; Levine, B.; Ren, C.; Nonnemaker, J. Assessing quality–adjusted years of life lost associated with exclusive cigarette smoking and smokeless tobacco use. Prev. Med. 2021, 150, 106707. [Google Scholar] [CrossRef] [PubMed]


| n | % | ||
|---|---|---|---|
| Gender | Male | 1985 | 49.6 |
| Female | 2015 | 50.4 | |
| Age | 19–29 | 611 | 15.3 |
| 30–39 | 597 | 14.9 | |
| 40–49 | 771 | 19.3 | |
| 50–59 | 681 | 17.0 | |
| 60–69 | 676 | 16.9 | |
| >70 | 664 | 16.6 | |
| Region of Residence | Hokkaido | 168 | 4.2 |
| Tohoku | 340 | 8.5 | |
| Kanto | 1415 | 35.4 | |
| Chubu | 647 | 16.2 | |
| Kinki | 654 | 16.4 | |
| Chugoku | 225 | 5.6 | |
| Shikoku | 114 | 2.9 | |
| Kyushu | 437 | 10.9 | |
| Employment | Full-time worker | 1648 | 41.2 |
| Part-timer | 742 | 18.6 | |
| Self-employed | 247 | 6.2 | |
| Homemaker | 609 | 15.2 | |
| Retired | 248 | 6.2 | |
| Leave | 418 | 10.4 | |
| Others | 88 | 2.2 | |
| Marital status | Married | 2527 | 63.2 |
| Unmarried | 1071 | 26.8 | |
| Divorced or bereaved | 402 | 1.0 | |
| Education | Junior highschool | 83 | 2.1 |
| highschool | 1187 | 29.7 | |
| College etc. | 878 | 22.0 | |
| University | 1841 | 46.0 | |
| Graduate school | 11 | 0.3 | |
| Household income | <JPY 2mil | 342 | 8.6 |
| JPY 2 mil ≤ 4 mil | 864 | 21.6 | |
| JPY 4 mil ≤ 6 mil | 808 | 20.2 | |
| JPY 6 mil ≤ 10 mil | 864 | 21.6 | |
| JPY 10 mil ≤ 15 mil | 304 | 7.6 | |
| ≥JPY 15 mil | 84 | 0.2 | |
| Refused, unknown | 734 | 18.4 |
| n | EQ-5D-5L Index Score (Mean ± SD) | p Value | EQ-5D-5L VAS (Mean ± SD) | p Value | ||
|---|---|---|---|---|---|---|
| All | 4000 | 0.891 ± 0.134 | 79.4 ± 17.0 | |||
| Gender | Male | 1985 | 0.890 ± 0.145 | 0.598 | 79.5 ± 16.7 | 0.573 |
| Female | 2015 | 0.892 ± 0.123 | 79.2 ± 17.3 | |||
| Age | 19–29 | 611 | 0.882 ± 0.151 | 0.335 | 77.7 ± 18.0 | <0.001 |
| 30–39 | 597 | 0.894 ± 0.116 | 78.0 ± 17.0 | |||
| 40–49 | 771 | 0.890 ± 0.136 | 76.9 ± 18.8 | |||
| 50–59 | 681 | 0.891 ± 0.132 | 79.3 ± 17.4 | |||
| 60–69 | 676 | 0.899 ± 0.122 | 81.1 ± 15.0 | |||
| >70 | 664 | 0.890 ± 0.145 | 83.3 ± 14.4 | |||
| Drinking | Never | 1522 | 0.884 ± 0.142 | 0.039 | 78.4 ± 18.0 | 0.014 |
| Sometimes | 1399 | 0.894 ± 0.128 | 80.4 ± 15.2 | |||
| Habitually | 1041 | 0.897 ± 0.131 | 79.5 ± 17.2 | |||
| Smoking | Never | 2290 | 0.896 ± 0.128 | 0.022 | 79.9 ± 16.7 | 0.007 |
| Active | 666 | 0.880 ± 0.141 | 77.5 ± 18.8 | |||
| Former smokers | 1006 | 0.887 ± 0.144 | 79.3 ± 16.5 | |||
| Lack of Exercise | No | 839 | 0.915 ± 0.141 | <0.001 | 85.2 ± 14.3 | <0.001 |
| Yes | 3161 | 0.885 ± 0.132 | 77.8 ± 17.3 | |||
| Physical Activity | Very often | 390 | 0.936 ± 0.085 | <0.001 | 86.8 ± 12.6 | <0.001 |
| Usually | 1653 | 0.909 ± 0.113 | 82.1 ± 14.4 | |||
| Not so active | 1285 | 0.879 ± 0.130 | 77.1 ± 16.7 | |||
| Too little | 672 | 0.846 ± 0.188 | 72.7 ± 21.9 | |||
| Exercise habit | Almost daily | 366 | 0.921 ± 0.105 | <0.001 | 84.5 ± 14.8 | <0.001 |
| 3–5/week | 566 | 0.911 ± 0.105 | 83.8 ± 13.9 | |||
| 1–2/week | 846 | 0.891 ± 0.121 | 80.6 ± 14.4 | |||
| Too little | 958 | 0.894 ± 0.125 | 78.7 ± 16.6 | |||
| Almost never | 1264 | 0.871 ± 0.162 | 75.7 ± 19.7 | |||
| Sleeping | Well | 2234 | 0.921 ± 0.114 | <0.001 | 83.9 ± 13.7 | <0.001 |
| Lack of sleep | 1766 | 0.853 ± 0.148 | 73.7 ± 19.0 |
| EQ-5D-5L | ||||
|---|---|---|---|---|
| Coefficient | 95% CI | p Value | ||
| Intercept | 0.871 | 0.847–0.895 | <0.001 | |
| Gender | Male | –0.004 | –0.013–0.004 | 0.315 |
| Female | – | – | – | |
| Age | 19–29 | – | – | – |
| 30–39 | 0.020 | 0.005–0.035 | 0.007 | |
| 40–49 | 0.018 | 0.006–0.032 | 0.014 | |
| 50–59 | 0.017 | 0.002–0.031 | 0.025 | |
| 60–69 | 0.015 | 0.001–0.030 | 0.040 | |
| >70 | –0.003 | –0.018–0.012 | 0.698 | |
| Drinking | Never | – | – | – |
| Sometimes | 0.006 | –0.004–0.016 | 0.223 | |
| Habitually | 0.007 | –0.003–0.019 | 0.156 | |
| Smoking | Never | 0.013 | 0.001–0.025 | 0.033 |
| Active | – | – | – | |
| Former smokers | 0.004 | –0.008–0.017 | 0.505 | |
| Lack of Exercise | No | 0.006 | –0.006–0.018 | 0.349 |
| Yes | – | – | – | |
| Physical Activity | Very often | – | – | – |
| Usually | –0.026 | –0.042–−0.010 | 0.002 | |
| Not so active | –0.053 | –0.072–−0.035 | <0.001 | |
| Too little | –0.084 | –0.106–−0.064 | <0.001 | |
| Exercise habit | Almost daily | – | – | – |
| 3–5/week | 0.000 | –0.017–0.017 | 0.993 | |
| 1–2/week | –0.009 | –0.027–0.008 | 0.304 | |
| Too little | 0.005 | –0.013–0.023 | 0.590 | |
| Almost never | 0.001 | –0.018–0.020 | 0.909 | |
| Sleeping | Well | 0.063 | 0.055–0.072 | <0.001 |
| Lack of sleep | – | – | – | |
| QALYs per Person | Physical Activity | |||||
|---|---|---|---|---|---|---|
| Very Often | Usually | Not So Active | Too Little | |||
| All | ||||||
| Sleeping | Well | Expected value | 23.4 | 22.7 | 22.1 | 21.3 |
| Difference from base case | 1.7 | 1.0 | 0.4 | –0.4 | ||
| Lack of sleep | Expected value | 21.8 | 21.2 | 20.5 | 19.8 | |
| Difference from base case | 0.1 | –0.5 | –1.2 | –1.9 | ||
| Age 10–19 | ||||||
| Sleeping | Well | Expected value | 36.0 | 35.0 | 34.0 | 32.8 |
| Difference from base case | 2.6 | 1.7 | 0.6 | –0.5 | ||
| Lack of sleep | Expected value | 33.6 | 32.6 | 31.6 | 30.4 | |
| Difference from base case | 0.8 | –0.7 | –1.7 | –2.9 | ||
| Age 20–29 | ||||||
| Sleeping | Well | Expected value | 33.4 | 32.5 | 31.6 | 30.5 |
| Difference from base case | 2.4 | 1.5 | 0.6 | –0.5 | ||
| Lack of sleep | Expected value | 31.2 | 30.3 | 29.4 | 28.3 | |
| Difference from base case | 0.2 | –0.7 | –1.6 | –2.7 | ||
| Age 30–39 | ||||||
| Sleeping | Well | Expected value | 30.2 | 29.4 | 28.5 | 27.6 |
| Difference from base case | 2.2 | 1.4 | 0.5 | –0.5 | ||
| Lack of sleep | Expected value | 28.2 | 27.4 | 26.5 | 25.6 | |
| Difference from base case | 0.2 | –0.6 | –1.5 | –2.4 | ||
| Age 40–49 | ||||||
| Sleeping | Well | Expected value | 26.4 | 25.7 | 24.9 | 24.1 |
| Difference from base case | 1.9 | 1.2 | 0.5 | –0.4 | ||
| Lack of sleep | Expected value | 24.6 | 23.9 | 23.2 | 22.3 | |
| Difference from base case | 0.2 | –0.5 | –1.3 | –2.1 | ||
| Age 50–59 | ||||||
| Sleeping | Well | Expected value | 21.6 | 21.0 | 20.4 | 19.7 |
| Difference from base case | 1.6 | 1.00 | 0.4 | –0.3 | ||
| Lack of sleep | Expected value | 20.2 | 19.6 | 19.0 | 18.3 | |
| Difference from base case | 0.1 | –0.5 | –1.1 | –1.8 | ||
| Age 60–69 | ||||||
| Sleeping | Well | Expected value | 16.8 | 16.3 | 15.8 | 15.3 |
| Difference from base case | 1.2 | 0.8 | 0.3 | –0.3 | ||
| Lack of sleep | Expected value | 15.7 | 15.2 | 14.7 | 14.2 | |
| Difference from base case | 0.1 | –0.3 | –0.8 | –1.4 | ||
| Age 70–79 | ||||||
| Sleeping | Well | Expected value | 11.6 | 11.3 | 11.0 | 10.6 |
| Difference from base case | 0.9 | 0.6 | 0.2 | –0.2 | ||
| Lack of sleep | Expected value | 10.9 | 10.5 | 10.2 | 9.8 | |
| Difference from base case | 0.1 | –0.2 | –0.6 | –1.0 | ||
Publisher’s Note: MDPI stays neutral with regard to jurisdictional claims in published maps and institutional affiliations. |
© 2021 by the authors. Licensee MDPI, Basel, Switzerland. This article is an open access article distributed under the terms and conditions of the Creative Commons Attribution (CC BY) license (https://creativecommons.org/licenses/by/4.0/).
Share and Cite
Noto, S.; Saito, S.; Shiroiwa, T.; Fukuda, T. Estimation of Lifetime QALYs Based on Lifestyle Behaviors. Int. J. Environ. Res. Public Health 2021, 18, 9970. https://doi.org/10.3390/ijerph18199970
Noto S, Saito S, Shiroiwa T, Fukuda T. Estimation of Lifetime QALYs Based on Lifestyle Behaviors. International Journal of Environmental Research and Public Health. 2021; 18(19):9970. https://doi.org/10.3390/ijerph18199970
Chicago/Turabian StyleNoto, Shinichi, Shota Saito, Takeru Shiroiwa, and Takashi Fukuda. 2021. "Estimation of Lifetime QALYs Based on Lifestyle Behaviors" International Journal of Environmental Research and Public Health 18, no. 19: 9970. https://doi.org/10.3390/ijerph18199970
APA StyleNoto, S., Saito, S., Shiroiwa, T., & Fukuda, T. (2021). Estimation of Lifetime QALYs Based on Lifestyle Behaviors. International Journal of Environmental Research and Public Health, 18(19), 9970. https://doi.org/10.3390/ijerph18199970