
Traceability and Emission Reduction of Dissolved Inorganic Nitrogen in Minjiang Estuary, China

Abstract
:1. Introduction
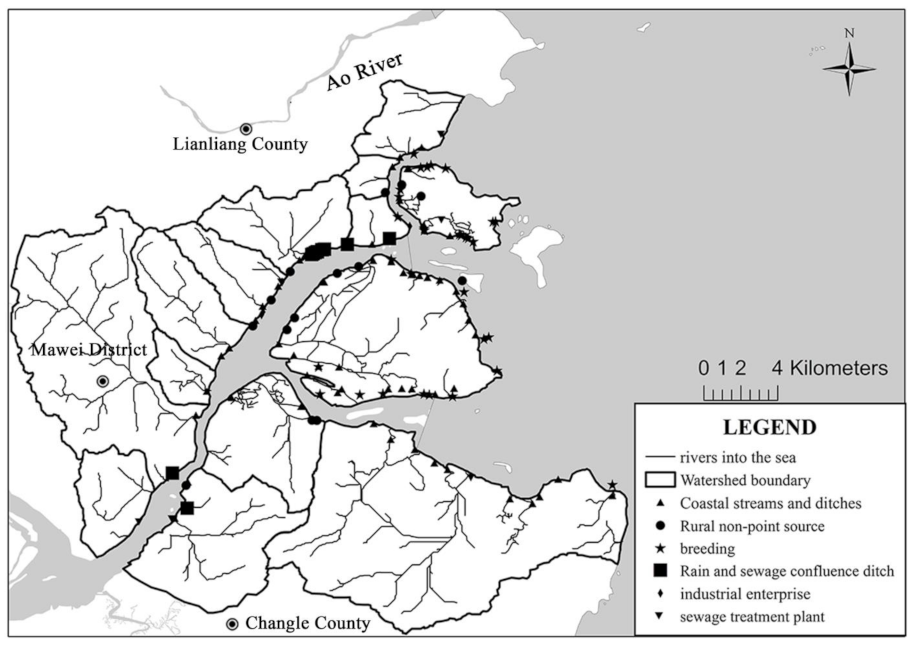
2. Research Area
3. Pollutant Data Collection and Pre-Treatment
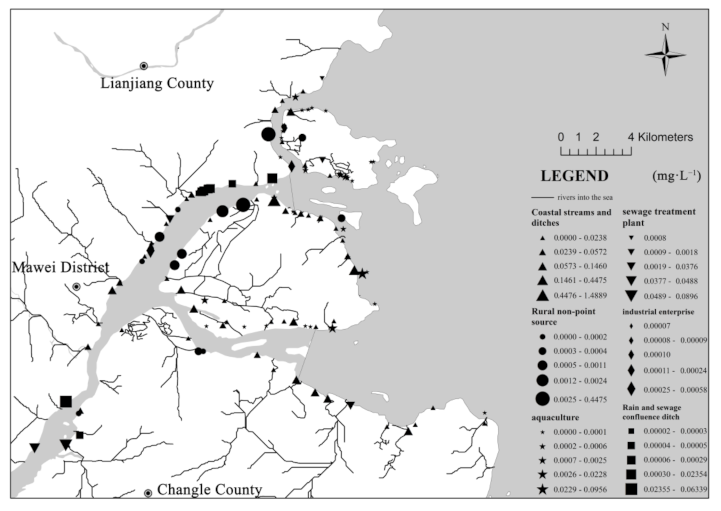
3.1. Pollutant Data Collection
3.2. Determination of Pollutant Conversion Relationship
4. Methods
4.1. Hydrodynamic Water Quality Model
4.1.1. Basic Equation
4.1.2. Basic Equation of Water Quality
4.1.3. Model Setup
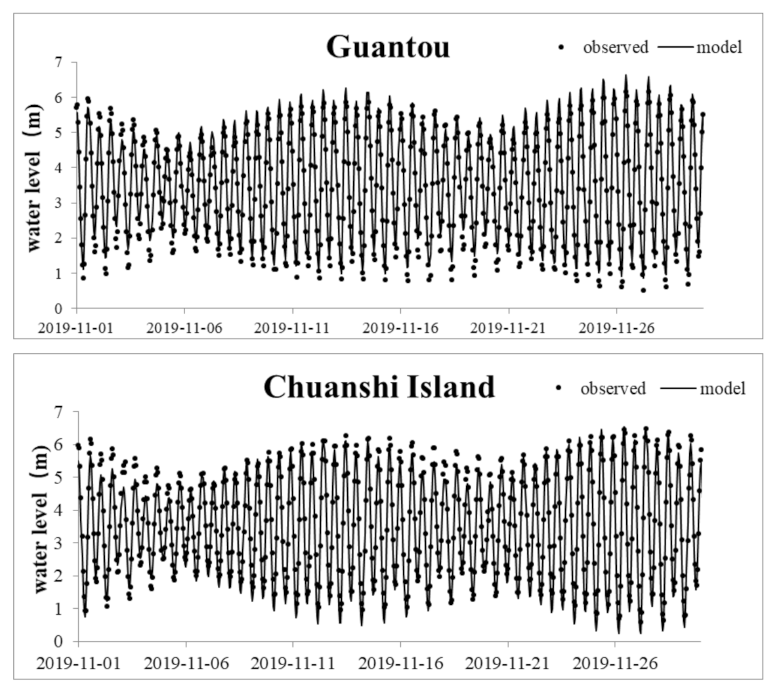
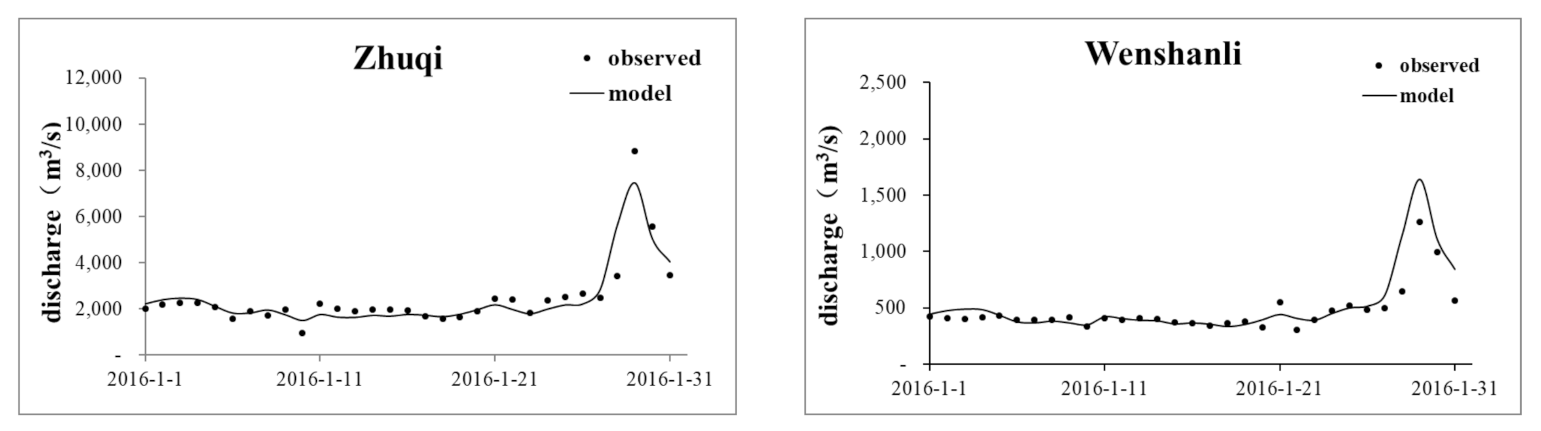
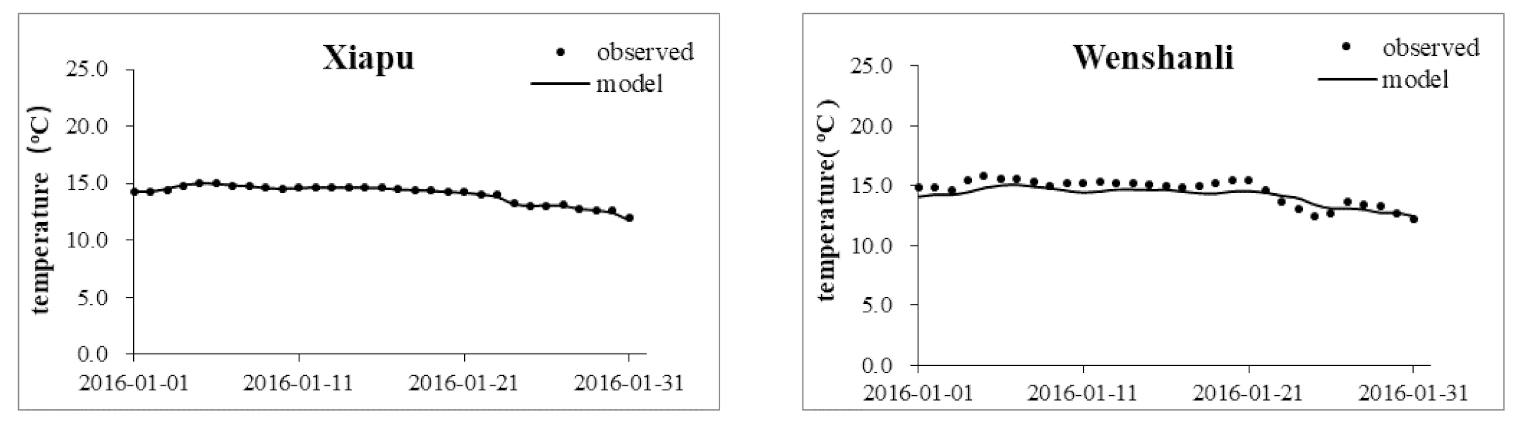
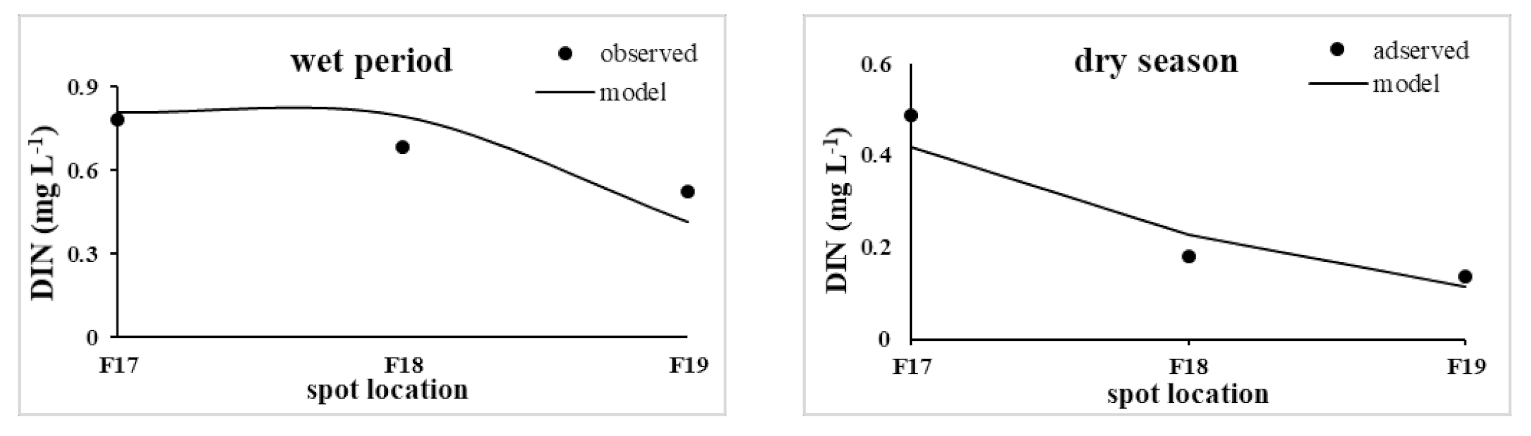
4.1.4. Calibration
4.2. Sharing Coefficient Method
5. Results and Discussion
5.1. Calculation of Sharing Coefficient
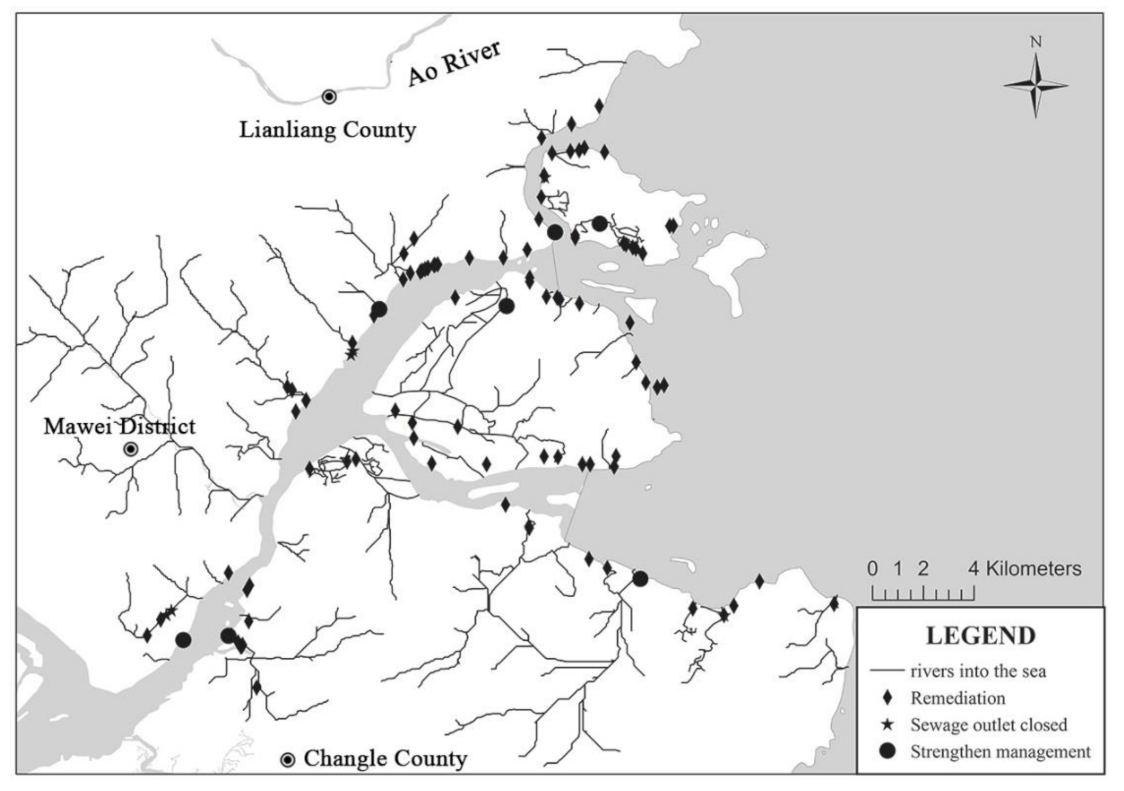
5.2. DIN Emission Reduction Plan
5.2.1. Pollution Source Reduction Plan in the Estuary
5.2.2. Emission Reduction Plan of Pollution Sources in Each Division
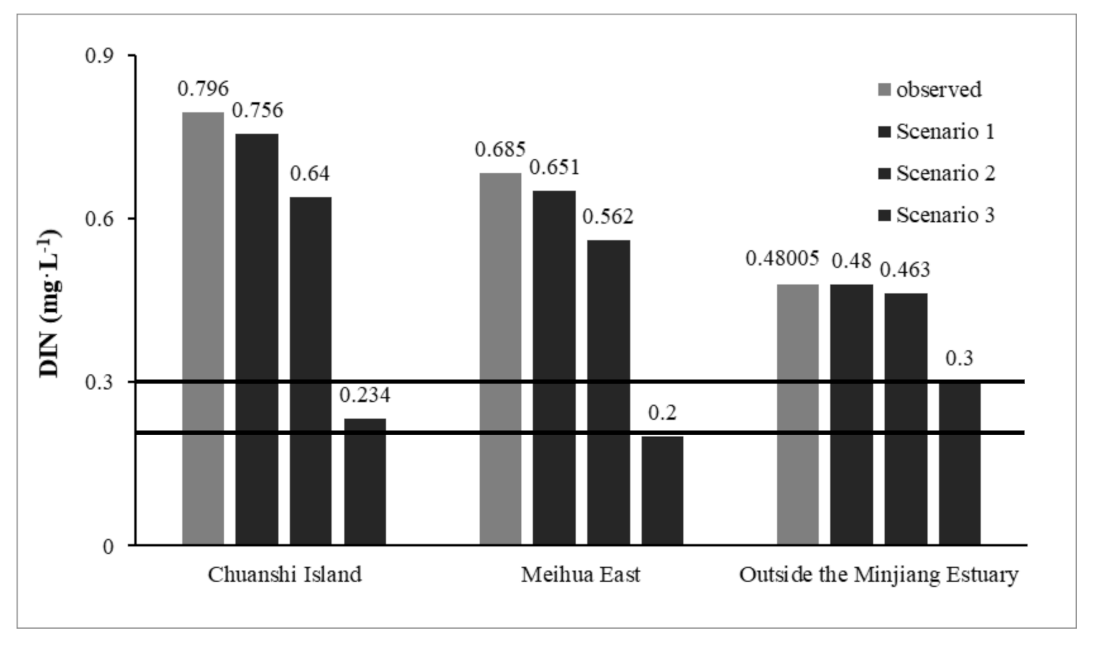
5.2.3. Emission Reduction Plan to Meet the DIN Concentration Standard
6. Conclusions
Author Contributions
Funding
Institutional Review Board Statement
Informed Consent Statement
Acknowledgments
Conflicts of Interest
References
- Sreenivasulu, G.; Praseetha, B.S.; Daud, N.R.; Varghese, T.I.; Prakash, T.N.; Jayaraju, N. Benthic foraminifera as potential ecological proxies for environmental monitoring in coastal regions: A study on the Beypore estuary, Southwest coast of India. Mar. Pollut. Bull. 2019, 138, 341–351. [Google Scholar] [CrossRef] [PubMed]
- Bugica, K.; Sterba-Boatwright, B.; Wetz, M.S. Water quality trends in Texas estuaries. Mar. Pollut. Bull. 2020, 152, 110903. [Google Scholar] [CrossRef] [PubMed]
- Asmala, E.; Haraguchi, L.; Markager, S.; Massicotte, P.; Riemann, B.; Staehr, P.A.; Carstensen, J. Eutrophication Leads to Accumulation of Recalcitrant Autochthonous Organic Matter in Coastal Environment. Glob. Biogeochem. Cycles 2018, 32, 1673–1687. [Google Scholar] [CrossRef]
- Plew, D.R.; Zeldis, J.R.; Dudley, B.D.; Whitehead, A.L.; Stevens, L.M.; Robertson, B.M.; Robertson, B.P. Assessing the Eutrophic Susceptibility of New Zealand Estuaries. Estuaries Coasts 2020, 43, 2015–2033. [Google Scholar] [CrossRef]
- Olisah, C.; Adams, J.B.; Rubidge, G. The state of persistent organic pollutants in South African estuaries: A review of environmental exposure and sources. Ecotoxicol. Environ. Saf. 2021, 219, 112316. [Google Scholar] [CrossRef] [PubMed]
- Walters, H.M.; Brody, S.; Highfield, W. Examining the relationship between development patterns and total phosphorus in the Galveston Bay Estuary. Environ. Sci. Policy 2018, 88, 10–16. [Google Scholar] [CrossRef]
- Howarth, R.W. Coastal nitrogen pollution: A review of sources and trends globally and regionally. Harmful Algae 2008, 8, 14–20. [Google Scholar] [CrossRef]
- Herbeck, L.S.; Unger, D.; Wu, Y.; Jennerjahn, T.C. Effluent, nutrient and organic matter export from shrimp and fish ponds causing eutrophication in coastal and back-reef waters of NE Hainan, tropical China. Cont. Shelf Res. 2013, 57, 92–104. [Google Scholar] [CrossRef]
- Douglas, E.J.; Lohrer, A.M.; Pilditch, C.A. Biodiversity breakpoints along stress gradients in estuaries and associated shifts in ecosystem interactions. Sci. Rep. 2019, 9, 17567. [Google Scholar] [CrossRef] [PubMed] [Green Version]
- Krepsky, N.; Bispo, M.; Fontana, L.F.; da Silva, F.S.; Torres, J.P.M.; Malm, O.; Silva, C.G.; Crapez, M.A.C. Effects of aeration on the suspended matter from a tropical and eutrophic estuary. J. Environ. Sci. 2019, 86, 175–186. [Google Scholar] [CrossRef]
- Logan, B.; Taffs, K.H.; Eyre, B.D.; Zawadski, A. Assessing changes in nutrient status in the Richmond River estuary, Australia, using paleolimnological methods. J. Paleolimnol. 2010, 46, 597–611. [Google Scholar] [CrossRef]
- Bulletin of China Marine Ecological Environment Status; Ministry of Ecology and Environment of the People’s Republic of China: Beijing, China, 2020.
- Strokal, M.; Kroeze, C.; Wang, M.; Ma, L. Reducing future river export of nutrients to coastal waters of China in optimistic scenarios. Sci. Total Environ. 2017, 579, 517–528. [Google Scholar] [CrossRef] [PubMed]
- Tong, Y.; Bu, X.; Chen, J.; Zhou, F.; Chen, L.; Liu, M.; Tan, X.; Yu, T.; Zhang, W.; Mi, Z.; et al. Estimation of nutrient discharge from the Yangtze River to the East China Sea and the identification of nutrient sources. J. Hazard. Mater. 2017, 321, 728–736. [Google Scholar] [CrossRef]
- Harris, L.R.; Bessinger, M.; Dayaram, A.; Holness, S.; Kirkman, S.; Livingstone, T.-C.; Lombard, A.T.; Lück-Vogel, M.; Pfaff, M.; Sink, K.J.; et al. Advancing land-sea integration for ecologically meaningful coastal conservation and management. Biol. Conserv. 2019, 237, 81–89. [Google Scholar] [CrossRef]
- Schlüter, A.; Van Assche, K.; Hornidge, A.-K.; Văidianu, N. Land-sea interactions and coastal development: An evolutionary governance perspective. Mar. Policy 2020, 112, 103801. [Google Scholar] [CrossRef]
- Nguyen, A.T.; Némery, J.; Gratiot, N.; Garnier, J.; Dao, T.S.; Thieu, V.; Laruelle, G.G. Biogeochemical functioning of an urbanized tropical estuary: Implementing the generic C-GEM (reactive transport) model. Sci. Total Environ. 2021, 784, 147261. [Google Scholar] [CrossRef] [PubMed]
- Hunt, S.; Jones, H.F.E. The fate of river-borne contaminants in the marine environment: Characterising Regions of Freshwater Influence (ROFIs) and estuary plumes using idealised models and satellite images. Mar. Pollut. Bull. 2020, 156, 111169. [Google Scholar] [CrossRef] [PubMed]
- Rubalingeswari, N.; Thulasimala, D.; Giridharan, L.; Gopal, V.; Magesh, N.S.; Jayaprakash, M. Bioaccumulation of heavy metals in water, sediment, and tissues of major fisheries from Adyar estuary, southeast coast of India: An ecotoxicological impact of a metropolitan city. Mar. Pollut. Bull. 2021, 163, 111964. [Google Scholar] [CrossRef] [PubMed]
- Taillardat, P.; Marchand, C.; Friess, D.A.; Widory, D.; David, F.; Ohte, N.; Nakamura, T.; Van Vinh, T.; Thanh-Nho, N.; Ziegler, A.D. Respective contribution of urban wastewater and mangroves on nutrient dynamics in a tropical estuary during the monsoon season. Mar. Pollut. Bull. 2020, 160, 111652. [Google Scholar] [CrossRef]
- Timmermann, K.; Markager, S.; Gustafsson, K.E. Streams or open sea? Tracing sources and effects of nutrient loadings in a shallow estuary with a 3D hydrodynamic–ecological model. J. Mar. Syst. 2010, 82, 111–121. [Google Scholar] [CrossRef]
- Mandal, S.; Ray, S.; Ghosh, P.B. Modelling of the contribution of dissolved inorganic nitrogen (DIN) from litterfall of adjacent mangrove forest to Hooghly–Matla estuary, India. Ecol. Model. 2009, 220, 2988–3000. [Google Scholar] [CrossRef]
- Latimer, J.S.; Charpentier, M.A. Nitrogen inputs to seventy-four southern New England estuaries: Application of a watershed nitrogen loading model. Estuar. Coast. Shelf Sci. 2010, 89, 125–136. [Google Scholar] [CrossRef]
- Yu, D.; Yan, W.; Chen, N.; Peng, B.; Hong, H.; Zhuo, G. Modeling increased riverine nitrogen export: Source tracking and integrated watershed-coast management. Mar. Pollut. Bull. 2015, 101, 642–652. [Google Scholar] [CrossRef]
- Sun, J.; Zhang, W.; Li, J.; Han, X.; Wang, Q.; Kong, J. Method of traceability of pollutants in Estuary Areas based on evolutionary algorithms and water quality model. Sci. Technol. Eng. 2019, 19, 384–391. (In Chinese) [Google Scholar]
- Deng, Y.; Zheng, B.; Fu, G.; Lei, K.; Li, Z. Study on the total water pollutant load allocation in the Changjiang (Yangtze River) Estuary and adjacent seawater area. Estuar. Coast. Shelf Sci. 2010, 86, 331–336. [Google Scholar] [CrossRef]
- Qing, L.; Jian, F.; Peng, W.; Zhu, C. Application of Share Ratio Process in Water Environment Capacity Calculation of Erhai Lake. Yellow River 2012, 34, 92–94. (In Chinese) [Google Scholar]
- Liang, Q. The Study of Water Environment Capacity Based on MIKE21 Hydrodynamic and Water Quality Model. Master’s Thesis, Hebei University of Engineering, Handan, China, 2013. (In Chinese). [Google Scholar]
- Ke, L. The Research of Environment Problems and the Analysis of Carrying Capacity in the Coastal Sea Area of Liaoning Province. Ph.D. Thesis, Dalian University of Technology, Dalian, China, 2013. (In Chinese). [Google Scholar]
- Pastuszak, M.; Witek, Z.; Nagel, K.; Wielgat, M.; Grelowski, A. Role of the Oder estuary (southern Baltic) in transformation of the riverine nutrient loads. J. Mar. Syst. 2005, 57, 30–54. [Google Scholar] [CrossRef]
- Barletta, M.; Lima, A.R.A.; Costa, M.F. Distribution, sources and consequences of nutrients, persistent organic pollutants, metals and microplastics in South American estuaries. Sci. Total Environ. 2019, 651, 1199–1218. [Google Scholar] [CrossRef] [PubMed]
- Ministry of Environment Protection. Sea Water Quality Standard; Ministry of Environment Protection: Beijing, China, 1997; Volume GB 3097-1997.
- Li, X.; Gao, D.; Hou, L.; Qian, W.; Liu, M.; Zeng, H.; Chen, Z.; Tong, C. Nitrogen loads alter the N2 production between denitrification and anammox in Min River Estuary, a highly impacted estuary in southeast China. Environ. Pollut. 2021, 277, 116757. [Google Scholar] [CrossRef]
- Xu, Y.; Sun, Q.; Yi, L.; Yin, X.; Wang, A.; Li, Y.; Chen, J. The source of natural and anthropogenic heavy metals in the sediments of the Minjiang River Estuary (SE China): Implications for historical pollution. Sci. Total Environ. 2014, 493, 729–736. [Google Scholar] [CrossRef] [PubMed]
- Zhang, P.; Pang, Y.; Pan, H.; Shi, C.; Huang, Y.; Wang, J. Factors Contributing to Hypoxia in the Minjiang River Estuary, Southeast China. Int. J. Environ. Res. Public Health 2015, 12, 9357–9374. [Google Scholar] [CrossRef] [PubMed] [Green Version]
- Zhang, P.; Pang, Y.; Shi, C.; Wang, Y.; Xu, L.; Pan, H.; Xie, R. Analysis and numerical simulation of natural and human-caused low dissolved oxygen in the Minjiang River Estuary. Water Sci. Technol. 2016, 73, 2475–2485. [Google Scholar] [CrossRef] [PubMed]
- Lan, L. Two Dimensional Hydrodynamic and Water Quality Modeling for the North Branch of Lower Minjiang River. Master’s Thesis, Fujian Normal University, Fuzhou, China, 2007. [Google Scholar]
- Fujian Provincial Department of Ecology and Environment. Available online: http://sthjt.fujian.gov.cn/wsbs/bmfwcx/szcx/ (accessed on 10 October 2019).
- Hou, Y. Temporal-Spatial Distribution and Transformation of Nitrogen in the Min River Downstream and Estuary. Master’s Thesis, Xiamen University, Xiamen, China, 2017. (In Chinese). [Google Scholar]
- Wu, Y.; Xu, G.; Chen, M. Study on the Correlation between TN and NH3-N in Rivers Entering the Sea in Shanghai. Sichuan Environ. 2020, 39, 68–73. (In Chinese) [Google Scholar]
- Belibassakis, K.A.; Karathanasi, F.E. Modelling nearshore hydrodynamics and circulation under the impact of high waves at the coast of Varkiza in Saronic-Athens Gulf. Oceanologia 2017, 59, 350–364. [Google Scholar] [CrossRef]
- García-Oliva, M.; Djordjević, S.; Tabor, G.R. The impacts of tidal turbines on water levels in a shallow estuary. Int. J. Mar. Energy 2017, 19, 177–197. [Google Scholar] [CrossRef]
- Jia, P.; Wang, Q.; Lu, X.; Zhang, B.; Li, C.; Li, S.; Li, S.; Wang, Y. Simulation of the effect of an oil refining project on the water environment using the MIKE 21 model. Phys. Chem. Earth Parts A/B/C 2018, 103, 91–100. [Google Scholar] [CrossRef]
- Dong, L.; Liu, J.; Du, X.; Dai, C.; Liu, R. Simulation-based risk analysis of water pollution accidents combining multi-stressors and multi-receptors in a coastal watershed. Ecol. Indic. 2018, 92, 161–170. [Google Scholar] [CrossRef]
- China Meteorological Administration. Available online: http://www.weather.com.cn/weather40d/101230101.shtml (accessed on 6 October 2019).
- Courant, R.; Friedrichs, K.; Lewy, H. Über die partiellen Differenzengleichungen der mathematischen Physik. Math. Ann. 1928, 100, 32–74. [Google Scholar] [CrossRef]
- Sun, L. 2006–2016 Haizhou Bay Marine Environmental Capacity Change and Mechanism Research. Ph.D. Thesis, Nanjing Normal University, Nanjing, China, 2020. (In Chinese). [Google Scholar]
- Zhang, C.; Han, K.; Zhang, Y.; Dou, Z.; Xia, J. Study on the total mass control of the pollutants into Dalian Bay. Mar. Environ. Sci. 1998, 17, 1–5. (In Chinese) [Google Scholar]
- Chen, Y. A method for calculation of environmental capacity of bay water during planning environmental impact assessment. Water Resour. Prot. 2014, 30, 70–75. (In Chinese) [Google Scholar]
- Feng, J.; Zhou, H.; Peng, W.; Du, X. Erhai TP Water Enviromental Capacity Calculation Based on Idea of Different Period and Subzone. Water Resour. Power 2013, 31, 34–37. (In Chinese) [Google Scholar]
- Ministry of Ecology and Environment of the People’s of China, Pollution prevention plan for coastal waters. Available online: http://www.mee.gov.cn/gkml/hbb/bgth/201704/W020170419525140514052.pdf.2017 (accessed on 31 March 2021).


| Tide Level Error | Zhuqi | Wenshanli | Xianan | Baiyantan | Guantou |
|---|---|---|---|---|---|
| mean absolute error (m) | / | 0.25 | 0.20 | 0.22 | 0.22 |
| mean relative deviation (%) | 14.16% | 13.06% | / | / | / |
| Hydrologic Stations | Degradation Coefficient of the DIN | |||
|---|---|---|---|---|
| Period | CI | ME | OME | |
| wet period | 3.70% | 16.51% | 20.38% | |
| dry season | 16.91% | 20.70% | 21.15% | |
Publisher’s Note: MDPI stays neutral with regard to jurisdictional claims in published maps and institutional affiliations. |
© 2021 by the authors. Licensee MDPI, Basel, Switzerland. This article is an open access article distributed under the terms and conditions of the Creative Commons Attribution (CC BY) license (https://creativecommons.org/licenses/by/4.0/).
Share and Cite
Fan, C.; Zhang, P.; Song, G.; Wang, H.; Wang, B. Traceability and Emission Reduction of Dissolved Inorganic Nitrogen in Minjiang Estuary, China. Int. J. Environ. Res. Public Health 2021, 18, 10017. https://doi.org/10.3390/ijerph181910017
Fan C, Zhang P, Song G, Wang H, Wang B. Traceability and Emission Reduction of Dissolved Inorganic Nitrogen in Minjiang Estuary, China. International Journal of Environmental Research and Public Health. 2021; 18(19):10017. https://doi.org/10.3390/ijerph181910017
Chicago/Turabian StyleFan, Chenchen, Peng Zhang, Gangfu Song, Huaru Wang, and Bingyi Wang. 2021. "Traceability and Emission Reduction of Dissolved Inorganic Nitrogen in Minjiang Estuary, China" International Journal of Environmental Research and Public Health 18, no. 19: 10017. https://doi.org/10.3390/ijerph181910017
APA StyleFan, C., Zhang, P., Song, G., Wang, H., & Wang, B. (2021). Traceability and Emission Reduction of Dissolved Inorganic Nitrogen in Minjiang Estuary, China. International Journal of Environmental Research and Public Health, 18(19), 10017. https://doi.org/10.3390/ijerph181910017