
Effects of Rare Earth Elements on Blood Pressure and Their Exposure Biomarkers: Evidence from Animal Experiments

 ,
,  ,
,
Abstract
:1. Introduction
2. Materials and Method
2.1. Reagents
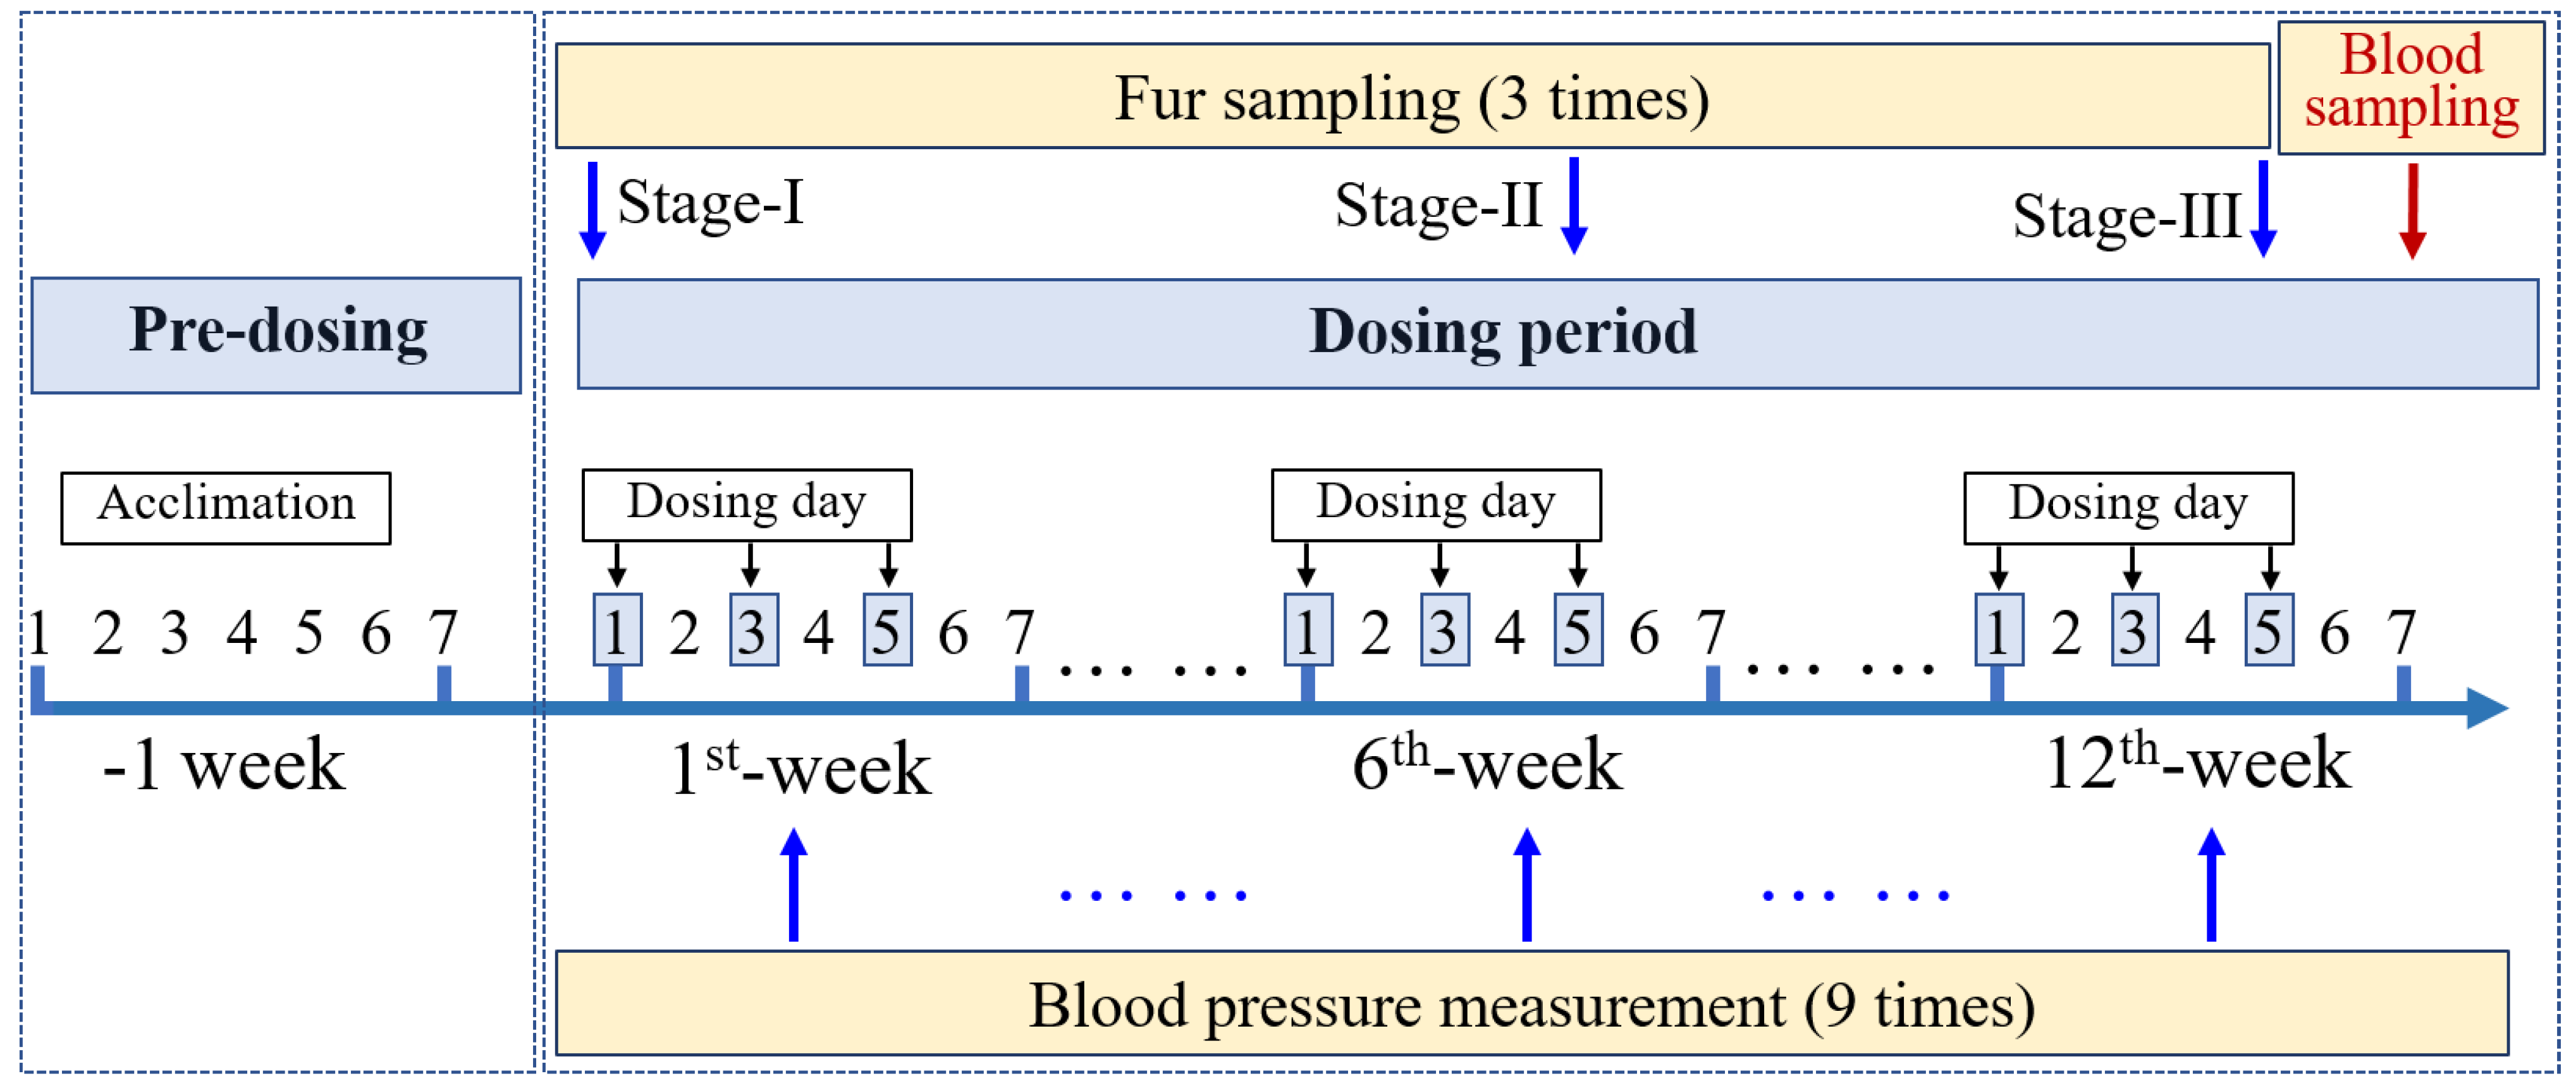
2.2. Rat Model
2.3. Quantitative Analysis
2.4. Data Analysis
3. Results
3.1. Exposure Biomarkers of REEs in Rats
3.2. Effects of REE Intake on Blood Pressure
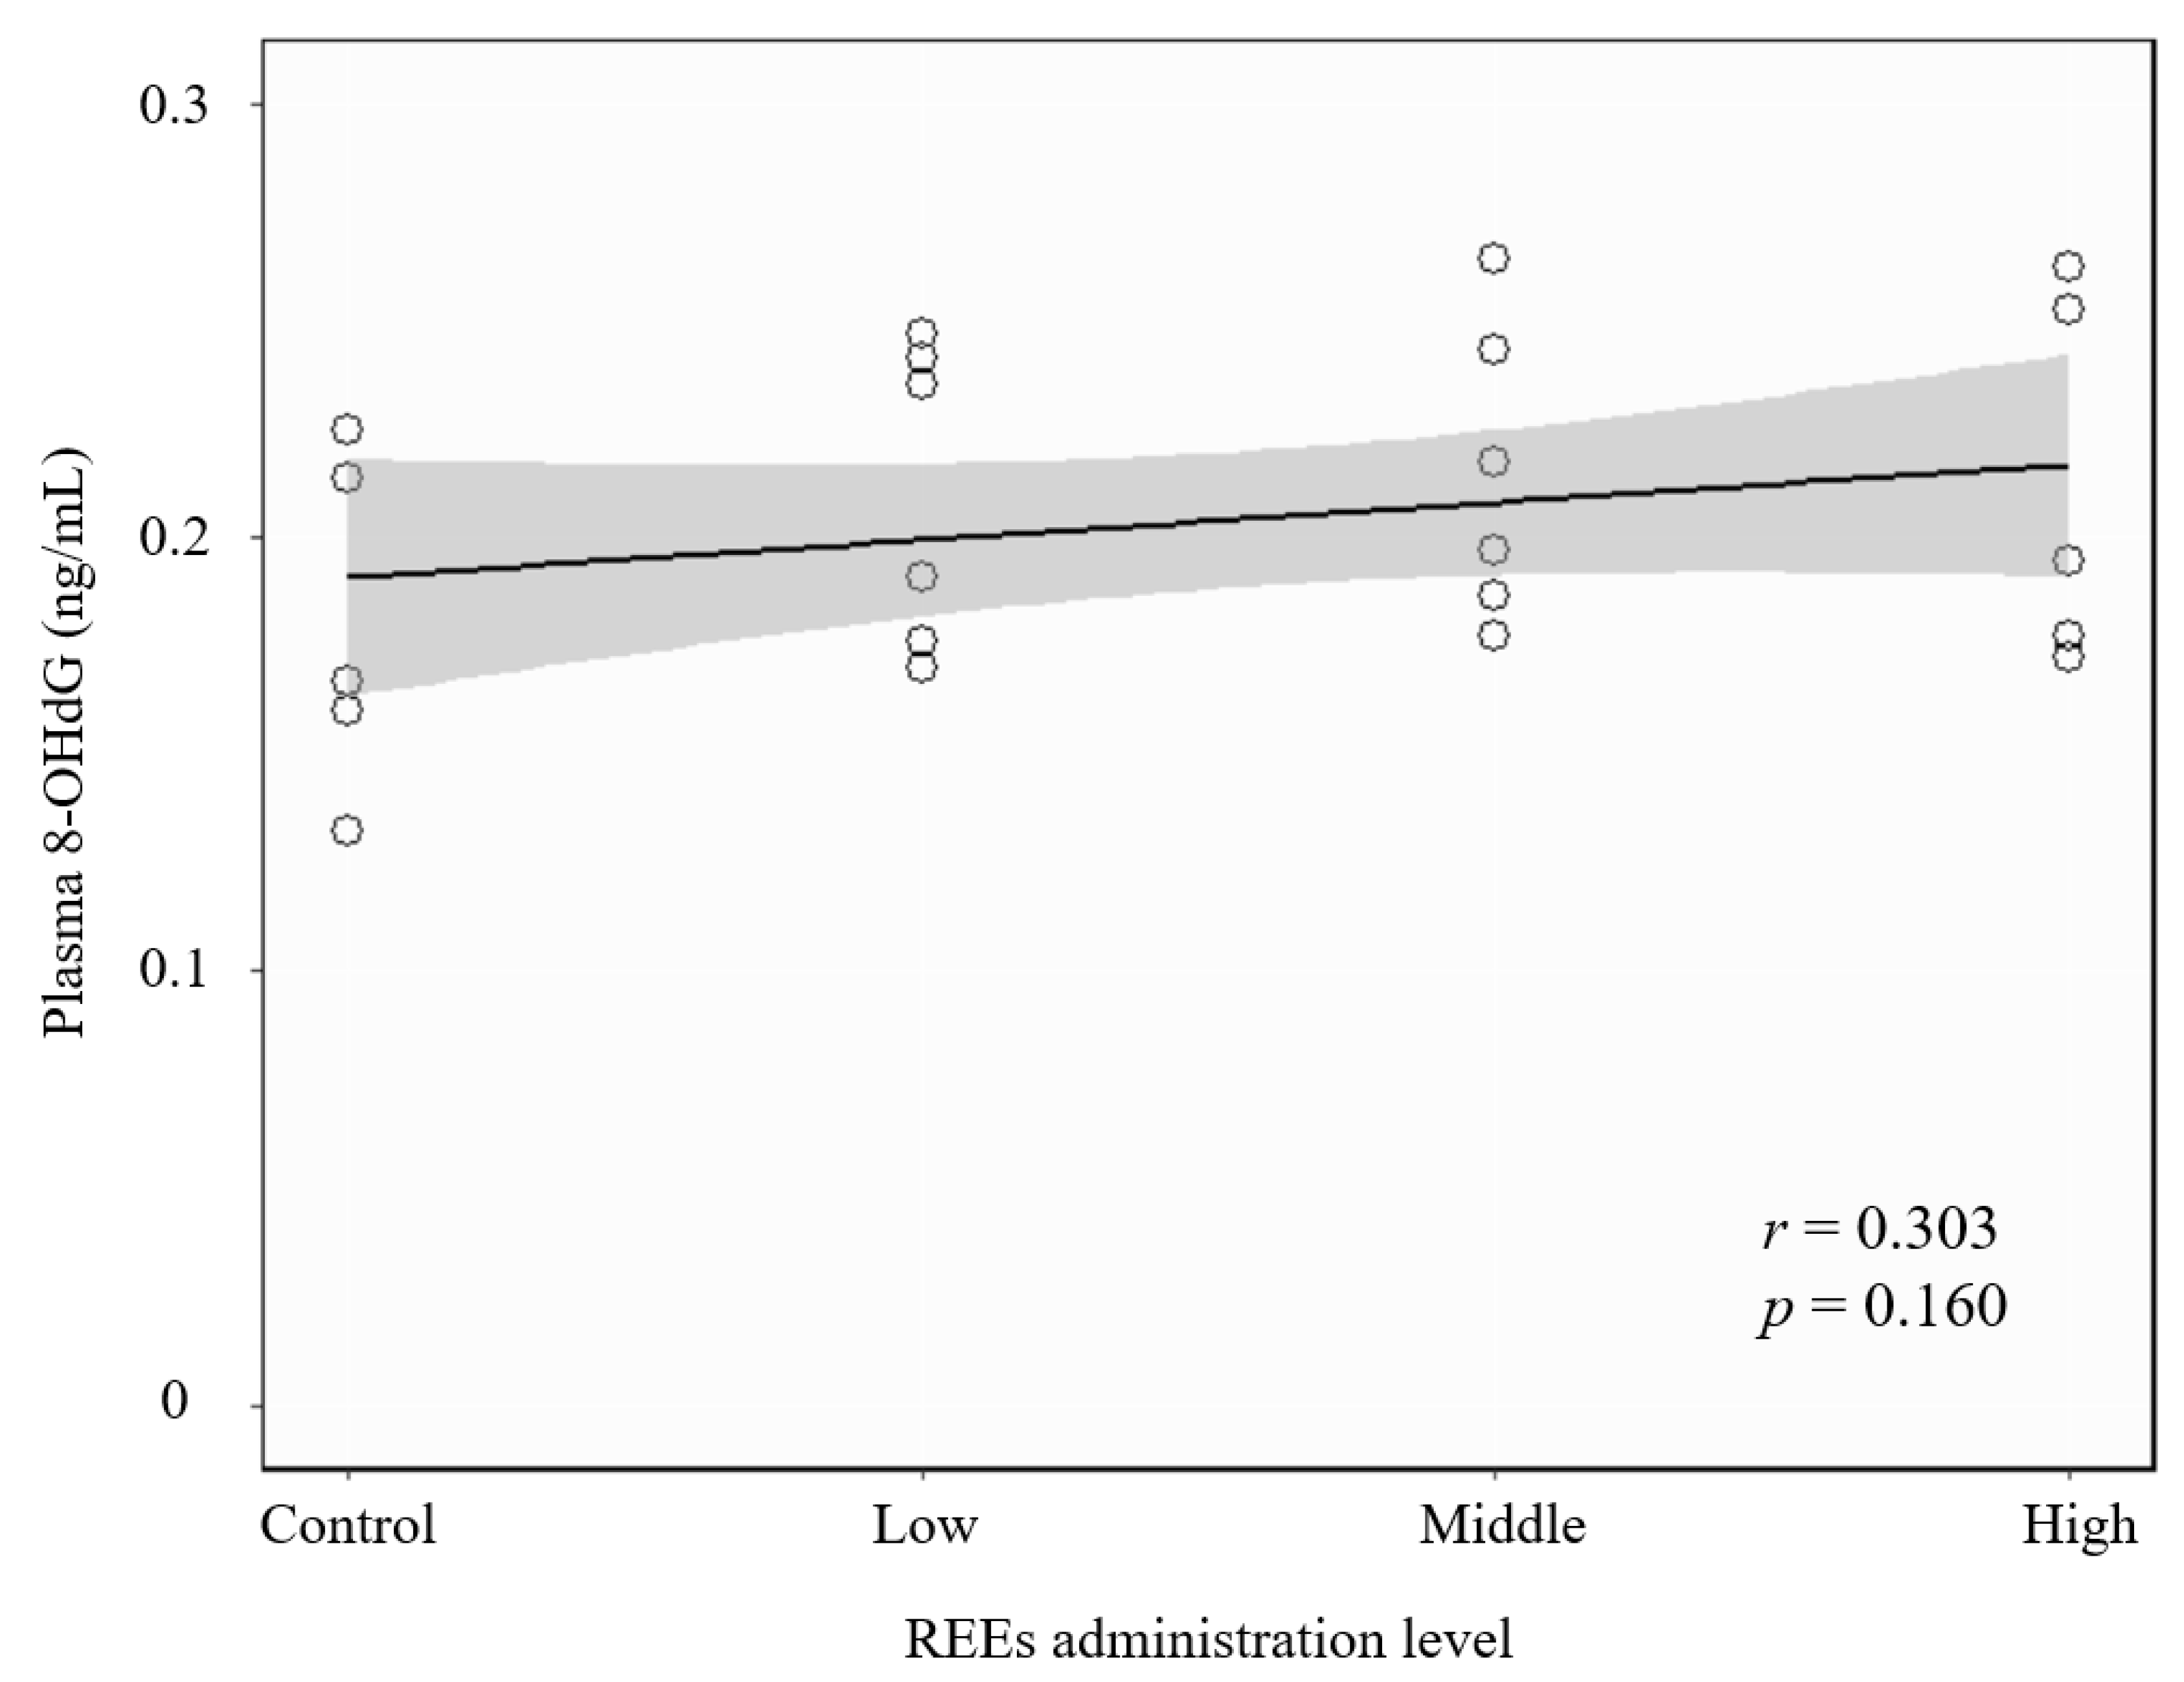
3.3. Correlation between REE Administration and Oxidative Stress Damage
4. Discussion
Limitations, Advantages, and Implications
5. Conclusions
Supplementary Materials
Author Contributions
Funding
Institutional Review Board Statement
Informed Consent Statement
Data and materials availability
Acknowledgments
Conflicts of Interest
References
- Pagano, G.; Thomas, P.J.; Di Nunzio, A.; Trifuoggi, M. Human exposures to rare earth elements: Present knowledge and research prospects. Environ. Res. 2019, 171, 493–500. [Google Scholar] [CrossRef]
- Hurst, C. China’s Rare Earth Elements Industry: What Can the West Learn? Institute for the Analysis of Global Security (IAGS): Madrid, Spain, 2010. [Google Scholar]
- Pang, X.; Li, D.; Peng, A. Application of rare-earth elements in the agriculture of China and its environmental behavior in soil. Environ. Sci. Pollut. Res. Int. 2002, 9, 143–148. [Google Scholar] [CrossRef]
- Xu, X.; Zhu, W.; Wang, Z.; Witkamp, G.J. Distributions of rare earths and heavy metals in field-grown maize after application of rare earth-containing fertilizer. Sci. Total Environ. 2002, 293, 97–105. [Google Scholar] [CrossRef]
- Zhao, F.H.; Cong, Z.Y.; Sun, H.F.; Ren, D.Y. The geochemistry of rare earth elements (REE) in acid mine drainage from the Sitai coal mine, Shanxi Province, North China. Int. J. Coal. Geol. 2007, 70, 184–192. [Google Scholar] [CrossRef]
- Taggart, R.K.; Hower, J.C.; Dwyer, G.S.; Hsu-Kim, H. Trends in the Rare Earth Element Content of U.S.-Based Coal Combustion Fly Ashes. Environ. Sci. Technol. 2016, 50, 5919–5926. [Google Scholar] [CrossRef]
- Zhang, Y.X.; Tao, S.; Cao, J.; Coveney, R.M. Emission of polycyclic aromatic hydrocarbons in China by county. Environ. Sci. Technol. 2007, 41, 683–687. [Google Scholar] [CrossRef]
- Wang, B.; Zhu, Y.B.; Pang, Y.M.; Xie, J.; Hao, Y.X.; Yan, H.N.; Li, Z.W.; Ye, R.W. Indoor air pollution affects hypertension risk in rural women in Northern China by interfering with the uptake of metal elements: A preliminary cross-sectional study. Environ. Pollut. 2018, 240, 267–272. [Google Scholar] [CrossRef] [PubMed]
- Wang, B.; Yan, L.L.; Huo, W.H.; Lu, Q.; Cheng, Z.X.; Zhang, J.X.; Li, Z.W. Rare earth elements and hypertension risk among housewives: A pilot study in Shanxi Province, China. Environ. Pollut. 2017, 220, 837–842. [Google Scholar] [CrossRef]
- Wang, Z.W.; Chen, Z.; Zhang, L.F.; Wang, X.; Hao, G.; Zhang, Z.G.; Shao, L.; Tian, Y.; Dong, Y.; Zheng, C.Y.; et al. Status of Hypertension in China Results from the China Hypertension Survey, 2012–2015. Circulation 2018, 137, 2344–2356. [Google Scholar] [CrossRef] [PubMed]
- Li, M.S.; Zhuang, L.L.; Zhang, G.H.; Lan, C.X.; Yan, L.L.; Liang, R.; Hao, C.F.; Li, Z.W.; Zhang, J.X.; Lu, Q.; et al. Association between exposure of light rare earth elements and outcomes of in vitro fertilization-embryo transfer in North China. Sci. Total Environ. 2021, 762, 143106. [Google Scholar] [CrossRef]
- Sang, X.Z.; Ze, X.; Gui, S.X.; Wang, X.C.; Hong, J.; Ze, Y.G.; Zhao, X.Y.; Sheng, L.; Sun, Q.Q.; Yu, X.H.; et al. Kidney Injury and Alterations of Inflammatory Cytokine Expressions in Mice Following Long-Term Exposure to Cerium Chloride. Environ. Toxicol. 2014, 29, 1420–1427. [Google Scholar] [CrossRef]
- Cheng, J.; Cheng, Z.; Hu, R.; Cui, Y.; Cai, J.; Li, N.; Gui, S.; Sang, X.; Sun, Q.; Wang, L.; et al. Immune dysfunction and liver damage of mice following exposure to lanthanoids. Environ. Toxicol. 2014, 29, 64–73. [Google Scholar] [CrossRef]
- Ji, J.; Hong, F.; Zhou, Y.; Liu, T.; Fan, D.; Zhang, X.; Lu, Y.; Jiang, L.; Wang, X.; Wang, C. Molecular mechanisms associated with oxidative damage in the mouse testis induced by LaCl3. Environ. Toxicol. 2021, 36, 408–416. [Google Scholar] [CrossRef]
- Zhao, Y.; Liang, J.; Meng, H.; Yin, Y.; Zhen, H.; Zheng, X.; Shi, H.; Wu, X.; Zu, Y.; Wang, B.; et al. Rare Earth Elements Lanthanum and Praseodymium Adversely Affect Neural and Cardiovascular Development in Zebrafish (Danio rerio). Environ. Sci. Technol. 2021, 55, 1155–1166. [Google Scholar] [CrossRef] [PubMed]
- Li, R.J.; Zhou, Y.L.; Liu, W.; Li, Y.; Qin, Y.; Yu, L.L.; Chen, Y.H.; Xu, Y.J. Rare earth element lanthanum protects against atherosclerosis induced by high-fat diet via down-regulating MAPK and NF-kappa B pathways. Ecotoxicol. Environ. Saf. 2021, 207, 111195. [Google Scholar] [CrossRef] [PubMed]
- Li, R.; Yu, L.; Qin, Y.; Zhou, Y.; Liu, W.; Li, Y.; Chen, Y.; Xu, Y. Protective effects of rare earth lanthanum on acute ethanol-induced oxidative stress in mice via Keap 1/Nrf2/p62 activation. Sci. Total. Environ. 2021, 758, 143626. [Google Scholar] [CrossRef] [PubMed]
- Zanoli, L.; Lentini, P.; Briet, M.; Castellino, P.; House, A.A.; London, G.M.; Malatino, L.; McCullough, P.A.; Mikhailidis, D.P.; Boutouyrie, P. Arterial Stiffness in the Heart Disease of CKD. J. Am. Soc. Nephrol. 2019, 30, 918–928. [Google Scholar] [CrossRef]
- Gates, P. Arteriosclerosis with superimposed atherosclerosis is the cause not the consequence of essential hypertension. Med. Hypotheses 2020, 144, 110236. [Google Scholar] [CrossRef]
- Li, X.; Chen, Z.; Chen, Z.; Zhang, Y. A human health risk assessment of rare earth elements in soil and vegetables from a mining area in Fujian Province, Southeast China. Chemosphere 2013, 93, 1240–1246. [Google Scholar] [CrossRef] [Green Version]
- Wei, B.; Li, Y.; Li, H.; Yu, J.; Ye, B.; Liang, T. Rare earth elements in human hair from a mining area of China. Ecotoxicol. Environ. Saf. 2013, 96, 118–123. [Google Scholar] [CrossRef]
- Zhu, H.; Ouyang, L.; Zhang, Y.; Chen, R.; Liu, Q.; Liu, H.; Wang, K.; Wang, N.; Liu, Y. Dietary intake and burden of lanthanide in main organs and tissues for Chinese man. Chin. J. Radiol. Med. Prot. 2004, 24, 1–5. [Google Scholar]
- Ren, M.; Jia, X.; Shi, J.; Yan, L.; Li, Z.; Lan, C.; Chen, J.; Li, N.; Li, K.; Huang, J.; et al. Simultaneous analysis of typical halogenated endocrine disrupting chemicals and metal(loid)s in human hair. Sci. Total Environ. 2020, 718, 137300. [Google Scholar] [CrossRef]
- Cao, B.; Wu, J.; Xu, C.; Chen, Y.; Xie, Q.; Ouyang, L.; Wang, J. The Accumulation and Metabolism Characteristics of Rare Earth Elements in Sprague-Dawley Rats. Int. J. Environ. Res. Public Health 2020, 17, 1399. [Google Scholar] [CrossRef] [Green Version]
- Wei, J.; Wang, C.; Yin, S.; Pi, X.; Jin, L.; Li, Z.; Liu, J.; Wang, L.; Yin, C.; Ren, A. Concentrations of rare earth elements in maternal serum during pregnancy and risk for fetal neural tube defects. Environ. Int. 2020, 137, 105542. [Google Scholar] [CrossRef]
- Li, X.F.; Chen, Z.B.; Chen, Z.Q. Distribution and fractionation of rare earth elements in soil-water system and human blood and hair from a mining area in southwest Fujian Province, China. Environ. Earth Sci. 2014, 72, 3599–3608. [Google Scholar] [CrossRef]
- Huo, W.H.; Zhu, Y.B.; Li, Z.J.; Pang, Y.M.; Wang, B.; Li, Z.W. A pilot study on the association between rare earth elements in maternal hair and the risk of neural tube defects in north China. Environ. Pollut. 2017, 226, 89–93. [Google Scholar] [CrossRef] [PubMed]
- Pang, Y.M.; Yan, L.L.; Ren, M.Y.; Jia, X.Q.; Liu, T.X.; Du, W.; Wang, B.; Li, Z.W.; Lu, Q. Environmental complex exposure and the risk of influenza-like illness among housewives: A case study in Shanxi Province, China. Ecotoxicol. Environ. Saf. 2020, 194, 110405. [Google Scholar] [CrossRef] [PubMed]
- Todorov, L.; Kostova, I.; Traykova, M. Lanthanum, Gallium and their Impact on Oxidative Stress. Curr. Med. Chem. 2019, 26, 4280–4295. [Google Scholar] [CrossRef] [PubMed]
- Marubashi, K.; Hirano, S.; Suzuki, K.T. Effects of intratracheal pretreatment with yttrium chloride (YCl3) on inflammatory responses of the rat lung following intratracheal instillation of YCl3. Toxicol. Lett. 1998, 99, 43–51. [Google Scholar] [CrossRef]
- Huang, P.; Li, J.; Zhang, S.; Chen, C.; Han, Y.; Liu, N.; Xiao, Y.; Wang, H.; Zhang, M.; Yu, Q.; et al. Effects of lanthanum, cerium, and neodymium on the nuclei and mitochondria of hepatocytes: Accumulation and oxidative damage. Environ. Toxicol. Pharmacol. 2011, 31, 25–32. [Google Scholar] [CrossRef]
- Noguchi, T.; Ikeda, K.; Sasaki, Y.; Yamamoto, J.; Yamori, Y. Effects of vitamin E and sesamin on hypertension and cerebral thrombogenesis in stroke-prone spontaneously hypertensive rats. Clin. Exp. Pharmacol. Physiol. 2004, 31 (Suppl. 2), S24–S26. [Google Scholar] [CrossRef] [PubMed]
- Owaki, Y.; Watanabe, K.; Iwasaki, A.; Saitou, T.; Matsushita, H.; Wakatsuki, A. Placental hypoplasia and maternal organic vascular disorder in pregnant women with gestational hypertension and preeclampsia. J. Matern. -Fetal Neonatal Med. 2021, 34, 353–359. [Google Scholar] [CrossRef] [PubMed]
- Mukohda, M.; Mizuno, R.; Ozaki, H. Increased Blood Pressure Causes Lymphatic Endothelial Dysfunction via Oxidative Stress in Spontaneously Hypertensive Rats. Hypertension 2020, 76, 598–606. [Google Scholar] [CrossRef] [PubMed]
- Guzik, T.J.; Touyz, R.M. Oxidative Stress, Inflammation, and Vascular Aging in Hypertension. Hypertension 2017, 70, 660–667. [Google Scholar] [CrossRef] [PubMed]


| REEs | Control | Low | Middle | High | Ptrendc |
|---|---|---|---|---|---|
| Unit: ng/g rat’s fur | Stage-I | ||||
| La | 1349 ± 1088 a | 505 ± 218 | 400 ± 164 | 497 ± 364 | 0.031 |
| Ce | 4308 ± 2460 | 1661 ± 397 | 975 ± 290 | 6095 ± 7335 | 0.972 |
| Pr | 364 ± 395 | / | 209 ± 207 | 117.18 | / |
| Nd | 1139 ± 1332 | / | / | 196 ± 155 | / |
| Sm | 208 ± 149 | 112 ± 45.8 | 213 ± 308 | 126 ± 43.9 | 0.776 |
| Eu | 746 ± 868 | 334 ± 253 | 706 ± 944 | 218 ± 127 | 0.318 |
| Gd | 545 ± 719 | / | 329.11 | 538 | / |
| Tb | 509 ± 527 | 97.9 ± 58.2 | 291 ± 241 | 193 ± 192 | 0.211 |
| Dy | 254 ± 153 | 66.4 ± 42.9 | 187 ± 224 | 56.7 ± 47.7 | 0.124 |
| Ho | 104 ± 34.0 | 49.7 ± 11.7 | 135 ± 213 | 34.6 ± 14.9 | 0.550 |
| Er | 114 ± 74.75 | 107 ± 140 | 156 ± 216 | 34.2 ± 28.6 | 0.446 |
| Tm | 24.548 ± 13.9 | 5.86 | 189 ± 277 | 22.8 ± 12.2 | 0.952 |
| Yb | 94.7 ± 74.4 | 26.1 ± 15.1 | 204 ± 272 | 40.4 ± 30.7 | 0.985 |
| Y | 1002 ± 486 | 423.5 ± 138.3 | 480 ± 227 | 285 ± 205 | 0.001 |
| ΣREEs b | 9501 ± 6389 | 2887 ± 504 | 3482 ± 2173 | 4208 ± 6492 | 0.079 |
| Stage-II | |||||
| La | 1068 ± 375 | 1266 ± 624 | 1725 ± 622 | 6368 ± 3063 | 0.002 |
| Ce | 2214 ± 1151 | 2281 ± 1138 | 2303 ± 558 | 5848 ± 3094 | <0.001 |
| Pr | 295 ± 148 | 444 ± 447 | 326 ± 111 | 1353 ± 782 | <0.001 |
| Nd | 792 ± 242 | 1504 ± 1575 | 1230 ± 500 | 5185 ± 3109 | <0.001 |
| Sm | 179 ± 93.3 | 177 ± 71.1 | 269 ± 92 | 1033 ± 595 | 0.009 |
| Eu | 257 ± 138 | 124 ± 37.9 | 255 ± 179 | 433 ± 156 | 0.005 |
| Gd | 273 ± 180 | 457 ± 539 | 344 ± 130 | 1629 ± 928 | 0.006 |
| Tb | 185 ± 218 | 246 ± 69.3 | 167 ± 49.8 | 297 ± 96.5 | 0.034 |
| Dy | 166 ± 106 | 156 ± 68.9 | 249 ± 76 | 962 ± 439 | 0.004 |
| Ho | 29.5 ± 15.7 | 28.4 ± 10.5 | 43.6 ± 14.7 | 175 ± 61.3 | 0.002 |
| Er | 98.4 ± 48.5 | 108 ± 38.9 | 163.1032 ± 57.7 | 683 ± 305 | 0.029 |
| Tm | 16.5 ± 12.0 | 16.3 ± 8.88 | 21.5 ± 6.06 | 107 ± 37.9 | <0.001 |
| Yb | 123 ± 107 | 113 ± 47 | 168 ± 60.3 | 686 ± 303 | 0.003 |
| Y | 549 ± 113 | 747 ± 236 | 924 ± 314 | 2541 ± 1049 | 0.018 |
| ΣREEs | 5938 ± 2129 | 7513 ± 3952 | 8252 ± 2039 | 30,693 ± 149,23 | 0.007 |
| Stage-III | |||||
| La | 497 ± 205 | 904 ± 942 | 417 ± 229 | 3927 ± 1476 | 0.002 |
| Ce | 542 ± 337 | 1398 ± 1349 | 948 ± 424 | 3717 ± 1358 | <0.001 |
| Pr | 115 ± 83 | 195 ± 220 | 407 ± 215 | 1255 ± 407 | <0.001 |
| Nd | 518 ± 324 | 918 ± 1100 | 1701 ± 905 | 5098 ± 1397 | <0.001 |
| Sm | 55.4 ± 47.4 | 347 ± 309 | 32.9 ± 32.7 | 693 ± 330 | 0.009 |
| Eu | / | 129 | 131 ± 137 | 316 ± 96 | / |
| Gd | 253 ± 123 | 243 ± 250 | 579 ± 377 | 1636 ± 602 | <0.001 |
| Tb | 1338 ± 2216 | 110 ± 67.9 | 733 ± 759 | 651 ± 621 | 0.464 |
| Dy | 150 ± 151 | 66.8 ± 65.8 | 60.1 ± 34.9 | 638 ± 286 | 0.004 |
| Ho | 44.9 | 1.65 | / | 76.2 ± 37.3 | / |
| Er | 65.8 ± 87.4 | 36.5 | 16.5 ± 21.6 | 338 ± 158 | 0.029 |
| Tm | 3.5 | / | / | 46.6 ± 28.6 | / |
| Yb | 70.1 ± 84.4 | 14.3 ± 11.2 | 30.9 ± 21.7 | 354 ± 131 | 0.003 |
| Y | 500 ± 697 | 218 ± 175 | 230 ± 108 | 1326 ± 443 | 0.018 |
| ΣREEs | 3285 ± 2745 | 5245 ± 7424 | 4891 ± 1952 | 18,732 ± 6630 | 0.001 |
| REEs | Control | Low | Middle | High | Ptrendc |
|---|---|---|---|---|---|
| Plasma (unit: ng/mL) | |||||
| La | 69.8 ± 9.02 a | 70.2 ± 48.4 | 89.7 ± 90.6 | 78.9 ± 56.1 | 0.655 |
| Ce | 209 ± 131 | 261 ± 265 | 669 ± 446 | 205 ± 165 | 0.497 |
| Pr | 14.5 ± 9.12 | 20.8 ± 20.9 | 67.0 ± 39.2 | 26.6 ± 16.2 | 0.168 |
| Nd | 82.7 ± 82.1 | 54.1 ± 64.4 | 287 ± 291 | 78.1 ± 49.3 | 0.663 |
| Sm | 14.0 ± 4.60 | 12.7 ± 10.4 | 23.6 ± 19.3 | 15.6 ± 12.4 | 0.509 |
| Eu | 3.29 ± 3.68 | 3.80 ± 4.28 | 10.9 ± 7.60 | 5.38 ± 4.83 | 0.414 |
| Gd | 23.1 ± 18.2 | 14.1 ± 19.5 | 40.4 ± 33.8 | 13.5 ± 7.72 | 0.853 |
| Tb | 26.5 ± 13.5 | 23.3 ± 19.5 | 73.9 ± 131 | 110 ± 110 | 0.128 |
| Dy | 10.3 ± 4.88 | 11.0 ± 9.40 | 24.1 ± 23.5 | 16.3 ± 7.40 | 0.235 |
| Ho | 6.43 ± 3.34 | 11.7 ± 3.10 | 19.4 ± 5.22 | 21.9 ± 3.48 | <0.001 |
| Er | 5.03 ± 4.08 | 9.29 ± 10.8 | 19.1 ± 20.0 | 9.44 ± 7.65 | 0.473 |
| Tm | 10.3 ± 10.3 | 3.60 ± 0.570 | 4.11 ± 2.01 | 1.39 ± 0.90 | 0.032 |
| Yb | 4.11 ± 4.30 | 46.8 ± 57.3 | 14.1 ± 18.9 | 13.7 ± 9.97 | 0.857 |
| Y | 85.1 ± 70.5 | 58.7 ± 40.3 | 82.3 ± 74.6 | 49.8 ± 28.2 | 0.420 |
| ΣREEs b | 526 ± 266 | 468 ± 413 | 1167 ± 833 | 583 ± 231 | 0.394 |
| Blood cell (unit: ng/g) | |||||
| La | 338 ± 307 | 222 ± 129 | 314 ± 199 | 284 ± 193 | 0.655 |
| Ce | 2287 ± 1659 | 963 ± 596 | 1482 ± 730 | 1268 ± 676 | 0.497 |
| Pr | 116 ± 108 | 87.8 ± 53.8 | 97.0 ± 61.5 | 79.5 ± 59.9 | 0.168 |
| Nd | 334 ± 334 | 334 ± 189 | 319 ± 148 | 255 ± 162 | 0.663 |
| Sm | 81.8 ± 74.8 | 57.2 ± 35.3 | 66.3 ± 45.1 | 51.0 ± 34.3 | 0.352 |
| Eu | 45.7 ± 35.9 | 24.6 ± 15.5 | 31.6 ± 17.8 | 17.6 ± 10.6 | 0.235 |
| Gd | 176 ± 170 | 106 ± 65.2 | 215 ± 115 | 113 ± 70.7 | 0.685 |
| Tb | 477 ± 224 | 296 ± 178 | 1095 ± 412 | 658 ± 500 | 0.347 |
| Dy | 57.9 ± 53.4 | 44.1 ± 29.6 | 52.1 ± 27.8 | 34.1 ± 19.5 | 0.313 |
| Ho | 9.17 ± 9.57 | 5.00 ± 3.17 | 5.85 ± 4.62 | 3.72 ± 1.93 | 0.179 |
| Er | 30.5 ± 25.0 | 23.3 ± 13.7 | 25.9 ± 15.1 | 20.5 ± 10.6 | 0.365 |
| Tm | 10.9 ± 7.48 | 6.39 ± 3.94 | 14.0 ± 9.75 | 4.94 ± 2.92 | 0.428 |
| Yb | 27.3 ± 27.7 | 19.1 ± 15.2 | 29.9 ± 18.7 | 17.9 ± 6.64 | 0.650 |
| Y | 306 ± 143 | 365 ± 251 | 536 ± 481 | 213 ± 91.5 | 0.420 |
| ΣREEs | 4297 ± 2740 | 2129 ± 1240 | 4101 ± 1168 | 3015 ± 1501 | 0.598 |
| Groups | β | p | β | p |
|---|---|---|---|---|
| Systolic blood pressure | Diastolic blood pressure | |||
| Control | 0 | 0 | ||
| Low | 9.93 (−1.54–21.4) | 0.090 | 10.2 (−8.30–28.7) | 0.279 |
| Middle | −9.11 (−20.6–2.36) | 0.119 | −7.41 (−25.9–11.1) | 0.433 |
| High | 5.26 (−6.21–16.7) | 0.369 | 8.67 (−9.85–27.2) | 0.359 |
| Heart rate | Pulse pressure | |||
| Control | 0 | 0 | ||
| Low | 13.6 (−25.3–52.4) | 0.494 | −0.11 (−9.24–9.02) | 0.981 |
| Middle | −23.2 (−62.0–15.6) | 0.242 | −1.44 (−10.6–7.68) | 0.756 |
| High | 14.8 (−24.1–53.6) | 0.456 | −3.33 (−12.5–5.80) | 0.474 |
Publisher’s Note: MDPI stays neutral with regard to jurisdictional claims in published maps and institutional affiliations. |
© 2021 by the authors. Licensee MDPI, Basel, Switzerland. This article is an open access article distributed under the terms and conditions of the Creative Commons Attribution (CC BY) license (https://creativecommons.org/licenses/by/4.0/).
Share and Cite
Pang, Y.; Jiang, J.; Li, K.; Yan, L.; Feng, Y.; Wang, J.; Cao, X.; Li, Z.; Wang, B. Effects of Rare Earth Elements on Blood Pressure and Their Exposure Biomarkers: Evidence from Animal Experiments. Int. J. Environ. Res. Public Health 2021, 18, 9836. https://doi.org/10.3390/ijerph18189836
Pang Y, Jiang J, Li K, Yan L, Feng Y, Wang J, Cao X, Li Z, Wang B. Effects of Rare Earth Elements on Blood Pressure and Their Exposure Biomarkers: Evidence from Animal Experiments. International Journal of Environmental Research and Public Health. 2021; 18(18):9836. https://doi.org/10.3390/ijerph18189836
Chicago/Turabian StylePang, Yiming, Jianjun Jiang, Kexin Li, Lailai Yan, Yanqiu Feng, Junli Wang, Xiaolu Cao, Zhiwen Li, and Bin Wang. 2021. "Effects of Rare Earth Elements on Blood Pressure and Their Exposure Biomarkers: Evidence from Animal Experiments" International Journal of Environmental Research and Public Health 18, no. 18: 9836. https://doi.org/10.3390/ijerph18189836
APA StylePang, Y., Jiang, J., Li, K., Yan, L., Feng, Y., Wang, J., Cao, X., Li, Z., & Wang, B. (2021). Effects of Rare Earth Elements on Blood Pressure and Their Exposure Biomarkers: Evidence from Animal Experiments. International Journal of Environmental Research and Public Health, 18(18), 9836. https://doi.org/10.3390/ijerph18189836