Article

Influence of the Area per Player in Non-Professional Soccer Players: A Pilot Study Focused on Positional Roles

1
Dipartimento di Scienze Motorie e del Benessere, Università degli Studi di Napoli Parthenope, 80133 Naples, Italy
2
CEINGE-Biotecnologie Avanzate, 80133 Naples, Italy
3
IRCCS SDN, 80133 Naples, Italy
*
Author to whom correspondence should be addressed.
These authors contributed equally.
Int. J. Environ. Res. Public Health 2021, 18(18), 9833; https://doi.org/10.3390/ijerph18189833
Submission received: 7 July 2021 / Revised: 15 September 2021 / Accepted: 16 September 2021 / Published: 18 September 2021

Abstract

:
This study analyses the influence of different area per player (AP; 75, 98 and 131 m2) on the average metabolic power (MP) and other soccer-related performance variables in relation to the positional roles. We recruited 19 non-professional male soccer players (25.2 ± 6.3 y; 23.7 ± 2.3 kg/m2; 16.4 ± 6.3 y soccer experience) to play three different small-sided games (SSGs): SSG1 (5 vs. 5; 30 × 30 m; 5 min), SSG2 (5 vs. 5; 35 × 45 m; 5 min) and SSG3 (7 vs. 7; 35 × 45 m; 8 min). Specific playing rules were applied. GPS-assessed soccer-related variables were: average MP (AMP), distance covered in 1 min (DIS); % time spent at high speed (v > 16 km/h; % hst) or MP (>20 W/kg; % hmpt); % distance covered at high positive/negative speed (2 < v < 4 m/s2, % ACC; −6 < v < −2 m/s2, % DEC); and number of actions at high MP (hmpa). All recorded variables differed when each SSG was compared to the others (p < 0.05), but for hmpa for attackers. Most performance variables were positively associated with increasing AP (p < 0.05), but for % ACC and % DEC, and differed among positional roles within the same SSG (p < 0.05). Here the general applicability of SSGs, regardless the physical/technical skills of the group of players, to enhance performance is confirmed; furthermore, quantitative advices on AMP and other performance variables are provided to achieve significant improvements in all soccer players of the team.

1. Introduction

Small-sided games (SSGs) are a form of conditioning in football [1,2,3] and represent an effective alternative to traditional interval training in order to improve players’ endurance with a concomitant physical, cognitive and technical/tactical development [1,2,4,5,6,7]. SSGs are now very popular because they are suitable not only for elite football players, but also for healthy and unhealthy amateurs; they enhance several components of the health-related fitness: in fact, recreational football, carried out as SSGs, has a high aerobic component (80–85% maximum heart rate, HRmax), provides a high impact on muscles and bones, and improves maximum aerobic power blood pressure and body composition [8,9,10,11,12,13].
Many SSG parameters can be modulated to achieve a specific technical/tactical improvement by changing the pitch dimension, the number of players, the game duration, the work/rest ratios, by selecting specific playing rules, by adding goalkeepers, and by using coach encouragement [2,14,15,16]. The prompt availability of balls, when out of play, and coach encouragement are the most applied rules in many experimental settings as both of them are able to increase the intensity of the game [14]. As for the other modifiable parameters, it is challenging to define their effects on specific technical/tactical variables when they are evaluated individually. For example, in small pitch dimensions many features of the match play are well simulated, but high-intensity and repeated-sprint demands are not easily reproduced [6,17]; larger pitch dimensions overestimate high-speed running in respect to match play [18]. In addition, the SSG experimental settings from current research are extremely variable and output data appear fragmented in age groups (preferentially adolescent, or elite or older soccer players), performance measures and pitch configuration. [2,14,19,20,21].
As a matter of fact, an effective SSG relies not only on the application of the single parameters quoted above but also on derived factors, such as the relative pitch area, also called area per player (AP). SSGs characterized by match-derived AP (~320 m2) show an increase in inter-team and intra-team distances, and allow to better simulate the tactical demands of the official match, above all with a larger number of players [22,23].
Nevertheless, many SSG formats are characterized by lower AP, usually less than 200 m2 [2,24,25,26]; such SSGs show an higher player density, while reducing both the space for running and the time available to make technical/tactical decisions [23].
Randers and colleagues showed that keeping constant AP, while changing the number of players, had a negligible effect on the total covered distance and on the total distance covered per minute [21]; moreover, the same authors found that increasing AP, while decreasing the number of players, determined higher recorded values in both variables [27,28]. When the effect of six different AP on physiological response and technical skills in two young soccer groups (under 12, U-12, and under 14, U-14) was investigated, exercise intensity, assessed as % HRmax, increased going from 40 m2 to 150 m2 [25].
Lately, a different indicator, the metabolic power (MP), was proposed to estimate the energy cost of high-demanding locomotor activities in team sports. The rationale behind the MP approach is based on the energetic equivalence between an accelerated running on a flat terrain and an uphill running at constant speed [29,30,31]. Despite this model of analysis was debated [32,33,34], some improvements were proposed [35] and it is now widely used to classify locomotion intensity in team sports by means of global positioning system (GPS) devices [36,37].
In the last decade technology has gained an instrumental role in quantifying the demand in training and competitions [38]. GPS devices represent an effective support to the analysis of SSG variables and are now common tools to assess players’ performance in team sports [39]. GPS receivers are considered reliable and have been validated in several team sport motion activities [21,30,31,40,41]. GPS technology is able to evaluate the total distance and/or the time spent in a specific soccer-related kinematical variable [30]; moreover, it allows the MP and the estimated energy cost during acceleration and/or deceleration activities to be quantified, in order to better calculate, through a mathematical approach, the metabolic and mechanical load of soccer players [42].
In this scenario, the present pilot study investigated the influence of different AP on the average MP (AMP) and other soccer-related performance variables in non-professional male soccer players in correlation with their positional role. A scheme of SSGs, similar to that proposed by Gaudino and coll. [31] on 26 elite soccer players in the English Premiere League, was adopted. Accordingly, the AP selected were: 75, 98 and 131 m2. Soccer-related performance variables included: distance, distance covered at high positive/negative speed, time spent at high speed/MP, number of actions at high MP. Positional roles included attackers, midfielders and defenders. The aims of the study were: (i) to acquire scientific evidence regarding the effects of specific SSGs on players with different skills and (ii) to provide quantitative information on the minimal AP increment that each positional role required to achieve significant improvements on AMP and on the other soccer-related performance variables.

2. Materials and Methods

2.1. Participants

Data were collected over a 10-week period from 19 non-professional male soccer players (age: 25.2 ± 6.3 years; height: 1.76 ± 0.06 m; weight: 74.2 ± 7.2 kg; BMI: 23.7 ± 2.3 kg/m2; soccer experience: 16.4 ± 6.3 years) participating to the regional championships in Italy during the in-season competition period. Recruited subjects trained regularly 3 times a week (90 min/session) and played a competitive match once a week.
Inclusion criteria for participants were: a soccer experience longer than 10 years, no partial/chronic injuries, normal vision (or corrected to normal), no history of neuropsychological impairment. All 19 soccer players matched the inclusion criteria and none were excluded.
Each player was instructed on the scope of the study, including its potential benefits and risks, and signed an informed consent (approval code by Ethical Committee of University of Naples “Federico II”: n. 376/19). The study was conducted according with the ethical standards of the Declaration of Helsinki of 2013.

2.2. Study Design

In order to acquire scientific evidence regarding the effects of specific SSGs on players with different skills, the adopted small sided game (SSG) scheme resembled one previously proposed by Gaudino et al. [31] on 26 elite soccer players in the English Premiere League. Three different SSGs were considered: SSG1 (5 vs. 5; 30 × 30 m) and SSG2 (5 vs. 5; 35 × 45 m) drills lasted 5 min, whereas in SSG3 (7 vs. 7; 35 × 45 m) soccer players were monitored for 8 min (Table 1). The explored AP were: 75, 98 and 131 m2.
Players were assigned to one of the following positional roles: attacker, midfielder and defender. To achieve a high work-rate, each game was supervised by encouraging coaches and the ball was promptly returned when out of play [43]; other specific playing rules were applied, such as 3 m-goals and ball possession limited to three consecutive touches [44,45]; moreover, in this study defenders could not go beyond the midfield line, attackers could not retreat behind the midfield line. Substitutions were not allowed; scores were not evaluated. The external load was assessed by global positioning system (GPS) devices.
SSGs were planned weekly during the standard training and were conducted on an outdoor synthetic-grass soccer pitch at the same time of day (between 6 and 8 p.m.) to limit the effects of circadian variations on heart rate measurements [46].
The training session included a 20-min warm-up, a 60-min section based on technical/tactical development, and a final 10-min cool down.
Before playing a specific SSG, the 20-min warm-up consisted of activities without the ball, such as low-intensity running, striding, skipping and stretching.

2.3. Physical Variables, Instruments, Softwares

AMP was assessed using wearable GPS-devices (Q-Starz, Taipei, Taiwan) sampling at 10 Hz. This GPS unit has excellent static and dynamic validity in a variety of settings [47,48].
GPS devices were located in a tiny pocket at the upper back of each player (above shoulder blades) and activated at least 10 min before the start of the data collection to allow the connection to satellites [31,49]. Besides AMP (W/kg), other soccer-related variables were considered as listed in Table 2.
Only GPS-based horizontal data were considered and speed was determined as horizontal position differentiation over time. The analysis was performed by the “LagalaColli_Bridge4” software (now available as GPSLAGALACOLLI at Spinitalia S.r.l., Pomezia, Italy) [40,50,51] in accordance with the manufacturer guidelines.
Due to the different duration of SSG3 compared to SSG1 and SSG2 (Table 1), physical performance parameters (Table 2) were considered as percentage (% hst, % hmpt, % ACC, % DEC) or are normalized to 1 min (AMP, DIS, hmpa) to allow comparison among the formats.
The Di Prampero equation [42], successively modified by Osgnach [29], was used to estimate the energy cost and MP:
EC = (155.4·ES5 − 30.4·ES4 − 43.3·ES3 + 46.3·ES2 + 19.5·ES + 3.6)·EM·KT
where EC = energy cost of accelerated running on grass (J/Kg·m); ES = equivalent slope (= tan(90 − arcan·g/af)); g = Earth’s acceleration gravity; af = forward acceleration; EM = equivalent of body mass = [(af2/g2) + 1]0.5; KT = 1.29 (constant). Hence,
MP(W/Kg) = EC·v
where v = velocity (m/s).
All parameters were calculated according to Osgnach [29] considering that the time spent at MP > 20 W/kg is energetically equivalent to an oxygen uptake of 57 mL/kg·min (above resting), whereas the time spent at v > 16 km/h is energetically equivalent to an accelerated/decelerated run at 20 W/kg [29].

2.4. Statistical Analysis

The data were presented as means and standard deviations (mean ± SD). Significant differences among training game formats (SSG1, SSG2, SSG3) in relation to the positional roles (or vice versa) were determined by one-way ANOVA applied to each of the dependent variables (AMP, % hst, % hmpt, % ACC, % DEC, DIS, hmpa). Whenever a significant difference was found, Fisher’s post hoc test was used.
The effect size with 95% confidence intervals (CI) was calculated by means of unbiased Hedge’s g equation, suggested to correct bias associated with small size samples [52], and interpreted as follows: <0.20: trivial; 0.20–0.59: small; 0.60–1.19: moderate; 1.20–1.99: large; ≥2.00: very large [53,54].
Two-way mixed ANOVA [within-subjects factor: SSG (SSG1, SSG2, SSG3); between-subjects factor: time-related soccer variables (% hst and % hmpt)] was performed; in the presence of positive overall effect of time-related soccer variables and/or of SSG, Fisher’s post hoc test was carried out.
All the statistical analysis were performed using Statview (Version 5 0.1) for Windows, with significance being set at p < 0.05.
Pearson’s correlation was used to determine the correlation coefficient between the measured variables in each positional role and the different AP (75, 98 and 131 m2) of the SSGs.

3. Results

The specific playing rules adopted in this pilot study affected the performance of the players in relation to their positional roles; nevertheless, interesting findings emerged on average MP and the other GPS-recorded variables by analysing soccer-specific performance within the different AP, obtained by changing the number of players or the pitch dimensions (Table 1).
Table 3 shows the mean ± SD for each analyzed soccer-related performance variable according to players’ positional role within a specific SSG; statistical analysis was performed comparing data among SSGs for the same positional role (rows) and among roles within the same SSG (columns).
Most recorded variables differed when each SSG was compared to the others (rows; p < 0.05) or when attacker’s, midfielder’s and defender’s performances were compared within the same SSG (columns; p < 0.05).
Table 4 shows the one-way ANOVA analysis related to the pairwise comparison of any analyzed variable among SSGs for the same positional role and among roles within the same SSG.
The correlation between the measured soccer-related variables in each positional role and the different AP (75, 98 and 131 m2) of the explored SSGs was evaluated, by means of Pearson’s correlation coefficient, as shown in Table 5.

3.1. Defenders

As expected, for this positional role the lowest soccer-related values were recorded compared to attackers and midfielders, in almost all SSGs (Table 3).
Comparing defenders’ performance among SSGs showed that the highest values were found in SSG2 and they always displayed a large/very large correlation from those recorded in SSG1 (Table 4), except for % distance covered at high positive/negative speed (% ACC and % DEC); in addition, the covered distance per minute (DIS) was different from the correspondent measure in SSG1 (103.5 ± 8.0 m vs. 91.8 ± 5.3 m, p < 0.05; ES: 1.37). Conversely, % ACC and % DEC showed the lowest values in SSG3 compared to SSG1 and SSG2 with a very large effect size, while no significant differences were detected between SSG1 and SSG2 (Table 4).
When defenders’ performances were then correlated to the three proposed formats (SSG1, SSG2 and SSG3) by Pearson’s correlation analysis, the MP-related variables (AMP, % hmpt and hmpa), the distance covered in a minute (DIS) and the % time spent at high speed (% hst) were found to be positively associated to increasing AP (Table 5).

3.2. Attackers

Although they moved into a similar smaller area, attackers showed sometimes significantly different GPS-recorded values than defenders (Table 3 and Table 4). Analyzing the attackers’ performance among SSGs, we found that AMP, DIS, and the % time spent at high speed or at high MP (% hst, % hmpt) in SSG2 were higher from those recorded in SSG1 with a very large effect size. A significant difference was observed in the same variables, except for the % time spent at high speed, between SSG3 and SSG1 with a large effect size. In addition, % time spent at high metabolic power by attackers in SSG2 was moderately higher than the corresponding measure in SSG3 (15.7 ± 1.9 vs. 13.5 ± 1.9, p < 0.05, ES: 1.06). As for % distance covered at high positive/negative speed (% ACC and % DEC), the lowest detected values were recorded in SSG3, differing from those in SSG1 and SSG2 with a very large correlation (Table 3 and Table 4).
For this role, the recorded values for the average MP, DIS, and the % time spent at high speed/MP (% hst and % hmpt) were found to be positively associated with the increasing AP by Pearson’s correlation analysis (Table 5).

3.3. Midfielders

The only restrained playing rule for midfielders was “ball possession limited to three consecutive touches”; hence, unlike defenders and attackers, they could play in the whole available area.
Comparing midfielders’ performance among SSGs showed that most variables were higher in SSG2 in respect to the other two formats. All the analyzed variables in SSG2, except for DIS, were significantly different from SSG3 with a moderate-to-very-large correlation (Table 3 and Table 4), whereas the average MP, DIS, and the % time spent at high speed/MP (% hst and % hmpt) differed between SSG2 and SSG1 with a very large effect size. Finally, only midfielders’ performance in % time spent at high speed largely differed between SSG3 and SSG1 (3.5 + 1.2 vs. 1.7 + 0.6, p < 0.01, ES: 1.59).
Due to their specific playing condition, the midfielders showed the highest GPS-recorded values for the MP-related and DIS variables compared to the other two positional roles in SSG1 and SSG2 with large/very large effect size; a significant difference between midfielders and defenders or attackers was also observed for AMP and DIS in SSG3 with an effect size from moderate to very large (Table 3 and Table 4). Furthermore, % time spent at high speed (% hst) outclassed defenders’ correspondent parameter in all the formats with a large/very large effect size, while a large correlation was found for % time spent/the number of action at high MP (% hmpt and hmpa) between midfielders and defenders in SSG3. The recorded values for % distance covered at high positive/negative speed (% ACC and % DEC) did not differ in comparison to the other positional roles in all formats except for a large correlation observed in the % DEC in SSG2 (Table 3 and Table 4).
Pearson’s correlation analysis, comparing the three proposed formats (SSG1, SSG2 and SSG3) to midfielders’ performances, showed a positive correlation between AMP, DIS, % time spent at high speed or at high MP (% hst and % hmpt) and increasing AP (Table 5).

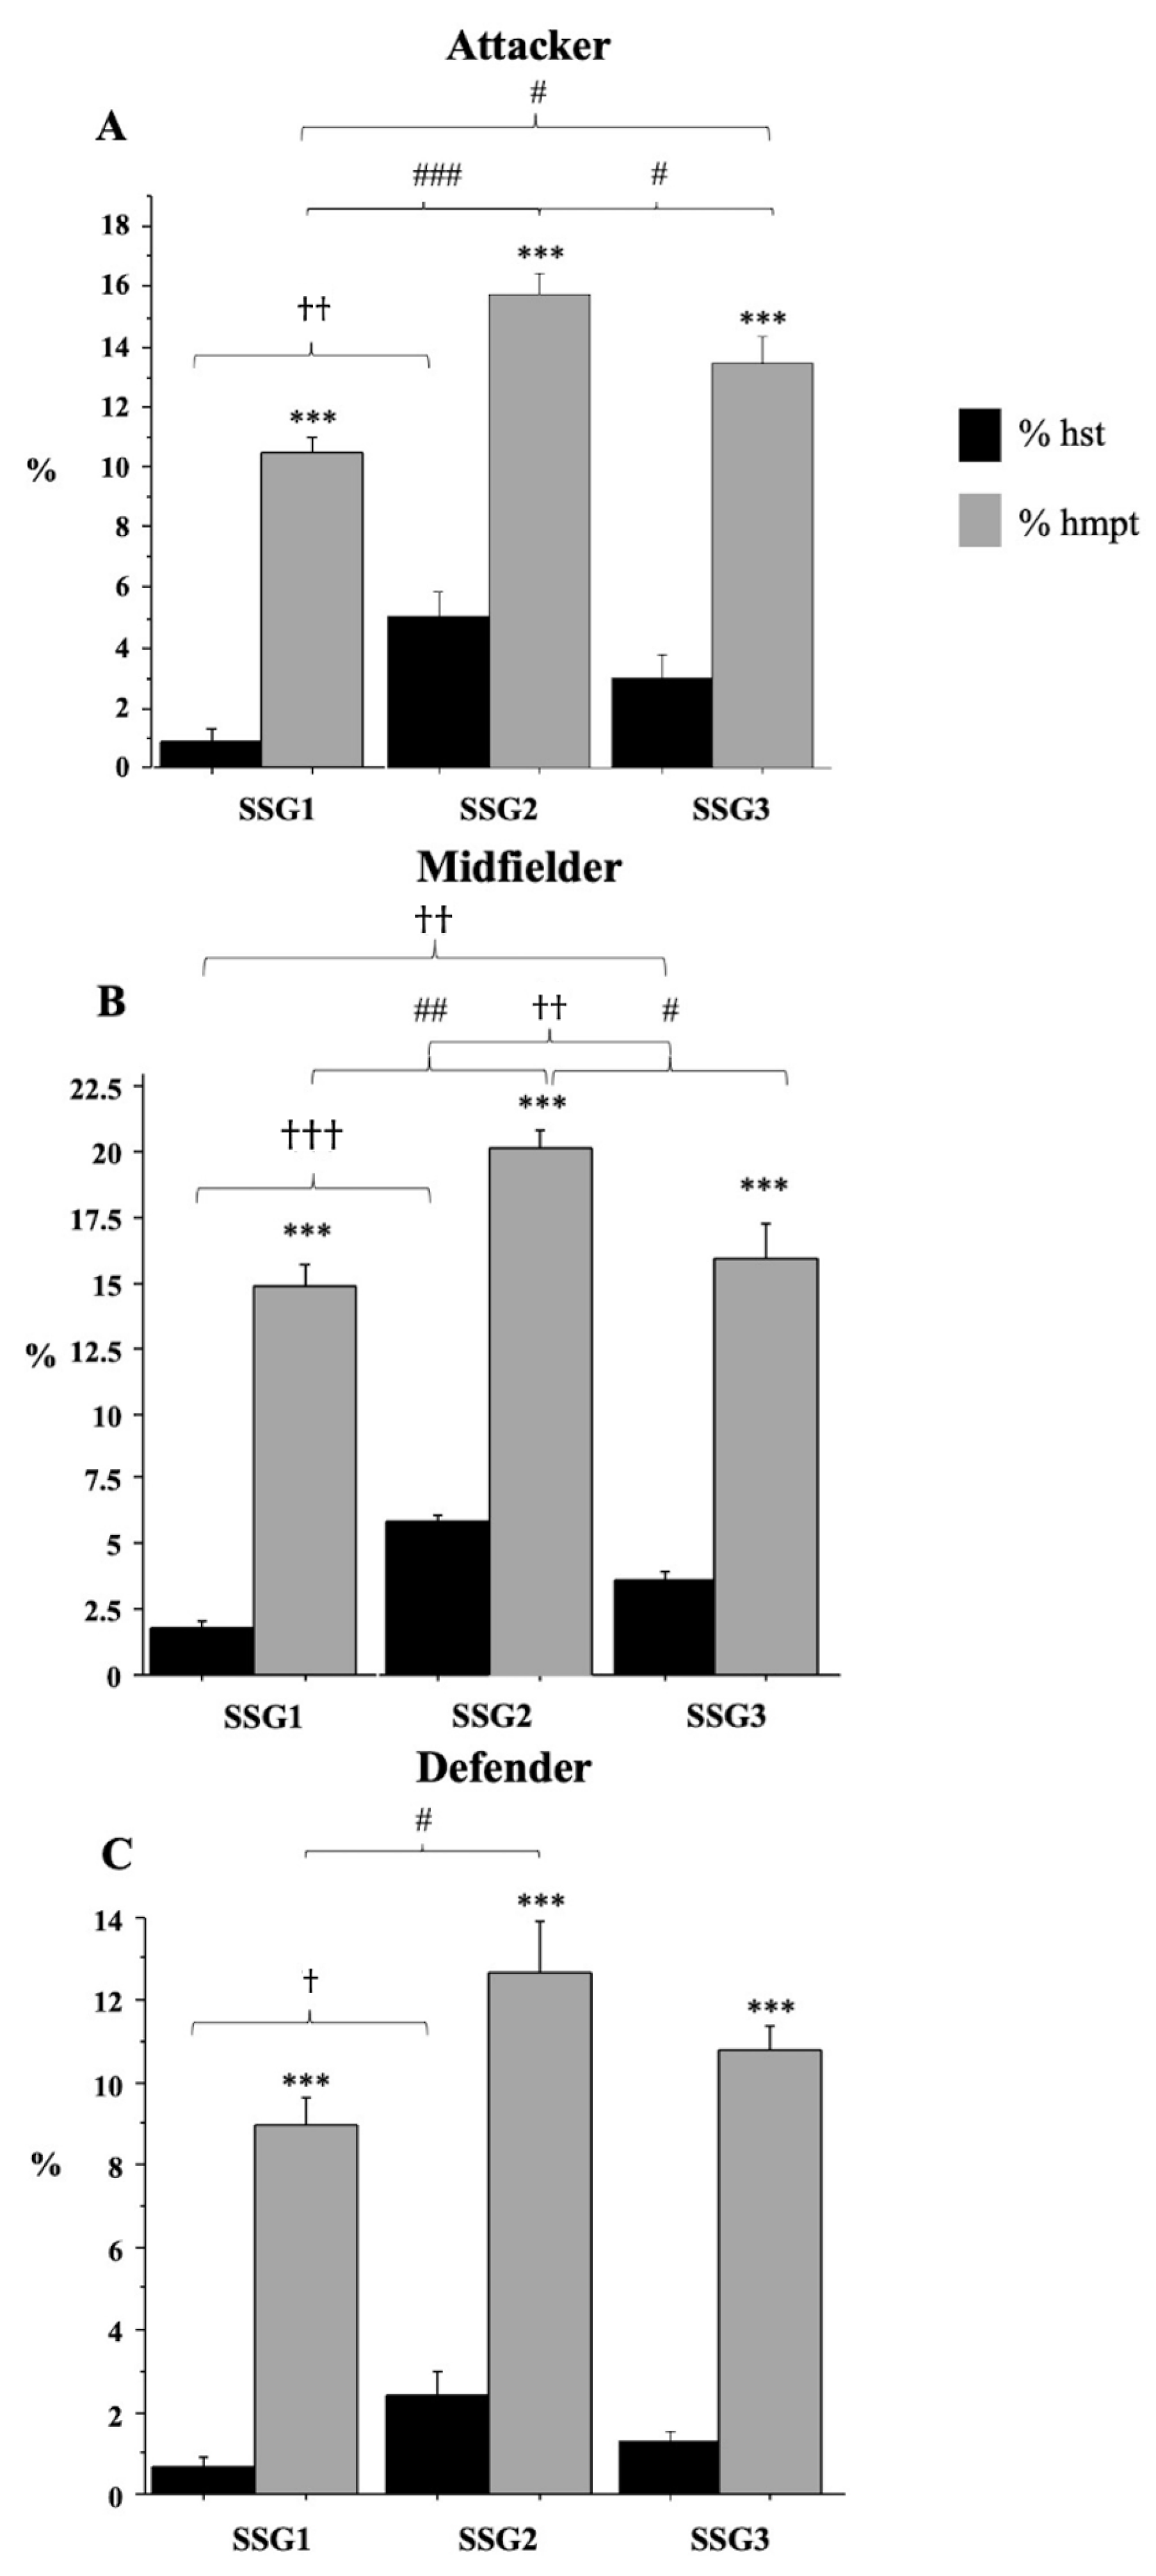
3.4. High Speed versus High Metabolic Power (MP)

We then compared the % time spent at high speed (% hst) vs. high MP (% hmpt), observing that % hmpt was greater than % hst across all SSGs and positional roles (p < 0.0001; Figure 1). For midfielders, the highest % hst or % hmpt values were recorded in SSG2 and they were statistically different from those in SSG1 and SSG3 (see legend of Figure 1B for details). A similar difference (p < 0.05) was found for attackers, but for the comparison of % hst between SSG2 and SSG3 (Figure 1A). As for defenders, the only significant difference was found for % hst and % hmpt values between SSG1 and SSG2 (Figure 1C).

4. Discussion

The purpose of this pilot study was to examine the influence of different AP on the average metabolic power (AMP) and on other soccer-specific performance variables (DIS, % hst, % hmpt, hmpa, % ACC, % DEC). To this aim non-professional male soccer players were recruited and their performance was analyzed in relation with positional roles (attacker, midfielder and defender). Specific playing rules were adopted and applied in all SSGs; in particular, defenders could not go beyond the midfield line, and attackers could not retreat behind the midfield line. Such rules affected the performance of the players within their positional roles; nevertheless, interesting findings emerged when defenders’ vs. attackers’ or midfielders’ vs. attackers’ performances were compared. In particular, we found not only significant differences in the variables recorded between defenders and attackers, but also there were examples where no differences were found between midfielders and attackers.
Within a specific SSG, midfielders’ performance, assessed as MP-related variables (AMP, % hmpt, hmpa) and as distance covered in a minute (DIS), outclassed the other two roles in SSG1 and SSG2 with a moderate to very large correlation. A similar correlation was observed for AMP and DIS in SSG3. In several cases, also attackers performed better than defenders in SSG1 (AMP, hmpa) with a large correlation and in SSG2 (AMP, % hst, % hmpt, DIS) with a moderate/large correlation, but not in SSG3. Moreover, we did not find any differences between attackers and midfielders in SSG1 (% hst, % ACC, % DEC), in SSG2 (% hst, % ACC) and in SSG3 (% hst, % hmpt, hmpa, % ACC, % DEC). These observations suggest that, despite the playing rules applied in this study, the roles are distinguishable as well as the players’ profiles. In fact, as expected, regardless of the same conditions (AP, rules), attackers drove the game more than defenders resulting in better AMP, or longer distances, or longer times spent at high speed or high MP. For the same reasons, attackers’ performance was indistinguishable from midfielders, despite the different playing spatial constrains, in relation with time spent or covered distance at high speed. These findings are in agreement with previous studies carried out also on elite players [16,55,56,57,58], confirming that the positional role specifies the performance profile.
The SSG1 and SSG3 formats resembled SSG 5 vs. 5 and SSG 7 vs. 7, respectively, reported by Gaudino et al. [30,31] on soccer players competing in the English Premiere League, where both the number of players and the pitch dimension changed. Therefore, an intermediate format (SSG2) was added to better understand the effects of such parameters on soccer-related performance variables (Table 1). In fact, moving from SSG1 to SSG2, only the pitch dimension increased; then, moving from SSG2 to SSG3, more players were allowed in the same larger pitch dimension. Such a scheme allowed three different AP to be explored, from 75 to 131 m2, where the added format shared a similar AP in respect with SSG 10 vs. 10 from Gaudino et al. [30,31]. Our data confirm that high-intensity demands of soccer training are underestimated by traditional measurements of running speed alone [30,31]. In fact, regarding the ability to assess high intensity demands as function of % hst or % hmpt, all players, regardless of their positional role, spent less time in high speed actions compared to high MP actions, but such a difference decreased with increasing AP. This finding corroborates that in smaller SSGs the acceleration/deceleration actions are kept at the expense of high speed actions. Moreover, similarly to Gaudino et al. [30], the lowest % hst and % hmpt values recorded for defenders suggest their playing profile, where the brief explosive actions against opposing attackers are more than hmpa [31,56].
Additionally, despite the different level of recruited players and the different playing rules, the distance covered in 1 min in SSG1 and SSG2 by non-professional players, according to their positional role, was similar or slightly higher compared to Premiere League players, whereas, in SSG3, DIS data were similar or slightly lower [30,31]. Such a finding confirms the general applicability of SSGs, regardless the physical/technical skills of the group of players, to enhance performance [59].
Another goal achieved in this pilot study was the opportunity to quantitatively evaluate which parameters, affecting AP, were instrumental to obtaining an improvement in a specific soccer-related variable within each positional role considered.
Most performance parameters within a specific positional role were positively associated to increasing AP according to Pearson’s correlation (Table 5); on the other hand, the % distance covered at high positive/negative speed (% ACC and % DEC) did not show any correlation.
Defenders showed the lowest recorded variables compared to attackers and midfielders in all SSGs. GPS-recorded values relative to MP-related variables (AMP, % hmpt, hmpa) and to % time spent at high speed (% hst) increased going from the smaller to the wider AP; but, largely significant improvements were observed only with a 75% increase in AP (from SSG1 to SSG2), and not with a lower one (31% from SSG1 to SSG3, and 34% from SSG3 to SSG2). The distance covered in 1 min (DIS) was instead affected by the pitch dimension thus determining a largely significant difference only between SSG1 (900 m2) and the other two formats (1575 m2). As for the distance covered at high positive/negative speed (% ACC and % DEC), these variables were affected by the number of players in the format: in fact, the lowest significant values were recorded in SSG3 (7 vs. 7) compared to SSG1 and SSG2 (both 5 vs. 5; p < 0.001; ES: > 2.00).
Despite playing in half-field, attackers often performed better than defenders. AMP and DIS values varied significantly in relation with the pitch dimension (SSG1 vs. SSG2 or SSG3) with a large/very large correlation. % Time spent at high MP (% hmpt) values were positively associated to AP, indicating that a 30% increase in AP was sufficient to achieve the expected improvement (p < 0.05) with a moderate to very large correlation, and that this parameter was sensitive both to increased number of players and to increased pitch dimension; on the other hand, % time spent at high speed (% hst) showed significant improvements only with a 75% increase in AP (SSG1 vs. SSG2) with a very large correlation. Conversely, no correlation was found for hmpa in the different played SSGs. Like defenders, % ACC and % DEC values referring to attackers’ performance were affected by the number of players in the format with a very large effect size.
Unlike defenders and attackers, midfielders’ playing actions did not have spatial limits, hence their performances were always better than the other two roles. Like defenders and attackers, their best performance was recorded in SSG2, the format having the widest AP. In particular, AMP and % time spent at high speed or at high MP (% hst and % hmpt) values correlated positively with increasing AP and data from SSG2 differed significantly from those recorded in SSG1 and SSG3 with a moderate to very large correlation. Between similar variables of SSGI and SSG3 there were no significant differences; the only exception was represented by % time spent at high speed (% hst) that was longer in the larger field. The distance covered in a minute in SSG2 by midfielders differed from the corresponding value in SSG1 with a very large correlation (75% increase in AP), whereas hmpa values in SSG2 largely differed in respect to SSG3. Also for this positional role, a very large effect size was observed when % ACC and % DEC values were compared between SSGs having a different number of players involved (SSG3 vs. SSG1 or SSG2).
Therefore, it is apparent that, unlike most analyzed variables, % ACC and % DEC are definitely not sensitive to increasing AP, but the key determinant to gain an improvement is the number of players in the format, regardless of the players’ positional roles. This evidence is in line with previous reports, where comparing the same number of players in two different pitch areas (60 vs. 80 m2) did not show any differences in the distance covered while accelerating or decelerating [28].
The present pilot study has some limitations. The sample size (n = 19 participants) cannot be considered representative with regard to the aims of the study. A higher sample size would have improved confidence in the generalizability of the results. Despite this, the effect sizes of the soccer-related variables, evaluated in the pairwise comparison (Table 4), often show a large/very large correlation coupled to significantly differences observed among SSGs/positional roles.
In addition, no internal load measurements (HR or rating of perceived exertion) were performed; however, MP data show a strong relationship with both walking and running activities [36], therefore providing a different tool for this purpose.

5. Conclusions

This pilot study quantitatively describes AP-affecting determinants able to significantly improve soccer-specific performance variables, demonstrating that different arrays of SSGs are needed to fulfill the demands related to players’ positional role, irrespective of their physical/technical level. Soccer coaches are aware that a single SSG always has high positive effects on health-related fitness components, but it is not always possible to adequately train a soccer-specific variable for all positional roles; here, quantitative advice on AMP and other performance variables is provided to achieve significant improvements in all soccer players of the team.
In summary, to record a significant improvement in the performance of the three MP-related parameters (AMP, % hmpt and hmpa), defenders need a 75% increase of AP, whereas for midfielders a 30–40% increment is sufficient; attackers behave similarly to midfielders, except for hmpa: none of the explored SSGs allowed an improvement to be achieved in the number of actions at high MP in a minute for this role. On the other hand, DIS and % hst variables were more affected by the selected playing rules, displaying a similar behavior for attackers and defenders compared with midfielders. In particular, DIS improved significantly for attackers and defenders with a 30–40% increase in AP while midfielders required a 75% increment. Conversely, the percentage of time spent at high speed (% hst) showed an opposite trend (a 30–40% increase in AP for midfielders, a 75% increase in AP for attackers and defenders). For all positional roles, % ACC and % DEC values were sensitive only to the number of players.

Author Contributions

Conceptualization, A.M. and S.O.; methodology, P.M. and A.C.; validation, D.V. and E.I.; formal analysis, D.V.; investigation, D.M., P.M., A.C. and F.C.; data curation, D.V. and E.I.; writing—original draft preparation, A.M. and S.O.; writing—review and editing, P.B. and S.O.; supervision, A.M. and S.O.; funding acquisition, A.M., P.B. and S.O. All authors have read and agreed to the published version of the manuscript.

Funding

This study was funded by “Bando di Ateneo per il sostegno alla partecipazione ai bandi di ricerca individuale (2016 e 2017) competitiva per l’anno 2016 (quota C)” from the University of Napoli “Parthenope” and by “Bando PRIN 2017_Prot.2017RS5M44” to A.M., P.B. and S.O.

Institutional Review Board Statement

The study was conducted according to the guidelines of the Declaration of Helsinki, and approved by the Ethics Committee of University of Naples “Federico II” (protocol code n. 376/19)”.

Informed Consent Statement

Informed consent was obtained from all subjects involved in the study.

Acknowledgments

We thank Giuliana Valerio for her helpful advices.

Conflicts of Interest

The authors did not report any potential conflicts of Interest.

References

  1. Brandes, M.; Heitmann, A.; Müller, L. Physical responses of different small-sided game formats in elite youth soccer players. J. Strength Cond. Res. 2012, 26, 1353–1360. [Google Scholar] [CrossRef]
  2. Hill-Haas, S.V.; Dawson, B.; Impellizzeri, F.M.; Coutts, A.J. Physiology of small-sided games training in football: A systematic review. Sports Med. 2011, 41, 199–220. [Google Scholar] [CrossRef]
  3. Iaia, F.M.; Rampinini, E.; Bangsbo, J. High-intensity training in football. Int. J. Sports Physiol. Perform. 2009, 4, 291–306. [Google Scholar] [CrossRef] [PubMed] [Green Version]
  4. Hill-Haas, S.V.; Dawson, B.T.; Coutts, A.J.; Rowsell, G.J. Physiological responses and time-motion characteristics of various small-sided soccer games in youth players. J. Sports Sci. 2009, 27, 1–8. [Google Scholar] [CrossRef]
  5. Impellizzeri, F.M.; Marcora, S.M.; Castagna, C.; Reilly, T.; Sassi, A.; Iaia, F.M.; Rampinini, E. Physiological and performance effects of generic versus specific aerobic training in soccer players. Int. J. Sports Med. 2006, 27, 483–492. [Google Scholar] [CrossRef] [Green Version]
  6. Casamichana, D.; Castellano, J.; Castagna, C. Comparing the physical demands of friendly matches and small-sided games in semiprofessional soccer players. J. Strength Cond. Res. 2012, 26, 837–843. [Google Scholar] [CrossRef] [Green Version]
  7. Mallo, J.; Navarro, E. Physical load imposed on soccer players during small-sided training games. J. Sports Med. Phys. Fit. 2008, 48, 166–171. [Google Scholar]
  8. Krustrup, P.; Aagaard, P.; Nybo, L.; Petersen, J.; Mohr, M.; Bangsbo, J. Recreational football as a health promoting activity: A topical review. Scand. J. Med. Sci. Sports 2010, 20, 13. [Google Scholar] [CrossRef]
  9. Uth, J.; Hornstrup, T.; Christensen, J.F.; Christensen, K.B.; Jørgensen, N.R.; Helge, E.W.; Schmidt, J.F.; Brasso, K.; Helge, J.W.; Jakobsen, M.D.; et al. Football training in men with prostate cancer undergoing androgen deprivation therapy: Activity profile and short-term skeletal and postural balance adaptations. Eur. J. Appl. Physiol. 2016, 116, 471–480. [Google Scholar] [CrossRef]
  10. Hammami, A.; Kasmi, S.; Farinatti, P.; Fgiri, T.; Chamari, K.; Bouhlel, E. Blood pressure, heart rate and perceived enjoyment after small-sided soccer games and repeated sprint in untrained healthy adolescents. Biol. Sport 2017, 34, 219–225. [Google Scholar] [CrossRef]
  11. Skoradal, M.B.; Purkhús, E.; Steinholm, H.; Olsen, M.H.; Ørntoft, C.; Larsen, M.N.; Dvorak, J.; Mohr, M.; Krustrup, P. “FIFA 11 for Health” for Europe in the Faroe Islands: Effects on health markers and physical fitness in 10- to 12-year-old schoolchildren. Scand. J. Med. Sci. Sports 2018, 28, 8–17. [Google Scholar] [CrossRef]
  12. Mancini, A.; Turco, A.A.; Tocchetti, C.G.; Ermidis, G.; Cozzolino, F.; Campi, G.; Parrella, P.; Mercurio, V.; Mainolfi, C.G.; Mannarino, T.; et al. Adapted recreational football small-sided games improve cardiac capacity, body composition and muscular fitness in patients with type 2 diabetes. J. Sports Med. Phys. Fit. 2020, 60, 1261–1268. [Google Scholar] [CrossRef]
  13. Clemente, F.M.; Ramirez-Campillo, R.; Sarmento, H.; Castillo, D.; Raya-González, J.; Rosemann, T.; Knechtle, B. Effects of Recreational Small-Sided Soccer Games on Bone Mineral Density in Untrained Adults: A Systematic Review and Meta-Analysis. Healthcare 2021, 9, 457. [Google Scholar] [CrossRef]
  14. Rampinini, E.; Impellizzeri, F.M.; Castagna, C.; Abt, G.; Chamari, K.; Sassi, A.; Marcora, S.M. Factors influencing physiological responses to small-sided soccer games. J. Sports Sci. 2007, 25, 659–666. [Google Scholar] [CrossRef] [PubMed]
  15. Kelly, D.M.; Drust, B. The effect of pitch dimensions on heart rate responses and technical demands of small-sided soccer games in elite players. J. Sci. Med. Sport 2009, 12, 475–479. [Google Scholar] [CrossRef] [PubMed]
  16. Dellal, A.; Jannault, R.; Lopez-Segovia, M.; Pialoux, V. Influence of the Numbers of Players in the Heart Rate Responses of Youth Soccer Players Within 2 vs. 2, 3 vs. 3 and 4 vs. 4 Small-sided Games. J. Hum. Kinet. 2011, 28, 107–114. [Google Scholar] [CrossRef] [PubMed] [Green Version]
  17. Gabbett, T.J.; Mulvey, M.J. Time-motion analysis of small-sided training games and competition in elite women soccer players. J. Strength Cond. Res. 2008, 22, 543–552. [Google Scholar] [CrossRef] [PubMed]
  18. Dellal, A.; Owen, A.; Wong, D.P.; Krustrup, P.; van Exsel, M.; Mallo, J. Technical and physical demands of small vs. large sided games in relation to playing position in elite soccer. Hum. Mov. Sci. 2012, 31, 957–969. [Google Scholar] [CrossRef]
  19. Dellal, A.; Chamari, K.; Wong, D.P.; Ahmaidi, S.; Keller, D.; Barros, R.; Bisciotti, G.N.; Carling, C. Comparison of physical and technical performance in European soccer match-play: FA Premier League and La Liga. Eur. J. Sport Sci. 2011, 11, 51–59. [Google Scholar] [CrossRef]
  20. Hill-Haas, S.V.; Coutts, A.J.; Dawson, B.T.; Rowsell, G.J. Time-motion characteristics and physiological responses of small-sided games in elite youth players: The influence of player number and rule changes. J. Strength Cond. Res. 2010, 24, 2149–2156. [Google Scholar] [CrossRef] [Green Version]
  21. Randers, M.B.; Nielsen, J.J.; Bangsbo, J.; Krustrup, P. Physiological response and activity profile in recreational small-sided football: No effect of the number of players. Scand. J. Med. Sci. Sports 2014, 24, 130–137. [Google Scholar] [CrossRef] [PubMed]
  22. Olthof, S.B.H.; Frencken, W.G.P.; Lemmink, K.A.P.M. Match-derived relative pitch area changes the physical and team tactical performance of elite soccer players in small-sided soccer games. J. Sports Sci. 2018, 36, 1557–1563. [Google Scholar] [CrossRef] [PubMed]
  23. Olthof, S.; Frencken, W.; Lemmink, K.A. Match-Derived Relative Pitch Area Facilitates the Tactical Representativeness of Small-Sided Games for the Official Soccer Match. J. Strength Cond. Res. 2019, 33, 523–530. [Google Scholar] [CrossRef] [Green Version]
  24. Aguiar, M.; Botelho, G.; Lago, C.; Maças, V.; Sampaio, J. A review on the effects of soccer small-sided games. J. Hum. Kinet. 2012, 33, 103–113. [Google Scholar] [CrossRef] [PubMed]
  25. Martone, D.; Giacobbe, M.; Capobianco, A.; Imperlini, E.; Mancini, A.; Capasso, M.; Buono, P.; Orrù, S. Exercise Intensity and Technical Demands of Small-Sided Soccer Games for Under-12 and Under-14 Players: Effect of Area per Player. J. Strength Cond. Res. 2017, 31, 1486–1492. [Google Scholar] [CrossRef] [PubMed]
  26. Castellano, J.; Puente, A.; Echeazarra, I.; Usabiaga, O.; Casamichana, D. Number of Players and Relative Pitch Area per Player: Comparing Their Influence on Heart Rate and Physical Demands in Under-12 and Under-13 Football Players. PLoS ONE 2016, 11, e0127505. [Google Scholar] [CrossRef] [Green Version]
  27. Randers, M.B.; Ørntoft, C.; Hagman, M.; Nielsen, J.J.; Krustrup, P. Movement pattern and physiological response in recreational small-sided football—Effect of number of players with a fixed pitch size. J. Sports Sci. 2018, 36, 1549–1556. [Google Scholar] [CrossRef] [PubMed]
  28. Pantelić, S.; Rađa, A.; Erceg, M.; Milanović, Z.; Trajković, N.; Stojanović, E.; Krustrup, P.; Randers, M.B. Relative pitch area plays an important role in movement pattern and intensity in recreational male football. Biol. Sport 2019, 36, 119–124. [Google Scholar] [CrossRef] [PubMed]
  29. Osgnach, C.; Poser, S.; Bernardini, R.; Rinaldo, R.; di Prampero, P.E. Energy cost and metabolic power in elite soccer: A new match analysis approach. Med. Sci. Sports Exerc. 2010, 42, 170–178. [Google Scholar] [CrossRef] [PubMed]
  30. Gaudino, P.; Iaia, F.M.; Alberti, G.; Strudwick, A.J.; Atkinson, G.; Gregson, W. Monitoring training in elite soccer players: Systematic bias between running speed and metabolic power data. Int. J. Sports Med. 2013, 34, 963–968. [Google Scholar] [CrossRef]
  31. Gaudino, P.; Iaia, F.M.; Alberti, G.; Hawkins, R.D.; Strudwick, A.J.; Gregson, W. Systematic bias between running speed and metabolic power data in elite soccer players: Influence of drill type. Int. J. Sports Med. 2013, 35, 489–493. [Google Scholar] [CrossRef] [PubMed]
  32. Brown, D.M.; Dwyer, D.B.; Robertson, S.J.; Gastin, P.B. Metabolic Power Method: Underestimation of Energy Expenditure in Field-Sport Movements Using a Global Positioning System Tracking System. Int. J. Sports Physiol. Perform. 2016, 11, 1067–1073. [Google Scholar] [CrossRef] [Green Version]
  33. Buchheit, M.; Manouvrier, C.; Cassirame, J.; Morin, J.B. Monitoring Locomotor Load in Soccer: Is Metabolic Power, Powerful? Int. J. Sports Med. 2015, 36, 1149–1155. [Google Scholar] [CrossRef] [Green Version]
  34. Stevens, T.G.; de Ruiter, C.J.; van Maurik, D.; van Lierop, C.J.; Savelsbergh, G.J.; Beek, P.J. Measured and estimated energy cost of constant and shuttle running in soccer players. Med. Sci. Sports Exerc. 2015, 47, 1219–1224. [Google Scholar] [CrossRef] [PubMed]
  35. Minetti, A.E.; Pavei, G. Update and extension of the ‘equivalent slope’ of speed-changing level locomotion in humans: A computational model for shuttle running. J. Exp. Biol. 2018, 221, 182303. [Google Scholar] [CrossRef] [Green Version]
  36. Polglaze, T.; Hogan, C.; Dawson, B.; Buttfield, A.; Osgnach, C.; Lester, L.; Peeling, P. Classification of Intensity in Team Sport Activity. Med. Sci. Sports Exerc. 2018, 50, 487–494. [Google Scholar] [CrossRef] [PubMed]
  37. Bourdon, P.C.; Cardinale, M.; Murray, A.; Gastin, P.; Kellmann, M.; Varley, M.C.; Gabbett, T.J.; Coutts, A.J.; Burgess, D.J.; Gregson, W.; et al. Monitoring Athlete Training Loads: Consensus Statement. Int. J. Sport Physiol. 2017, 12, 161–170. [Google Scholar] [CrossRef] [PubMed]
  38. Castagna, C.; Varley, M.; Póvoas, S.; D’Ottavio, S. Evaluation of the Match External Load in Soccer: Methods Comparison. Int. J. Sports Physiol. Perform. 2017, 12, 490–495. [Google Scholar] [CrossRef]
  39. Aughey, R.J. Applications of GPS technologies to field sports. Int. J. Sports Physiol. Perform. 2011, 6, 295–310. [Google Scholar] [CrossRef] [Green Version]
  40. Padulo, J.; Iuliano, E.; Brisola, G.; Dello Iacono, A.; Zagatto, A.M.; Lupo, C.; Fuglsang, T.; Ardigò, L.P.; Cular, D. Validity and reliability of a standalone low-end 50-Hz GNSS receiver during running. Biol. Sport 2019, 36, 75–80. [Google Scholar] [CrossRef]
  41. Ehrmann, F.E.; Duncan, C.S.; Sindhusake, D.; Franzsen, W.N.; Greene, D.A. GPS and Injury Prevention in Professional Soccer. J. Strength Cond. Res. 2016, 30, 360–367. [Google Scholar] [CrossRef]
  42. Di Prampero, P.E.; Fusi, S.; Sepulcri, L.; Morin, J.B.; Belli, A.; Antonutto, G. Sprint running: A new energetic approach. J. Exp. Biol. 2005, 208, 2809–2816. [Google Scholar] [CrossRef] [Green Version]
  43. Hill-Haas, S.V.; Coutts, A.J.; Rowsell, G.J.; Dawson, B.T. Generic versus small-sided game training in soccer. Int. J. Sports Med. 2009, 30, 636–642. [Google Scholar] [CrossRef]
  44. Jones, S.; Drust, B. Physiological and technical demands of 4v4 and 8v8 games in elite youth soccer players. Kinesiology 2007, 39, 150–156. [Google Scholar]
  45. Philippaerts, R.M.; Vaeyens, R.; Janssens, M.; Van Renterghem, B.; Matthys, D.; Craen, R.; Bourgois, J.; Vrijens, J.; Beunen, G.; Malina, R.M. The relationship between peak height velocity and physical performance in youth soccer players. J. Sports Sci. 2006, 24, 221–230. [Google Scholar] [CrossRef] [PubMed]
  46. Drust, B.; Waterhouse, J.; Atkinson, G.; Edwards, B.; Reilly, T. Circadian rhythms in sports performance-An update. Chronobiol. Int. 2005, 22, 21–44. [Google Scholar] [CrossRef]
  47. Rodriguez, D.A.; Shay, E.; Winn, P. Comparative Review of Portable Global Positioning System Units; Nova Science Publishers: New York, NY, USA, 2013; pp. 1–16. [Google Scholar]
  48. Schipperijn, J.; Kerr, J.; Duncan, S.; Madsen, T.; Klinker, C.D.; Troelsen, J. Dynamic Accuracy of GPS Receivers for Use in Health Research: A Novel Method to Assess GPS Accuracy in Real-World Settings. Front. Public Health 2014, 10, 2–21. [Google Scholar] [CrossRef] [Green Version]
  49. Mendez-Villanueva, A.; Buchheit, M.; Simpson, B.; Peltola, E. Does on-field sprinting performance in young soccer players depend on how fast the can run or how fast they do run? J. Strength Cond. Res. 2011, 25, 2634–2638. [Google Scholar] [CrossRef]
  50. Licciardi, A.; Grassadonia, G.; Monte, A.; Ardigò, L.P. Match metabolic power over different playing phases in a young professional soccer team. J. Sports Med. Phys. Fit. 2020, 60, 1170–1171. [Google Scholar] [CrossRef]
  51. Brustio, P.R.; Boccia, G.; Ungureanu, A.N.; Lupo, C. Training sessions with tackles impair upper-limb neuromuscular function in elite rugby union. Biol. Sport 2020, 37, 415–422. [Google Scholar] [CrossRef]
  52. Lakens, D. Calculating and reporting effect sizes to facilitate cumulative science: A practical primer for t-tests and ANOVAs. Front. Psychol. 2013, 4, 863. [Google Scholar] [CrossRef] [Green Version]
  53. Hopkins, W.G.; Marshall, S.W.; Batterham, A.M.; Hanin, J. Progressive statistics for studies in sports medicine and exercise science. Med. Sci. Sports Exerc. 2009, 41, 3–13. [Google Scholar] [CrossRef] [Green Version]
  54. Sole, S.; Ramírez-Campillo, R.; Andrade, D.C.; Sanchez-Sanchez, J. Plyometric jump training effects on the physical fitness of individual-sport athletes: A systematic review with meta-analysis. PeerJ 2021, 9, e11004. [Google Scholar] [CrossRef]
  55. Di Salvo, V.; Baron, R.; Tschan, H.; Calderon Montero, F.J.; Bachl, N.; Pigozzi, F. Performance characteristics according to playing position in elite soccer. Int. J. Sports Med. 2007, 28, 222–227. [Google Scholar] [CrossRef]
  56. Di Salvo, V.; Gregson, W.; Atkinson, G.; Tordoff, P.; Drust, B. Analysis of high intensity activity in Premier League soccer. Int. J. Sports Med. 2009, 30, 205–212. [Google Scholar] [CrossRef] [PubMed]
  57. Reche-Soto, P.; Cardona-Nieto, D.; Diaz-Suarez, A.; Bastida-Castillo, A.; Gomez-Carmona, C.; Garcia-Rubio, J.; Pino-Ortega, J. Player Load and Metabolic Power Dynamics as Load Quantifiers in Soccer. J. Hum. Kinet. 2019, 69, 259–269. [Google Scholar] [CrossRef] [Green Version]
  58. Borghi, S.; Colombo, D.; La Torre, A.; Banfi, G.; Bonato, M.; Vitale, J.A. Differences in GPS variables according to playing formations and playing positions in U19 male soccer players. Res. Sports Med. 2021, 29, 225–239. [Google Scholar] [CrossRef]
  59. Vigh-Larsen, J.F.; Dalgas, U.; Andersen, T.B. Position-Specific Acceleration and Deceleration Profiles in Elite Youth and Senior Soccer Players. J. Strength Cond. Res. 2018, 32, 1114–1122. [Google Scholar] [CrossRef] [PubMed]
Figure 1. Percentage of total time spent at high speed (% hst; v > 16 km/h) and at high metabolic power (% hmpt; MP > 20 W) recorded in SSG1, SSG2 and SSG3 for attacker (A), midfielder (B) and defender (C). Values are expressed as mean ± SD. * Significant difference between % hst and % hmpt in the same SSG (*** p < 0,001); † Significant difference between % hst in different SSGs († p < 0.05; †† p < 0.01; ††† p < 0,001); # Significant difference between % hmpt in different SSGs (# p < 0.05; ## p < 0.01; ### p < 0,001).
Ijerph 18 09833 g001
Table 1. Small-sided game (SSG) features evaluated in this study.
DrillFormatDuration (min)Pitch Dimension (m)Pitch Area (m2)Area per Player (m2)
SSG15 vs. 5530 × 3090075
SSG25 vs. 5535 × 451575131
SSG37 vs. 7835 × 45157598
Table 2. Soccer-related performance variables analyzed in this study.
VariableAcronymUnit
Average metabolic powerAMPW/kg
distance covered in 1 minDISm/min
time spent at high speed (v > 16 km/h) as percentage% hst-
time spent at high metabolic power (MP > 20 W/kg) as percentage% hmpt-
distance covered at high positive speed (accelerations; 2 < v < 4 m/s2) as percentage% ACC-
distance covered at high negative speed (decelerations; −6 < v < −2 m/s2) as percentage% DEC-
number of actions per minute performed at high metabolic powerhmpanumber/min
Table 3. Mean values ± SD of the variables recorded in the SSGs considered.
VariablePositionSSG 1SSG 2SSG 3F-Valuep-Value
AMPAttacker10.0 ± 0.8 b12.0 ± 0.9 *,b11.3 ± 0.9 *F(2, 15) = 7.8p < 0.01
Midfielder11.9 ± 0.5 a,b13.7 ± 0.7 *,#,a,b12.5 ± 1.2 a,bF(2, 15) = 6.1p < 0.05
Defender9.1 ± 0.510.7 ± 1.3 *10.2 ± 0.9F(2, 16) = 3.9p < 0.05
F-value F(2, 12) = 25.1F(2, 17) = 15.1F(2, 17) = 8.6
p-value p < 0.001p < 0.01p < 0.01
% hstAttacker0.9 ± 0.85.0 ± 2.3 *,b2.9 ± 2.1F(2, 15) = 6.6p < 0.01
Midfielder1.7 ± 0.6 b5.8 ± 0.8 *,#,b3.5 ± 1.2 *,bF(2, 15) = 25.0p < 0.001
Defender0.7 ± 0.42.4 ± 1.6 *1.3 ± 0.6F(2, 16) = 4.0p < 0.05
F-value F(2, 12) = 3.9F(2, 17) = 7.3F(2, 17) = 4.6
p-value p < 0.05p < 0.01p < 0.05
% hmptAttacker10.5 ± 1.115.7 ± 1.9 *,#,b13.5 ± 1.9 *F(2, 15) = 12.7p < 0.001
Midfielder14.9 ± 1.8 a,b20.1 ± 1.9 *,#,a,b15.9 ± 3.5 bF(2, 15) = 6.4p < 0.01
Defender9.0 ± 1.412.7 ± 3.1 *10.8 ± 1.6F(2, 16) = 3.9p < 0.05
F-value F(2, 12) = 21.1F(2, 17) = 14.9F(2, 17) = 7.3
p-value p < 0.001p < 0.01p < 0.01
hmpaAttacker3.9 ± 0.7 b4.7 ± 0.84.2 ± 1.0F(2, 15) = 1.3p > 0.05
Midfielder5.0 ± 0.9 a,b5.7 ± 0.9 #,a,b4.5 ± 0.5 bF(2, 15) = 3.8p < 0.05
Defender2.8 ± 0.23,9 ± 0.9 *3.5 ± 0.8F(2, 16) = 3.7p < 0.05
F-value F(2, 12) = 12.5F(2, 17) = 6.9F(2, 17) = 3.3
p-value p < 0.01p < 0,01p > 0.05
% ACCAttacker2.7 ± 0.3 #2.8 ± 0.5 #1.4 ± 0.2F(2, 15) = 22.9p < 0.001
Midfielder2.6 ± 0.4 #2.9 ±0.3 #1.3 ± 0.2F(2, 15) = 48.7p < 0.001
Defender2.4 ± 0.3 #2.7 ± 0.4 #1.5 ± 0.2F(2, 16) = 24.3p < 0.001
F-value F(2, 12) = 0.8F(2, 17) = 0.4F(2, 17) = 1.7
p-value p > 0.05p > 0.05p > 0.05
% DECAttacker3.5 ± 0.4 #3.3 ± 0.4 #1.9 ± 0.2F(2, 15) = 37.1p < 0.001
Midfielder3.9 ± 0.8 #3.9 ± 0.5 #,a,b2.1 ± 0.2F(2, 15) = 23.8p < 0.001
Defender3.2 ± 0.3 #3.2 ± 2.4 #1.9 ± 0.2F(2, 16) = 59.4p < 0.001
F-value F(2, 12) = 1.9F(2, 17) = 6.0F(2, 17) = 2.1
p-value p > 0.05p < 0.01p > 0.05
DISAttacker100.2 ± 8.7121.1 ± 7.6 *,b114.3 ± 9.2 *F(2, 15) = 9.0p < 0.01
Midfielder117.7 ± 5.3 a,b137.3 ± 7.0 *,a,b128.1 ± 11.5 a,bF(2, 15) = 6.8p < 0.01
Defender91.8 ± 5.3106.5 ± 12.1 *103.5 ± 8.0 *F(2, 16) = 3.9p < 0.05
F-value F(2, 12) = 19.7F(2, 17) = 17.6F(2, 17) = 11.3
p-value p < 0.01p < 0.001p < 0.01
AMP = average metabolic power; % hst = % high speed time (v > 16 km/h); % hmpt = % high metabolic power time (MP > 20 W); % ACC = % distance at high positive speed (accelerations; 2 < v < 4 m/s2); % DEC = % distance at high negative speed (decelerations; −6 < v < −2 m/s2); DIS = total distance; hmpa = number of high metabolic power actions (MP > 20 W).* Significantly different (p < 0.05) from SSG1; # Significantly different (p < 0.05) from SSG3; a Significantly different (p < 0.05) from attacker; b Significantly different (p < 0.05) from defender.
Table 4. Pairwise comparison of recorded variables among roles within the same SSG and among SSGs within the same positional role and. p values, effect sizes and confidence intervals are reported.
Pairwise Comparison among Roles within the Same SSG
VariableDrillPositionp-ValueESCI
AMPSSG1Midfielder vs. Attacker<0.0012.440.99/4.42
Midfielder vs. Defender<0.0014.872.72/8.05
Attacker vs. Defender0.0371.24−0.01/2.75
SSG2Midfielder vs. Attacker0.0071.990.78/3.51
Midfielder vs. Defender<0.0012.691.33/4.45
Attacker vs. Defender0.0221.140.07/2.35
SSG3Midfielder vs. Attacker0.0471.05−0.04/2.31
Midfielder vs. Defender<0.0011.980.80/3.42
Attacker vs. Defender0.0841.06−0.02/2.33
% hstSSG1Midfielder vs. Attacker0.0621.02−0.21/2.46
Midfielder vs. Defender0.0211.870.53/3.60
Attacker vs. Defender0.5670.33−0.88/1.62
SSG2Midfielder vs. Attacker0.4190.42−0.65/1.55
Midfielder vs. Defender0.0022.431.13/4.09
Attacker vs. Defender0.0111.250.17/2.49
SSG3Midfielder vs. Attacker0.4510.33−0.74/1.45
Midfielder vs. Defender0.0092.170.96/3.67
Attacker vs. Defender0.0540.99−0.09/2.24
% hmptSSG1Midfielder vs. Attacker<0.0012.581.09/4.61
Midfielder vs. Defender<0.0013.241.58/5.58
Attacker vs. Defender0.1271.10−0.13/2.57
SSG2Midfielder vs. Attacker0.0042.110.88/3.67
Midfielder vs. Defender<0.0012.571.32/4.42
Attacker vs. Defender0.0341.070.01/2.27
SSG3Midfielder vs. Attacker0.1060.77−0.31/1.96
Midfielder vs. Defender0.0011.770.63/3.15
Attacker vs. Defender0.0671.420.29/2.76
hmpaSSG1Midfielder vs. Attacker0.0281.18−0.05/2.67
Midfielder vs. Defender<0.0012.961.39/5.19
Attacker vs. Defender0.0281.850.51/3.57
SSG2Midfielder vs. Attacker0.0451.160.06/2.45
Midfielder vs. Defender0.0021.810.62/3.27
Attacker vs. Defender0.1280.82−0.22/1.97
SSG3Midfielder vs. Attacker0.5520.31−0.76/1.43
Midfielder vs. Defender0.0241.460.36/2.74
Attacker vs. Defender0.0930.82−0.27/2.01
% ACCSSG1Midfielder vs. Attacker0.6040.28−0.93/1.56
Midfielder vs. Defender0.4910.39−0.82/1.69
Attacker vs. Defender0.2370.79−0.41/2.18
SSG2Midfielder vs. Attacker0.5060.38−0.71/1.48
Midfielder vs. Defender0.3710,53−0.54/1.68
Attacker vs. Defender0.8063.191.69/4.90
SSG3Midfielder vs. Attacker0.3470.46−0.61/1.59
Midfielder vs. Defender0.0811.01−0.02/2.22
Attacker vs. Defender0.4240.39−0.65/1.56
% DECSSG1Midfielder vs. Attacker0.2310.62−0.59/1.96
Midfielder vs. Defender0.0750.99−0.23/2.43
Attacker vs. Defender0.5040.62−0.58/1.97
SSG2Midfielder vs. Attacker0.0141.230.12/2.53
Midfielder vs. Defender0.0041.700.54/3.14
Attacker vs. Defender0.5885.543.36/8.09
SSG3Midfielder vs. Attacker0.1530.80−0.28/2.00
Midfielder vs. Defender0.0670.90−0.14/2.07
Attacker vs. Defender0.7050.22−0.86/1.32
DISSSG1Midfielder vs. Attacker0.0012.180.79/4.05
Midfielder vs. Defender<0.0014.412.41/7.36
Attacker vs. Defender0.0691.05−0.18/2.50
SSG2Midfielder vs. Attacker0.0062.050.82/3.59
Midfielder vs. Defender<0.0012.821.43/4.62
Attacker vs. Defender0.0090.66−0.39/1.76
SSG3Midfielder vs. Attacker0.0201.220.11/2.52
Midfielder vs. Defender<0.0012.321.08/3.87
Attacker vs. Defender0.0621.170.06/2.45
Pairwise Comparison among SSGs within the Same Positional Role
VariablePositionDrillsp-ValueESCI
AMPAttacker SSG1 vs. SSG20.0012.160.85/3.8
SSG1 vs. SSG30.0311.330.12/2.79
SSG3 vs. SSG20.1410.79−0.29/1.99
MidfielderSSG1 vs. SSG20.0042.741.26/4.71
SSG1 vs. SSG30.2770.55−0.58/1.77
SSG3 vs. SSG20.0251.160.06/2.44
DefenderSSG1 vs. SSG20.0141.420.23/2.84
SSG1 vs. SSG30.0631.390.21/2.80
SSG3 vs. SSG20.4150.38−0.66/1.46
% hstAttacker SSG1 vs. SSG20.0032.060.78/3.69
SSG1 vs. SSG30.1081.08−0.09/2.47
SSG3 vs. SSG20.0720.88−0.20/2.09
MidfielderSSG1 vs. SSG2<0.0015.152.98/8.24
SSG1 vs. SSG30.0061.590.39/3.07
SSG3 vs. SSG2<0.0012.030.80/3.55
DefenderSSG1 vs. SSG20.0151.240.08/2.61
SSG1 vs. SSG30.3411.08−0.07/2.40
SSG3 vs. SSG20.0750.84−0.20/1.99
% hmptAttackerSSG1 vs. SSG2<0.0012.901.44/4.85
SSG1 vs. SSG30.0141.670.41/3.23
SSG3 vs. SSG20.0391.06−0.04/2.31
MidfielderSSG1 vs. SSG20.0052.521.10/4.41
SSG1 vs. SSG30.5170.32−0.80/1.51
SSG3 vs. SSG20.0121.370.24/2.69
DefenderSSG1 vs. SSG20.0141.310.14/2.71
SSG1 vs. SSG30.2051.06−0.09/2.38
SSG3 vs. SSG20.1330.72−0.32/1.85
hmpaAttackerSSG1 vs. SSG20.1260.98−0.16/2.28
SSG1 vs. SSG30.4750.38−0.78/1.62
SSG3 vs. SSG20.3780.45−0.62/1.59
MidfielderSSG1 vs. SSG20.1480.72−0.44/2.02
SSG1 vs. SSG30.3180.61−0.52/1.83
SSG3 vs. SSG20.0151.540.40/2.92
DefenderSSG1 vs. SSG20.0151.500.31/2.95
SSG1 vs. SSG30.1171.08−0.06/2.43
SSG3 vs. SSG20.2670.50−0.53/1.60
% ACCAttackerSSG1 vs. SSG20.8240.11−1.03/1.26
SSG1 vs. SSG3<0.0013.992.18/6.51
SSG3 vs. SSG2<0.0013.051.62/4.95
MidfielderSSG1 vs. SSG20.0970.84−0.32/2.17
SSG1 vs. SSG3<0.0013.792.06/6.03
SSG3 vs. SSG2<0.0015.823.62/8.90
DefenderSSG1 vs. SSG20.1720.64−0.48/1.88
SSG1 vs. SSG3<0.0013.521.83/5.81
SSG3 vs. SSG2<0.0013.151.69/5.09
% DECAttackerSSG1 vs. SSG20.4960.33−0.81/1.50
SSG1 vs. SSG3<0.0014.802.81/7.75
SSG3 vs. SSG2<0.0014.112.40/6.43
MidfielderSSG1 vs. SSG20.0970.01−1.17/1.21
SSG1 vs. SSG3<0.0012.981.49/4.94
SSG3 vs. SSG2<0.0014.362.77/7.17
DefenderSSG1 vs. SSG20.9400.04−1.11/1.19
SSG1 vs. SSG3<0.0014.552.60/7.40
SSG3 vs. SSG2<0.0015.073.10/7.83
DISAttackerSSG1 vs. SSG2<0.0012.391.05/4.15
SSG1 vs. SSG30.0141.440.21/0.92
SSG3 vs. SSG20.1670.76−0.32/1.95
MidfielderSSG1 vs. SSG20.0022.831.34/4.85
SSG1 vs. SSG30.0601.02−0.13/2.32
SSG3 vs. SSG20.0810.87−0.21/2.09
DefenderSSG1 vs. SSG20.0151.370.19/2.77
SSG1 vs. SSG30.0471.520.28/3.03
SSG3 vs. SSG20.5470.22−0.86/1.33
Bold font was used in order to highlight significant p value.
Table 5. Pearson’s correlation between the measured variables and the different AP of the SSGs.
AttackersMidfieldersDefenders
AMPr0.6910.6680.533
p0.0010.0030.018
% hstr0.6810.8770.575
p0.002<0.0010.010
% hmptr0.7790.6590.570
p<0.0010.0030.011
hmpar0.3880.3970.544
p0.1110.1030.016
% ACCr0.2000.3170.350
p0.4250.2000.141
% DECr0.1080.1500.189
p0.6700.5520.439
DISr0.7060.6820.513
p0.0010.0020.025
Bold font was used in order to highlight significant p value. r Pearson’s correlation coefficient; p p-value.
Publisher’s Note: MDPI stays neutral with regard to jurisdictional claims in published maps and institutional affiliations.

