
Improving Well-Being of Farmers Using Ecological Awareness around Protected Areas: Evidence from Qinling Region, China

Abstract
:1. Introduction
2. Materials and Methods
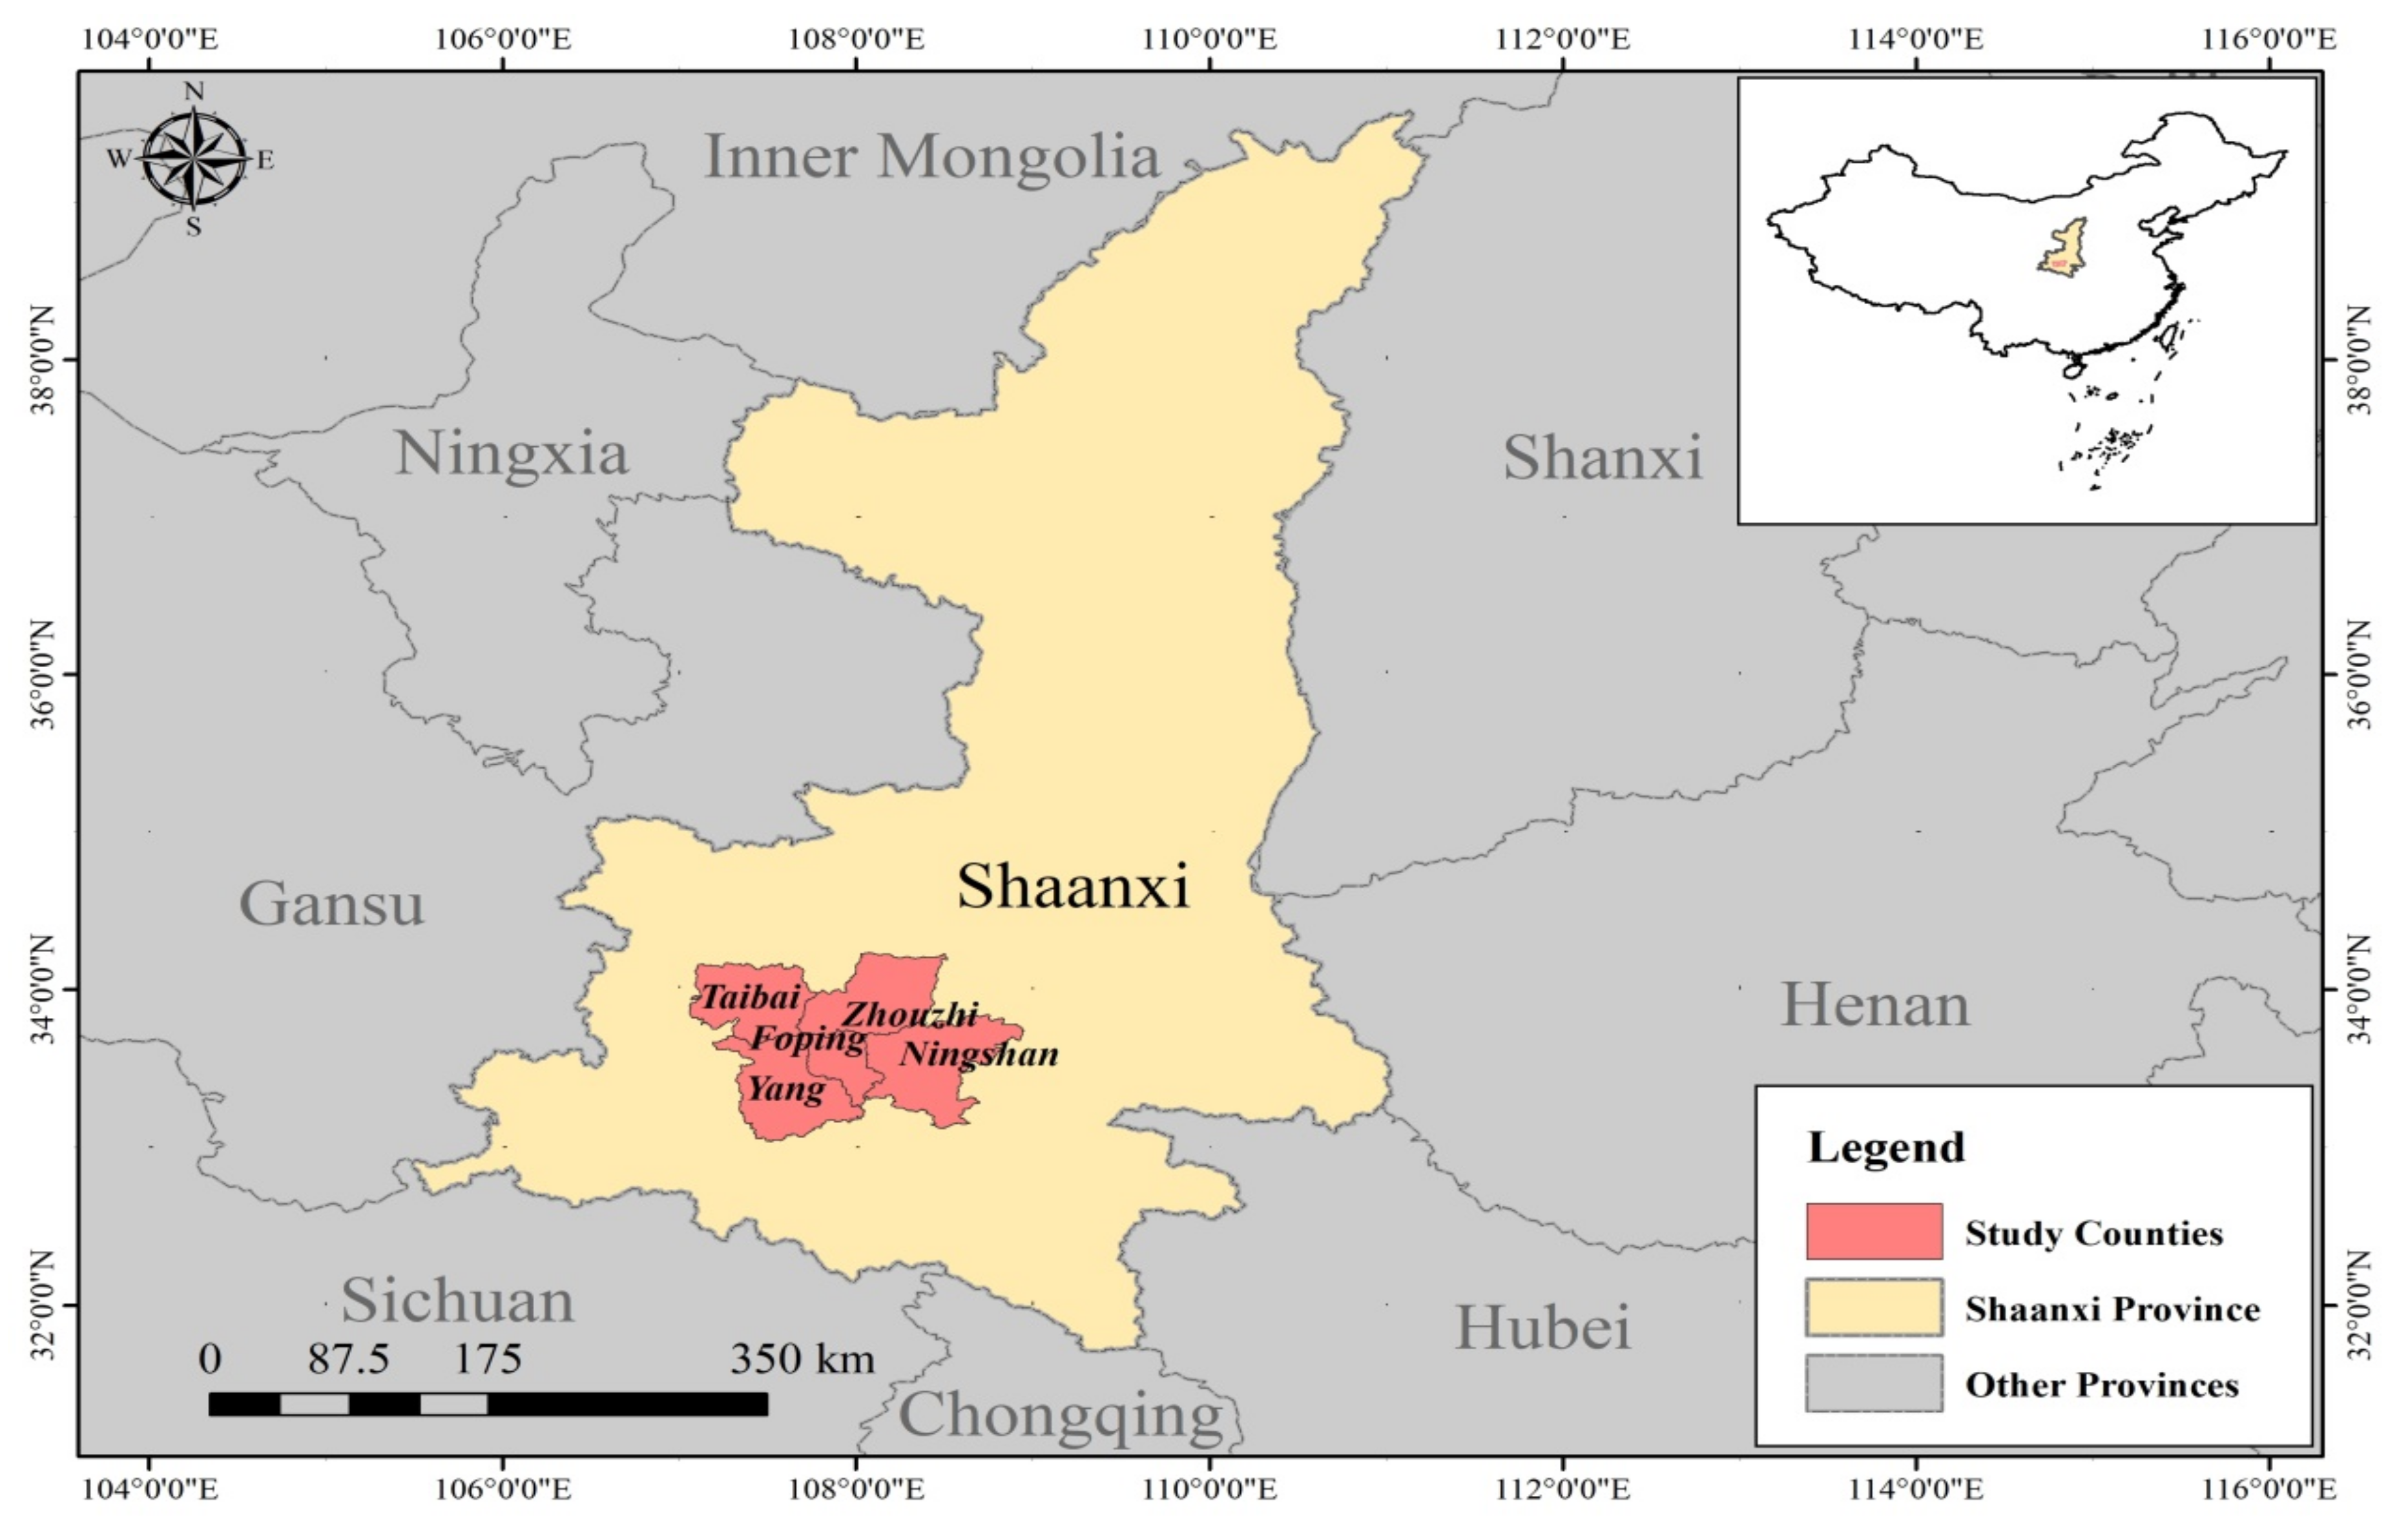
2.1. Study Area
2.2. Data Collection
2.3. Measurement of Household Well-Being
2.3.1. Indicator Selection of Household Well-Being
2.3.2. Family Well-Being Index Measurement Method
2.4. Measurement of Ecosystem Services Awareness
3. Results
3.1. Comprehensive Evaluation of Farmers’ Well-Being
3.2. The Impact of Ecosystem Service Perception on the Overall Well-Being of Farmers
3.3. Impact of Ecosystem Service Perception on Farmers’ Material Well-Being
3.4. Impact of Ecosystem Service Perception on Household Health and Well-Being
3.5. Impact of Ecosystem Service Perception on Farmers’ Social Relationship Well-Being
3.6. Impact of Ecosystem Service Perception on Household Safety Well-Being
4. Discussion
4.1. Analysis of Well-Being Measurement Results
4.2. Analysis of Regression Results
4.3. Limitations and Future Research
5. Conclusions
Author Contributions
Funding
Institutional Review Board Statement
Informed Consent Statement
Data Availability Statement
Acknowledgments
Conflicts of Interest
Appendix A

| Question | Answer |
|---|---|
| What is your gender? | 1: Male; 2: Female |
| How old are you? | 0: ≤18; 1: 19–35; 2: 36–50; 3: 51–65; 4: >65 |
| What is your education level? | 1: Primary school and below; 2: Junior middle school (technical secondary school); 3: Senior high school (junior college); 4: Undergraduate and above |
| How are you feeling? | 1: Good; 2: Neutral; 3: Mild disease; 4: Major disease |
| Do you have a village cadre? | 1: Yes; 0: No |
| What is your family’s main source of income? | 1: Agriculture; 0: Off-farm |
| Geographical Factors | Answer |
|---|---|
| Where is your living area? | 1: In the protected area; 2: Outside the protected area |
| How far is your home from the market? | 1: <10 km; 2: 10 km-20 km; 3: 20 km-30 km; 4: >30 km |
| First-Order Index | Second-Order Index | Choose/Fill in the Numbers |
|---|---|---|
| Basic material | Production and living resources | |
| Income | ||
| Housing conditions | ||
| Health | The proportion of medical consumption in total expenditure | |
| Health status | ||
| The ecological environment | ||
| Relations | Neighborhood relationships | |
| Election Fairness | ||
| Trust of people around | ||
| Security | Social security | |
| Medical conditions |
| First-Order Index | Second-Order Index | Choose |
|---|---|---|
| Supply service perception | Increased collection revenue | |
| Increased vegetation cover | ||
| Clean water was provided | ||
| Regulation service perception | Improved air quality | |
| Natural disasters have been reduced | ||
| Reduced pests and diseases | ||
| Cultural service perception | Increased landscape appreciation | |
| Generated a sense of belonging | ||
| Aesthetic value | ||
| Ecotourism value |
References
- Costanza, R.; d’Arge, R.; de Groot, R.; Farber, S.; Grasso, M.; Hannon, B.; Limburg, K.; Naeem, S.; O’Neill, R.V.; Paruelo, J.; et al. The Value of the World’s Ecosystem Services and Natural Capital. Ecol. Econ. 1998, 25, 3–15. [Google Scholar] [CrossRef]
- Ma, L.; Liu, H.; Peng, J.; Wu, J. A Review of Ecosystem Services Supply and Demand. Acta Geogr. Sin. 2017, 72, 1277–1289. [Google Scholar]
- Hu, Y.; Cheng, Y.; Zheng, Z.; Wu, Z.; Li, J.; Yang, Z. Spatial Heterogeneity Change of Guangzhou Ecosystem Services Value. Trop. Geogr. 2018, 38, 475–486. [Google Scholar]
- Corvalan, C.; Hales, S.; Mcmichael, A.; Butler, C.; Younes, M. Ecosystems and Human Well-Being: Health Synthesis; World Health Organization: Geneva, Switzerland, 2005. [Google Scholar]
- Costanza, R.; de Groot, R.D.; Braat, L.; Kubiszewski, I.; Fioramonti, L.; Sutton, P.; Farber, S.; Grasso, M. Twenty Years of Ecosystem Services: How Far Have We Come and How Far Do We Still Need to Go? Ecosyst. Serv. 2017, 28, 1–16. [Google Scholar] [CrossRef]
- Trakolis, D. Local People’s Perceptions of Planning and Management Issues in Prespes Lakes National Park, Greece. J. Environ. Manage. 2001, 61, 227–241. [Google Scholar] [CrossRef] [PubMed]
- Xu, J.; Wang, Q.; Wei, J. Assessment of the Contribution to Human Well-Being by Ecosystem Services in Wolong Natural Reserve from the Perspective of Local Communities. Acta Ecol. Sin. 2018, 38, 7348–7358. [Google Scholar]
- Shen, J.; Hogarth, N.J.; Hou, Y.; Duan, W. Impact of Nature Reserves on Human Well-Being—Evidence from Giant Panda Re-serves in China. J. Forest Econ. 2021, 36, 79–101. [Google Scholar] [CrossRef]
- United Nations Environmental Program and International Union for Conservation of Nature. Protected Planet Report 2020; Island Press: Washington, DC, USA, 2021. [Google Scholar]
- Bonet, F.; Luque, A.P.; Perez, R.; Moreno, R.; Zamora, R. Protected areas as elicitors of human well-being in a developed region: A new synthetic (socioeconomic) approach. Biol. Conserv. 2015, 187, 221–229. [Google Scholar] [CrossRef]
- Anna, G.D.; Fernández, T.V.; Pipitone, C.; Garofalo, G.; Badalamenti, F. Governance analysis in the Egadi Islands Marine Protected Area: A Mediterranean case study. Mar. Policy 2016, 71, 301–309. [Google Scholar]
- Nie, M.; Wang, X.; Qiu, S.; Du, J. Research on the Impact of Ecotourism Development in Nature Reserves on Poor Farmers’ Production and Management Capacity. Issues For. Econ. 2020, 40, 113–121. [Google Scholar]
- Yang, L.; Zhen, L.; Li, F.; Wei, Y.; Jiang, L.; Cao, X.; Long, X. Impacts of Ecosystem Services Change on Human Well-Being in the Loess Plateau. Resour. Sci. 2010, 32, 849–855. [Google Scholar]
- Li, Y.; Li, S.; Gao, Y.; Wang, Y. Ecosystem Services and Hierarchic Human Well-Being: Concepts and Service Classification Framework. Acta Geogr. Sin. 2013, 68, 1038–1047. [Google Scholar]
- Liu, D.Q.; Zhang, J.Q.; Gong, J.; Qian, C.Y. Spatial and Temporal Relations among Land-Use Intensity, Ecosystem Services and Human Well-Being in the Longzhong Loess Hilly Region: A Case Study of the Anding District, Gansu Province. Acta Ecol. Sin. 2019, 39, 637–648. [Google Scholar]
- Vemuri, A.W.; Costanza, R. The Role of Human, Social, Built, and Natural Capital in Explaining Life Satisfaction at the Country Level: Toward a National Well-Being Index (NWI). Ecol. Econ. 2006, 58, 119–133. [Google Scholar] [CrossRef]
- Jones, B.A. Invasive Species Impacts on Human Well-Being Using the Life Satisfaction Index. Ecol. Econ. 2017, 134, 250–257. [Google Scholar] [CrossRef]
- Bondarchik, J.; Jabłońska-Sabuka, M.; Linnanen, L.; Kauranne, T. Improving the Objectivity of Sustainability Indices by a Novel Approach for Combining Contrasting Effects: Happy Planet Index Revisited. Ecol. Indic. 2016, 69, 400–406. [Google Scholar] [CrossRef] [Green Version]
- UNDP. Human Development Indices and Indicators: 2018 Statistical Update; United Nations Development Programme: New York, NY, USA, 2018. [Google Scholar]
- Bagstad, K.J.; Berik, G.; Gaddis, E.J.B. Methodological Developments in US State-Level Genuine Progress Indicators: Toward GPI 2.0. Ecol. Indic. 2014, 45, 474–485. [Google Scholar] [CrossRef]
- Duraiappah, A.K.; Muňoz, P. Inclusive Wealth: A Tool for the United Nations. Envir. Dev. Econ. 2012, 17, 362–367. [Google Scholar] [CrossRef]
- Durand, M. The OECD Better Life Initiative: How’s Life? and the Measurement of Well-Being. Rev. Income Wealth 2015, 61, 4–17. [Google Scholar] [CrossRef]
- Assessment, M.E. Ecosystems and Human Well-Being; Island Press: Washington, DC, USA, 2005. [Google Scholar]
- Summers, J.K.; Smith, L.M.; Case, J.L.; Linthurst, R.A. A Review of the Elements of Human Well-Being with an Emphasis on the Contribution of Ecosystem Services. Ambio 2012, 41, 327–340. [Google Scholar] [CrossRef] [Green Version]
- Smith, L.M.; Case, J.L.; Smith, H.M.; Harwell, L.C.; Summers, J.K. Relating Ecoystem Services to Domains of Human Well-Being: Foundation for a US Index. Ecol. Indic. 2013, 28, 79–90. [Google Scholar] [CrossRef]
- Yang, W.; Dietz, T.; Kramer, D.B.; Chen, X.D.; Liu, J.G. Going beyond the Millennium Ecosystem Assessment: An Index System of Human Well-Being. PLoS ONE 2013, 8, e64582. [Google Scholar] [CrossRef] [PubMed] [Green Version]
- Yang, W.; Dietz, T.; Kramer, D.B.; Ouyang, Z.Y.; Liu, J.G. An Integrated Approach to Understanding the Linkages between Ecosystem Services and Human Well-Being. Ecosyst. Health Sustain. 2015, 1, 1–12. [Google Scholar] [CrossRef]
- Milner-Gulland, E.J.; Mcgregor, J.A.; Agarwala, M.; Atkinson, G.; Bevan, P.; Clements, T.; Daw, T.; Homewood, K.; Kumpel, N.; Lewis, J.; et al. Accounting for the Impact of Conservation on Human Well-Being. Conserv. Biol. 2014, 28, 1160–1166. [Google Scholar] [CrossRef]
- Hori, J.; Makino, M. The Structure of Human Well-Being Related to Ecosystem Services in Coastal Areas: A Comparison among the Six North Pacific Countries. Mar. Policy 2018, 95, 221–226. [Google Scholar] [CrossRef]
- Reyers, B.; Biggs, R.; Cumming, G.S.; Elmqvist, T.; Hejnowicz, A.P.; Polasky, S. Getting the Measure of Ecosystem Services: A Social–Ecological Approach. Front. Ecol. Environ. 2013, 11, 268–273. [Google Scholar] [CrossRef] [Green Version]
- Mooney, H.A.; Cropper, A.; Reid, W. The Millennium Ecosystem Assessment: What Is It All About? Trends Ecol. Evol. 2004, 19, 221–224. [Google Scholar] [CrossRef]
- Liu, J.G.; Huang, L.; Yan, L.J. Impact of Ecosystem Services on Human Well-Being: A Case Study of Tonglu County, Zhejiang Province. Acta Ecol. Sin. 2018, 38, 1687–1697. [Google Scholar]
- Rey-Valette, H.; Mathé, S.; Salles, J.M. An Assessment Method of Ecosystem Services Based on Stakeholders Perceptions: The Rapid Ecosystem Services Participatory Appraisal (RESPA). Ecosyst. Serv. 2017, 28, 311–319. [Google Scholar] [CrossRef]
- Greenland-Smith, S.; Brazner, J.; Sherren, K. Farmer Perceptions of Wetlands and Waterbodies: Using Social Metrics as an Alternative to Ecosystem Service Valuation. Ecol. Econ. 2016, 126, 58–69. [Google Scholar] [CrossRef]
- Quyen, N.T.K.; Berg, H.; Gallardo, W.; Da, C.T. Stakeholders’ Perceptions of Ecosystem Services and Pangasius Catfish Farming Development along the Hau River in the Mekong Delta, Vietnam. Ecosyst. Serv. 2017, 25, 2–14. [Google Scholar] [CrossRef]
- Hansen, K.; Duke, E.; Bond, C.; Purcell, M.; Paige, G. Rancher Preferences for a Payment for Ecosystem Services Program in Southwestern Wyoming. Ecol. Econ. 2018, 146, 240–249. [Google Scholar] [CrossRef]
- Dave, R.; Tompkins, E.L.; Schreckenberg, K. Forest Ecosystem Services Derived by Smallholder Farmers in Northwestern Madagascar: Storm Hazardmitigation and Participation in Forest Management. Forest Policy Econ. 2017, 84, 72–82. [Google Scholar] [CrossRef] [Green Version]
- Ko, H.; Son, Y. Perceptions of Cultural Ecosystem Services in Urban Green Spaces: A Case Study in Gwacheon, Republic of Korea. Ecol. Indic. 2018, 91, 299–306. [Google Scholar] [CrossRef]
- Dietze, V.; Hagemann, N.; Jürges, N.; Bartke, S.; Fürst, C. Farmers Consideration of Soil Ecosystem Services in Agricultural Management—A Case Study from Saxony, Germany. Land Use Policy 2019, 81, 813–824. [Google Scholar] [CrossRef]
- Wang, W.R.; Tian, L.; Tang, Q.; Deng, X.Y. The Game between Ecosystem Anti-Service and Residents’ Survival in Ecological Restoration: A Case Study of “Pigs Advance and People Retreat” in Gansu Province. Geogr. Res. 2018, 37, 772–782. [Google Scholar]
- Hu, L.; Wu, J.; Li, H.P. Coupling Relationship between Ecosystem Services and Residents’ Income and Its Influencing Factors: A Case Study of Lashihai Watershed in Lijiang. Acta Ecol. Sin. 2018, 38, 6402–6411. [Google Scholar]
- Hao, H.G.; Gou, M.M.; Zhang, H.Y.; Zhang, Q.; Liu, Y.J. Research Progress on Evaluation of Ecological Compensation Based on Ecosystem Services and Farmers’ Well-Being. Acta Ecol. Sin. 2018, 38, 6810–6817. [Google Scholar]
- Zhou, L.L.; Guan, D.J.; Yuan, X.Z. Coupling Correlation Analysis of Ecosystem Services and Livelihood of Poor People from the Perspective of Targeted Poverty Alleviation. Acta Ecol. Sin. 2018, 38, 6391–6401. [Google Scholar]
- Ren, T.T.; Zhou, Z.X. The Impact of Agricultural Structure Transformation on Ecosystem Services and Human Well-Being: A Case Study of Two Agricultural Types in Xi’an Metropolitan Area. Acta Ecol. Sin. 2019, 39, 2353–2365. [Google Scholar]
- United Nations Environmental Program. Millennium Ecosystem Assessment Ecosystems and Human Well-Being: A Framework for Assessment; Island Press: Washington, DC, USA, 2005. [Google Scholar]
- Ma, Q.; Pan, Q.; Tu, C. Assessment of biodiversity maintenance function and analysis of its spatial scale effect: Taking Shaanxi Province as an example. J. Nat. Resour. 2021, 36, 1937–1948. [Google Scholar]
- Cao, M.; Qiu, H. Shaanxi Geography; Beijing Normal University Press: Beijing, China, 2018; pp. 1–20. [Google Scholar]
- Liu, S.; Niu, X.; Wang, B.; Song, Q.; Tao, Y. An ecological benefit assessment of the Grain for Green Project in Shaanxi province. Acta Ecol. Sin. 2018, 38, 5759–5770. [Google Scholar]
- Qin, Q.; Liu, J.; Yu, Q.; Ma, B.; Tan, H.; Xie, L.; Wen, Y. Ecological security of giant panda protected areas in Sichuan Province and its temporal and spatial evolution. Acta Ecol. Sin. 2020, 40, 7255–7266. [Google Scholar]
- Hou, Y.; Liu, T.; Zhao, Z.; Wen, Y. Estimating the Cultural Value of Wild Animals in the Qinling Mountains, China: A Choice. Exp. Anim. 2020, 10, 2422. [Google Scholar]
- Ma, B.; Ding, H.; Wen, Y. Research on the Impact of Biodiversity Conservation on Multidimensional Poverty—Based on the Data of Surrounding Communities in Protected Areas of 7 Provinces in China. Agri-Tech Econ. 2017, 4, 116–128. [Google Scholar]
- Ma, B.; Zhang, Y.; Hou, Y.; Wen, Y. Do Protected Areas Matter? A Systematic Review of the Social and Ecological Impacts of the Establishment of Protected Areas. Int. J. Environ. Res. Public Health 2020, 17, 7259. [Google Scholar] [CrossRef]
- Su, K.; Ren, J.; Qin, Y.; Hou, Y.; Wen, Y. Efforts of Indigenous Knowledge in Forest and Wildlife Conservation: A Case Study on Bulang People in Mangba Village in Yunnan Province, China. Forests 2020, 11, 1178. [Google Scholar] [CrossRef]
- Yu, X.; Fu, D. Summary of Multi-index Comprehensive Evaluation Methods. Stat. Decis. 2004, 11, 119–121. [Google Scholar]
- Yang, H.; Fu, P. Application of multi-level fuzzy comprehensive evaluation based on entropy weight. J. North China Electr. Power Univ. 2005, 5, 106–109. [Google Scholar]
- Yu, P.; Wang, L. Selection of non-dimensional method for sample data in financial early warning. Friends Account. 2005, 12, 43–44. [Google Scholar]
- Xia, J.; Huang, X.; Zhang, N. Analysis of the impact of internal and external economic imbalances on my country’s macroeconomics—Based on the seemingly uncorrelated regression method. Econ. Manag. Rev. 2017, 33, 5–11. [Google Scholar]
- Wang, B.; Tang, H.; Xu, Y. Integrating ecosystem services and human well-being into management practices: Insights from a mountain-basin area, China. Ecosyst. Serv. 2017, 27, 58–69. [Google Scholar] [CrossRef]
- Yee, S.H. Contributions of Ecosystem Services to Human Well-Being in Puerto Rico. Sustainability 2020, 12, 9625. [Google Scholar] [CrossRef]
- Russell, R.; Guerry, A.D.; Balvanera, P.; Gould, R.K.; Basurto, X.; Chan, K.; Klain, S.; Levine, J.; Tam, J. Humans and Nature: How Knowing and Experiencing Nature Affect Well-Being. Annu. Rev. Environ. Resour. 2013, 38, 473–502. [Google Scholar] [CrossRef]
- Jiao, X.; Walelign, S.Z.; Nielsen, M.R.; Smith-Hall, C. Protected areas, household environmental incomes and well-being in the Greater Serengeti-Mara Ecosystem. Forest Policy Econ. 2019, 106, 101948. [Google Scholar] [CrossRef]
- Giannetti, B.F.; Faria, L.; Almeida, C.; Agostinho, F.; Coscieme, L.; Liu, G. Human-nature nexuses in Brazil: Monitoring production of economic and ecosystem services in historical series. Ecosyst. Serv. 2018, 30, 248–256. [Google Scholar] [CrossRef]
- Xiong, Y.; Hou, K.L.; Zheng, S.R.; Zhang, K.; Yang, T.H.; Zhao, D.D.; Sun, B.; Chen, L. Relationship between Farmer’s Well-Being and Ecosystem Services in Hilly and Mountainous Areas of South China Based on Structural Equation Model: A Case Study of Lechang in Guangdong Province. Trop. Geogr. 2020, 40, 843–855. [Google Scholar]
- Ma, B.; Zhang, Y.; Huang, Y.; Wen, Y. Socioeconomic and Ecological Direct and Spillover Effects of China’s Giant Panda Nature Reserves. Forest Policy Econ. 2020, 121, 102313. [Google Scholar] [CrossRef]
- Geng, Y.; Sun, S.; Yeo-Chang, Y. Impact of Forest Logging Ban on the Welfare of Local Communities in Northeast China. Forests 2020, 12, 3. [Google Scholar] [CrossRef]
- Shen, J.Y.; Han, X.; Hou, Y.L.; Wen, Y.L. Subjective Well-Being of Households in Rural Poverty Regions in Xiangxi, Hunan Province. Resour. Sci. 2014, 36, 2174–2182. [Google Scholar]

| Name of Reserve | Area (km2) | Protection Object | Administrative Region |
|---|---|---|---|
| Foping National Nature Reserve | 292.4 | Pandas, golden monkeys and other wild animals and their forest ecosystems | Foping county |
| Zhouzhi National Nature Reserve | 563.93 | Golden snub-nosed monkey, panda and other wildlife and habitat | Zhouzhi county |
| Changing National Nature Reserve | 299.06 | Pandas, takins, musk deer and other wild animals and habitats | Yang county |
| Huangbaiyuan National Nature Reserve | 218.65 | Pandas, takin, golden monkey, musk deer | Taibai and Zhouzhi county |
| Laoxiancheng National Nature Reserve | 126.11 | Pandas and their habitats | Zhouzhi county |
| Huangguanshan Provincial Nature Reserve | 123.72 | Pandas | Ningshan county |
| Niuweihe Provincial Nature Reserve | 134.92 | Pandas | Taibai county |
| First-Order Index | Second-Order Index (Satisfaction) | Calculation |
|---|---|---|
| Basic material | Production and living resources | 1 = Very dissatisfied; 2 = Not very satisfied; 3 = neutral; 4 = relatively satisfied; 5 = Very satisfied |
| Income | ||
| Housing conditions | ||
| Health | The proportion of medical consumption in total expenditure | Medical expenditure/total expenditure |
| Health status | 1 = Very dissatisfied; 2 = Not very satisfied; 3 = neutral; 4 = relatively satisfied; 5 = Very satisfied | |
| The ecological environment | ||
| Relations | Neighborhood relationships | 1 = Very dissatisfied; 2 = Not very satisfied; 3 = neutral; 4 = relatively satisfied; 5 = Very satisfied |
| Election Fairness | ||
| Trust of people around | ||
| Security | Social security | 1 = Very dissatisfied; 2 = Not very satisfied; 3 = neutral; 4 = relatively satisfied; 5 = Very satisfied |
| Medical conditions |
| Dimensions of Function | Index Assignment and Meaning | Mean | Standard Deviation |
|---|---|---|---|
| Increased collection revenue | 1 = Strongly disagree; 2 = Disagree; 3 = Neutral; 4 = Agree 5 = Strongly agree | 2.761 | 0.914 |
| Increased vegetation cover | 2.906 | 1.145 | |
| Clean water was provided | 2.856 | 1.210 | |
| Improved air quality | 2.847 | 1.244 | |
| Natural disasters have been reduced | 2.905 | 1.020 | |
| Reduce pests and diseases | 2.871 | 0.922 | |
| Increase the landscape appreciation | 2.971 | 1.039 | |
| Generate a sense of belonging | 2.934 | 0.930 | |
| Aesthetic value | 2.994 | 0.985 | |
| Ecotourism value | 2.971 | 1.038 | |
| Respondent gender | 1 = male; 0 = female | 0.917 | 0.275 |
| Respondent age | 0 = 18 years old and below; 1 = 19–35 years old; 2 = 36–50 years old; 3 = 51–65 years old; 4 = 65 years old and above | 3.426 | 0.990 |
| Highest level of education | 1 = primary school and below; 2 = junior high school (technical secondary school); 3 = senior high school (junior college); 4 = bachelor’s degree or above | 3.277 | 1.053 |
| Physical condition | 1 = good; 2 = neutral; 3 = mild disease; 4 = major disease | 1.506 | 0.806 |
| Village cadres | 1 = yes; 0 = no | 0.086 | 0.280 |
| Main source of revenue | 1 = agriculture; 0 = off-farm | 0.512 | 0.500 |
| Living area | 1 = protected Area; 2 = outside the protected area | 0.298 | 0.458 |
| Distance to market | 1 = 0–10 km; 2 = 10 km–20 km; 3 = 20 km–30 km; 4 > 30 km | 2.715 | 1.487 |
| First-Order Index | Second-Order Index (Satisfaction) | Weight | Equations | Results |
|---|---|---|---|---|
| Basic material B1 | Production and living resources C1 | 0.564 | 0.564 × C1 + 0.285 × C2 + 0.151 × C3 | 0.16 |
| Income C2 | 0.285 | |||
| Housing conditions C3 | 0.151 | |||
| Health B2 | The proportion of medical consumption in total expenditure C4 | 0.771 | 0.771 × C4 + 0.134 × C5 + 0.095 × C6 | 0.44 |
| Health status C5 | 0.134 | |||
| The ecological environment C6 | 0.095 | |||
| Relations B3 | Neighborhood relationships C7 | 0.760 | 0.760 × C7 + 0.119 × C8 + 0.121 × C9 | 0.32 |
| Election Fairness C8 | 0.119 | |||
| Trust of people around C9 | 0.121 | |||
| Security B4 | Social security C10 | 0.316 | 0.316 × C10 + 0.684 × C11 | 0.08 |
| Medical conditions C11 | 0.684 |
| Target Layer | First-Order Index | Index | Second-Order Index (Satisfaction) | Index |
|---|---|---|---|---|
| Farmers’ well-being 1.83 | Basic material | 2.69 | Production and living resources | 2.60 |
| Income | 2.89 | |||
| Housing conditions | 2.63 | |||
| Health | 1.55 | The proportion of medical consumption | 1.34 | |
| Health status | 2.43 | |||
| Ecological environment | 2.02 | |||
| Relations | 2.18 | Neighborhood relationships | 2.25 | |
| Election Fairness | 2.38 | |||
| Trust of people around | 1.53 | |||
| Security | 2.37 | Social security | 2.02 | |
| Medical conditions | 2.53 |
| Explanatory Variables | Coefficient | Standard Error |
|---|---|---|
| Increased collection revenue | −0.007 | 0.008 |
| Increased vegetation cover | 0.036 *** | 0.011 |
| Clean water was provided | 0.024 ** | 0.012 |
| Improved air quality | 0.041 *** | 0.012 |
| Natural disasters have been reduced | −0.016 | 0.011 |
| Reduced pests and diseases | −0.007 | 0.010 |
| Increased landscape appreciation | 0.001 | 0.012 |
| Generated a sense of belonging | 0.023 * | 0.012 |
| Aesthetic value | −0.007 | 0.013 |
| Ecotourism value | 0.025 ** | 0.011 |
| Respondent gender | −0.004 | 0.024 |
| Respondent age | −0.002 | 0.007 |
| Highest level of education | −0.002 | 0.006 |
| Physical condition | −0.018 ** | 0.009 |
| Village cadres | −0.013 | 0.023 |
| Main source of revenue | 0.003 | 0.014 |
| Living area | −0.012 | 0.009 |
| Distance to market | 0.012 *** | 0.005 |
| Explanatory Variables | Production and Living Resources Satisfaction | Income Satisfaction | Housing Condition Satisfaction |
|---|---|---|---|
| Increased collection revenue | −0.013 | −0.023 *** | −0.031 *** |
| (0.010) | (0.005) | (0.007) | |
| Increased vegetation cover | −0.006 | −0.002 | −0.010 |
| (0.014) | (0.008) | (0.009) | |
| Clean water was provided | −0.006 | −0.014 | 0.002 |
| (0.020) | (0.011) | (0.013) | |
| Improved air quality | −0.008 | −0.003 | −0.042 *** |
| (0.019) | (0.010) | (0.012) | |
| Natural disasters have been reduced | 0.013 | 0.003 | 0.015 |
| (0.017) | (0.009) | (0.011) | |
| Reduced pests and diseases | 0.002 | 0.012 | −0.007 |
| (0.016) | (0.009) | (0.010) | |
| Increased landscape appreciation | 0.002 | 0.016 ** | 0.026 *** |
| (0.012) | (0.006) | (0.008) | |
| Generated a sense of belonging | 0.023 | 0.011 | 0.019 ** |
| (0.014) | (0.008) | (0.009) | |
| Aesthetic value | −0.016 | 0.008 | −0.002 |
| (0.014) | (0.007) | (0.009) | |
| Ecotourism value | −0.018 * | 0.030 *** | 0.006 |
| (0.010) | (0.005) | (0.007) |
| Explanatory Variables | The Proportion of Medical Consumption | Health Status Satisfaction | Ecological Environment Satisfaction |
|---|---|---|---|
| Increased collection revenue | −0.004 | −0.005 | 0.005 |
| (0.006) | (0.005) | (0.005) | |
| Increased vegetation cover | 0.004 | −0.010 | 0.011 ** |
| (0.008) | (0.007) | (0.006) | |
| Clean water was provided | −0.012 * | 0.018 *** | 0.002 |
| (0.007) | (0.006) | (0.006) | |
| Improved air quality | −0.023 *** | 0.013 ** | 0.012 *** |
| (0.006) | (0.005) | (0.005) | |
| Natural disasters have been reduced | 0.005 | −0.008 | −0.006 |
| (0.006) | (0.005) | (0.005) | |
| Reduced pests and diseases | 0.009 | −0.009 | −0.005 |
| (0.006) | (0.006) | (0.005) | |
| Increased landscape appreciation | −0.005 | −0.002 | 0.003 |
| (0.006) | (0.005) | (0.005) | |
| Generated a sense of belonging | 0.012 | 0.024 ** | −0.001 |
| (0.008) | (0.007) | (0.006) | |
| Aesthetic value | −0.007 | 0.006 | 0.007 |
| (0.006) | (0.005) | (0.005) | |
| Ecotourism value | 0.011 | 0.008 | 0.009 |
| (0.007) | (0.006) | (0.005) |
| Explanatory Variables | Neighborhood Satisfaction | Satisfaction with Election Fairness | Satisfaction with the Trust of People Around |
|---|---|---|---|
| Increased collection revenue | −0.004 | −0.003 | −0.013 |
| (0.005) | (0.006) | (0.007) | |
| Increased vegetation cover | 0.010 ** | 0.003 | 0.019 *** |
| (0.004) | (0.005) | (0.006) | |
| Clean water was provided | 0.010 ** | 0.015 *** | −0.000 |
| (0.005) | (0.006) | (0.007) | |
| Improved air quality | −0.000 | −0.005 | 0.022 *** |
| (0.005) | (0.006) | (0.007) | |
| Natural disasters have been reduced | 0.010 ** | 0.017 *** | −0.003 |
| (0.005) | (0.006) | (0.007) | |
| Reduced pests and diseases | −0.008 | 0.012 ** | −0.004 |
| (0.005) | (0.006) | (0.008) | |
| Increased landscape appreciation | 0.001 | −0.003 | 0.007 |
| (0.005) | (0.006) | (0.008) | |
| Generated a sense of belonging | 0.011 ** | 0.011 * | 0.012 * |
| (0.005) | (0.006) | (0.007) | |
| Aesthetic value | 0.009 * | 0.010 * | 0.007 |
| (0.005) | (0.006) | (0.007) | |
| Ecotourism value | 0.011 ** | −0.002 | 0.013 * |
| (0.005) | (0.006) | (0.007) |
| Explanatory Variables | Satisfaction with Public Order | Satisfaction with Medical Conditions |
|---|---|---|
| Increased collection revenue | 0.003 | 0.013 ** |
| (0.005) | (0.005) | |
| Increased vegetation cover | 0.012 ** | 0.010 * |
| (0.005) | (0.005) | |
| Clean water was provided | 0.019 *** | 0.009 * |
| (0.005) | (0.005) | |
| Improved air quality | 0.009 * | 0.013 ** |
| (0.005) | (0.005) | |
| Natural disasters have been reduced | −0.008 | −0.012 |
| (0.007) | (0.007) | |
| Reduced pests and diseases | 0.012 * | −0.003 |
| (0.007) | (0.007) | |
| Increased landscape appreciation | −0.005 | 0.007 |
| (0.006) | (0.006) | |
| Generated a sense of belonging | −0.000 | 0.008 |
| (0.006) | (0.006) | |
| Aesthetic value | −0.003 | 0.012 ** |
| (0.006) | (0.006) | |
| Ecotourism value | 0.003 | 0.010 * |
| (0.005) | (0.005) |
Publisher’s Note: MDPI stays neutral with regard to jurisdictional claims in published maps and institutional affiliations. |
© 2021 by the authors. Licensee MDPI, Basel, Switzerland. This article is an open access article distributed under the terms and conditions of the Creative Commons Attribution (CC BY) license (https://creativecommons.org/licenses/by/4.0/).
Share and Cite
Ma, L.; Qin, Y.; Zhang, H.; Zheng, J.; Hou, Y.; Wen, Y. Improving Well-Being of Farmers Using Ecological Awareness around Protected Areas: Evidence from Qinling Region, China. Int. J. Environ. Res. Public Health 2021, 18, 9792. https://doi.org/10.3390/ijerph18189792
Ma L, Qin Y, Zhang H, Zheng J, Hou Y, Wen Y. Improving Well-Being of Farmers Using Ecological Awareness around Protected Areas: Evidence from Qinling Region, China. International Journal of Environmental Research and Public Health. 2021; 18(18):9792. https://doi.org/10.3390/ijerph18189792
Chicago/Turabian StyleMa, Li, Yueting Qin, Han Zhang, Jie Zheng, Yilei Hou, and Yali Wen. 2021. "Improving Well-Being of Farmers Using Ecological Awareness around Protected Areas: Evidence from Qinling Region, China" International Journal of Environmental Research and Public Health 18, no. 18: 9792. https://doi.org/10.3390/ijerph18189792
APA StyleMa, L., Qin, Y., Zhang, H., Zheng, J., Hou, Y., & Wen, Y. (2021). Improving Well-Being of Farmers Using Ecological Awareness around Protected Areas: Evidence from Qinling Region, China. International Journal of Environmental Research and Public Health, 18(18), 9792. https://doi.org/10.3390/ijerph18189792