
Testing the Environmental Kuznets Curve Hypotheses in Chinese Provinces: A Nexus between Regional Government Expenditures and Environmental Quality


Abstract
:1. Introduction
2. Literature Review
3. Methodology and Data Description
3.1. Methodology
3.2. Data Description
4. Empirical Results
4.1. Estimation Results and Discussion
4.2. Discussing the Results of the Study
5. Conclusions and Implications
Author Contributions
Funding
Institutional Review Board Statement
Informed Consent Statement
Data Availability Statement
Conflicts of Interest
References
- China Increasing Investment in Environmental Protection. Available online: http://europe.chinadaily.com.cn/business/2015-08/13/content_21589192 (accessed on 10 August 2021).
- 2020 World Air Quality Report reveals Substantial Air Quality Changes. Available online: https://www.iqair.com/blog/press-releases/covid-19-reduces-air-pollution-in-most-countries (accessed on 16 March 2021).
- Wang, S.; Zhou, D.; Zhou, P.; Wang, Q. CO2 emissions, energy consumption and economic growth in China: A panel data analysis. Energy Policy 2011, 39, 4870–4875. [Google Scholar] [CrossRef]
- Yu, Y.; Du, Y. Impact of technological innovation on CO2 emissions and emissions trend prediction on ‘New Normal’ economy in China. Atmos. Pollut. Res. 2019, 10, 152–161. [Google Scholar] [CrossRef]
- Liang, Q.-M.; Deng, H.-M.; Liu, M. Co-control of CO2 emissions and local pollutants in China: The perspective of adjusting final use behaviors. J. Clean. Prod. 2016, 131, 198–208. [Google Scholar] [CrossRef]
- Fan, J.-L.; Zhang, Y.-J.; Wang, B. The impact of urbanization on residential energy consumption in China: An aggregated and disaggregated analysis. Renew. Sustain. Energy Rev. 2017, 75, 220–233. [Google Scholar] [CrossRef]
- Halkos, G.; Paizanos, E.A. The effect of government expenditure on the environment: An empirical investigation. Ecol. Econ. 2013, 91, 48–56. [Google Scholar] [CrossRef]
- Hao, Y.; Chen, H.; Zhang, Q. Will income inequality affect environmental quality? Analysis based on China’s provincial panel data. Ecol. Indic. 2016, 67, 533–542. [Google Scholar] [CrossRef]
- Omri, A.; Daly, S.; Rault, C.; Chaibi, A. Financial development, environmental quality, trade and economic growth: What causes what in MENA countries. Energy Econ. 2015, 48, 242–252. [Google Scholar] [CrossRef] [Green Version]
- Zhang, Y.-J.; Peng, Y.-L.; Ma, C.-Q.; Shen, B. Can environmental innovation facilitate carbon emissions reduction? Evidence from China. Energy Policy 2017, 100, 18–28. [Google Scholar] [CrossRef]
- López, R.; Palacios, A. Why has Europe Become Environmentally Cleaner? Decomposing the Roles of Fiscal, Trade and Environmental Policies. Environ. Resour. Econ. 2013, 58, 91–108. [Google Scholar] [CrossRef]
- Zhang, Q.; Zhang, S.; Ding, Z.; Hao, Y. Does government expenditure affect environmental quality? Empirical evidence using Chinese city-level data. J. Clean. Prod. 2017, 161, 143–152. [Google Scholar] [CrossRef]
- Chen, C.-W.; Ju, Y.-R.; Chen, C.-F.; Dong, C.-D. Evaluation of organic pollution and eutrophication status of Kaohsiung Harbor, Taiwan. Int. Biodeterior. Biodegrad. 2016, 113, 318–324. [Google Scholar] [CrossRef]
- De-La-Ossa-Carretero, J.A.; Del-Pilar-Ruso, Y.; Casalduero, F.G.; Sánchez-Lizaso, J.L. Monitoring the effects of wastewater treatment strategies. Environ. Monit. Assess. 2016, 188, 1–11. [Google Scholar] [CrossRef]
- Hassan, S.T.; Xia, E.; Khan, N.H.; Shah, S.M.A. Economic growth, natural resources, and ecological footprints: Evidence from Pakistan. Environ. Sci. Pollut. Res. 2019, 26, 2929–2938. [Google Scholar] [CrossRef]
- Zeng, S.; Gao, L.; Shen, R.; Ma, Y.; Li, H. Fiscal Decentralization, Pollution and China’s Tourism Revenue. Sustainability 2020, 12, 1925. [Google Scholar] [CrossRef] [Green Version]
- Zheng, J.; Mi, Z.; Coffman, D.; Milcheva, S.; Shan, Y.; Guan, D.; Wang, S. Regional development and carbon emissions in China. Energy Econ. 2019, 81, 25–36. [Google Scholar] [CrossRef]
- Shehzad, K.; Xiaoxing, L.; Sarfraz, M. Envisaging the asymmetrical association among FDI, ICT, and climate change: A case from developing country. Carbon Manag. 2021, 12, 123–137. [Google Scholar] [CrossRef]
- Zeraibi, A.; Balsalobre-Lorente, D.; Shehzad, K. Examining the Asymmetric Nexus between Energy Consumption, Technological Innovation, and Economic Growth; Does Energy Consumption and Technology Boost Economic Development? Sustainability 2020, 12, 8867. [Google Scholar] [CrossRef]
- Sun, J.; Wang, J.; Wang, T.; Zhang, T. Urbanization, economic growth, and environmental pollution: Partial differential analysis based on the spatial Durbin model. Manag. Environ. Qual. Int. J. 2019, 30, 483–494. [Google Scholar] [CrossRef]
- Muhammad, S.; Long, X.; Salman, M.; Dauda, L. Effect of urbanization and international trade on CO2 emissions across 65 belt and road initiative countries. Energy 2020, 196, 117102. [Google Scholar] [CrossRef]
- Amri, F. Carbon dioxide emissions, output, and energy consumption categories in Algeria. Environ. Sci. Pollut. Res. 2017, 24, 14567–14578. [Google Scholar] [CrossRef]
- Grossman, G.M.; Krueger, A.B. Environmental Impacts of a North American Free Trade Agreement, NBER Working Papers Series, National Bureau of Economic Research: Cambridge, MA, USA, 1991. [CrossRef]
- Huang, J.-T. Sulfur dioxide (SO2) emissions and government spending on environmental protection in China—Evidence from spatial econometric analysis. J. Clean. Prod. 2018, 175, 431–441. [Google Scholar] [CrossRef]
- Hao, Y.; Wu, Y.; Wu, H.; Ren, S. How do FDI and technical innovation affect environmental quality? Evidence from China. Environ. Sci. Pollut. Res. 2019, 27, 7835–7850. [Google Scholar] [CrossRef]
- Xu, C.; Yiwen, Z.; Cheng, B.; Li, L.; Zhang, M. Study on environmental Kuznets Curve for noise pollution: A case of 111 Chinese cities. Sustain. Cities Soc. 2020, 63, 102493. [Google Scholar] [CrossRef]
- Hao, Y.; Chen, Y.-F.; Liao, H.; Wei, Y.-M. China’s fiscal decentralization and environmental quality: Theory and an empirical study. Environ. Dev. Econ. 2020, 25, 159–181. [Google Scholar] [CrossRef]
- Jiang, L.; Zhou, H.; He, S. The role of governments in mitigating SO2 pollution in China: A perspective of fiscal expenditure. Environ. Sci. Pollut. Res. 2020, 27, 33951–33964. [Google Scholar] [CrossRef] [PubMed]
- Canavire-Bacarreza, G.; Martinez-Vazquez, J.; Yedgenov, B. Identifying and disentangling the impact of fiscal decentralization on economic growth. World Dev. 2020, 127, 104742. [Google Scholar] [CrossRef] [Green Version]
- Ekeocha, D.O. Urbanization, inequality, economic development and ecological footprint: Searching for turning points and regional homogeneity in Africa. J. Clean. Prod. 2021, 291, 125244. [Google Scholar] [CrossRef]
- Elheddad, M.; Djellouli, N.; Tiwari, A.K.; Hammoudeh, S. The relationship between energy consumption and fiscal decentralization and the importance of urbanization: Evidence from Chinese provinces. J. Environ. Manag. 2020, 264, 110474. [Google Scholar] [CrossRef]
- Zeng, S.; Zhou, Y. Foreign Direct Investment’s Impact on China’s Economic Growth, Technological Innovation and Pollution. Int. J. Environ. Res. Public Health 2021, 18, 2839. [Google Scholar] [CrossRef]
- Yuelan, P.; Akbar, M.W.; Hafeez, M.; Ahmad, M.; Zia, Z.; Ullah, S. The nexus of fiscal policy instruments and environmental degradation in China. Environ. Sci. Pollut. Res. 2019, 26, 28919–28932. [Google Scholar] [CrossRef]
- Hao, Y.; Zheng, S.; Zhao, M.; Wu, H.; Guo, Y.; Li, Y. Reexamining the relationships among urbanization, industrial structure, and environmental pollution in China—New evidence using the dynamic threshold panel model. Energy Rep. 2020, 6, 28–39. [Google Scholar] [CrossRef]
- Ullah, S.; Ozturk, I.; Sohail, S. The asymmetric effects of fiscal and monetary policy instruments on Pakistan’s environmental pollution. Environ. Sci. Pollut. Res. 2021, 28, 7450–7461. [Google Scholar] [CrossRef]
- Basoglu, A.; Uzar, U. An empirical evaluation about the effects of environmental expenditures on environmental quality in coordinated market economies. Environ. Sci. Pollut. Res. 2019, 26, 23108–23118. [Google Scholar] [CrossRef]
- Halkos, G.E.; Paizanos, E.A. The channels of the effect of government expenditure on the environment: Evidence using dynamic panel data. J. Environ. Plan. Manag. 2016, 60, 135–157. [Google Scholar] [CrossRef]
- Luo, G.; Weng, J.-H.; Zhang, Q.; Hao, Y. A reexamination of the existence of environmental Kuznets curve for CO2 emissions: Evidence from G20 countries. Nat. Hazards 2017, 85, 1023–1042. [Google Scholar] [CrossRef]
- Arellano, M.; Bond, S. Some Tests of Specification for Panel Data: Monte Carlo Evidence and an Application to Employment Equations. Rev. Econ. Stud. 1991, 58, 277. [Google Scholar] [CrossRef] [Green Version]
- Blundell, R.; Bond, S. Initial conditions and moment restrictions in dynamic panel data models. J. Econom. 1998, 87, 115–143. [Google Scholar] [CrossRef] [Green Version]
- Hao, Y.; Zhang, Z.-Y.; Liao, H.; Wei, Y.-M.; Wang, S. Is CO2 emission a side effect of financial development? An empirical analysis for China. Environ. Sci. Pollut. Res. 2016, 23, 21041–21057. [Google Scholar] [CrossRef]
- Phillips, R.F. A Comparison of First-Difference and Forward Orthogonal Deviations GMM. 2019, pp. 1–13. Available online: http://arxiv.org/abs/1907.12880 (accessed on 10 July 2021).
- Fan, W.; Li, L.; Wang, F.; Li, D. Driving factors of CO2 emission inequality in China: The role of government expenditure. China Econ. Rev. 2020, 64. [Google Scholar] [CrossRef]
- Hansen, B.E. Testing for Parameter Instability in Linear Models. J. Policy Model. 1992, 14, 517–533. [Google Scholar] [CrossRef]
- Aljadani, A.; Toumi, H.; Toumi, S.; Hsini, M.; Jallali, B. Investigation of the N-shaped environmental Kuznets curve for COVID-19 mitigation in the KSA. Environ. Sci. Pollut. Res. 2021. [Google Scholar] [CrossRef] [PubMed]
- Twerefou, D.K.; Danso-Mensah, K.; Bokpin, G.A. The environmental effects of economic growth and globalization in Sub-Sharan Africa: A panel general method of moments approach. Res. Int. Bus. Financ. 2017, 42, 939–949. [Google Scholar] [CrossRef]
- Junaidi, J.; Jamal, A.; Syahnur, S. Sukuk and Endogenous Growth in Indonesia: Generalized Method of Moments Approach. Adv. Soc. Sci. Educ. Humanit. Res. 2019, 292, 633–639. [Google Scholar] [CrossRef]
- López, R.; Galinato, G.I.; Islam, A. Fiscal spending and the environment: Theory and empirics. J. Environ. Econ. Manag. 2011, 62, 180–198. [Google Scholar] [CrossRef]
- Zhou, K.; Zhou, B.; Yu, M. The impacts of fiscal decentralization on environmental innovation in China. Growth Change 2020, 51, 1690–1710. [Google Scholar] [CrossRef]
- Nathaniel, S.P. Ecological footprint, energy use, trade, and urbanization linkage in Indonesia. GeoJournal 2020, 7, 1–14. [Google Scholar] [CrossRef]
- Gu, C.; Xie, H.; Lu, X.; Zhang, C. CGMVAE: Coupling GMM Prior and GMM Estimator for Unsupervised Clustering and Disentanglement. IEEE Access 2021, 9, 65140–65149. [Google Scholar] [CrossRef]
- Zhang, J. Environmental Kuznets Curve Hypothesis on CO2 Emissions: Evidence for China. J. Risk Financ. Manag. 2021, 14, 93. [Google Scholar] [CrossRef]
- Pal, D.; Mitra, S.K. The environmental Kuznets curve for carbon dioxide in India and China: Growth and pollution at crossroad. J. Policy Model. 2017, 39, 371–385. [Google Scholar] [CrossRef]
- Lan, H.; Hart, C.A.; Yujia, M.; Kovacic, Z.J. Fiscal Decentralization, Environmental Accountability and the Provision of Environmental Public Goods in China: Evidence from 30 Provinces. SSRN Electron. J. 2014, 1–26. [Google Scholar] [CrossRef]
- Zheng, W.; Walsh, P.P. Economic growth, urbanization and energy consumption—A provincial level analysis of China. Energy Econ. 2019, 80, 153–162. [Google Scholar] [CrossRef]
- Aydin, C.; Esen, Ö.; Aydin, R. Is the ecological footprint related to the Kuznets curve a real process or rationalizing the ecological consequences of the affluence? Evidence from PSTR approach. Ecol. Indic. 2019, 98, 543–555. [Google Scholar] [CrossRef]
- Cheng, S.; Fan, W.; Chen, J.; Meng, F.; Liu, G.; Song, M.; Yang, Z. The impact of fiscal decentralization on CO2 emissions in China. Energy 2020, 192. [Google Scholar] [CrossRef]
- Sinha, A.; Shahbaz, M.; Balsalobre, D. Exploring the relationship between energy usage segregation and environmental degradation in N-11 countries. J. Clean. Prod. 2017, 168, 1217–1229. [Google Scholar] [CrossRef] [Green Version]
- Ali, H.S.; Law, S.H.; Lin, W.L.; Yusop, Z.; Chin, L.; Bare UA, A. Financial development and carbon dioxide emissions in Nigeria: Evidence from the ARDL bounds approach. GeoJournal 2019, 84, 641–655. [Google Scholar] [CrossRef]
- Ahmed, Z.; Asghar, M.M.; Malik, M.N.; Nawaz, K. Moving towards a sustainable environment: The dynamic linkage between natural resources, human capital, urbanization, economic growth, and ecological footprint in China. Resour. Policy 2020, 67, 101677. [Google Scholar] [CrossRef]
- Lu, C.; Venevsky, S.; Shi, X.; Wang, L.; Wright, J.S.; Wu, C. Econometrics of the environmental Kuznets curve: Testing advancement to carbon intensity-oriented sustainability for eight economic zones in China. J. Clean. Prod. 2021, 283, 124561. [Google Scholar] [CrossRef]
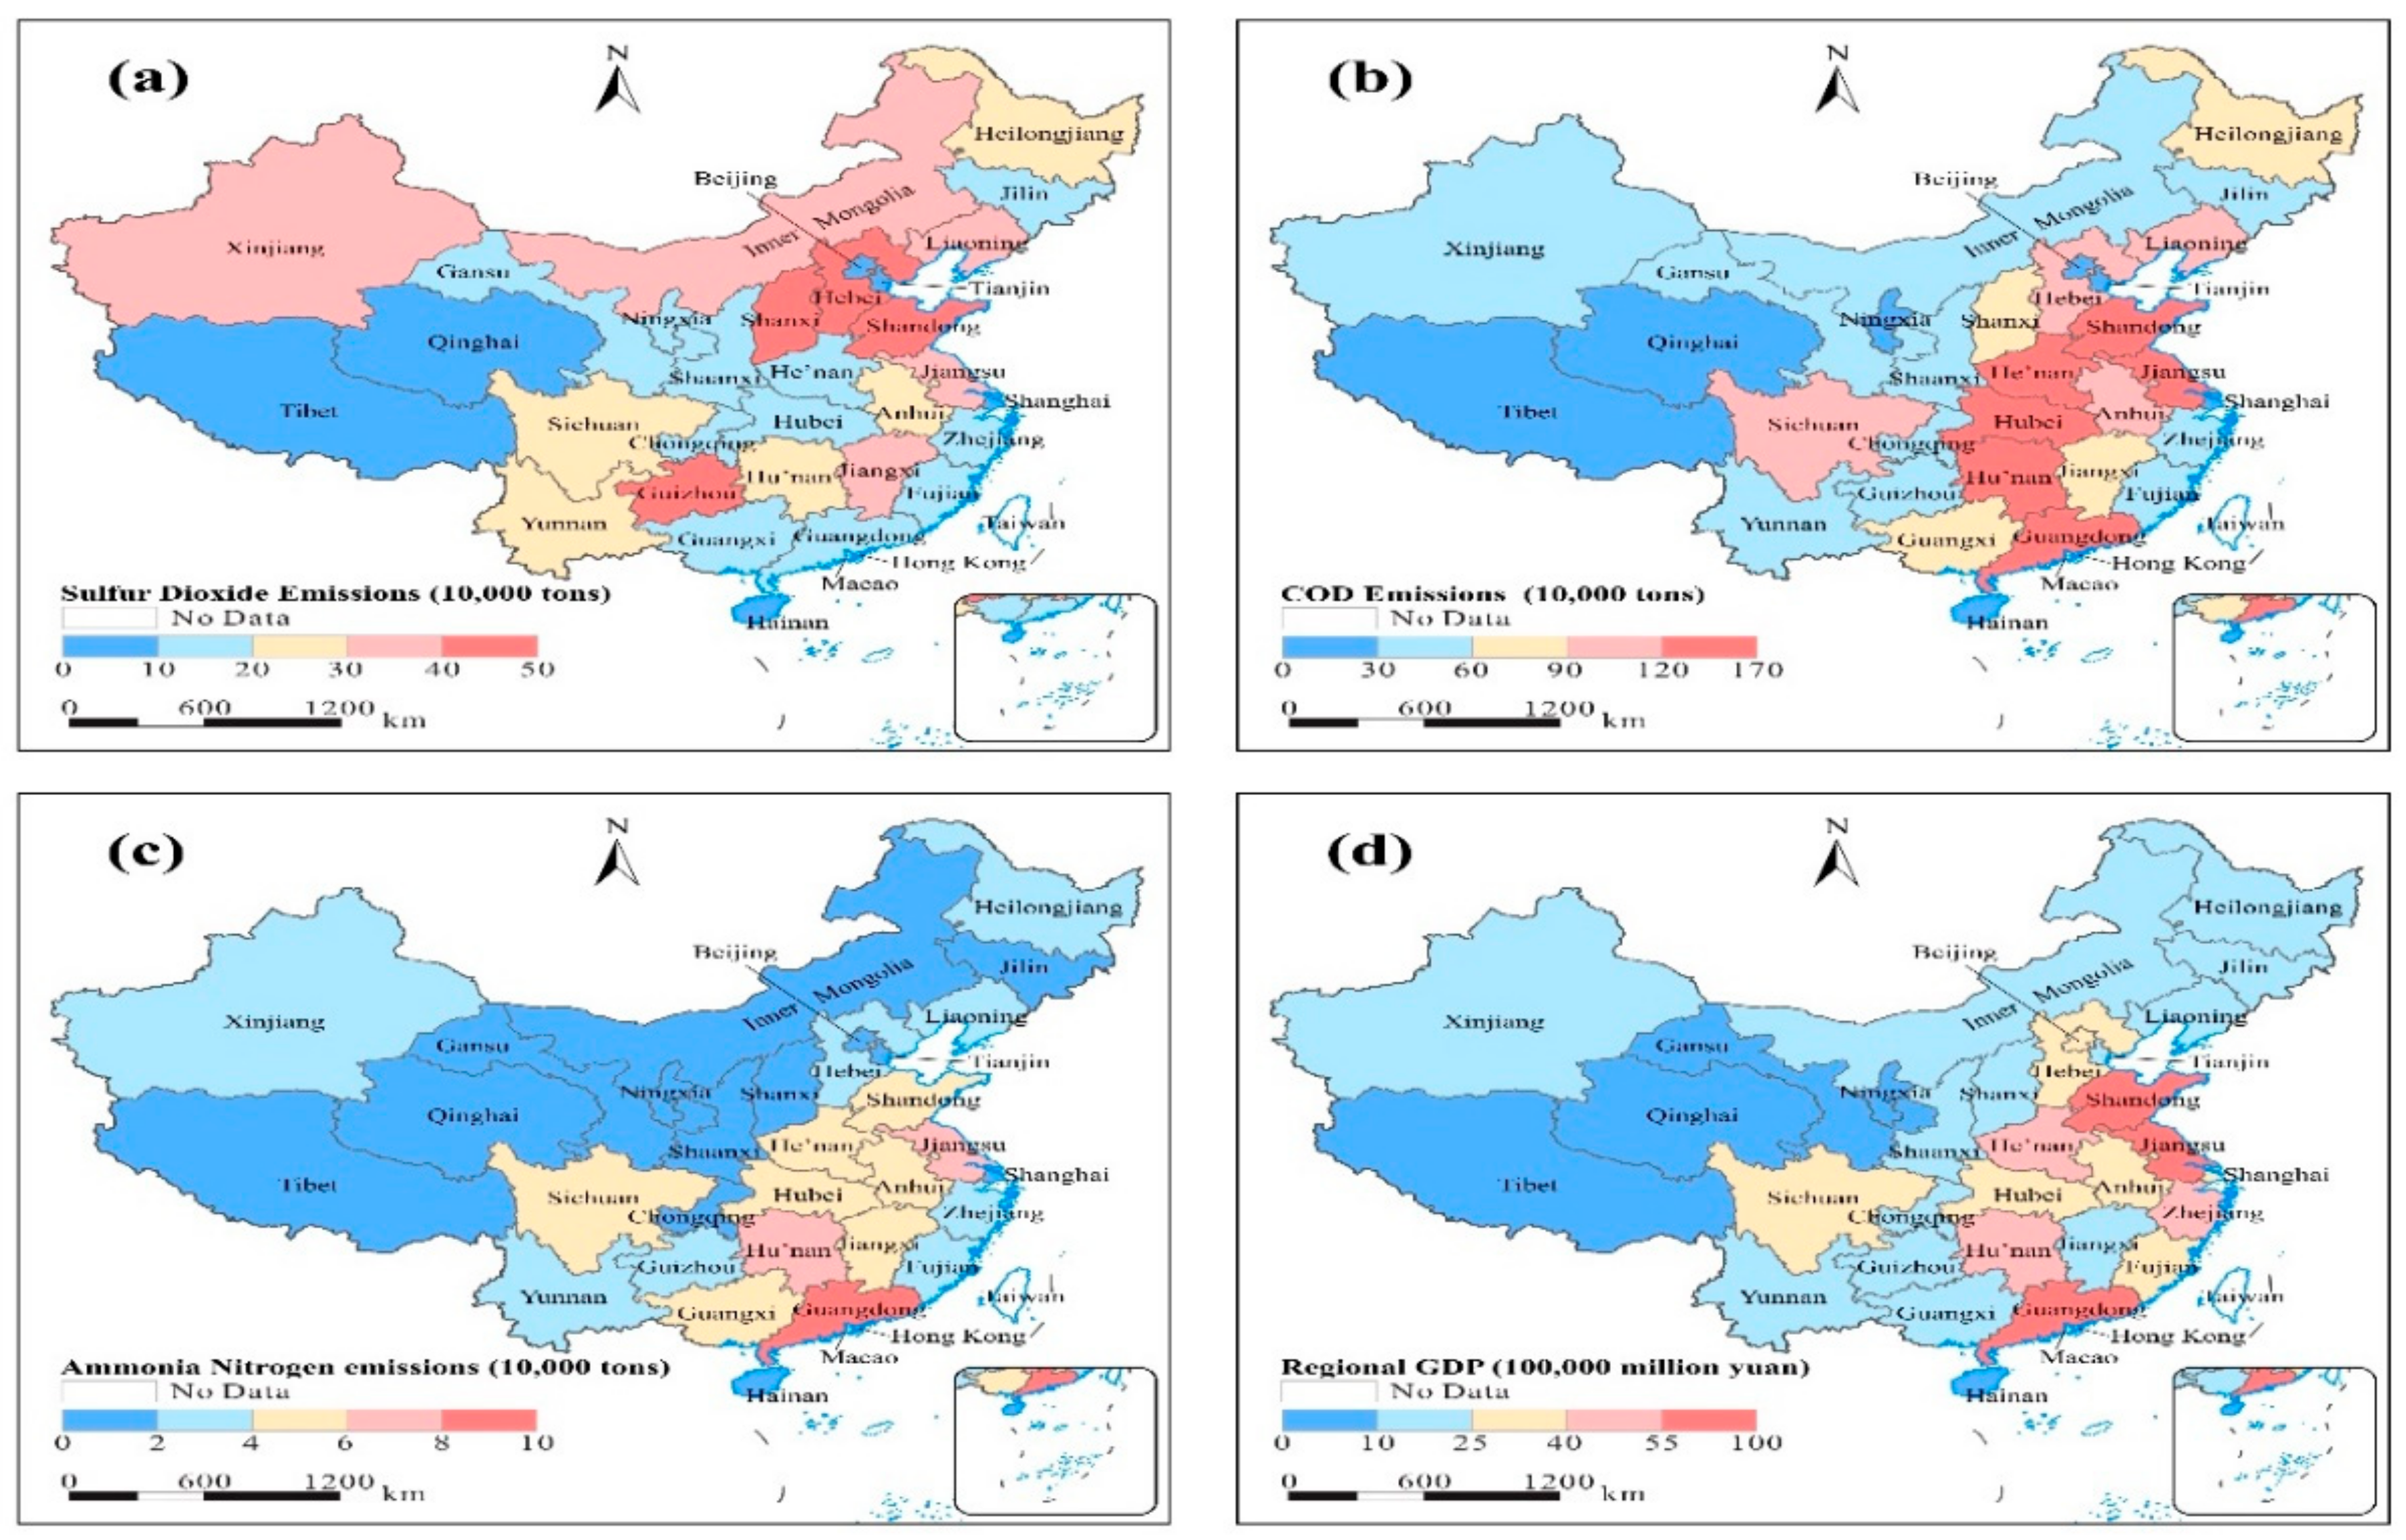

| Variable | Definition | Mesures | Ressources |
|---|---|---|---|
| COD | COD Emission in Waste Water | (10,000 tons) | National Bureau of Statistics of China, 2018 |
| NOx | Ammonia Nitrogen Emission in Waste Water | (10,000 tons) | |
| SO2 | Sulphur Dioxide Emission in Waste Gas | (10,000 tons) | |
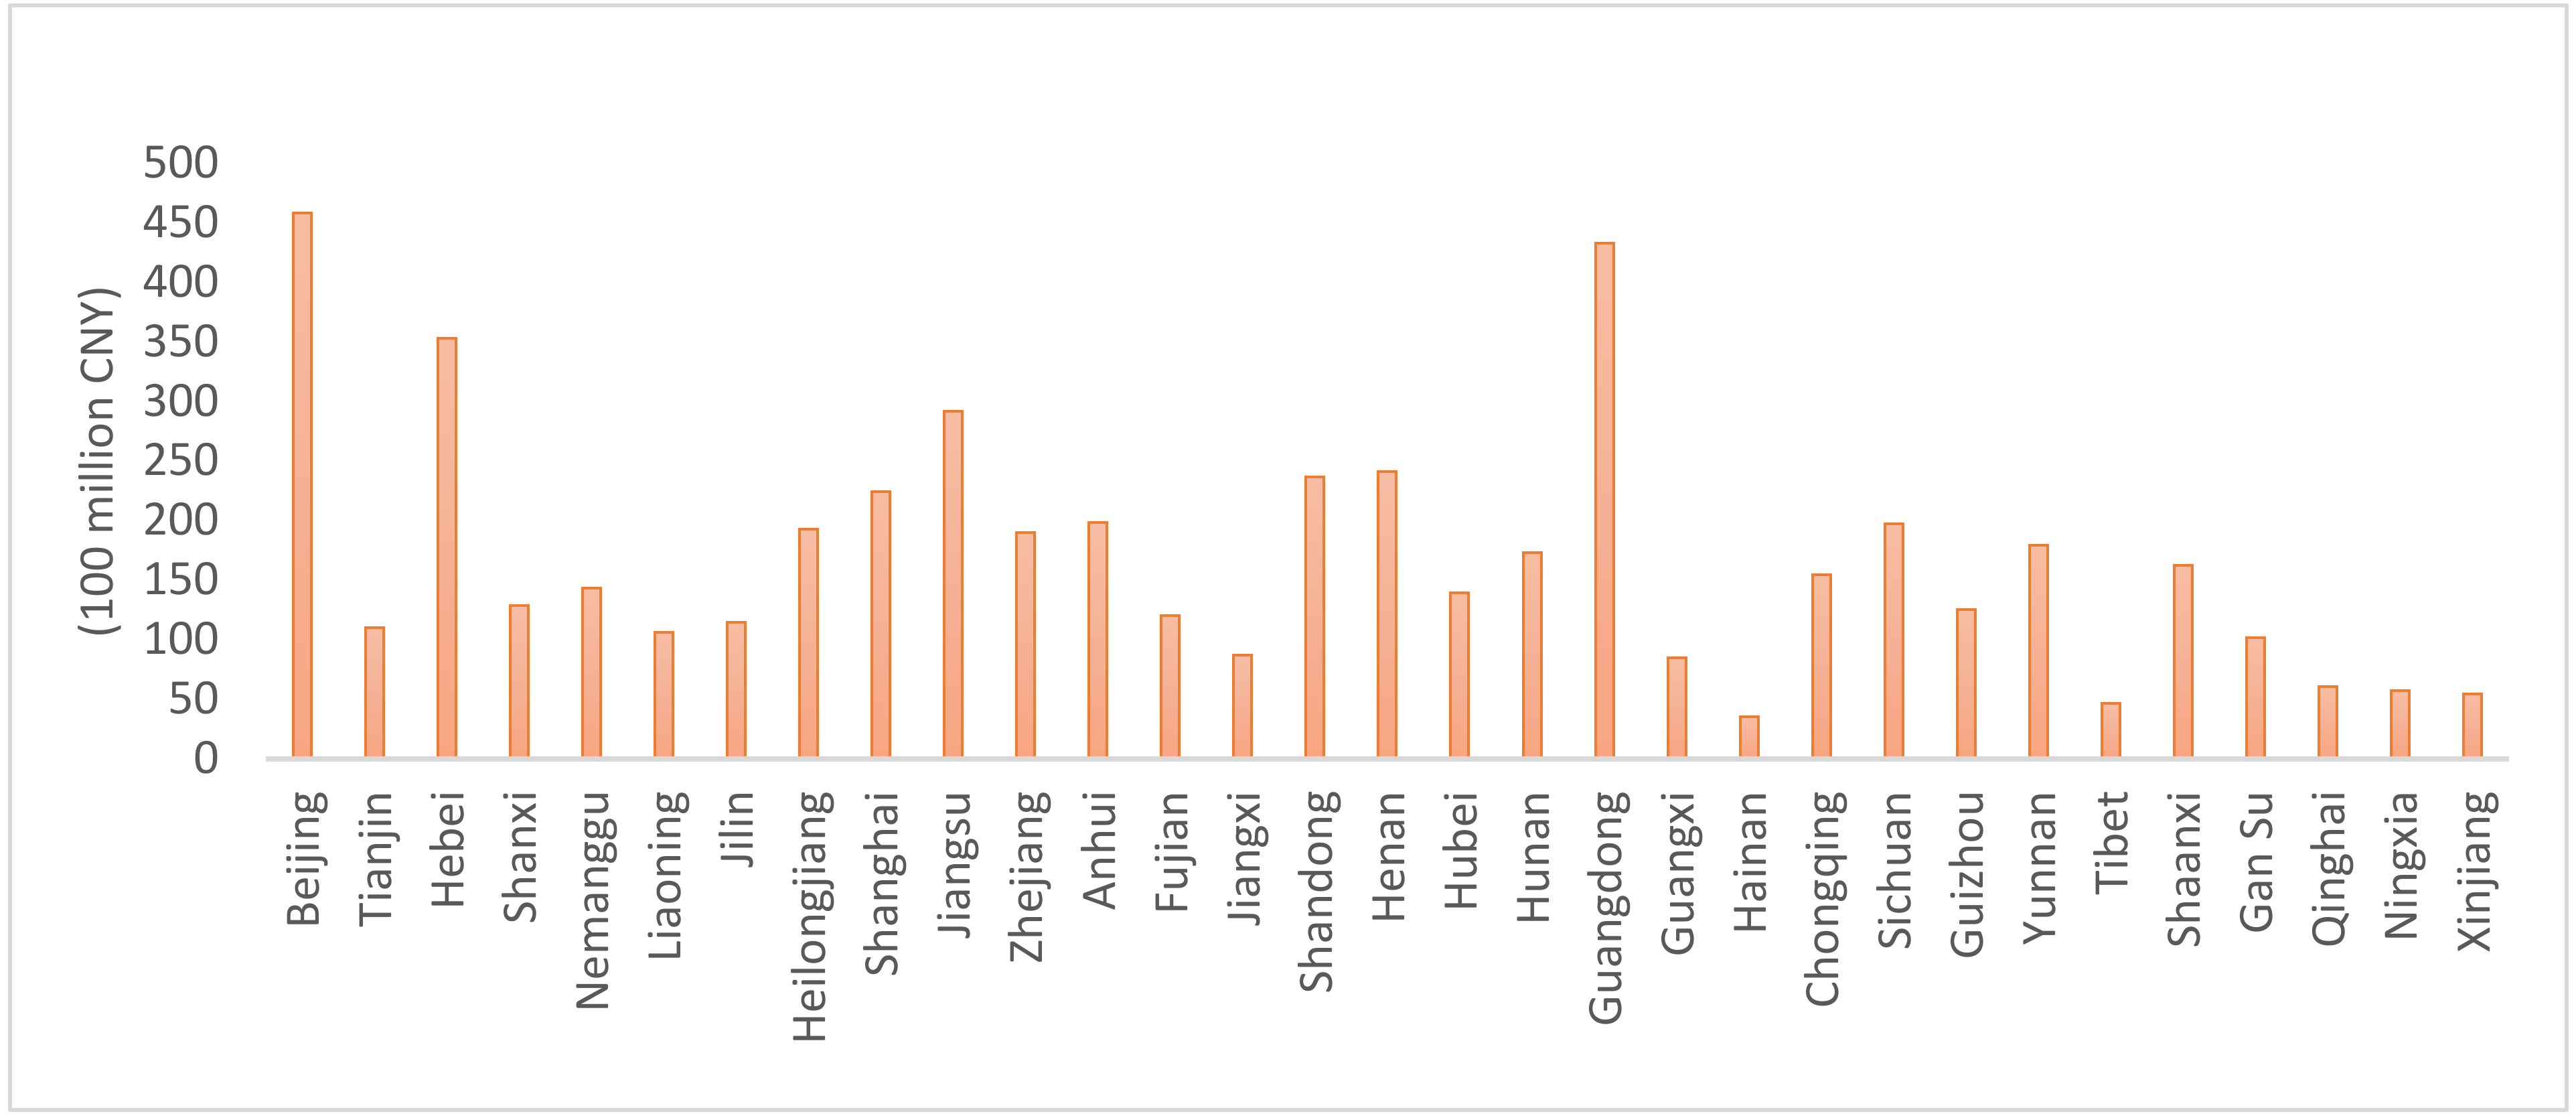
| LGE | Local government expenditure | (100 million yuan) | |
| ENVE | provincial environmental expenditure | (100 million yuan) | |
| GDPP | Per Capita Gross Regional Product | (yuan/person) | |
| GDPP2 | Per Capita Gross Regional Product square | (yuan/person) | |
| GDPP3 | Per Capita Gross Regional Product cube | (yuan/person) | |
| SSVA | second-sector value added | (100 million yuan) |
| Variables | Mean | Median | Maximum | Minimum | Standard Deviation | Skewness | Kurtosis | Jarque–Bera | Sum | p-Value | Sum of Squares | Observation |
|---|---|---|---|---|---|---|---|---|---|---|---|---|
| (GDPP) | 9.336 | 9.453 | 11.425 | 5.840 | 1.060 | −0.802 | 3.634 | 42.357 | 3183.777 | 0.00 | 382.672 | 341 |
| (COD) | 3.738 | 3.887 | 5.289 | 0.405 | 0.942 | −0.925 | 4.015 | 63.352 | 1274.882 | 0.00 | 302.316 | 341 |
| (SO2) | 7.362 | 8.006 | 10.416 | −3.543 | 2.576 | −2.011 | 7.520 | 520.294 | 2510.695 | 0.00 | 2257.490 | 341 |
| (AN) | 1.388 | 1.558 | 3.139 | −1.966 | 0.973 | −0.914 | 3.891 | 58.877 | 473.608 | 0.00 | 322.307 | 341 |
| (LGE) | 7.881 | 8.028 | 9.618 | 5.488 | 0.758 | −0.640 | 3.310 | 24.683 | 2687.438 | 0.00 | 195.762 | 341 |
| (ENVE) | 4.302 | 4.411 | 6.127 | 1.562 | 0.786 | −0.665 | 3.836 | 35.093 | 1467.277 | 0.002 | 210.492 | 341 |
| (SSVA) | 4.698 | 4.700 | 4.819 | 4.472 | 0.051 | −0.378 | 3.498 | 11.679 | 1602.225 | 0.000 | 0.914 | 341 |
| (FMOLS) | Difference–GMM | Orthogonal–GMM | |
|---|---|---|---|
| Ln(GDPP)(−1) | 0.681 * | 0.681 * | |
| 32.917 | 11.563 | ||
| Ln(LGE) | 1.056 * | 0.337 * | 0.318 * |
| 11.104 | 14.197 | 6.007 | |
| Ln(ENVE) | −0.145 *** | −0.131 * | −0.103 * |
| −1.666 | −15.3904 | −4.409 | |
| Ln(SO2) | 0.025 | −0.020 | −0.018 * |
| 1.380 | −6.536 | −3.418 | |
| Ln(COD) | 0.018 | 0.023 * | 0.017 * |
| 0.245 | 6.511 | 2.337 | |
| Ln(AN) | 0.360 * | −0.023 * | −0.016 |
| 4.657 | −2.891 | −1.422 | |
| Ln(SSVA) | 0.183 *** | 0.844 * | 0.696 * |
| 1.73 | 19.123 | 3.297 | |
| R-squared | 0.880 | ||
| Adjusted R-squared | 0.878 | ||
| S.E. of regression | 0.362 | ||
| Long-run variance | 0.220 | ||
| Root MSE | 0.050 | 0.040 | |
| S.D. dependent var. | 0.050 | 0.189 | |
| Sum squared resid. | 0.708 | 0.463 | |
| Instrument rank | 32 | 45 |
| (FMOLS) | Difference–GMM | Orthogonal–GMM | |
|---|---|---|---|
| Ln(SO2)(−1) | 1.290 *** | 0.649 * | |
| 21.8341 | 0.871 | ||
| Ln(GDPP) | −11.919 ** | −49.588 | −2.375 * |
| −2.235 | −14.538 | −0.752 | |
| Ln(GDPP)2 | 2.166 * | 6.107 | 0.334 * |
| 3.5012 | 14.858 | 0.401 | |
| Ln(GDPP)3 | −0.099 * | −0.249 ** | −0.027 * |
| −4.109 | −15.594 | −0.517 | |
| Ln(LGE) | −3.355 * | 1.353 * | 2.360 * |
| −4.904 | 11.222 | 3.290 | |
| Ln(ENVE) | 1.685 * | −0.408 *** | −0.372 * |
| 3.758 | −9.731 | −1.097 | |
| Ln(SSVA) | 6.572 ** | 3.381 * | 1.878 * |
| 2.144 | 21.087 | 0.290 | |
| R-squared | 0.441 | ||
| Adjusted R-squared | 0.382 | ||
| S.E. of regression | 54.3194 | ||
| Long-run variance | 31 | ||
| Root MSE | 0.535 | 0.658 | |
| S.D. dependent var. | 0.591 | 0.610 | |
| Sum squared resid. | 79.9968 | 121.05 | |
| Instrument rank | 32 | 31 |
| (FMOLS) | Difference–GMM | Orthogonal–GMM | |
|---|---|---|---|
| Ln (COD)(−1) | 0.092 * | 0.040 * | |
| 7.598 | 2.078 | ||
| Ln (GDPP) | −4.256 * | −22.067 * | −0.626 * |
| −2.615 | −9.427 | −0.822 | |
| Ln (GDPP)2 | 0.651 * | 3.047 * | 0.092 ** |
| 3.447 | 10.141 | 3.725 | |
| Ln (GDPP)3 | −0.026 * | −0.123 * | −0.003 |
| −3.608 | −10.044 | −4.310 | |
| Ln(LGE) | −0.452 ** | −0.812 * | −0.532 |
| −2.164 | −6.303 | −0.595 | |
| Ln(ENVE) | 0.249 *** | −0.210 * | 0.258 |
| 1.825 | −11.741 | −1.527 | |
| Ln(SSVA) | 2.361 ** | 6.224 * | 1.034 * |
| 2.524 | 12.453 | 6.593 | |
| R-squared | 0.633 | ||
| Adjusted R-squared | 0.627 | ||
| S.E. of regression | 0.576 | ||
| Long-run variance | 0.622 | ||
| Root MSE | 0.492 | 0.400 | |
| S.D. dependent var | 0.445 | 0.382 | |
| Sum squared resid | 67.801 | 44.655 | |
| Instrument rank | 32 | 32 |
| (FMOLS) | Difference–GMM | Orthogonal–GMM | |
|---|---|---|---|
| Ln(AN)it(−1) | 0.692 * | 0.689 * | |
| 19.364 | 21.051 | ||
| Ln(GDPP) | −5.804 * | −49.093 * | −40.810 * |
| −3.924 | −4.432 | −3.252 | |
| Ln(GDPP)2 | 0.823 * | 5.588 * | 4.642 * |
| 4.797 | 4.416 | 3.331 | |
| Ln(GDPP)3 | −0.032 * | −0.215 * | −0.179 * |
| −4.817 | −4.564 | −3.521 | |
| Ln(LGE) | −0.404 * | 2.415 * | 2.483 * |
| −2.131 | 6.472 | 6.288 | |
| Ln(ENVE) | 0.023 * | −0.916 * | −0.967 * |
| 0.187 | −6.485 | −6.920 | |
| Ln(SSVA) | 2.845 * | 8.882 * | 9.337 * |
| 3.347 | 12.200 | 8.549 | |
| R-squared | 0.664 | ||
| Adjusted R-squared | 0.658 | ||
| S.E. of regression | 0.569 | ||
| Long-run variance | 0.514 | ||
| Root MSE | 0.459 | 0.459 | |
| S.D. dependent var. | 0.373 | 0.420 | |
| Sum squared resid. | 59.027 | 58.871 | |
| Instrument rank | 31 | 31 |
Publisher’s Note: MDPI stays neutral with regard to jurisdictional claims in published maps and institutional affiliations. |
© 2021 by the authors. Licensee MDPI, Basel, Switzerland. This article is an open access article distributed under the terms and conditions of the Creative Commons Attribution (CC BY) license (https://creativecommons.org/licenses/by/4.0/).
Share and Cite
Zeraibi, A.; Balsalobre-Lorente, D.; Shehzad, K. Testing the Environmental Kuznets Curve Hypotheses in Chinese Provinces: A Nexus between Regional Government Expenditures and Environmental Quality. Int. J. Environ. Res. Public Health 2021, 18, 9667. https://doi.org/10.3390/ijerph18189667
Zeraibi A, Balsalobre-Lorente D, Shehzad K. Testing the Environmental Kuznets Curve Hypotheses in Chinese Provinces: A Nexus between Regional Government Expenditures and Environmental Quality. International Journal of Environmental Research and Public Health. 2021; 18(18):9667. https://doi.org/10.3390/ijerph18189667
Chicago/Turabian StyleZeraibi, Ayoub, Daniel Balsalobre-Lorente, and Khurram Shehzad. 2021. "Testing the Environmental Kuznets Curve Hypotheses in Chinese Provinces: A Nexus between Regional Government Expenditures and Environmental Quality" International Journal of Environmental Research and Public Health 18, no. 18: 9667. https://doi.org/10.3390/ijerph18189667
APA StyleZeraibi, A., Balsalobre-Lorente, D., & Shehzad, K. (2021). Testing the Environmental Kuznets Curve Hypotheses in Chinese Provinces: A Nexus between Regional Government Expenditures and Environmental Quality. International Journal of Environmental Research and Public Health, 18(18), 9667. https://doi.org/10.3390/ijerph18189667