
Body Mass and Income: Gender and Occupational Differences


Abstract
:1. Introduction
1.1. Background
1.2. Literature Review
1.3. Study Outline
2. Material and Methods
2.1. Data
2.2. Statistical Analysis
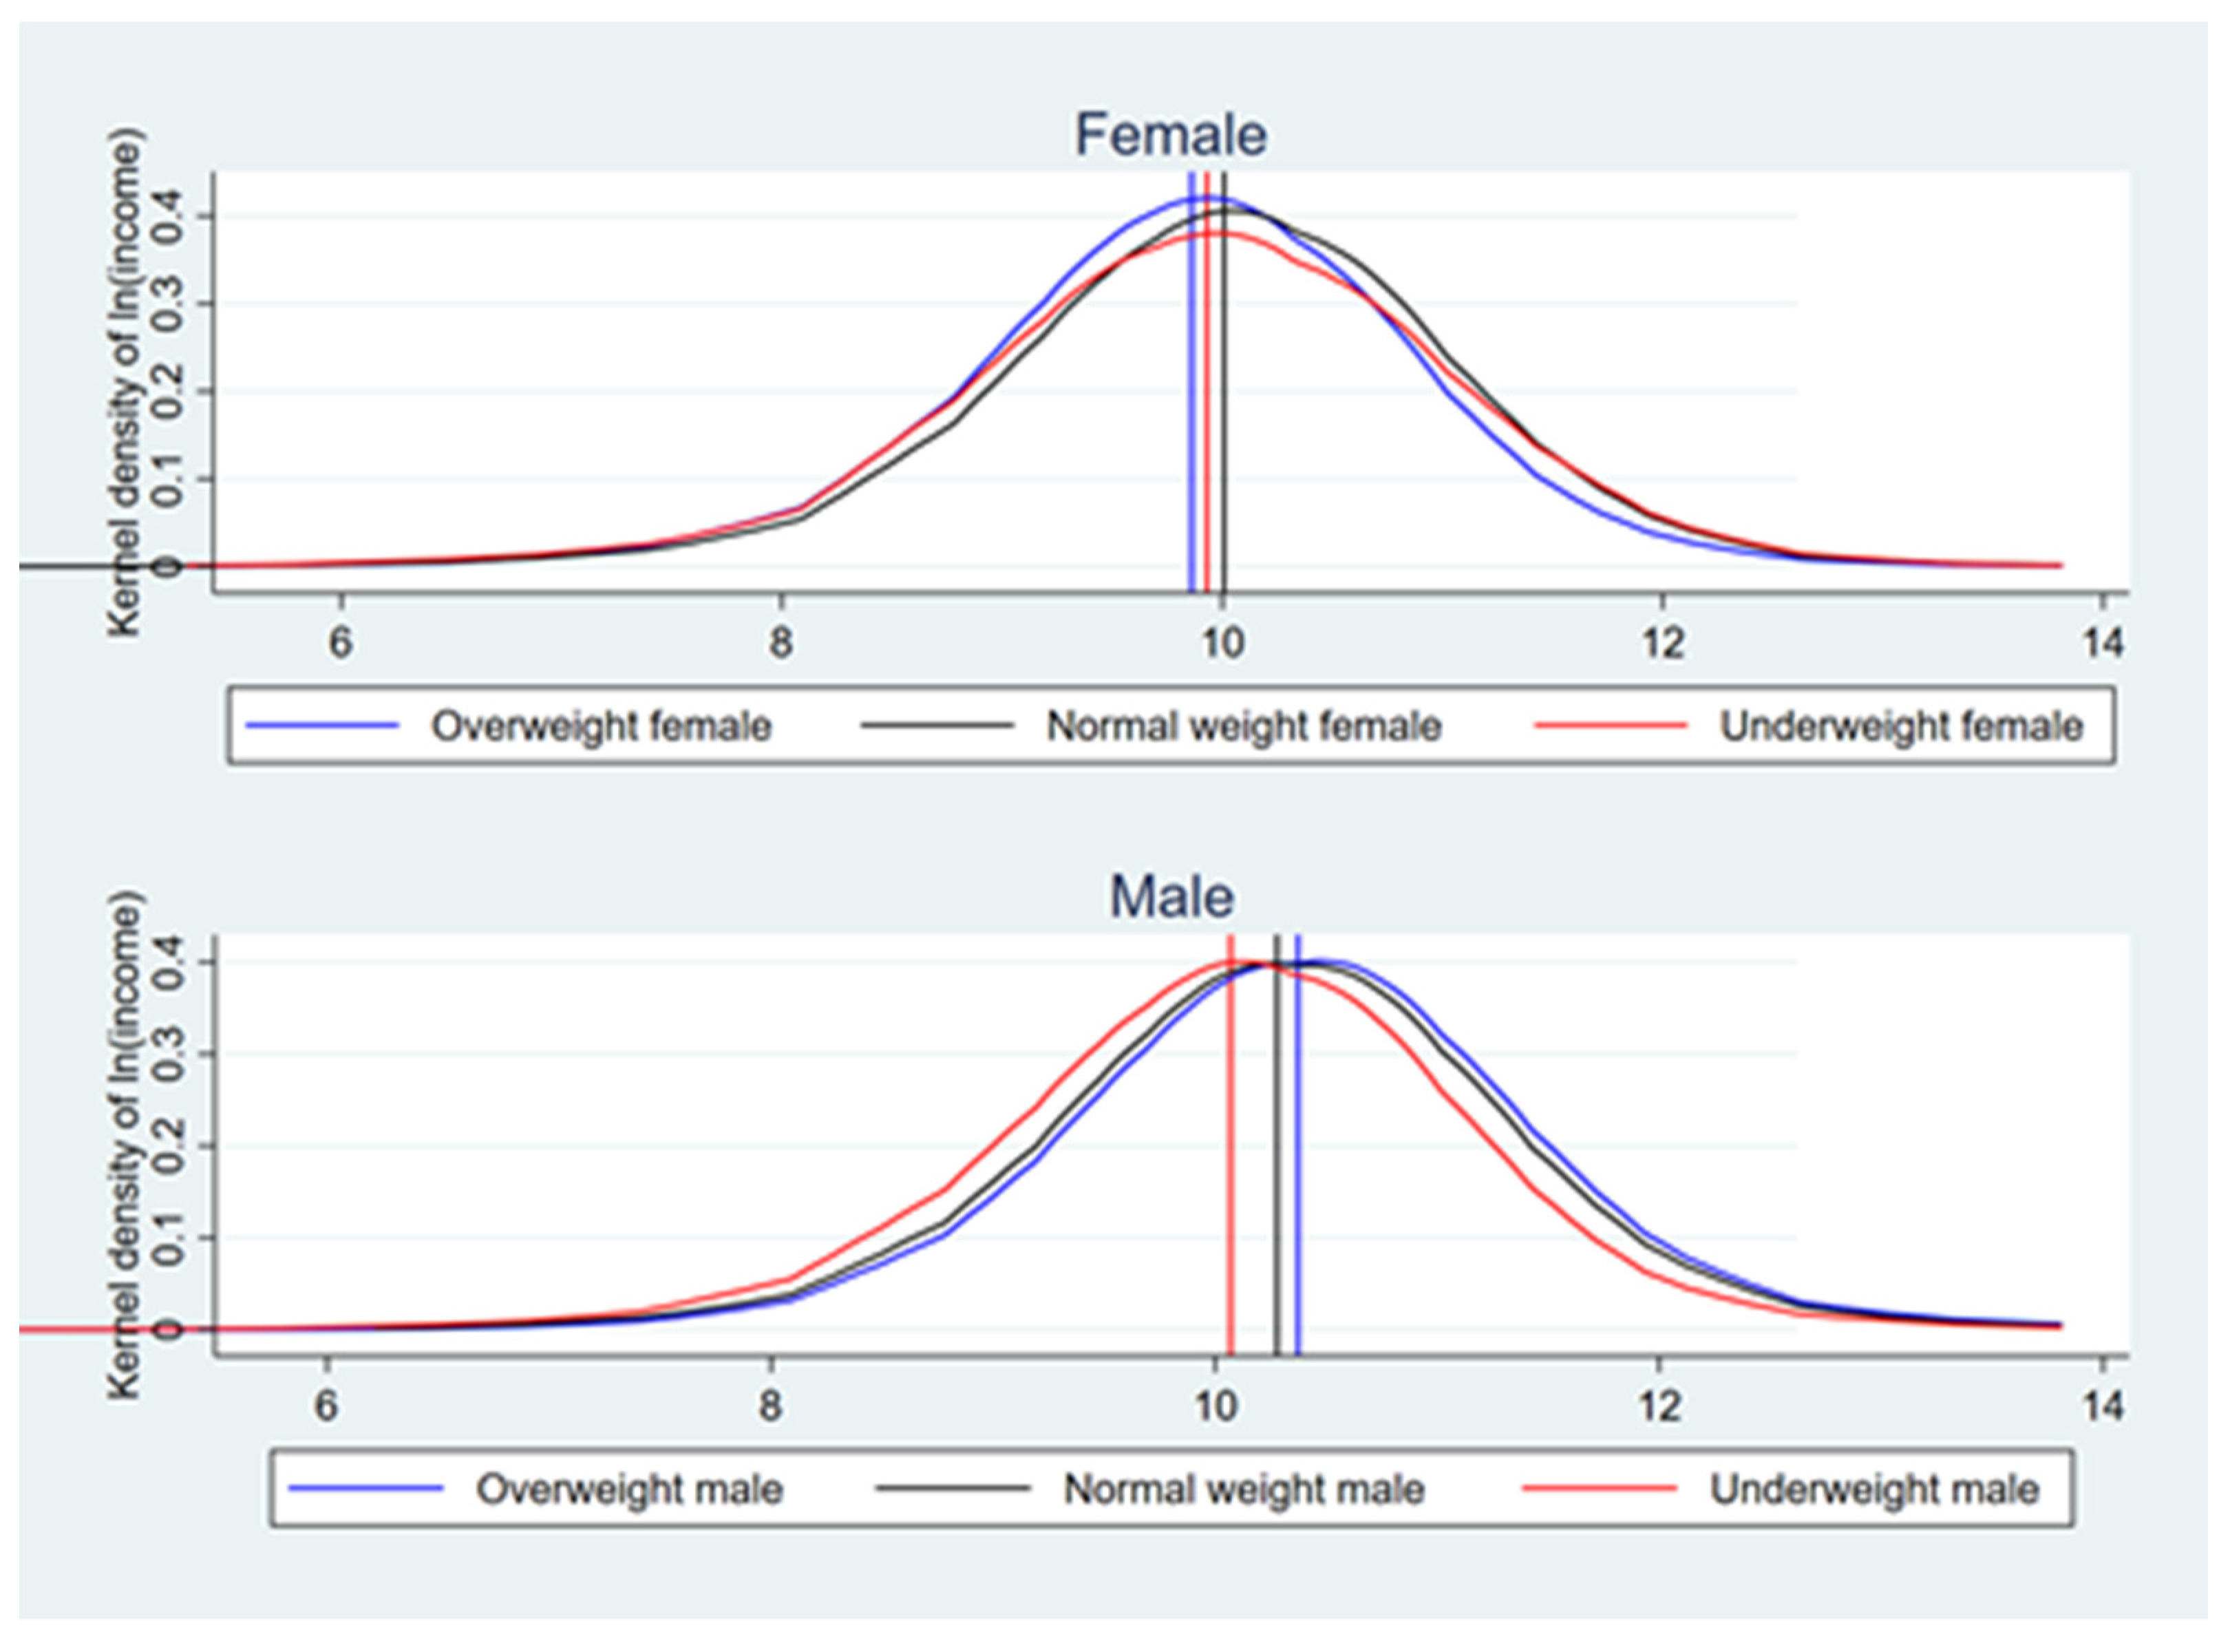
3. Results
3.1. Gender Comparisons of Income Effect
- The coefficient of the primary variable BMI was significant in both the male and female models, but men and women face inconsistent labor market feedback;
- In the female sample, an increase in BMI implies a decrease in income, as the coefficient is negative (Table 3 Panel A), meaning the obesity penalty that women face;
- In the male sample, the BMI coefficient is positive (Table 3 Panel B), implying that thin men receive less income, meaning the thinness penalty is faced by men.
3.2. The Income Effect of Body Size Varies with Occupation
- The coefficient of BMI in Model (7) is −0.008, which differed very little from −0.01 that in Model (3). They were both equations with all control variables added;
- In Models (6) and (7), the coefficient of the interaction term is significantly negative, implying that the negative effect of BMI on income is strengthened as occupational class increases. That is, the obesity penalty is reinforced in higher class occupations.
- The coefficient of BMI in male Model (7) and Model (3) also differed very little: 0.016 and 0.017, respectively;
- In the male models, the interaction term coefficient is significantly negative for males. The thinness penalty embodied by BMI is more pronounced in low ISEI occupations and is weaker in higher occupational classes.
3.3. Occupational Heterogeneity
- In the female sample, the coefficient of overweight was significantly negative in managers, professionals, and technicians and services, sales, and clerks, with a significant obesity penalty. However, in craft, machine operators, and elementary occupations, the obesity penalty was not significant;
- In the male sample, the weight premium was significant in craft, machine operators, elementary occupations, while it was not confirmed in other occupations. The coefficient of underweight was always significantly negative, which means that the thinness penalty was always observed.
3.4. Decomposition of Income Gap
- In the female sample, the overweight coefficient was significant in most quartiles and did not differ dramatic across income levels;
- In the male sample, the underweight coefficient was significant in most quartiles. The negative influence of underweight was strongest in the low-income quantile, and then the coefficient values showed an increasing trend, indicating that the thinness penalty is most noticeable in the low-income class. This result can be used as indirect evidence that the income gap changes with occupation.
- Part (1) is the income gap caused by the variation in regression coefficients, which can be considered as different market feedback from the labor market for the two types of workers: normal weight and overweight women;
- Part (2) is the income gap caused by variation in the independent variable values between the two groups. We estimate OLS for each of the eight occupational categories separately, with independent variables including all control variables. Coefficients and were obtained. Part (1) and Part (2) can be calculated;
- Part (3) is the income gap caused by differences in occupational structure. Part (3) of the gap arising from occupational structure is further decomposed to Part (4) and Part (5).
- Part (4) and Part (5) are added to denote the income gap caused by differences in the occupational structure of normal weight women and overweight women. represents differences in occupational structure due to control variables, while represents differences in occupational structure due to occupation regression coefficients.
3.5. Path 1: Body Shape–Health–Productivity
3.6. Path 2: Body Shape–Social-Earnings
- In the female sample in Table 8 Panel A, the coefficient for overweight was positive, while the coefficient for underweight was negative. This indicates that overweight women are more likely to have high-frequency neighborhood socialization, while slim individuals are more likely to have low-frequency neighborhood socialization. Body shape had no significant effect on women’s socialization with friends;
- We further analyzed the effect of neighborhood socialization on income, and the female Model (14) results in Table 9 show that neighborhood socialization has a negative effect on income. Although overweight has a positive impact on neighborhood socialization for females, there is ultimately a negative effect on income, which is the obesity penalty;
- The results were reversed for the male sample in Table 8 Panel B: body shape had no significant effect on neighborhood socialization for men but a significant effect on friend socialization;
- Further analyzing the effect of friend socialization on income, the male Model (18) in Table 9 shows that friend socialization among men contributes to income growth. Therefore, the final result for the male sample is a leanness penalty.
4. Discussion
4.1. Discussion of Results
4.2. Limitations and Future Directions
5. Conclusions
Author Contributions
Funding
Data Availability Statement
Conflicts of Interest
References
- Flint, S.W.; Snook, J. Obesity and Discrimination:The Next ‘Big Issue’? Int. J. Discrim. Law 2014, 14, 183–193. [Google Scholar] [CrossRef]
- Kinge, J.M. Waist Circumference, Body Mass Index, and Employment Outcomes. Eur. J. Health Econ. 2017, 18, 787–799. [Google Scholar] [CrossRef] [PubMed]
- Biener, A.; Cawley, J.; Meyerhoefer, C. The Impact of Obesity on Medical Care Costs and Labor Market Outcomes in the US. Clin. Chem. 2018, 64, 108–117. [Google Scholar] [CrossRef] [Green Version]
- Goettler, A.; Grosse, A.; Sonntag, D. Productivity Loss Due to Overweight and Obesity: A Systematic Review of Indirect Costs. BMJ Open 2017, 7, e014632. [Google Scholar] [CrossRef] [PubMed] [Green Version]
- Bernard, M.; Fankhänel, T.; Riedel-Heller, S.G.; Luck-Sikorski, C. Does Weight-Related Stigmatisation and Discrimination Depend on Educational Attainment and Level of Income? A Systematic Review. BMJ Open 2019, 9, e027673. [Google Scholar] [CrossRef] [PubMed] [Green Version]
- Cawley, J. The Impact of Obesity on Wages. J. Hum. Resour. 2004, 39, 451–474. [Google Scholar] [CrossRef]
- Han, E.; Norton, E.C.; Stearns, S.C. Weight and Wages: Fat Versus Lean Paychecks. Health Econ. 2009, 18, 535–548. [Google Scholar] [CrossRef] [PubMed] [Green Version]
- Sabia, J.J.; Rees, D.I. Body Weight and Wages: Evidence from Add Health. Econ. Hum. Biol. 2012, 10, 14–19. [Google Scholar] [CrossRef]
- Brunello, G.; D’Hombres, B. Does Body Weight Affect Wages?: Evidence from Europe. Econ. Hum. Biol. 2007, 5, 1–19. [Google Scholar] [CrossRef] [PubMed]
- Caliendo, M.; Lee, W.S. Fat Chance! Obesity and the Transition from Unemployment to Employment. Econ. Hum. Biol. 2013, 11, 121–133. [Google Scholar] [CrossRef] [Green Version]
- Lindeboom, M.; Lundborg, P.; van der Klaauw, B. Assessing the Impact of Obesity on Labor Market Outcomes. Econ. Hum. Biol. 2010, 8, 309–319. [Google Scholar] [CrossRef]
- Greve, J. Obesity and Labor Market Outcomes in Denmark. Econ. Hum. Biol. 2008, 6, 350–362. [Google Scholar] [CrossRef]
- Vallejo-Torres, L.; Morris, S.; Lopez-Valcarcel, B.G. Obesity and Perceived Work Discrimination in Spain. Appl. Econ. 2018, 50, 3870–3884. [Google Scholar] [CrossRef]
- Colchero, M.A.; Bishai, D. Weight and Earnings among Childbearing Women in Metropolitan Cebu, Philippines (1983–2002). Econ. Hum. Biol. 2012, 10, 256–263. [Google Scholar] [CrossRef] [PubMed] [Green Version]
- Zhang, J.; Xu, L.; Li, J.; Sun, L.; Qin, W.; Ding, G.; Wang, Q.; Zhu, J.; Yu, Z.; Xie, S.; et al. Gender Differences in the Association between Body Mass Index and Health-Related Quality of Life among Adults:A Cross-Sectional Study in Shandong, China. BMC Public Health 2019, 19, 1021. [Google Scholar] [CrossRef] [PubMed] [Green Version]
- Kelly, I.R.; Doytch, N.; Dave, D. How Does Body Mass Index Affect Economic Growth? A Comparative Analysis of Countries by Levels of Economic Development. Econ. Hum. Biol. 2019, 34, 58–73. [Google Scholar] [CrossRef]
- Joslyn, M.R.; Haider-Markel, D.P. Perceived Causes of Obesity, Emotions, and Attitudes About Discrimination Policy. Soc. Sci Med. 2019, 223, 97–103. [Google Scholar] [CrossRef]
- Giel, K.E.; Thiel, A.; Teufel, M.; Mayer, J.; Zipfel, S. Weight Bias in Work Settings-A Qualitative Review. Obes. Facts 2010, 3, 33–40. [Google Scholar] [CrossRef]
- Ji, Y.; Huang, Q.; Liu, H.; Phillips, C. Weight Bias 2.0: The Effect of Perceived Weight Change on Performance Evaluation and the Moderating Role of Anti-Fat Bias. Front. Psychol. 2021, 12, 679802. [Google Scholar] [CrossRef]
- Agerström, J.; Rooth, D.-O. The Role of Automatic Obesity Stereotypes in Real Hiring Discrimination. J. Appl. Psychol. 2011, 96, 790–805. [Google Scholar] [CrossRef]
- Robinson, K.; Muir, S.; Newbury, A.; Santos-Merx, L.; Appleton, K.M. Perceptions of Body Weight That Vary by Body Mass Index: Clear Associations with Perceptions Based on Personal Control and Responsibility. J. Health Psychol. 2020, 1359105320916540. [Google Scholar] [CrossRef]
- Mobius, M.M.; Rosenblat, T.S. Why Beauty Matters. Am. Econ. Rev. 2006, 96, 222–235. [Google Scholar] [CrossRef] [Green Version]
- Arndt, R. Reichert, Obesity, Weight Loss, and Employment Prospects: Evidence from a Randomized Trial. J. Hum. Resour. 2015, 50, 759–810. [Google Scholar] [CrossRef] [Green Version]
- Baum, C.L.; Ford, W.F. The Wage Effects of Obesity: A Longitudinal Study. Health Econ. 2004, 13, 885–899. [Google Scholar] [CrossRef]
- Gilleskie, D.B.; Han, E.; Norton, E.C. Disentangling the Contemporaneous and Dynamic Effects of Human and Health Capital on Wages over the Life Cycle. Rev. Econ. Dyn. 2017, 25, 350–383. [Google Scholar] [CrossRef] [Green Version]
- Cawley, J.; Meyerhoefer, C. The Medical Care Costs of Obesity: An Instrumental Variables Approach. J. Health Econ. 2012, 31, 219–230. [Google Scholar] [CrossRef]
- Mason, K. The Unequal Weight of Discrimination. Soc. Probl. 2012, 59, 411–435. [Google Scholar] [CrossRef]
- Klepaker, G.; Svendsen, M.V.; Hertel, J.K.; Holla, Ø.L.; Henneberger, P.K.; Kongerud, J.; Fell, A.K.M. Influence of Obesity on Work Ability, Respiratory Symptoms, and Lung Function in Adults with Asthma. Respiration 2019, 98, 473–481. [Google Scholar] [CrossRef]
- Alavinia, S.M.; Molenaar, D.; Burdorf, A. Productivity Loss in the Workforce: Associations with Health, Work Demands, and Individual Characteristics. Am. J. Ind. Med. 2009, 52, 49–56. [Google Scholar] [CrossRef] [PubMed]
- Morris, S. Body Mass Index and Occupational Attainment-Sciencedirect. J. Health Econ. 2006, 25, 347–364. [Google Scholar] [CrossRef] [PubMed]
- Bozoyan, C.; Wolbring, T. The Weight Wage Penalty: A Mechanism Approach to Discrimination. Eur. Sociol. Rev. 2018, 34, 254–267. [Google Scholar] [CrossRef]
- Busetta, G.; Campolo, M.G.; Panarello, D. Weight-Based Discrimination in the Italian Labor Market: An Analysis of the Interaction with Gender and Ethnicity. J. Econ. Inequal. 2020, 18, 617–637. [Google Scholar] [CrossRef]
- Gu, T.; Ji, Y. Beauty Premium in China’s Labor Market: Is Discrimination the Main Reason? China Econ. Rev. 2019, 57, 101335. [Google Scholar] [CrossRef]
- Puhl, R.M.; Andreyeva, T.; Brownell, K.D. Perceptions of Weight Discrimination: Prevalence and Comparison to Race and Gender Discrimination in America. Int. J. Obes. 2008, 32, 992–1000. [Google Scholar] [CrossRef] [PubMed] [Green Version]
- Puhl, R.M.; Heuer, C.A. Public Opinion About Laws to Prohibit Weight Discrimination in the United States. Obesity 2011, 19, 74–82. [Google Scholar] [CrossRef] [PubMed]
- Judge, T.A.; Cable, D.M. When It Comes to Pay, Do the Thin Win? The Effect of Weight on Pay for Men and Women. J. Appl. Psychol. 2011, 96, 95–112. [Google Scholar] [CrossRef] [PubMed] [Green Version]
- Lee, H.; Ahn, R.; Kim, T.H.; Han, E. Impact of Obesity on Employment and Wages among Young Adults: Observational Study with Panel Data. Int. J. Environ. Res. Public Health 2019, 16, 139. [Google Scholar] [CrossRef] [PubMed] [Green Version]
- Garcia Villar, J.; Quintana-Domeque, C. Income and Body Mass Index in Europe. Econ. Hum. Biol. 2009, 7, 73–83. [Google Scholar] [CrossRef] [Green Version]
- Luckhaupt, S.E.; Cohen, M.A.; Li, J.; Calvert, G.M. Prevalence of Obesity among U.S. Workers and Associations with Occupational Factors. Am. J. Prev. Med. 2014, 46, 237–248. [Google Scholar] [CrossRef]
- Blau, F.D.; Kahn, L.M. The Gender Wage Gap: Extent, Trends, and Explanations. J. Econ. Lit. 2017, 55, 789–865. [Google Scholar] [CrossRef] [Green Version]
- Eagly, A.H.; Nater, C.; Miller, D.I.; Kaufmann, M.; Sczesny, S. Gender Stereotypes Have Changed: A Cross-Temporal Meta-Analysis of U.S. Public Opinion Polls from 1946 to 2018. Am. Psychol. 2020, 75, 301–315. [Google Scholar] [CrossRef] [Green Version]
- Le Barbanchon, T.; Rathelot, R.; Roulet, A. Gender Differences in Job Search: Trading Off Commute against Wage *. Q. J. Econ. 2020, 136, 381–426. [Google Scholar] [CrossRef]
- Goldin, C.; Kerr, S.P.; Olivetti, C.; Barth, E. The Expanding Gender Earnings Gap: Evidence from the Lehd-2000 Census. Am. Econ. Rev. 2017, 107, 110–114. [Google Scholar] [CrossRef] [Green Version]
- Aguilar-Palacio, I.; Carrera-Lasfuentes, P.; Sánchez-Recio, R.; Alonso, J.P.; Rabanaque, M.J. Recession, Employment and Self-Rated Health: A study on the Gender Gap. Public Health 2018, 154, 44–50. [Google Scholar] [CrossRef] [PubMed]
- Caliendo, M.; Gehrsitz, M. Obesity and the Labor Market: A Fresh Look at the Weight Penalty. Econ. Hum. Biol. 2016, 23, 209–225. [Google Scholar] [CrossRef] [Green Version]
- Kim, T.H.; Han, E. Entry Body Mass and Earnings: Once Penalized, Ever Penalized? Biodemography Soc. Biol. 2017, 63, 332–346. [Google Scholar] [CrossRef] [PubMed]
- Nickson, D.; Timming, A.R.; Re, D.; Perrett, D.I. Subtle Increases in Bmi within a Healthy Weight Range Still Reduce Womens Employment Chances in the Service Sector. PLoS ONE 2016, 11, e0159659. [Google Scholar] [CrossRef] [Green Version]
- Bramming, M.; Jrgensen, M.B.; Christensen, A.I.; Lau, C.J.; Egan, K.K.; Tolstrup, J.S. Bmi and Labor Market Participation: A Cohort Study of Transitions between Work, Unemployment, and Sickness Absence. Obesity 2019, 27, 1703–1710. [Google Scholar] [CrossRef] [PubMed]
- Feigl, A.B.; Goryakin, Y.; Devaux, M.; Lerouge, A.; Vuik, S.; Cecchini, M.; Chen, S. The Short-Term Effect of Bmi, Alcohol Use, and Related Chronic Conditions on Labour Market Outcomes: A Time-Lag Panel Analysis Utilizing European Share Dataset. PLoS ONE 2019, 14, e0211940. [Google Scholar] [CrossRef]
- Willage, B. The Effect of Weight on Mental Health: New Evidence Using Genetic Ivs. J. Health Econ. 2018, 57, 113–130. [Google Scholar] [CrossRef] [PubMed]
- Bargain, O.; Zeidan, J. Heterogeneous Effects of Obesity on Mental Health: Evidence from Mexico. Health Econ. 2019, 28, 447–460. [Google Scholar] [CrossRef]
- Balli, H.; Sorensen, B. Interaction Effects in Econometrics. Empir. Econ. 2013, 45, 583–603. [Google Scholar] [CrossRef] [Green Version]
- Johar, M.; Katayama, H. Quantile Regression Analysis of Body Mass and Wages. Health Econ. 2012, 21, 597–611. [Google Scholar] [CrossRef] [PubMed]
- Dang, A.; Maitra, P.; Menon, N. Labor Market Engagement and the Body Mass Index of Working Adults: Evidence from India. Econ. Hum. Biol. 2019, 33, 58–77. [Google Scholar] [CrossRef]
- Prendergast, C.; Wray, S. Human Myometrial Artery Function and Endothelial Cell Calcium Signalling Are Reduced by Obesity: Can This Contribute to Poor Labour Outcomes? Acta Physiol. 2019, 227, e13341. [Google Scholar] [CrossRef]
- Burkhauser, R.V.; Cawley, J. Beyond Bmi: The Value of More Accurate Measures of Fatness and Obesity in Social Science Research. J. Health Econ. 2008, 27, 519–529. [Google Scholar] [CrossRef] [PubMed] [Green Version]
- Guh, D.P.; Zhang, W.; Bansback, N.; Amarsi, Z.; Birmingham, C.L.; Anis, A.H. The Incidence of Co-Morbidities Related to Obesity and Overweight: A Systematic Review and Meta-Analysis. BMC Public Health 2009, 9, 88. [Google Scholar] [CrossRef] [Green Version]
- Huq, S.; Todkar, S.; Lahiri, S.W. Patient Perspectives on Obesity Management: Need for Greater Discussion of Bmi and Weight-Loss Options Beyond Diet and Exercise, Especially in Patients with Diabetes. Endocr. Pract. 2020, 26, 471–483. [Google Scholar] [CrossRef] [Green Version]
- Wada, R.; Tekin, E. Body Composition and Wages. Econ. Hum. Biol. 2010, 8, 242–254. [Google Scholar] [CrossRef]
- Krakauer, N.Y.; Krakauer, J.C. A New Body Shape Index Predicts Mortality Hazard Independently of Body Mass Index. PLoS ONE 2012, 7, e39504. [Google Scholar] [CrossRef]
- Duncan, M.J.; Mota, J.; Vale, S.; Santos, M.P.; Ribeiro, J.C. Associations between Body Mass Index, Waist Circumference and Body Shape Index with Resting Blood Pressure in Portuguese Adolescents. Ann. Hum. Biol. 2013, 40, 163–167. [Google Scholar] [CrossRef] [PubMed]
- He, S.; Chen, X. Could the New Body Shape Index Predict the New Onset of Diabetes Mellitus in the Chinese Population? PLoS ONE 2013, 8, e50573. [Google Scholar] [CrossRef] [PubMed]
- Soltanifar, M.; Pahwa, P.; Karunanayake, C.; Abonyi, S.; Koehncke, N.; Fenton, M. Is a Body Shape Index (Absi) Predictive of Lung Functions? Int. J. Respir. Pulm. Med. 2019, 6, 2378–3516. [Google Scholar] [CrossRef]
- Sánchez-Recio, R.; Alonso, J.P.; Aguilar-Palacio, I. The Use of Health Care Services in the Great Recession: Evaluating Inequalities in the Spanish Context. Gac. Sanit. 2020, 34, 245–252. [Google Scholar] [CrossRef] [PubMed]


| Variable Type | Variable | Variable Description |
|---|---|---|
| Income | Income | Logarithm of respondents’ previous year’s income |
| Labor income | Logarithm of respondents’ labor income in previous year | |
| Body shape | Body weight | Kilograms |
| Height | Meters | |
| BMI | Body weight/height 2 | |
| Overweight | BMI quartile in the top 30% | |
| Normal | BMI quartile between 31–70% | |
| Underweight/Slim | BMI quartile in the low 30% | |
| Occupation | Occupation | 1 = Managers 2 = Professionals 3 = Technicians and associate professionals 4 = Clerical support workers 5 = Services and sales workers 7 = Craft and related trades workers 8 = Plant and machine operators 9 = Elementary occupations |
| ISEI | International socioeconomic index | |
| Demographics | Education | 1 = No education 2 = Primary school or below 3 = Junior high school 4 = High school and technical secondary school 5 = Junior college and undergraduate and above |
| Migration | 0 = Local hukou; 1 = Migrant hukou | |
| Race | 0 = Others; 1 = Han | |
| Marital Status | 0 = Single (unmarried, divorced or widowed) 1 = Married | |
| Children | Number of children under 18 years old | |
| Age | Logarithm of age | |
| Socioeconomic status | Union | 0 = not union member; 1 = union member |
| Political status | 0 = Non-Chinese Communist; 1 = Chinese Communist | |
| Medical insurance | 0 = no; 1 = yes | |
| Social status | Social status of self-assessment 1–10 | |
| Region controls | PGDP | Logarithm of per capita gross regional product |
| Population | Logarithm of resident population | |
| Number of unemployed | Logarithm of number of urban registered unemployed | |
| Number of benefits | Logarithm of number of people on unemployment benefits | |
| Consumption | Logarithm of consumption per capita | |
| Health institutions | Logarithm of number of medical and health institutions | |
| Hospitals | Logarithm of number of hospitals | |
| Health Technicians | Logarithm of number of medical and health technicians | |
| Fixed effects | Area | i.area (East, Central, West) |
| Year | i.year (2010, 2011, 2012, 2013, 2015 and 2017) | |
| Other variables | Health | 1 = Very unhealthy; 2 = Relatively unhealthy; 3 = Normal; 4 = Relatively healthy; 5 = Very healthy |
| Health impact on life | 1 = Always; 2 = Often; 3 = Sometimes; 4 = Rarely; 5 = Never | |
| Neighborhood social | 1 = Never; 2 = Once a year or less; 3 = A few times a year; 4 = About once a month; 5 = A few times a month; 6 = 1 or 2 times a week; 7 = Almost every day; | |
| Friends social |
| Female | Male | |||||||
|---|---|---|---|---|---|---|---|---|
| All | Overweight | Normal | Underweight | All | Overweight | Normal | Underweight | |
| Income | 32,876 | 28,830 | 34,947 | 33,847 | 45,967 | 52,275 | 46,911 | 37,937 |
| Logarithm of income | 9.94 | 9.86 | 10.01 | 9.93 | 10.25 | 10.37 | 10.28 | 10.07 |
| Height | 1.60 | 1.60 | 1.60 | 1.61 | 1.71 | 1.71 | 1.71 | 1.71 |
| Weight | 55.34 | 66.47 | 55.69 | 43.51 | 66.16 | 79.48 | 66.71 | 51.66 |
| BMI | 21.57 | 26.07 | 21.67 | 16.84 | 22.59 | 27.07 | 22.81 | 17.64 |
| ISEI | 38.15 | 36.20 | 38.55 | 39.52 | 40.61 | 41.93 | 40.41 | 39.52 |
| Occupations (%) | ||||||||
| Managers | 4.85 | 4.50 | 5.20 | 4.68 | 8.97 | 11.10 | 8.65 | 7.20 |
| Professionals | 11.71 | 8.24 | 12.29 | 14.35 | 8.73 | 8.87 | 8.78 | 8.51 |
| Technicians and associate professionals | 9.68 | 8.70 | 9.19 | 11.41 | 9.97 | 10.94 | 9.67 | 9.38 |
| Clerical support workers | 12.25 | 11.11 | 12.77 | 12.61 | 6.77 | 7.56 | 7.08 | 5.54 |
| Services and sales workers | 32.94 | 32.88 | 33.15 | 32.67 | 20.80 | 21.17 | 20.42 | 20.94 |
| Craft and related trades workers | 10.95 | 12.36 | 10.65 | 9.97 | 20.02 | 16.28 | 20.40 | 23.36 |
| Plant and machine operators and assemblers | 7.40 | 9.61 | 7.14 | 5.56 | 14.17 | 15.20 | 13.56 | 13.96 |
| Elementary occupations | 10.22 | 12.60 | 9.61 | 8.74 | 10.57 | 8.89 | 11.45 | 11.10 |
| Total | 100 | 100 | 100 | 100 | 100 | 100 | 100 | 100 |
| D.V. | Income | ||||
|---|---|---|---|---|---|
| OLS | OLS | OLS | Heckman | 2SLS | |
| Model (1) | Model (2) | Model (3) | Model (4) | Model (5) | |
| Panel A Female | |||||
| BMI | −0.028 *** | −0.010 *** | −0.010 *** | −0.010 *** | −0.151 *** |
| (0.003) | (0.003) | (0.003) | (0.002) | (0.024) | |
| Demographics | Yes | Yes | Yes | Yes | |
| Socioeconomic status | Yes | Yes | Yes | Yes | |
| Regional controls | Yes | Yes | Yes | ||
| Fixed effects | Yes | Yes | Yes | Yes | Yes |
| Observations | 11,464 | 11,212 | 11,206 | 14,097 | 11,206 |
| Adjusted R2 | 0.161 | 0.331 | 0.373 | 0.186 | |
| Panel B Male | |||||
| BMI | 0.022 *** | 0.014 *** | 0.017 *** | 0.017 *** | 0.058 *** |
| (0.002) | (0.002) | (0.002) | (0.002) | (0.020) | |
| Demographics | Yes | Yes | Yes | Yes | |
| Socioeconomic status | Yes | Yes | Yes | Yes | |
| Regional control | Yes | Yes | Yes | ||
| Fixed effects | Yes | Yes | Yes | Yes | Yes |
| Observations | 14,125 | 13,851 | 13,841 | 15,336 | 13,841 |
| Adjusted R2 | 0.138 | 0.310 | 0.347 | 0.330 | |
| D.V. | Income | |||
|---|---|---|---|---|
| Panel A Female | Panel B Male | |||
| Model (6) | Model (7) | Model (6) | Model (7) | |
| BMI | −0.008 *** | −0.008 *** | 0.005 *** | 0.016 *** |
| (0.002) | (0.003) | (0.002) | (0.002) | |
| ISEI | 0.022 *** | 0.021 *** | 0.018 *** | 0.016 *** |
| (0.003) | (0.003) | (0.003) | (0.003) | |
| BMI*ISEI | −0.00052 *** | −0.00046 *** | −0.00027 ** | −0.00019 |
| (0.000) | (0.000) | (0.000) | (0.000) | |
| Demographics | Yes | Yes | Yes | Yes |
| Socioeconomic status | Yes | Yes | Yes | Yes |
| Regional control | Yes | Yes | ||
| Fixed effects | Yes | Yes | ||
| Observations | 11,212 | 11,206 | 13,851 | 13,841 |
| Adjusted R2 | 0.290 | 0.395 | 0.270 | 0.370 |
| Part (1) | Part (2) | Part (4) | Part (5) | Total | |
|---|---|---|---|---|---|
| Panel A Normal weight female—Overweight female | |||||
| Managers | 0.005 | 0.001 | 0.021 | 0.047 | 0.074 |
| Professionals | 0.010 | −0.001 | 0.341 | 0.151 | 0.500 |
| Technicians and associate professionals | 0.006 | 0.000 | 0.121 | −0.116 | 0.011 |
| Clerical support workers | 0.008 | 0.012 | 0.172 | 0.020 | 0.212 |
| Services and sales workers | 0.016 | 0.026 | 0.009 | 0.081 | 0.132 |
| Craft and related trades workers | 0.004 | 0.002 | −0.176 | −0.067 | −0.237 |
| Plant and machine operators and assemblers | −0.006 | 0.004 | −0.147 | −0.081 | −0.230 |
| Elementary occupations | 0.000 | −0.006 | −0.286 | −0.025 | −0.318 |
| Total | 0.042 | 0.039 | 0.054 | 0.011 | 0.145 |
| Percentage | 28.75% | 26.71% | 37.26% | 7.28% | |
| Panel B Normal weight male—Overweight male | |||||
| Managers | −0.009 | 0.004 | −0.048 | −0.236 | −0.290 |
| Professionals | −0.003 | −0.007 | −0.082 | 0.060 | −0.033 |
| Technicians and associate professionals | −0.004 | 0.005 | −0.075 | −0.060 | −0.134 |
| Clerical support workers | 0.006 | 0.003 | −0.095 | 0.060 | −0.026 |
| Services and sales workers | −0.014 | −0.001 | 0.059 | −0.111 | −0.066 |
| Craft and related trades workers | −0.002 | −0.006 | 0.094 | 0.324 | 0.411 |
| Plant and machine operators and assemblers | −0.008 | −0.007 | 0.003 | −0.187 | −0.199 |
| Elementary occupations | 0.000 | −0.004 | 0.104 | 0.145 | 0.245 |
| Total | −0.034 | −0.014 | −0.039 | −0.005 | −0.092 |
| Percentage | 36.79% | 14.77% | 42.84% | 5.60% | |
| Panel C Normal weight male—Underweight male | |||||
| Managers | 0.005 | 0.011 | −0.503 | 0.616 | 0.129 |
| Professionals | −0.006 | 0.016 | 0.313 | −0.299 | 0.024 |
| Technicians and associate professionals | 0.003 | 0.017 | 0.300 | −0.247 | 0.072 |
| Clerical support workers | 0.001 | 0.007 | 0.252 | −0.071 | 0.188 |
| Services and sales workers | 0.018 | 0.035 | 0.408 | −0.407 | 0.054 |
| Craft and related trades workers | 0.017 | 0.032 | 0.395 | −0.729 | −0.285 |
| Plant and machine operators and assemblers | −0.017 | 0.036 | −1.397 | 1.347 | −0.032 |
| Elementary occupations | 0.002 | 0.014 | 0.229 | −0.186 | 0.059 |
| Total | 0.023 | 0.167 | −0.003 | 0.023 | 0.210 |
| Percentage | 11.02% | 79.47% | −1.25% | 10.76% | |
| D.V. | Panel A Female | Panel B Male | ||
|---|---|---|---|---|
| Health | Health Impact on Life | Health | Health Impact on Life | |
| Model (8) | Model (9) | Model (8) | Model (9) | |
| Overweight | −0.198 *** | −0.043 | −0.171 *** | 0.035 |
| (0.038) | (0.040) | (0.036) | (0.038) | |
| Underweight | −0.106 ** | −0.135 *** | −0.165 *** | −0.147 *** |
| (0.041) | (0.043) | (0.040) | (0.042) | |
| Demographics | Yes | Yes | Yes | Yes |
| Socioeconomic status | Yes | Yes | Yes | Yes |
| Regional control | Yes | Yes | Yes | Yes |
| Fixed effects | Yes | Yes | Yes | Yes |
| Observations | 14,089 | 14,063 | 15,326 | 15,301 |
| Pseudo R2 | 0.054 | 0.110 | 0.061 | 0.125 |
| D.V. | Income | |||
|---|---|---|---|---|
| Panel A Female | Panel B Male | |||
| Model (10) | Model (11) | Model (10) | Model (11) | |
| Health | 0.061 *** | 0.073 *** | ||
| (0.008) | (0.008) | |||
| Health impact on life | 0.049 *** | 0.091 *** | ||
| (0.009) | (0.008) | |||
| Demographics | Yes | Yes | Yes | Yes |
| Socioeconomic status | Yes | Yes | Yes | Yes |
| Regional control | Yes | Yes | Yes | Yes |
| Fixed effects | Yes | Yes | Yes | Yes |
| Observations | 11,200 | 11,181 | 13,832 | 13,810 |
| Adjusted R2 | 0.375 | 0.374 | 0.349 | 0.351 |
| D.V. | Panel A Female | Panel B Male | ||
|---|---|---|---|---|
| Neighborhood Social | Friends Social | Neighborhood Social | Friends Social | |
| Model (12) | Model (13) | Model (12) | Model (13) | |
| Overweight | 0.077 * | −0.066 | −0.014 | 0.068 * |
| (0.042) | (0.043) | (0.039) | (0.039) | |
| Underweight | −0.091 ** | 0.040 | 0.017 | −0.112 *** |
| (0.045) | (0.043) | (0.043) | (0.043) | |
| Demographics | Yes | Yes | Yes | Yes |
| Socioeconomic status | Yes | Yes | Yes | Yes |
| Regional control | Yes | Yes | Yes | Yes |
| Fixed effects | Yes | Yes | Yes | Yes |
| Observations | 11,176 | 11,174 | 12,238 | 12,238 |
| Pseudo R2 | 0.038 | 0.019 | 0.040 | 0.024 |
| D.V. | Income | |
|---|---|---|
| Female | Male | |
| Model (14) | Model (15) | |
| Neighborhood social | −0.035 *** | |
| (0.004) | ||
| Friends social | 0.053 *** | |
| (0.005) | ||
| Demographics | Yes | Yes |
| Socioeconomic status | Yes | Yes |
| Regional control | Yes | Yes |
| Fixed effects | Yes | Yes |
| Observations | 8991 | 11,145 |
| Adjusted R2 | 0.364 | 0.339 |
Publisher’s Note: MDPI stays neutral with regard to jurisdictional claims in published maps and institutional affiliations. |
© 2021 by the authors. Licensee MDPI, Basel, Switzerland. This article is an open access article distributed under the terms and conditions of the Creative Commons Attribution (CC BY) license (https://creativecommons.org/licenses/by/4.0/).
Share and Cite
Li, P.; Chen, X.; Yao, Q. Body Mass and Income: Gender and Occupational Differences. Int. J. Environ. Res. Public Health 2021, 18, 9599. https://doi.org/10.3390/ijerph18189599
Li P, Chen X, Yao Q. Body Mass and Income: Gender and Occupational Differences. International Journal of Environmental Research and Public Health. 2021; 18(18):9599. https://doi.org/10.3390/ijerph18189599
Chicago/Turabian StyleLi, Ping, Xiaozhou Chen, and Qi Yao. 2021. "Body Mass and Income: Gender and Occupational Differences" International Journal of Environmental Research and Public Health 18, no. 18: 9599. https://doi.org/10.3390/ijerph18189599
APA StyleLi, P., Chen, X., & Yao, Q. (2021). Body Mass and Income: Gender and Occupational Differences. International Journal of Environmental Research and Public Health, 18(18), 9599. https://doi.org/10.3390/ijerph18189599