
Tuberculosis Notification Trends and Treatment Outcomes in Penitentiary and Civilian Health Care Sectors in the WHO European Region

 ,
,  , , ,
, , , 
Abstract
:1. Introduction
2. Methods and Materials
2.1. Setting
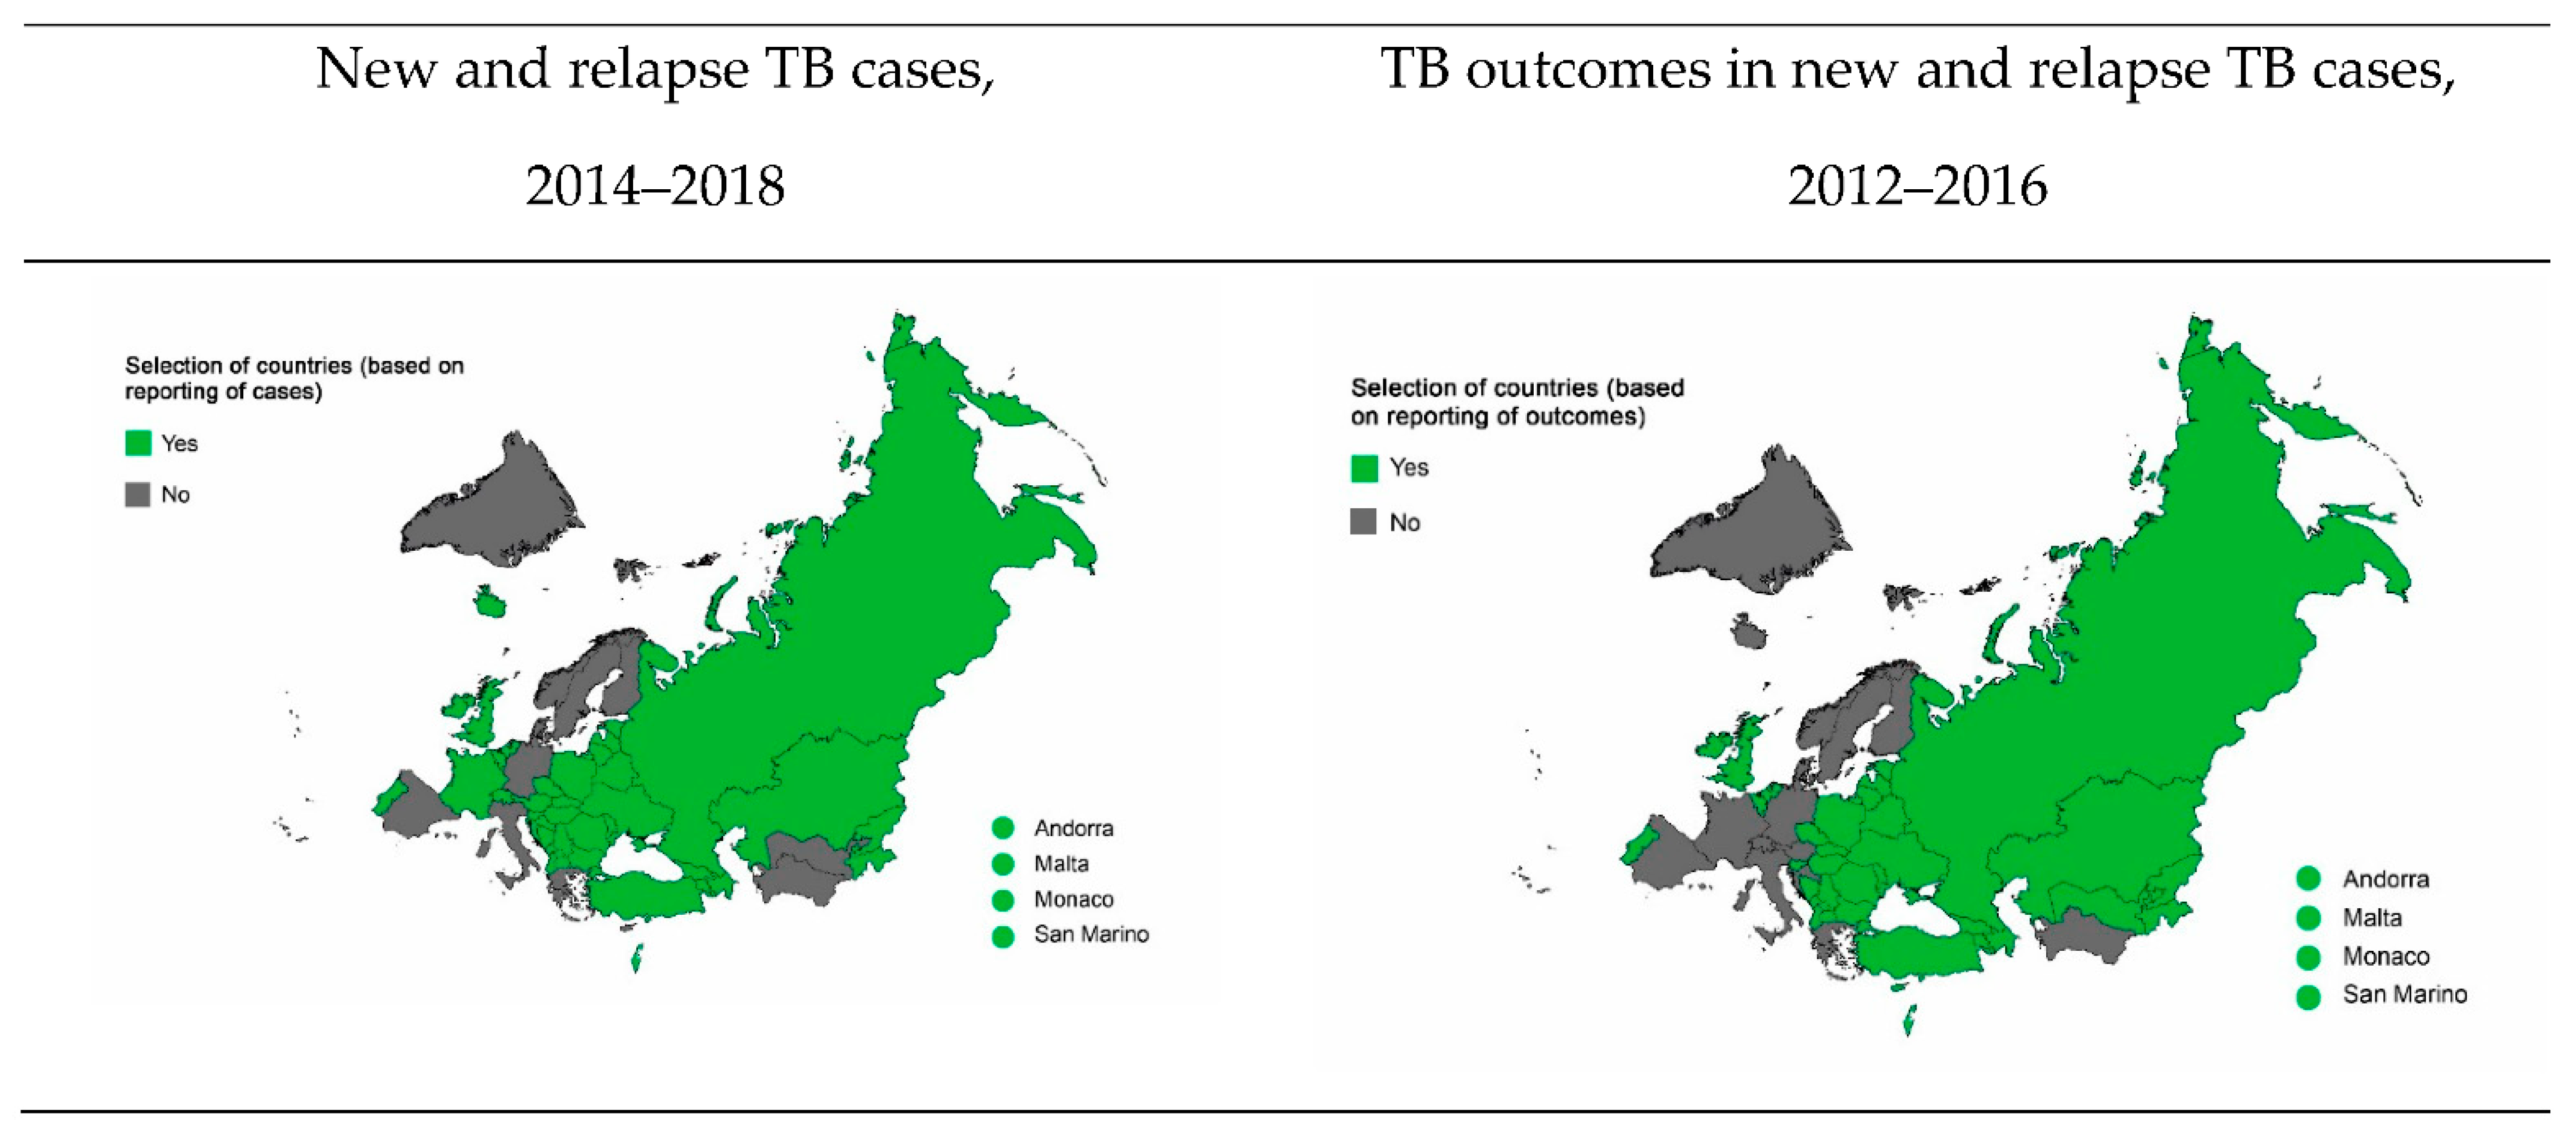
2.2. Study Population and Design
2.3. Data Variables and Sources
2.4. Analysis and Statistics
3. Results
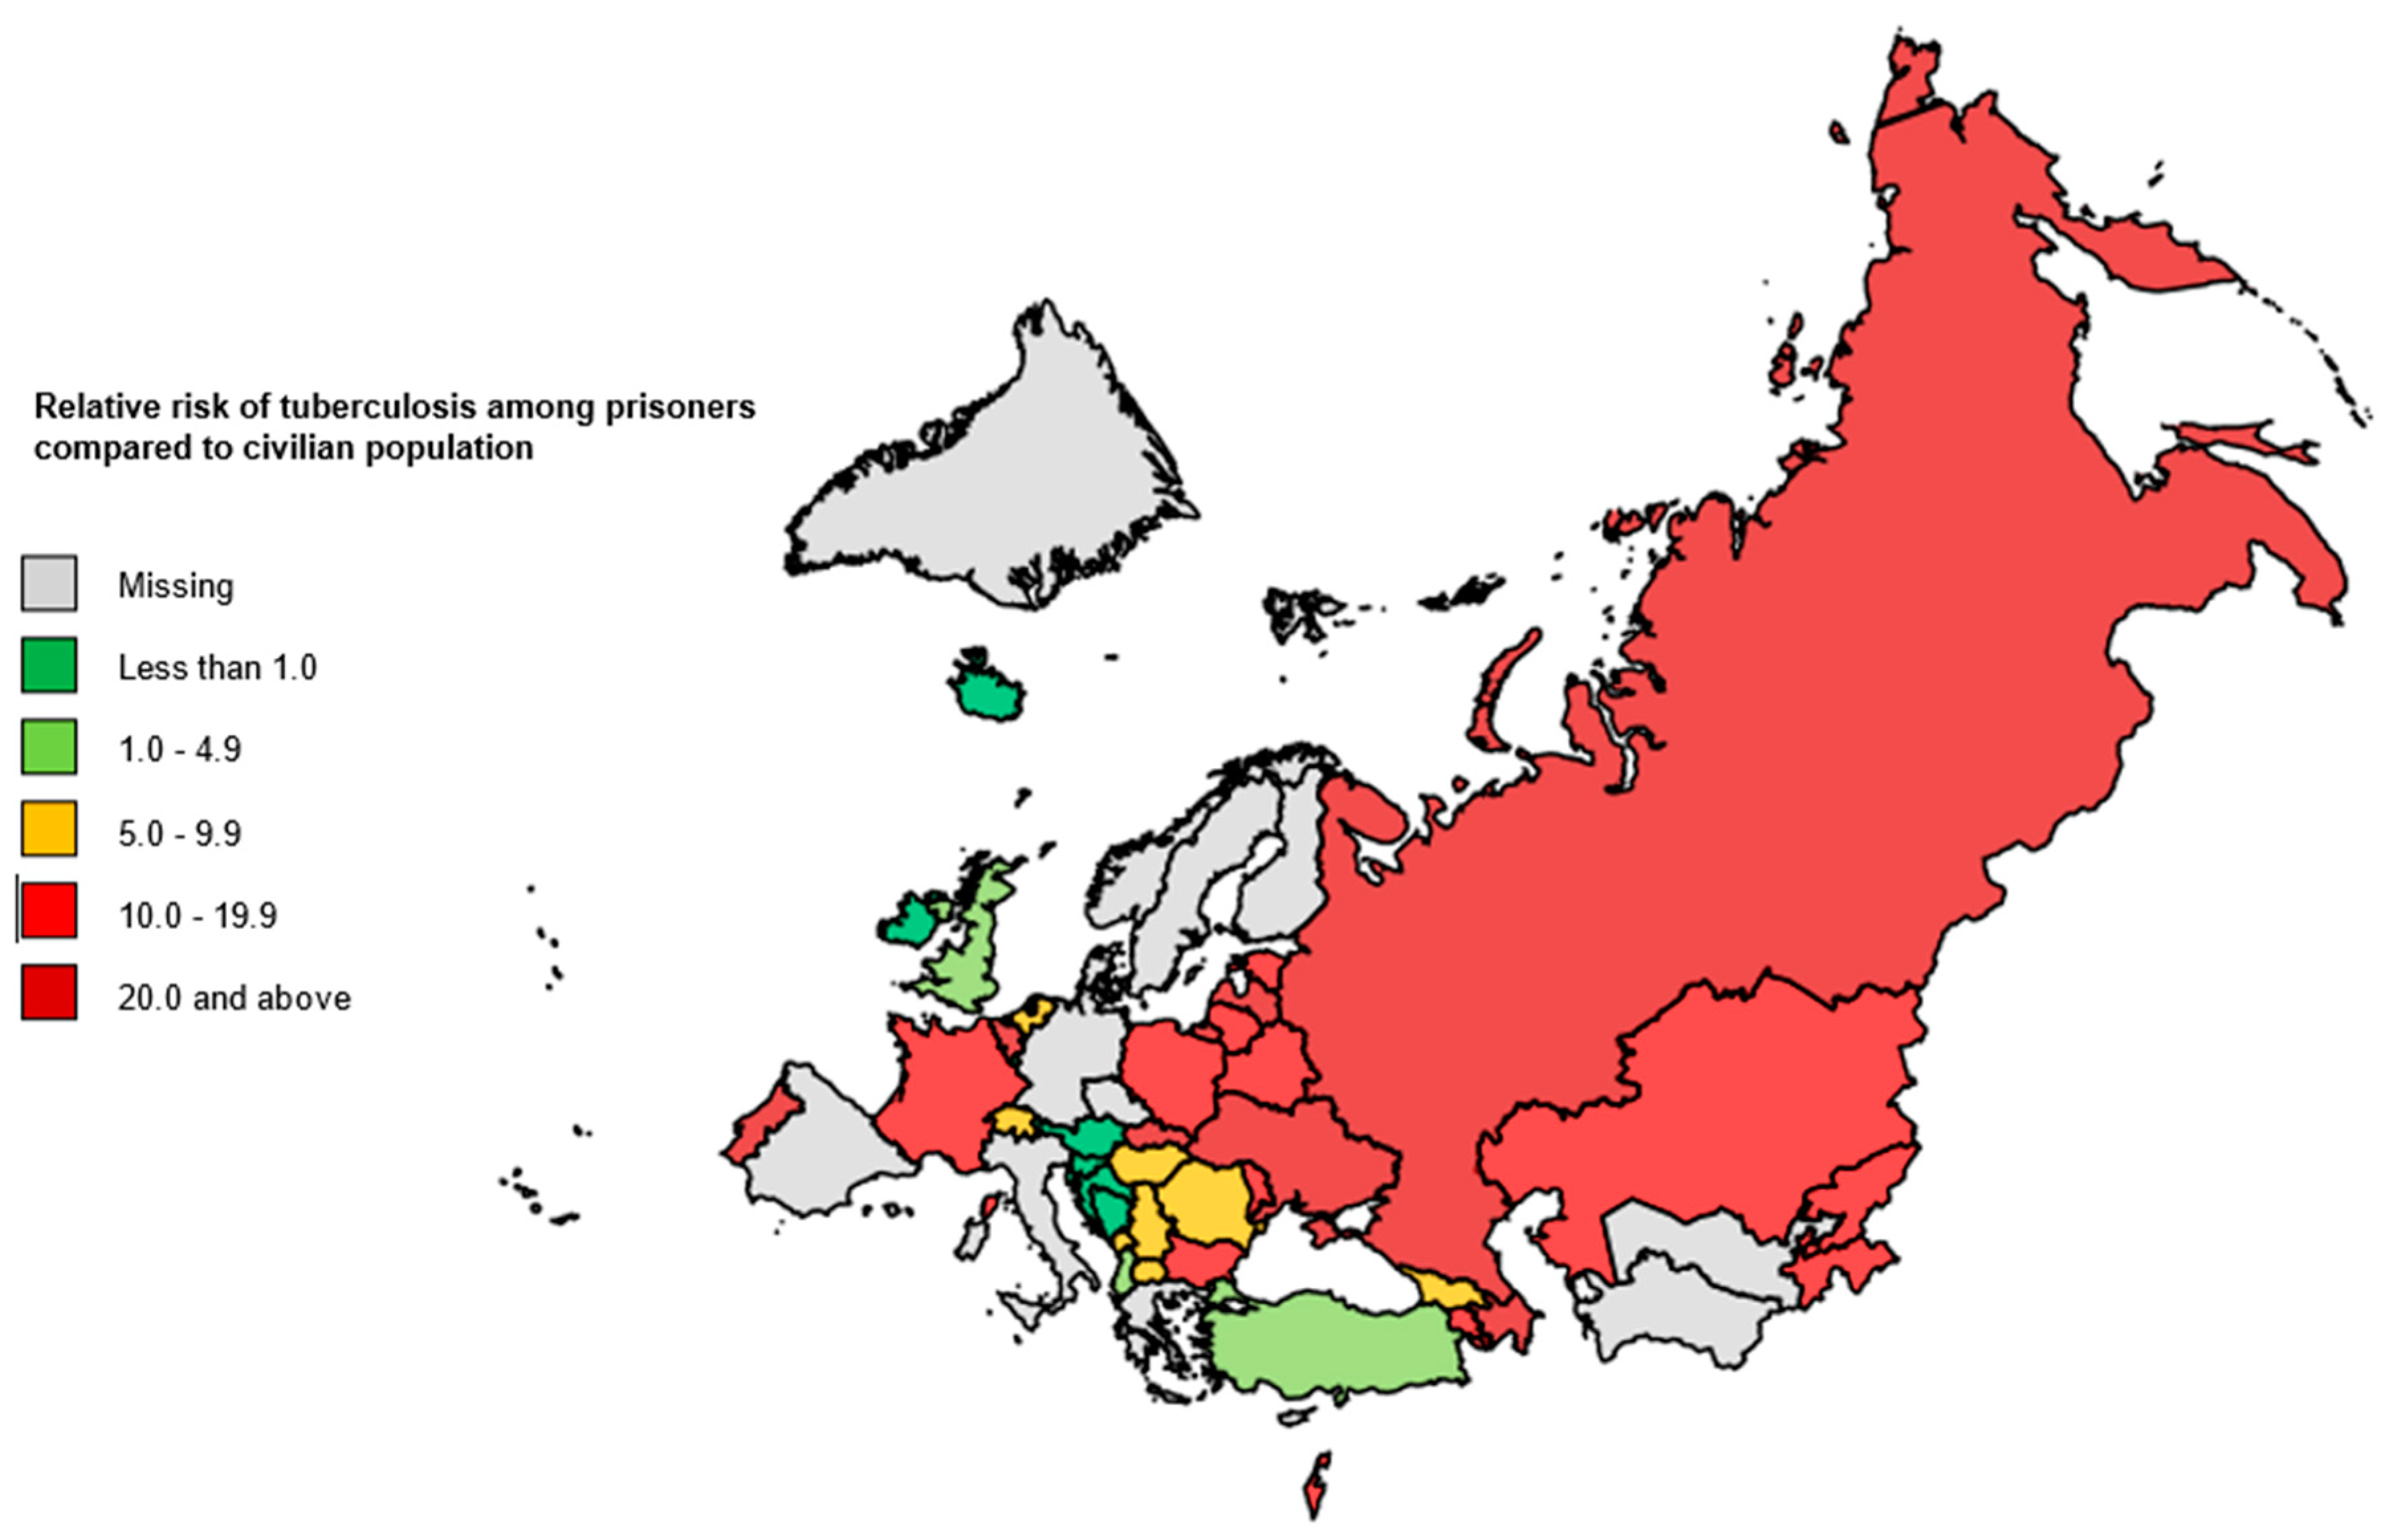
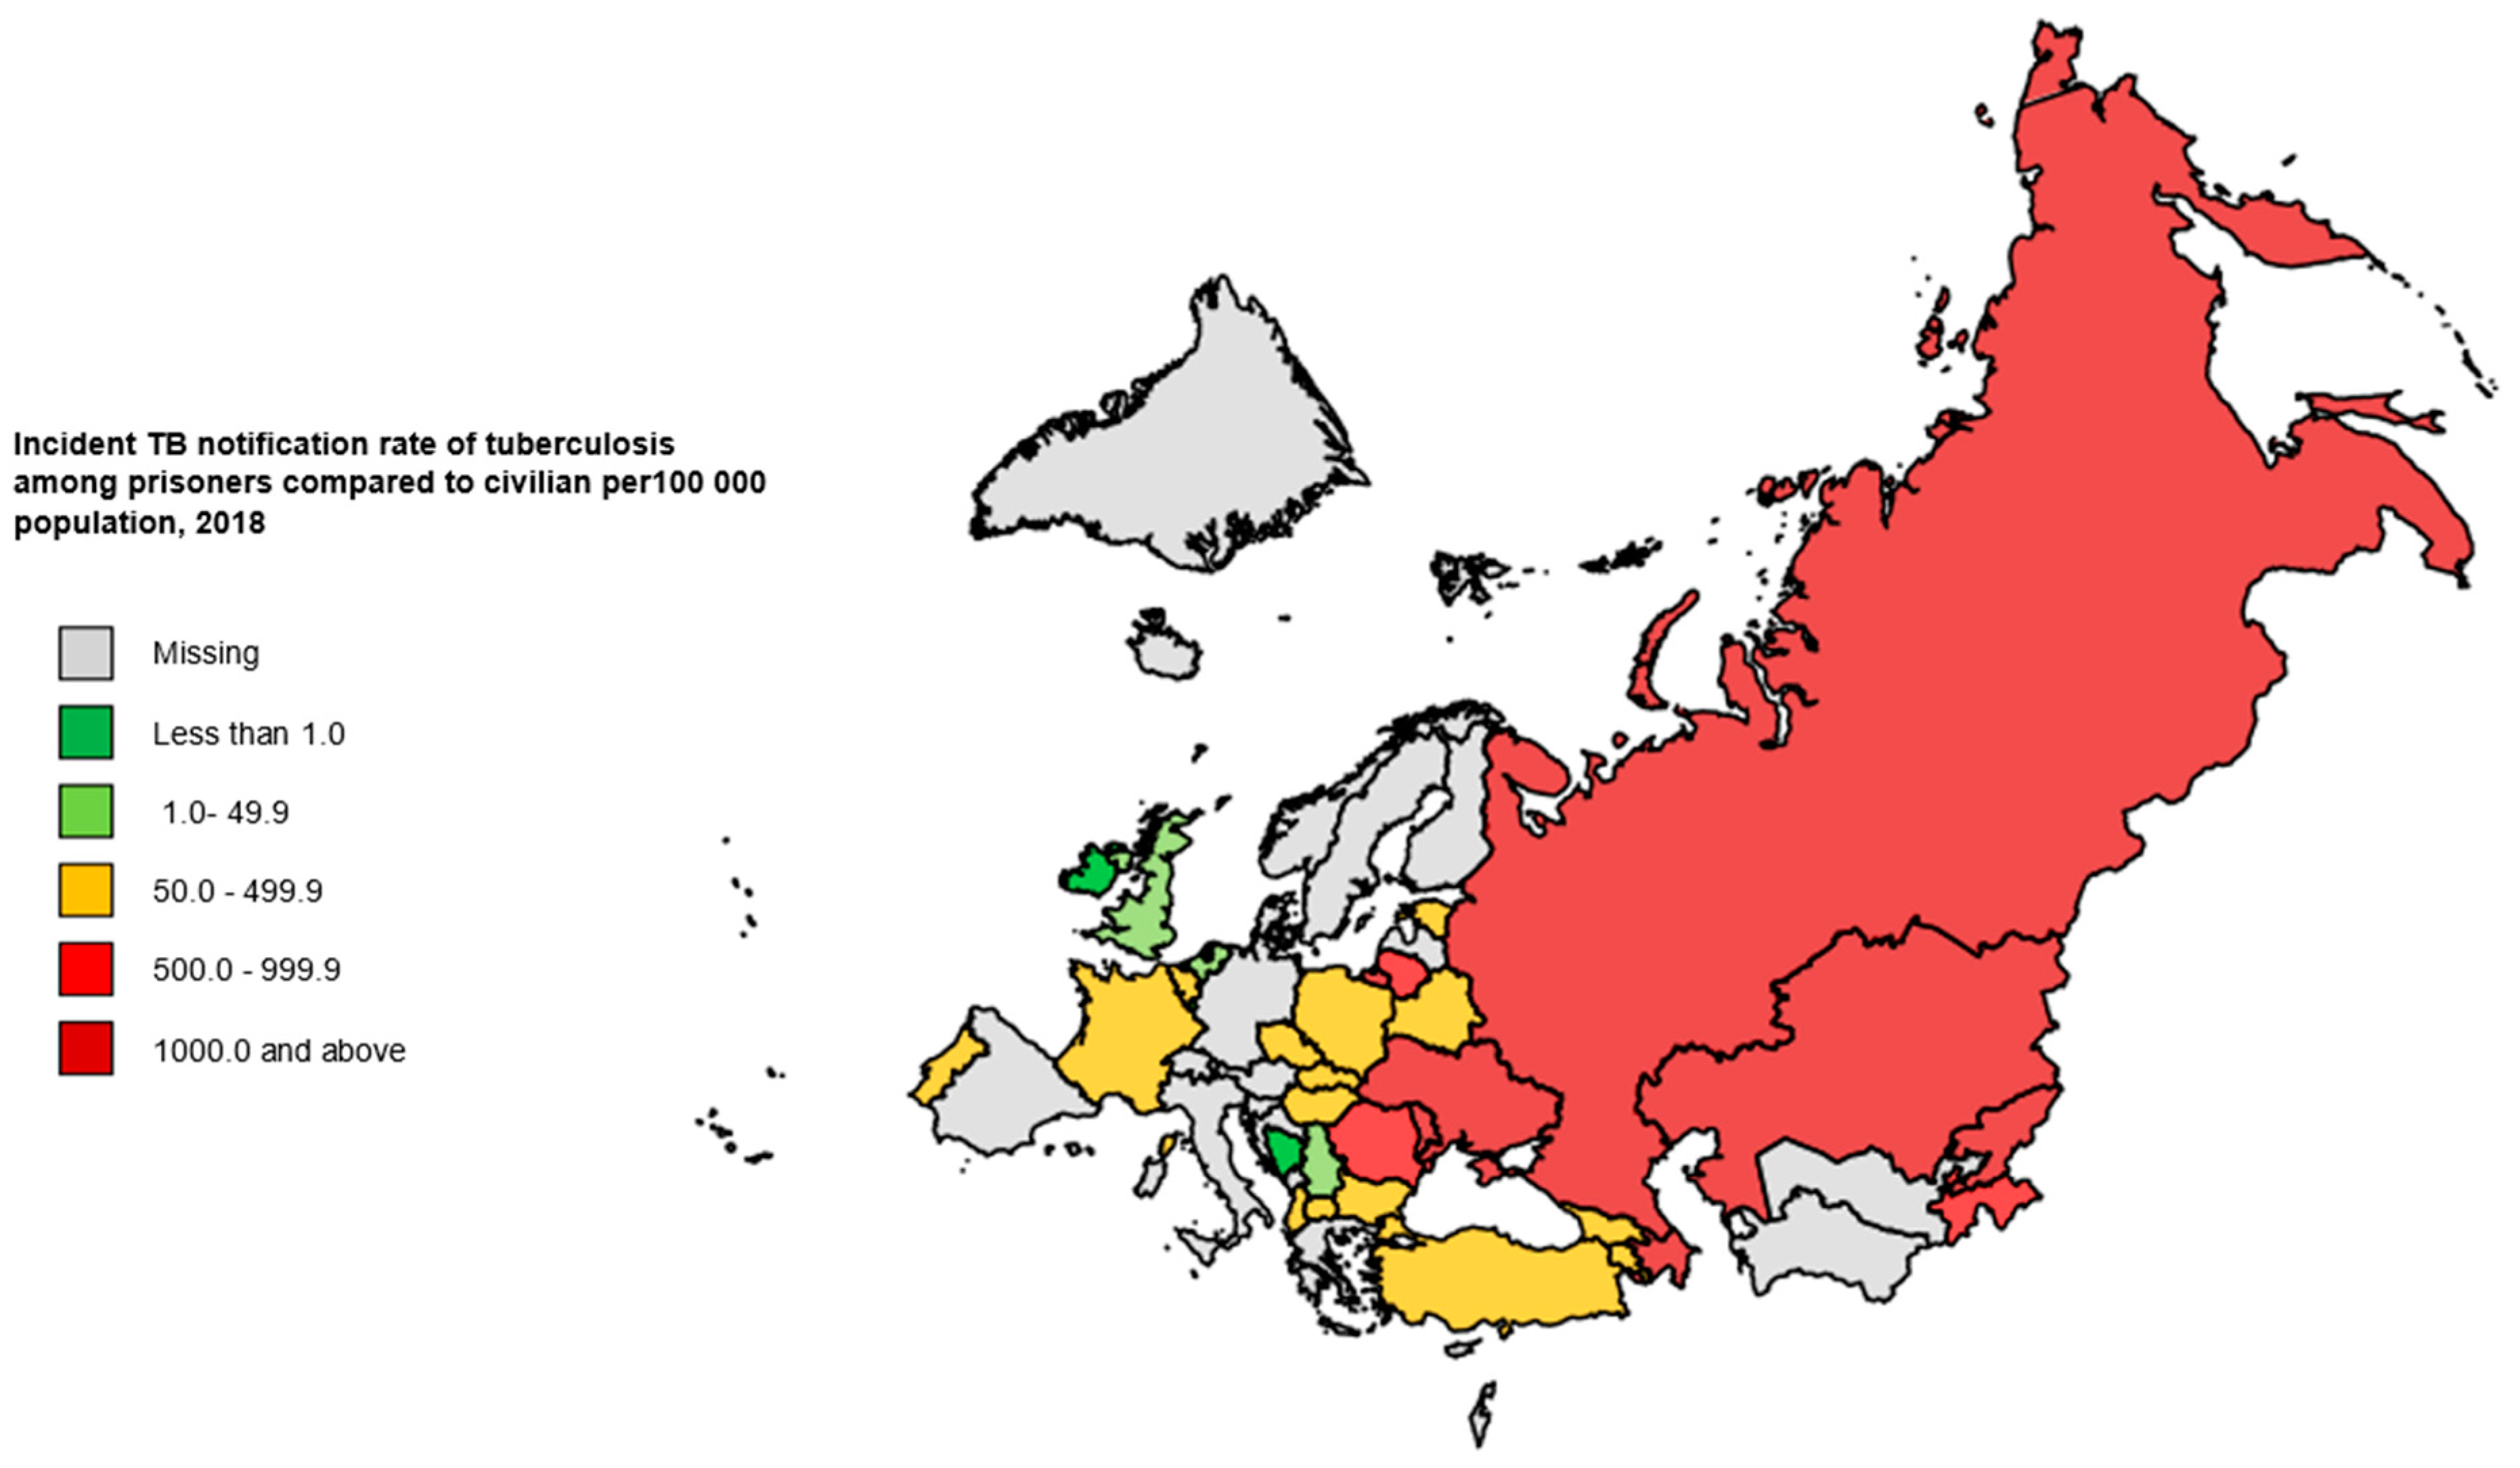
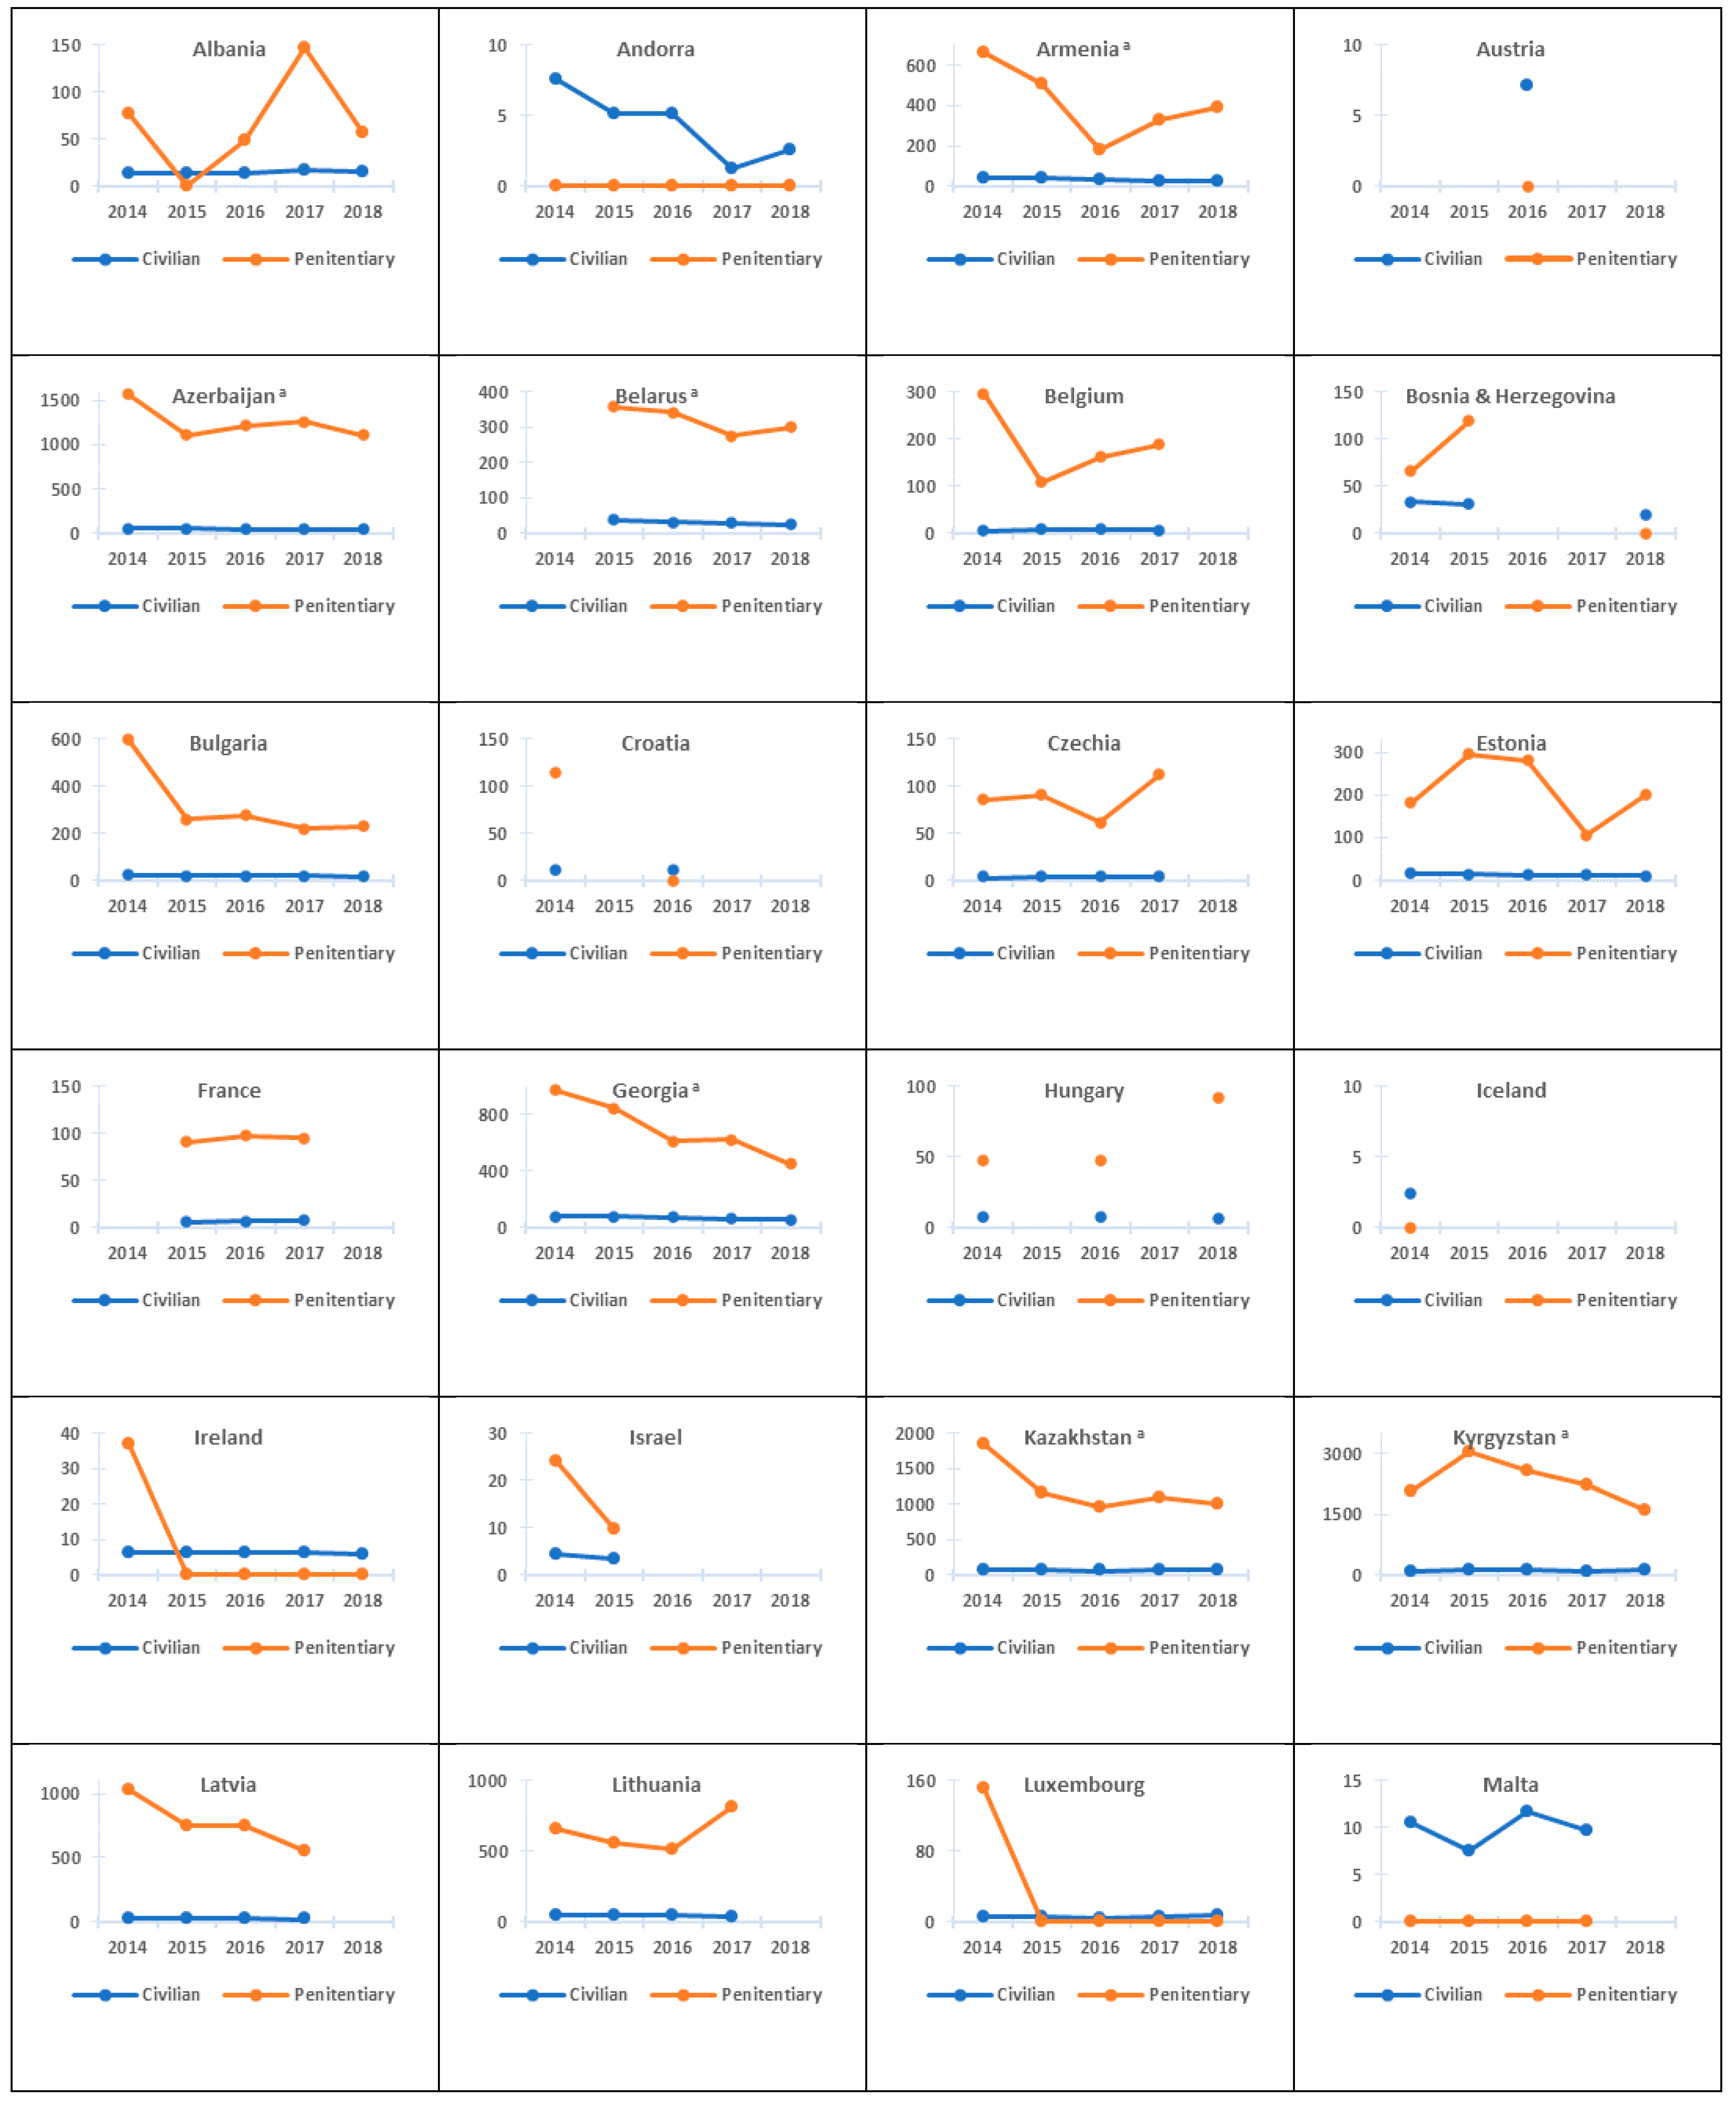
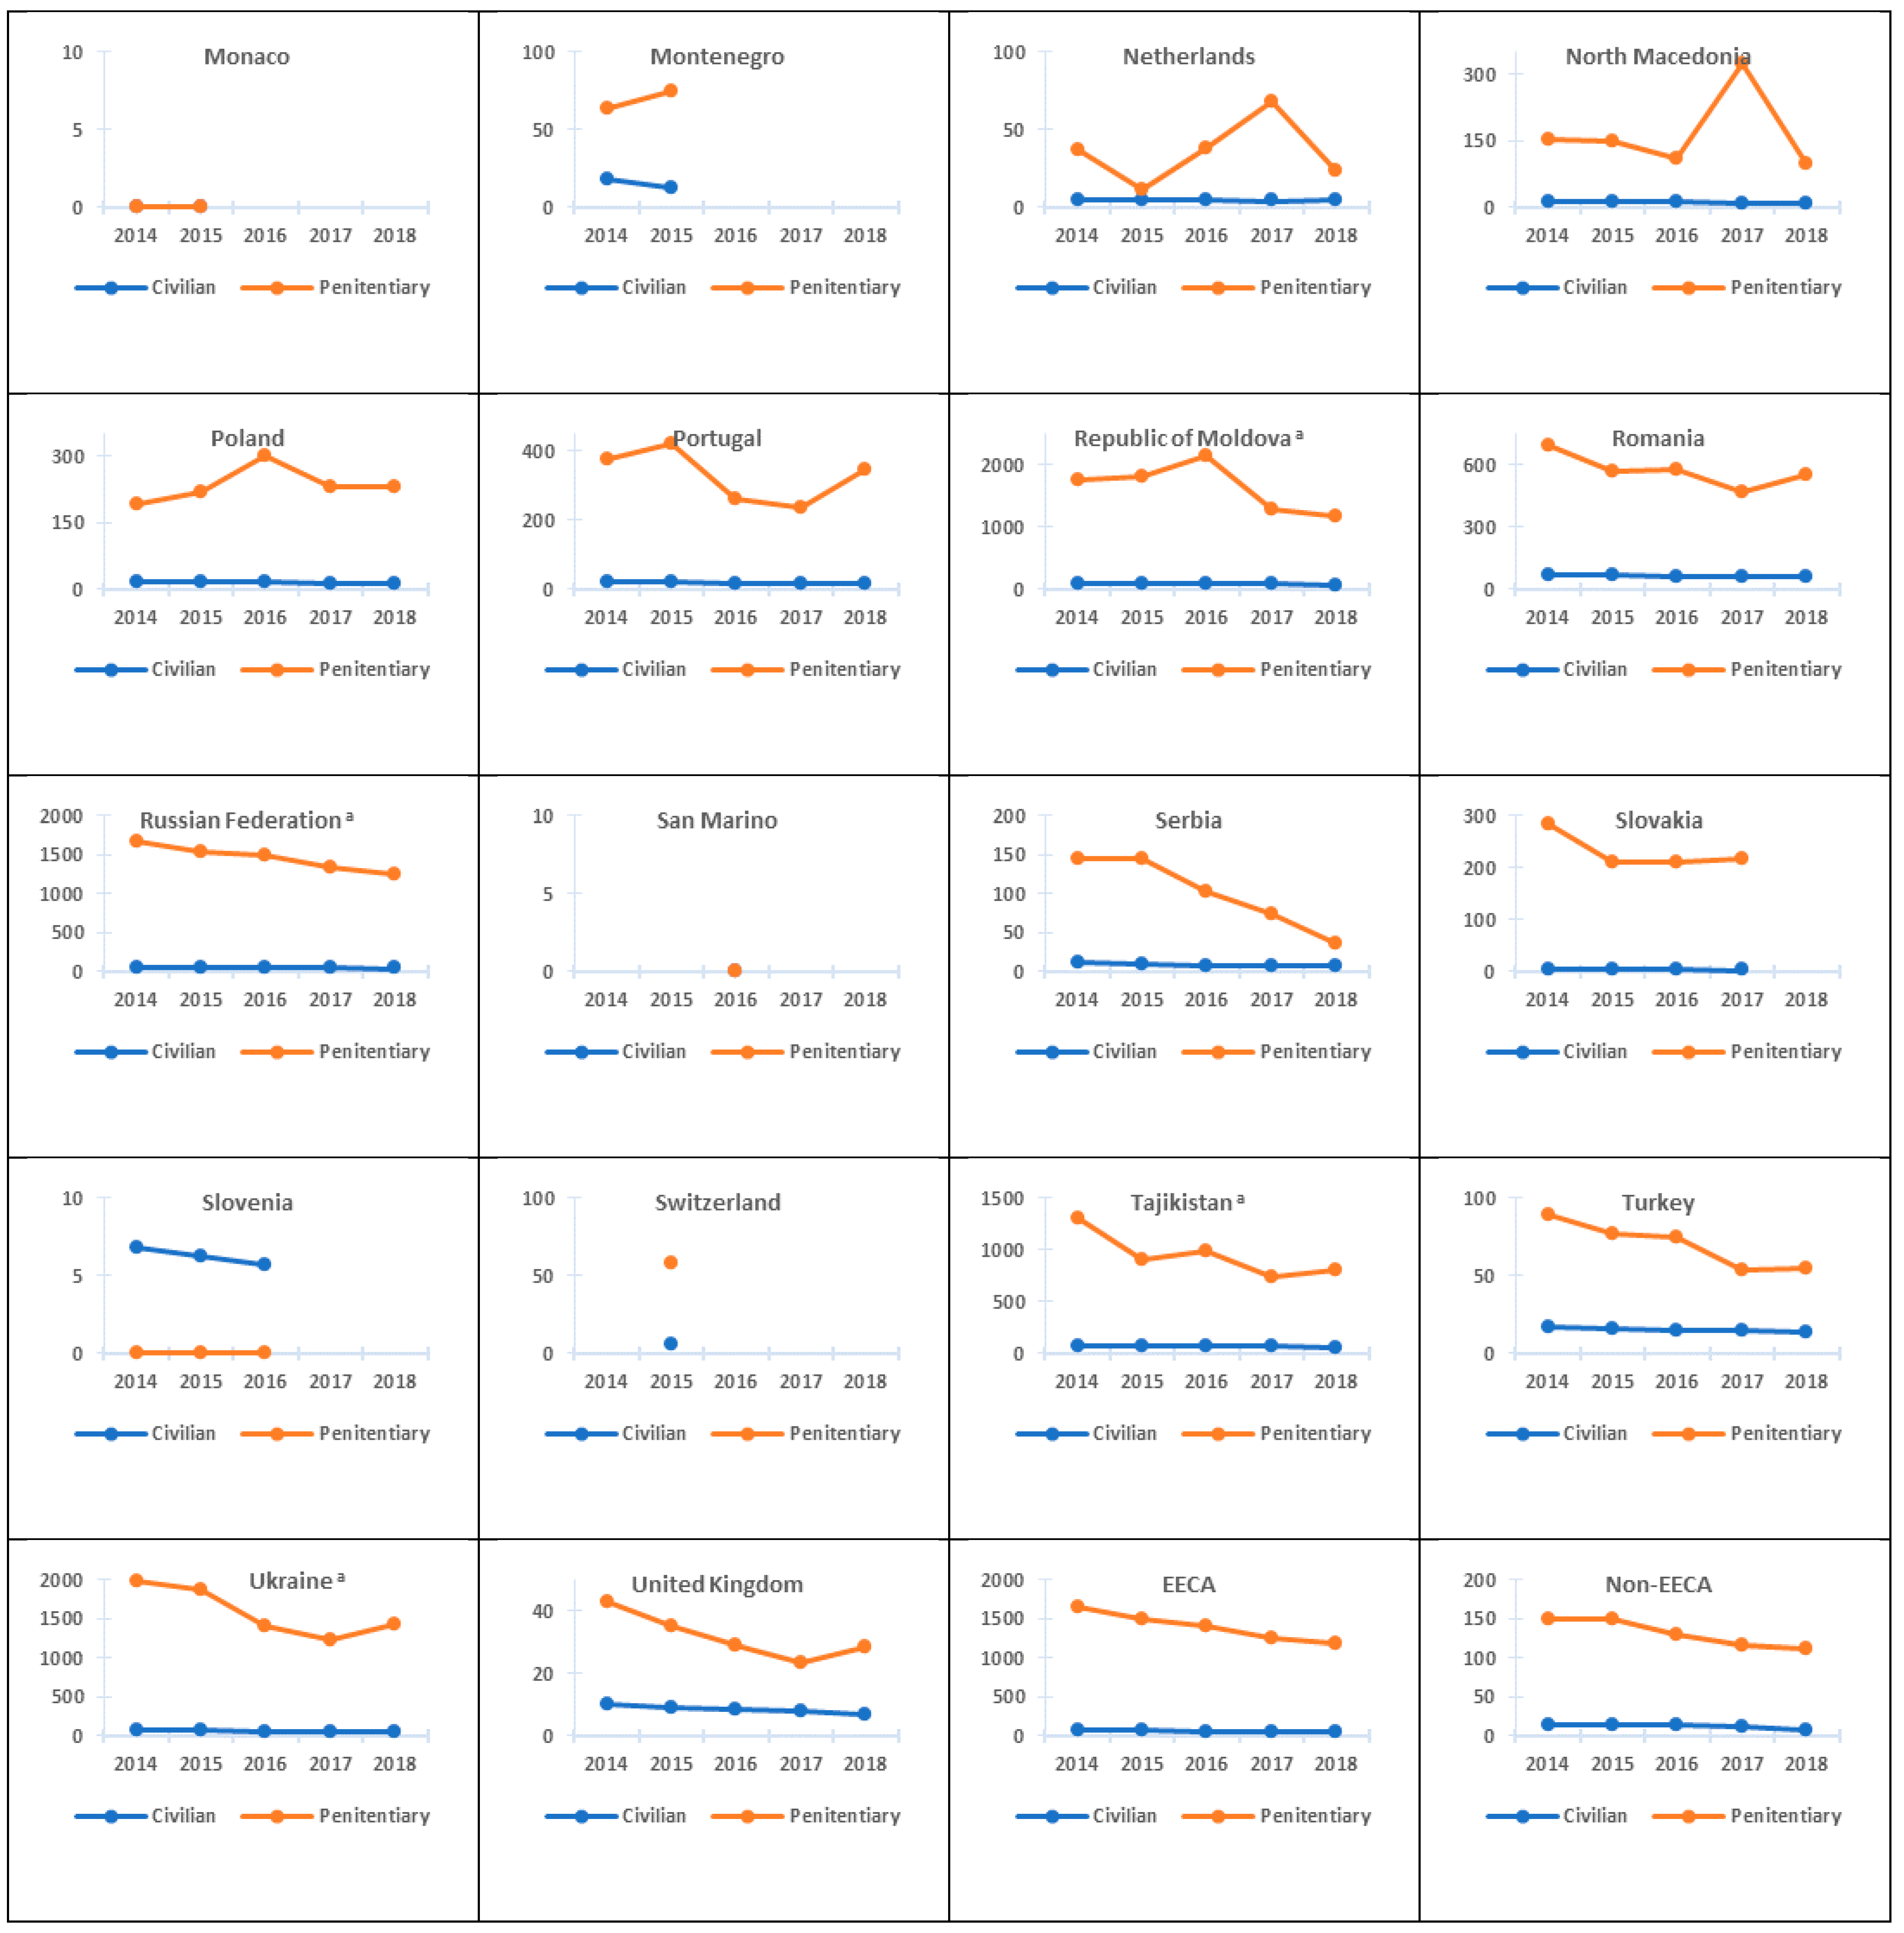
3.1. Notification Rate of Incident TB Cases and Relative Risks of Developing TB Disease in the Penitentiary Sector Compared with the Civilian Sector
3.2. Treatment Outcomes in TB Patients on First-Line Drug (FLD) Treatment Schemes
4. Discussion
5. Conclusions
5.1. Supporting Information Captions
5.1.1. Evidence Available Prior to This Study
5.1.2. Added Value of the Study
5.1.3. Implications of All Available Evidence
Author Contributions
Funding
Institutional Review Board Statement
Informed Consent Statement
Data Availability Statement
Acknowledgments
Conflicts of Interest
References
- WHO Regional Office for Europe/European Centre for Disease Prevention and Control. Tuberculosis Surveillance and Monitoring in Europe 2021—2019 Data; WHO Regional Office for Europe: Copenhagen, Denmark, 2021; Available online: https://www.euro.who.int/en/health-topics/communicable-diseases/tuberculosis/publications/2021/tuberculosis-surveillance-and-monitoring-in-europe-2021-2019-data (accessed on 12 June 2021).
- USAID. Tuberculosis in Prisons: A Growing Public Health Challenge; United States Agency for International Development: Washington, DC, USA, 2013. [Google Scholar]
- Coyle, A.; Heard, C.; Fair, H. Detention: Addressing the human cost. Current trends and practices in the use of imprisonment. Int. Rev. Red Cross 2016, 98, 761–781. [Google Scholar] [CrossRef] [Green Version]
- Walmsley, R. World Prison Population List, 11th ed.; Institute for Criminal Policy Research: London, UK, 2015. [Google Scholar]
- Walmsley, R. World Prison Population List, 12th ed.; Institute for Criminal Policy Research: London, UK, 2018; Available online: http://www.prisonstudies.org/sites/default/files/resources/downloads/wppl_12.pdf (accessed on 12 June 2021).
- Dara, M.; Acosta, C.D.; Melchers, N.V.; Al-Darraji, H.A.; Chorgoliani, D.; Reyes, H. Tuberculosis control in prisons: Current situation and research gaps. Int. J. Infect. Dis. 2015, 32, 111–117. [Google Scholar] [CrossRef] [PubMed] [Green Version]
- Dara, M.; Chadha, S.S.; Melchers, N.V.; van den Hombergh, J.; Gurbanova, E.; Al-Darraji, H.; Van Der Meer, J.B.W. Time to act to prevent and control tuberculosis among inmates. Int. J. Tuberc. Lung Dis. 2013, 17, 4–5. [Google Scholar] [CrossRef]
- Baussano, I.; Williams, B.G.; Nunn, P. Tuberculosis incidence in prisons: A systematic review. PLoS Med. 2010, 7, e1000381. [Google Scholar] [CrossRef] [PubMed]
- Winetsky, D.E.; Almukhamedov, O.; Pulatov, D.; Vezhnina, N.; Dooronbekova, A.; Zhussupov, B. Prevalence, risk factors and social context of active pulmonary tuberculosis among prison inmates in Tajikistan. PLoS ONE 2014, 9, e86046. [Google Scholar]
- Alavi, S.M.; Bakhtiarinia, P.; Eghtesad, M.; Albaji, A.; Salmanzadeh, S. A comparative study on the prevalence and risk factors of tuberculosis among the prisoners in Khuzestan, South-West Iran. Jundishapur J. Microbiol. 2014, 7, e18872. [Google Scholar] [CrossRef] [PubMed] [Green Version]
- Stuckler, D.; Basu, S.; McKee, M.; King, L. Mass incarceration can explain population increases in TB and multidrug-resistant TB in European and central Asian countries. Proc. Natl. Acad. Sci. USA 2008, 105, 13280–13285. [Google Scholar] [CrossRef] [PubMed] [Green Version]
- Cords, O.; Martinez, L.; Warren, J.L.; O’Marr, J.M.; Walter, K.S.; Cohen, T.; Zheng, J.; Ko, A.I.; Croda, J.; Andrews, J.R. Incidence and prevalence of tuberculosis in incarcerated populations: A systematic review and meta-analysis. Lancet Public Health 2021, 6, e300–e308. [Google Scholar] [CrossRef]
- Aerts, A.; Hauer, B.; Wanlin, M. Tuberculosis and tuberculosis control in European prisons. Int. J. Tuberc. Lung Dis. 2006, 10, 1215–1223. [Google Scholar] [PubMed]
- WHO. The WHO Global TB Data Collection System; World Health Organization: Geneva, Switzerland, 2021; Available online: https://extranet.who.int/tme/ (accessed on 12 June 2021).
- WHO. Countries; WHO Regional Office for Europe: Copenhagen, Denmark, 2021; Available online: http://www.euro.who.int/en/countries (accessed on 12 June 2021).
- Union Nations. DESA/Population Dynamics. World Population Prospects 2019. Available online: https://population.un.org/wpp/ (accessed on 12 June 2021).
- World Prison Brief. World Prison Brief Data: Europe. Available online: http://www.prisonstudies.org/map/europe (accessed on 12 June 2021).
- Richard Lowry. VassarStats: Website for Statistical computation. Available online: http://vassarstats.net/index.html (accessed on 12 June 2021).
- WHO. Definitions and Reporting Framework for Tuberculosis—2013 Revision (Updated December 2014); World Health Organization: Geneva, Switzerland, 2014. [Google Scholar]
- WHO. Prisons and Health; WHO Regional Office for Europe: Copenhagen, Denmark, 2014. [Google Scholar]
- Lee, D.; Lal, S.S.; Komatsu, R.; Zumla, A.; Atun, R. Global fund financing of tuberculosis services delivery in prisons. J. Infect Dis. 2012, 205 (Suppl. S2), S274–S283. [Google Scholar] [CrossRef] [PubMed]
- Grady, J.; Maeurer, M.; Atun, R. Tuberculosis in prisons: Anatomy of global neglect. Eur. Respir. J. 2011, 38, 752–754. [Google Scholar] [CrossRef] [PubMed] [Green Version]
- Ruddy, M.; Balabanova, Y.; Graham, C.; Fedorin, I.; Malomanova, N.; Elisarova, E.; Kuznetznov, S.; Gusarova, G.; Zakharova, S.; Melentyev, A.; et al. Rates of drug resistance and risk factor analysis in civilian and prison patients with tuberculosis in Samara Region, Russia. Thorax 2005, 60, 130–135. [Google Scholar] [CrossRef] [PubMed] [Green Version]
- Stern, V. The House of the Dead Revisited: Prisons, Tuberculosis and Public Health in the Former Soviet Bloc. In the Return of the White Plague: Global Poverty and the “New” Tuberculosis; Zumla, A., Gandy, M., Eds.; Verso: London, UK, 2003; pp. 178–194. [Google Scholar]
- Chaves, F.; Dronda, F.; Alonso-Sanz, M.; Gonzalez-Lopez, A.; Eisenach, K. A longitudinal study of transmission of tuberculosis in a large prison population. Am. J. Respir. Crit. Care Med. 1997, 155, 719–725. [Google Scholar] [CrossRef] [PubMed]
- Larouzé, B.; Ventura, M.; Sánchez, A.R.; Diuana, V. Tuberculose nos presídios brasileiros: Entre a responsabilização estatal e a dupla penalização dos detentos. Cad. Saúde Pública 2015, 31, 1127–1130. [Google Scholar] [CrossRef] [PubMed] [Green Version]
- Kamarulzaman, A.; Reid, S.E.; Schwitters, A.; Wiessing, L.; El-Bassel, N.; Dolan, K. Prevention of transmission of HIV, hepatitis B virus, hepatitis C virus, and tuberculosis in prisoners. Lancet 2016, 388, 1115–1126. [Google Scholar] [CrossRef]
- Gurbanova, E.; Mehdiyev, R.; Blondal, K.; Altraja, A. Rapid tests reduce the burden of tuberculosis in Azerbaijan prisons: Special emphasis on rifampicin-resistance. Rev. Esp. Sanid. Penit. 2018, 20, 111–120. [Google Scholar] [PubMed]
- Gurbanova, E.; Mehdiyev, R.; Blondal, K.; Altraja, A. Predictors of cure in rifampicin-resistant tuberculosis in prison settings with low loss to follow-up. Int. J. Tuberc. Lung Dis. 2016, 20, 645–651. [Google Scholar] [CrossRef] [PubMed]
- Gegia, M.; Kalandadze, I.; Madzgharashvili, M.; Furin, J. Developing a human rights-based program for tuberculosis control in Georgian prisons. Health Hum. Rights 2011, 13, E73–E81. [Google Scholar] [PubMed]
- Binswanger, I.A.; Stern, M.F.; Deyo, R.A.; Heagerty, P.J.; Cheadle, A.; Elmore, J.G.; Koepsell, T.D. Release from prison—A high risk of death for former inmates. N. Engl. J. Med. 2007, 356, 157–165. [Google Scholar] [CrossRef] [PubMed]
- WHO. The End TB Strategy: Global Strategy and Targets for Tuberculosis Prevention, Care and Control after 2015; World Health Organization: Geneva, Switzerland, 2014. [Google Scholar]


| a. Number of New and Relapse TB Cases, 2014–2018 | |||||||||||
| Country | Civilian Sector | Penitentiary Sector | Status | ||||||||
| 2014 | 2015 | 2016 | 2017 | 2018 | 2014 | 2015 | 2016 | 2017 | 2018 | ||
| Albania | 404 | 415 | 412 | 495 | 437 | 4 | 0 | 3 | 8 | 3 | Y |
| Andorra | 6 | 4 | 4 | 1 | 2 | 0 | 0 | 0 | 0 | 0 | Y |
| Armenia a | 1303 | 1151 | 1018 | 825 | 720 | 26 | 20 | 9 | 16 | 14 | Y |
| Austria | − | − | 619 | − | − | − | − | 0 | − | − | Y |
| Azerbaijan a | 5490 | 5228 | 4905 | 4975 | 4822 | 298 | 228 | 254 | 256 | 216 | Y |
| Belarus a | − | 3658 | 3090 | 2684 | 2253 | − | 107 | 121 | 97 | 106 | Y |
| Belgium | 851 | 916 | 967 | 896 | − | 35 | 12 | 19 | 20 | − | Y |
| Bosnia and Herzegovina | 1194 | 1091 | − | − | 666 | 2 | 4 | − | − | 0 | Y |
| Bulgaria | 1774 | 1599 | 1503 | 1392 | 1307 | 51 | 20 | 22 | 16 | 16 | Y |
| Croatia | 491 | − | 449 | − | − | 5 | − | 0 | − | − | Y |
| Cyprus | − | − | − | − | − | − | − | − | − | − | N |
| Czechia | 458 | 489 | 497 | 474 | − | 16 | 19 | 14 | 25 | 22 | Y |
| Denmark | − | − | − | − | − | − | − | − | − | − | N |
| Estonia | 230 | 197 | 180 | 168 | 140 | 6 | 9 | 8 | 3 | 5 | Y |
| Finland | − | − | − | − | − | − | − | − | − | − | N |
| France | − | 4433 | 4610 | 4774 | − | − | 61 | 65 | 65 | − | Y |
| Georgia a | 3099 | 3070 | 2926 | 2539 | 2272 | 101 | 82 | 57 | 58 | 43 | Y |
| Germany | − | − | − | − | − | − | − | − | − | − | N |
| Greece | − | − | − | − | − | − | − | − | − | − | N |
| Greenland | − | − | − | − | − | − | − | − | − | − | N |
| Hungary | 789 | − | 728 | − | − | 10 | − | 9 | − | − | Y |
| Iceland | 8 | − | − | − | − | 0 | − | − | − | − | Y |
| Ireland | 292 | 295 | 293 | 301 | 294 | 5 | 0 | 0 | 0 | 0 | Y |
| Israel | 356 | 278 | − | − | − | 5 | 2 | − | − | − | Y |
| Italy | − | − | − | − | − | − | − | − | − | − | N |
| Kazakhstan a | 14,282 | 13,423 | 11,838 | 12,063 | 12,479 | 962 | 583 | 484 | 386 | 353 | Y |
| Kyrgyzstan a | 6233 | 6779 | 6810 | 6488 | 6198 | 157 | 248 | 216 | 199 | 140 | Y |
| Latvia | 685 | 664 | 609 | 522 | − | 53 | 33 | 32 | 21 | − | Y |
| Lithuania | 1424 | 1354 | 1312 | 1214 | − | 57 | 41 | 35 | 54 | − | Y |
| Luxembourg | 37 | 30 | 29 | 32 | 42 | 1 | 0 | 0 | 0 | 0 | Y |
| Malta | 45 | 32 | 50 | 42 | − | 0 | 0 | 0 | 0 | − | Y |
| Monaco | 0 | 0 | − | − | − | 0 | 0 | − | − | − | Y |
| Montenegro | 112 | 79 | − | − | − | 1 | 1 | − | − | − | Y |
| Netherlands | 798 | 845 | 863 | 757 | 784 | 16 | 5 | 14 | 19 | 7 | Y |
| North Macedonia | 280 | 278 | 260 | 206 | 214 | 4 | 4 | 3 | 10 | 3 | Y |
| Norway | − | − | − | − | − | − | − | − | − | − | N |
| Poland | 6387 | 6065 | 5927 | 5365 | 5025 | 152 | 172 | 216 | 170 | 171 | Y |
| Portugal | 2198 | 2053 | 1833 | 1728 | 1812 | 53 | 61 | 39 | 32 | 44 | Y |
| Republic of Moldova a | 3937 | 3484 | 3398 | 3259 | 2933 | 121 | 124 | 173 | 99 | 89 | Y |
| Romania | 14,652 | 14,064 | 12,633 | 12,205 | 11,472 | 209 | 161 | 157 | 105 | 114 | Y |
| Russian Federation a | 91,025 | 89,218 | 82,797 | 76,344 | 70,967 | 11,315 | 10,372 | 9610 | 8166 | 7291 | Y |
| San Marino | − | − | 0 | 0 | 0 | − | − | 0 | 0 | 0 | Y |
| Serbia | 969 | 864 | 744 | 730 | 637 | 15 | 15 | 11 | 8 | 4 | Y |
| Slovakia | 299 | 291 | 264 | 210 | − | 21 | 17 | 17 | 18 | − | Y |
| Slovenia | 142 | 129 | 118 | − | − | 0 | 0 | 0 | − | − | Y |
| Spain | − | − | − | − | − | − | − | − | − | − | N |
| Sweden | − | − | − | − | − | − | − | − | − | − | N |
| Switzerland | − | 527 | − | − | − | − | − | 4 | − | − | Y |
| Tajikistan a | 5677 | 5804 | 5866 | 5794 | 5605 | 130 | 90 | 99 | 101 | 121 | Y |
| Turkey | 12,966 | 12,413 | 12,035 | 11,696 | 11,421 | 142 | 137 | 151 | 125 | 155 | Y |
| Turkmenistan a | − | − | − | − | − | − | − | − | − | − | N |
| Ukraine a | 30,245 | 28,974 | 28,133 | 26,485 | 25,745 | 1456 | 1177 | 919 | 744 | 767 | Y |
| United Kingdom | 6581 | 5821 | 5766 | 5226 | − | 43 | 33 | 27 | 22 | − | Y |
| Uzbekistan a | − | − | − | − | − | − | − | − | − | − | N |
| b. Number of TB Patients Who Started on One of the FLD Treatment Schemes, 2012–2016 | |||||||||||
| Country | Civilian Sector | Penitentiary Sector | Status | ||||||||
| 2012 | 2013 | 2014 | 2015 | 2016 | 2012 | 2013 | 2014 | 2015 | 2016 | ||
| Albania | 405 | 470 | 402 | 409 | 406 | 2 | 2 | 4 | 0 | 3 | Y |
| Andorra | 9 | 0 | 6 | 4 | 4 | 0 | 5 | 0 | 0 | 0 | Y |
| Armenia a | 1341 | 1228 | 1202 | 896 | 861 | 9 | 23 | 26 | 14 | 8 | Y |
| Austria | − | − | − | − | − | − | − | − | − | − | N |
| Azerbaijan a | 4341 | 3973 | 1389 | 1292 | 1270 | 275 | 321 | 234 | 183 | 194 | Y |
| Belarus a | 3298 | 2935 | 2648 | 2458 | 2076 | 127 | 99 | 58 | 67 | 47 | Y |
| Belgium | 855 | 856 | 833 | 895 | 955 | 30 | 22 | 34 | 10 | 18 | Y |
| Bosnia and Herzegovina | − | 1257 | 1194 | 1091 | 907 | − | 4 | 2 | 1 | 0 | Y |
| Bulgaria | 2136 | 1878 | 1744 | 1578 | 1488 | 44 | 25 | 45 | 20 | 22 | Y |
| Croatia | − | − | − | − | − | − | − | − | − | − | N |
| Cyprus | − | − | − | − | 55 | − | − | − | − | 1 | Y |
| Czechia | 536 | 452 | 453 | 481 | 492 | 20 | 16 | 14 | 18 | 13 | Y |
| Denmark | − | − | − | − | − | − | − | − | − | − | N |
| Estonia | 218 | 210 | 189 | 163 | 158 | 4 | 16 | 5 | 9 | 8 | Y |
| Finland | − | − | − | − | − | − | − | − | − | − | N |
| France | − | − | − | − | − | − | − | − | − | − | N |
| Georgia a | 3245 | 2994 | 2781 | 2780 | 2666 | 393 | 104 | 81 | 61 | 49 | Y |
| Germany | − | − | − | − | − | − | − | − | − | − | N |
| Greece | − | − | − | − | − | − | − | − | − | − | N |
| Greenland | − | − | − | − | − | − | − | − | − | − | N |
| Hungary | 1161 | 1016 | − | 847 | − | 11 | 14 | − | 4 | − | Y |
| Iceland | − | − | − | − | − | − | − | − | − | − | N |
| Ireland | 336 | 345 | 283 | 265 | 286 | 2 | 1 | 5 | 0 | 0 | Y |
| Israel | 506 | 295 | 317 | 261 | − | 3 | 10 | 5 | 2 | − | Y |
| Italy | − | − | − | − | − | − | − | − | − | − | N |
| Kazakhstan a | 15,514 | 13,400 | 11,791 | 13,372 | − | 761 | 1056 | 682 | 634 | − | Y |
| Kyrgyzstan a | − | 5533 | 5610 | 5969 | 5910 | − | 125 | 121 | 170 | 162 | Y |
| Latvia | 823 | 764 | 631 | 609 | 560 | 49 | 40 | 44 | 33 | 32 | Y |
| Lithuania | 1428 | 1347 | 1238 | 1183 | 1126 | 31 | 45 | 44 | 36 | 26 | Y |
| Luxembourg | − | − | 37 | − | − | − | 1 | − | − | Y | |
| Malta | 41 | 49 | 0 | 0 | 0 | 0 | 0 | 0 | 0 | 0 | Y |
| Monaco | − | 3 | 0 | − | − | − | 0 | 0 | − | − | Y |
| Montenegro | 107 | 119 | 112 | 79 | − | 0 | 0 | 1 | 1 | − | Y |
| Netherlands | 906 | 796 | 782 | 833 | 850 | 18 | 20 | 14 | 4 | 14 | Y |
| North Macedonia | 345 | 309 | 277 | 278 | 260 | 1 | 8 | 4 | 4 | 3 | Y |
| Norway | − | − | − | − | − | − | − | − | − | − | N |
| Poland | 7057 | 6791 | 6369 | 6054 | 5904 | 204 | 220 | 131 | 142 | 195 | Y |
| Portugal | 2493 | 2336 | 2198 | 2053 | 1833 | 46 | − | − | 61 | 39 | Y |
| Republic of Moldova a | 4073 | 3747 | 3358 | 2903 | 2909 | 130 | 142 | 101 | 89 | 139 | Y |
| Romania | 16,313 | 15,048 | 14,321 | 13,747 | 12,304 | 112 | 140 | 204 | 161 | 155 | Y |
| Russian Federation a | 80,594 | 71,674 | 67,146 | 71,317 | 64,591 | 9072 | 11,627 | 9990 | 9107 | 8546 | Y |
| San Marino | − | − | − | 0 | − | − | − | − | 0 | − | Y |
| Serbia | 1171 | 1163 | 1032 | 868 | 722 | 26 | 21 | 13 | 14 | 11 | Y |
| Slovakia | 323 | 368 | 298 | 288 | 262 | 20 | 27 | 20 | 17 | 17 | Y |
| Slovenia | 138 | 139 | 142 | 129 | − | 0 | 0 | 0 | 0 | − | Y |
| Spain | − | − | − | − | − | − | − | − | − | − | N |
| Sweden | − | − | − | − | − | − | − | − | − | − | N |
| Switzerland | − | − | − | − | − | − | − | − | − | − | N |
| Tajikistan a | 5664 | 5151 | 5047 | 5222 | 5254 | 147 | 112 | 102 | 76 | 70 | Y |
| Turkey | 13,409 | 13,047 | 12,791 | 12,219 | 11,851 | 126 | 123 | 142 | 143 | 166 | Y |
| Turkmenistan a | − | − | − | − | − | − | − | − | − | − | N |
| Ukraine a | 29,346 | 28,016 | 21,270 | 23,015 | 21,618 | 1582 | 1710 | 1024 | 877 | 997 | Y |
| United Kingdom | 8106 | 7260 | 6469 | 5773 | 5649 | 35 | 33 | 43 | 29 | 26 | Y |
| Uzbekistan a | 13,783 | − | − | − | − | 349 | − | − | − | − | Y |
| a. Civilian Sector | ||||||||||
| Country | Notification Rate of Incident TB Cases per 100,000 Population | Annual Change in Notification Rate of Incident TB Cases (%) | ||||||||
| 2014 | 2015 | 2016 | 2017 | 2018 | 2014–2015 | 2015–2016 | 2016–2017 | 2017–2018 | Average | |
| Albania | 13.9 | 14.2 | 14.1 | 16.9 | 15.2 | 2.6 | −0.8 | 18.2 | −10.8 | 2.3 |
| Andorra | 7.6 | 5.1 | 5.2 | 1.3 | 2.6 | −39.0 | 0.9 | −138.2 | 69.3 | −23.5 |
| Armenia a | 44.9 | 39.5 | 34.9 | 28.2 | 24.4 | −12.8 | −12.5 | −21.2 | −14.4 | −14.1 |
| Azerbaijan a | 57.9 | 54.5 | 50.5 | 50.7 | 48.6 | −6.1 | −7.5 | 0.4 | −4.4 | −4.3 |
| Belarus a | 38.7 | 32.7 | 28.5 | 23.9 | −16.8 | −14.0 | −17.3 | −14.8 | ||
| Belgium | 7.6 | 8.1 | 8.5 | 7.8 | 7.8 | 6.7 | 4.8 | −8.3 | −0.5 | 0.7 |
| Bosnia and Herzegovina | 33.5 | 30.8 | 20.1 | −8.4 | −12.0 | |||||
| Bulgaria | 24.6 | 22.3 | 21.1 | 19.7 | 18.1 | −9.8 | −5.5 | −7.0 | −8.4 | −7.4 |
| Croatia | 11.5 | 10.7 | −3.9 | |||||||
| Czech Republic | 4.3 | 4.6 | 4.7 | 4.5 | 3.9 | 6.5 | 1.6 | −4.8 | −14.2 | −2.7 |
| Estonia | 17.5 | 15.0 | 13.7 | 12.9 | 10.6 | −15.3 | −8.8 | −6.7 | −19.3 | −11.8 |
| France | 6.9 | 7.1 | 7.4 | 7.3 | 3.5 | 3.1 | −1.3 | 1.8 | ||
| Georgia a | 77.8 | 77.9 | 74.7 | 65.1 | 56.9 | 0.1 | −4.1 | −13.8 | −13.4 | −7.5 |
| Hungary | 8.1 | 7.5 | 6.1 | −6.9 | ||||||
| Ireland | 6.2 | 6.3 | 6.2 | 6.3 | 6.1 | 0.7 | −1.3 | 1.8 | −3.6 | −0.6 |
| Israel | 4.5 | 3.5 | −26.3 | −26.3 | ||||||
| Kazakhstan a | 81.9 | 75.8 | 66.0 | 66.4 | 68.2 | −7.7 | −13.9 | 0.6 | 2.8 | −4.5 |
| Kyrgyzstan a | 108.1 | 115.7 | 114.5 | 107.5 | 120.8 | 6.8 | −1.1 | −6.3 | 11.7 | 2.8 |
| Latvia | 34.1 | 33.4 | 31.0 | 26.8 | −2.0 | −7.5 | −14.4 | −7.7 | ||
| Lithuania | 48.2 | 46.3 | 45.2 | 42.1 | 36.4 | −4.1 | −2.4 | −7.2 | −14.6 | −6.8 |
| Luxembourg | 6.7 | 5.3 | 5.0 | 5.5 | 7.0 | −22.8 | −5.0 | 8.5 | 23.7 | 1.1 |
| Malta | 10.6 | 7.5 | 11.7 | 9.8 | 12.5 | −34.6 | 44.2 | −17.8 | 25.0 | 4.3 |
| Monaco | 0.0 | 0.0 | 0.0 | 0.0 | ||||||
| Montenegro | 17.9 | 12.6 | −35.0 | −35.0 | ||||||
| Netherlands | 4.7 | 5.0 | 5.1 | 4.5 | 4.6 | 5.4 | 1.8 | −13.4 | 3.4 | −0.7 |
| North Macedonia | 13.5 | 13.4 | 12.5 | 9.9 | 10.3 | −0.8 | −6.8 | −23.4 | 3.8 | −6.6 |
| Poland | 16.7 | 15.9 | 15.5 | 14.1 | 13.3 | −5.1 | −2.2 | −9.8 | −5.9 | −5.6 |
| Portugal | 20.5 | 19.7 | 17.7 | 16.8 | 17.7 | −3.8 | −10.8 | −5.7 | 5.5 | −3.6 |
| Republic of Moldova a | 96.9 | 85.8 | 83.9 | 80.6 | 72.5 | −12.1 | −2.3 | −4.0 | −10.6 | −7.0 |
| Romania | 73.5 | 70.9 | 64.0 | 62.1 | 58.9 | −3.6 | −10.2 | −3.0 | −5.3 | −5.4 |
| Russian Federation a | 63.6 | 62.3 | 57.8 | 53.2 | 48.9 | −2.1 | −7.5 | −8.2 | −8.5 | −6.4 |
| San Marino | 0.0 | 0.0 | 0.0 | 0.0 | 0.0 | 0.0 | ||||
| Serbia | 10.9 | 9.8 | 8.4 | 8.3 | 7.2 | −11.1 | −14.6 | −1.6 | −13.8 | −9.7 |
| Slovakia | 5.5 | 5.4 | 4.9 | 3.9 | 4.7 | −2.8 | −9.8 | −22.9 | 20.1 | −3.8 |
| Slovenia | 6.9 | 6.2 | 5.7 | −9.8 | −9.1 | −9.0 | ||||
| Tajikistan a | 68.0 | 68.0 | 67.2 | 65.0 | 61.7 | 0.0 | −1.1 | −3.3 | −5.3 | −2.4 |
| Turkey | 16.9 | 15.9 | 15.2 | 14.5 | 13.9 | −5.9 | −4.6 | −4.4 | −4.3 | −4.7 |
| Ukraine a | 67.5 | 65.0 | 63.4 | 60.0 | 58.3 | −3.8 | −2.4 | −5.6 | −2.9 | −3.6 |
| United Kingdom | 10.1 | 8.9 | 8.8 | 7.9 | 7.1 | −12.9 | −1.5 | −10.4 | −11.0 | −8.6 |
| EECA | 67.2 | 64.3 | 60.2 | 56.4 | 53.1 | −4.4 | −6.6 | −6.6 | −6.0 | −5.7 |
| Non-EECA | 17.2 | 14.9 | 14.0 | 13.6 | 12.7 | −14.6 | −5.8 | −3.4 | −6.8 | −7.4 |
| All Countries | 38.8 | 34.9 | 32.6 | 31.2 | 29.1 | −10.6 | −6.7 | −4.4 | −7.2 | −7.0 |
| b. Penitentiary Sector | ||||||||||
| Country | Notification Rate of Incident TB Cases per 100,000 Population | Annual Change in Notification Rate of Incident TB Cases (%) | ||||||||
| 2014 | 2015 | 2016 | 2017 | 2018 | 2014–2015 | 2015–2016 | 2016–2017 | 2017–2018 | Average | |
| Albania | 76.9 | 0.0 | 49.2 | 147.7 | 56.8 | −100.0 | 109.9 | −95.5 | −7.3 | |
| Andorra | 0.0 | 0.0 | 0.0 | 0.0 | 0.0 | 0.0 | 0.0 | 0.0 | 0.0 | 0.0 |
| Armenia a | 662.8 | 509.8 | 184.7 | 328.3 | 395.9 | −26.2 | −101.5 | 57.5 | 18.7 | −12.1 |
| Azerbaijan a | 1580.0 | 1115.8 | 1217.6 | 1266.5 | 1117.9 | −34.8 | 8.7 | 3.9 | −12.5 | −8.3 |
| Belarus a | 359.3 | 344.1 | 275.8 | 301.4 | −4.4 | −22.1 | 8.9 | −5.7 | ||
| Belgium | 297.4 | 109.3 | 161.4 | 188.3 | 160.1 | −100.1 | 39.0 | 15.4 | −16.3 | −14.3 |
| Bosnia and Herzegovina | 65.7 | 119.2 | 0.0 | 59.5 | −100.0 | |||||
| Bulgaria | 597.9 | 261.8 | 277.7 | 220.3 | 229.3 | −82.6 | 5.9 | −23.2 | 4.0 | −21.3 |
| Croatia | 114.9 | 0.0 | −100.0 | |||||||
| Czech Republic | 85.8 | 91.1 | 62.3 | 112.8 | 102.0 | 6.0 | −38.0 | 59.4 | −10.1 | 4.4 |
| Estonia | 181.8 | 296.6 | 281.6 | 107.1 | 200.0 | 49.0 | −5.2 | −96.6 | 62.4 | 2.4 |
| France | 91.3 | 97.8 | 95.2 | 96.7 | 6.9 | −2.7 | 1.6 | 1.9 | ||
| Georgia a | 973.8 | 844.0 | 610.7 | 625.0 | 473.4 | −14.3 | −32.4 | 2.3 | −27.8 | −16.5 |
| Hungary | 47.6 | 47.4 | 92.0 | 17.9 | ||||||
| Ireland | 37.3 | 0.0 | 0.0 | 0.0 | 0.0 | −100.0 | 0.0 | 0.0 | −100.0 | |
| Israel | 24.1 | 9.9 | −89.0 | −89.0 | ||||||
| Kazakhstan a | 1857.4 | 1164.9 | 967.1 | 1102.9 | 1002.3 | −46.7 | −18.6 | 13.1 | −9.6 | −14.3 |
| Kyrgyzstan a | 2081.1 | 3038.5 | 2602.4 | 2238.7 | 1623.4 | 37.8 | −15.5 | −15.1 | −32.1 | −6.0 |
| Latvia | 1031.3 | 748.5 | 754.2 | 557.8 | −32.1 | 0.8 | −30.2 | −18.5 | ||
| Lithuania | 660.0 | 557.4 | 513.6 | 818.3 | 718.8 | −16.9 | −8.2 | 46.6 | −13.0 | 2.2 |
| Luxembourg | 152.4 | 0.0 | 0.0 | 0.0 | 0.0 | −100.0 | 0.0 | 0.0 | −100.0 | |
| Malta | 0.0 | 0.0 | 0.0 | 0.0 | 0.0 | 0.0 | 0.0 | 0.0 | 0.0 | 0.0 |
| Monaco | 0.0 | 0.0 | 0.0 | 0.0 | ||||||
| Montenegro | 64.2 | 74.6 | 15.0 | 15.0 | ||||||
| Netherlands | 37.2 | 11.6 | 37.7 | 68.0 | 24.0 | −116.3 | 117.5 | 59.0 | −104.0 | −10.4 |
| Poland | 192.4 | 218.2 | 302.3 | 230.3 | 230.8 | 12.6 | 32.6 | −27.2 | 0.2 | 4.7 |
| Portugal | 378.5 | 421.9 | 261.3 | 237.7 | 348.9 | 10.9 | −47.9 | −9.5 | 38.4 | −2.0 |
| Republic of Moldova a | 1765.7 | 1809.4 | 2228.8 | 1275.4 | 1165.7 | 2.4 | 20.8 | −55.8 | −9.0 | −9.9 |
| Romania | 699.0 | 567.8 | 579.0 | 466.0 | 553.3 | −20.8 | 2.0 | −21.7 | 17.2 | −5.7 |
| Russian Federation a | 1683.6 | 1543.3 | 1503.8 | 1335.9 | 1259.7 | −8.7 | −2.6 | −11.8 | −5.9 | −7.0 |
| San Marino | 0.0 | 0.0 | 0.0 | 0.0 | 0.0 | 0.0 | ||||
| Serbia | 145.8 | 145.8 | 103.1 | 75.0 | 37.0 | 0.0 | −34.7 | −31.8 | −70.6 | −29.0 |
| Slovakia | 284.3 | 209.7 | 211.9 | 219.2 | 204.0 | −30.4 | 1.0 | 3.4 | −7.2 | −8.0 |
| Slovenia | 0.0 | 0.0 | 0.0 | 0.0 | 0.0 | 0.0 | ||||
| Tajikistan a | 1300.0 | 900.0 | 990.0 | 748.1 | 806.7 | −36.8 | 9.5 | −28.0 | 7.5 | −11.2 |
| North Macedonia | 153.8 | 148.1 | 111.1 | 323.9 | 100.0 | −3.8 | −28.8 | 107.0 | −117.5 | −10.2 |
| Turkey | 89.4 | 76.9 | 75.3 | 53.8 | 55.3 | −15.0 | −2.2 | −33.5 | 2.6 | −11.3 |
| Ukraine a | 1982.8 | 1875.7 | 1405.2 | 1222.2 | 1424.2 | −5.6 | −28.9 | −14.0 | 15.3 | −7.9 |
| United Kingdom | 43.2 | 35.1 | 29.0 | 23.8 | 28.3 | −20.7 | −19.1 | −19.8 | 17.4 | −10.0 |
| EECA | 1703.9 | 1491.4 | 1403.6 | 1254.5 | 1192.8 | −13.3 | −6.1 | −11.2 | −5.0 | −8.5 |
| Non-EECA | 158.2 | 128.1 | 132.5 | 116.3 | 107.4 | −21.1 | 3.4 | −13.1 | −7.9 | −9.2 |
| All Countries | 1084.6 | 920.7 | 861.3 | 759.9 | 682.2 | −16.4 | −6.7 | −12.5 | −10.8 | −10.9 |
| Country | N&R Notified, n | N&R Notified, Civilian Sector, n a | N&R Notified, Penitentiary Sector, n | RR (95% CI) | Reported Year |
|---|---|---|---|---|---|
| Albania | 440 | 437 | 3 | 3.74 (1.20–11.64) | 2018 |
| Andorra | 2 | 2 | 0 | 0 | 2018 |
| Armenia b | 734 | 720 | 14 | 16.15 (9.53–27.38) | 2018 |
| Austria | 619 | 619 | 0 | 0 | 2016 |
| Azerbaijan b | 5038 | 4822 | 216 | 22.78 (19.89–26.09) | 2018 |
| Belarus b | 2359 | 2253 | 106 | 12.56 (10.34–15.26) | 2018 |
| Belgium | 916 | 896 | 20 | 23.96 (15.39–37.30) | 2017 |
| Bosnia and Herzegovina | 666 | 666 | 0 | 0 | 2018 |
| Bulgaria | 1323 | 1307 | 16 | 12.33 (7.54–20.18) | 2018 |
| Croatia | 449 | 449 | 0 | 0 | 2016 |
| Czechia | 499 | 474 | 25 | 25.19 (16.85–37.66) | 2017 |
| Estonia | 145 | 140 | 5 | 18.83 (7.72–45.90) | 2018 |
| France | 4839 | 4774 | 65 | 12.93 (10.12–16.51) | 2017 |
| Georgia b | 2315 | 2272 | 43 | 7.86 (5.82–10.62) | 2018 |
| Hungary | 737 | 728 | 9 | 6.33 (3.28–12.21) | 2016 |
| Iceland | 8 | 8 | 0 | 0 | 2014 |
| Ireland | 294 | 294 | 0 | 0 | 2018 |
| Israel | 280 | 278 | 2 | 10.19 (2.50–41.45) | 2015 |
| Kazakhstan b | 1283 | 12,479 | 353 | 14.55 (13.10–16.17) | 2018 |
| Kyrgyzstan b | 6338 | 6198 | 140 | 13.24 (11.21–15.63) | 2018 |
| Latvia | 543 | 522 | 21 | 20.68 (13.39–31.95) | 2017 |
| Lithuania | 1268 | 1214 | 54 | 19.29 (14.70–25.30) | 2017 |
| Luxembourg | 42 | 42 | 0 | 0 | 2018 |
| Malta | 42 | 42 | 0 | 0 | 2017 |
| Monaco | 0 | 0 | 0 | 0 | 2015 |
| Montenegro | 80 | 79 | 1 | 5.92 (0.82–42.50) | 2015 |
| Netherlands | 791 | 784 | 7 | 5.22 (2.48–10.97) | 2018 |
| North Macedonia | 217 | 214 | 3 | 9.71 (3.11–30.33) | 2018 |
| Poland | 5196 | 5025 | 171 | 17.35 (14.90–20.20) | 2018 |
| Portugal | 1856 | 1812 | 44 | 21.38 (15.86–28.83) | 2018 |
| Republic of Moldova b | 3022 | 2933 | 89 | 16.16 (13.1–19.93) | 2018 |
| Romania | 15,586 | 11,472 | 114 | 9.35 (7.78–11.24) | 2018 |
| Russian Federation b | 78,258 | 70,967 | 7291 | 25.46 (24.85–26.07) | 2018 |
| San Marino | 0 | 0 | 0 | 0 | 2018 |
| Serbia | 641 | 637 | 4 | 5.11 (1.91–13.65) | 2018 |
| Slovakia | 228 | 210 | 18 | 56.66 (35.03–91.64) | 2017 |
| Slovenia | 118 | 118 | 0 | 0 | 2016 |
| Switzerland | 531 | 527 | 4 | 9.16 (3.43–24.49) | 2015 |
| Tajikistan b | 5726 | 5605 | 121 | 12.98 (10.85–15.53) | 2018 |
| Turkey | 11,576 | 11,421 | 155 | 3.97 (3.39–4.65) | 2018 |
| Ukraine b | 26,512 | 25,745 | 767 | 24.12 (22.46–25.90) | 2018 |
| United Kingdom | 5248 | 5226 | 22 | 3.0 (1.98–4.57) | 2017 |
| a. Civilian Sector | |||||||
| Country | Overall, n | Favourable Outcome, n (%) | Unfavourable Outcome | Not Evaluated, n (%) | Last Reported Cohort | ||
| Failure, n (%) | Died, n (%) | LTFU, n (%) | |||||
| Albania | 406 | 355 (87.4) | 3 (0.7) | 10 (2.5) | 20 (4.9) | 18 (4.4) | 2016 |
| Andorra | 4 | 3 (75.0) | 0 (0.0) | 1 (25.0) | 0 (0.0) | 0 (0.0) | 2016 |
| Armenia a | 861 | 695 (80.7) | 18 (2.1) | 48 (5.6) | 99 (11.5) | 1 (0.1) | 2016 |
| Azerbaijan a | 1270 | 1048 (82.5) | 71 (5.6) | 16 (1.3) | 113 (8.9) | 22 (1.7) | 2016 |
| Belarus a | 2076 | 1849 (89.1) | 44 (2.1) | 111 (5.3) | 68 (3.3) | 4 (0.2) | 2016 |
| Belgium | 955 | 782 (81.9) | 0 (0.0) | 58 (6.1) | 63 (6.6) | 52 (5.4) | 2016 |
| Bosnia and Herzegovina | 907 | 505 (55.7) | 13 (1.4) | 64 (7.1) | 3 (0.3) | 322 (35.5) | 2016 |
| Bulgaria | 1488 | 1270 (85.3) | 15 (1.0) | 122 (8.2) | 81 (5.4) | 0 (0.0) | 2016 |
| Cyprus | 55 | 37 (67.3) | 0 (0.0) | 0 (0.0) | 0 (0.0) | 18 (32.7) | 2016 |
| Czechia | 492 | 335 (68.1) | 1 (0.2) | 82 (16.7) | 54 (11.0) | 20 (4.1) | 2016 |
| Estonia | 158 | 125 (79.1) | 3 (1.9) | 26 (16.5) | 2 (1.3) | 2 (1.3) | 2016 |
| Georgia a | 2666 | 2226 (83.5) | 52 (2.0) | 112 (4.2) | 232 (8.7) | 44 (1.7) | 2016 |
| Hungary | 847 | 598 (70.6) | 18 (2.1) | 101 (11.9) | 78 (9.2) | 52 (6.1) | 2015 |
| Ireland | 286 | 103 (36.0) | 0 (0.0) | 16 (5.6) | 2 (0.7) | 165 (57.7) | 2016 |
| Israel | 261 | 216 (82.8) | 1 (0.4) | 19 (7.3) | 8 (3.1) | 17 (6.5) | 2015 |
| Kazakhstan a | 13,372 | 12,188 (91.1) | 396 (3.0) | 666 (5.0) | 122 (0.9) | 0 (0.0) | 2015 |
| Kyrgyzstan a | 5910 | 4838 (81.9) | 108 (1.8) | 351 (5.9) | 591 (10.0) | 22 (0.4) | 2016 |
| Latvia | 560 | 477 (85.2) | 0 (0.0) | 52 (9.3) | 28 (5.0) | 3(0.5) | 2016 |
| Lithuania | 1126 | 949 (84.3) | 12 (1.1) | 109 (9.7) | 51 (4.5) | 5 (0.4) | 2016 |
| Luxembourg | 37 | 0 (0.0) | 0 (0.0) | 1 (2.7) | 0 (0.0) | 36 (97.3) | 2014 |
| Malta | 49 | 37 (75.5) | 0 (0.0) | 1 (2.0) | 3 (6.1) | 8 (16.3) | 2013 |
| Monaco | 0 | 0 | 0 | 0 | 0 | 0 | 2014 |
| Montenegro | 79 | 73 (92.4) | 0 (0.0) | 3 (3.8) | 3 (3.8) | 0 (0.0) | 2015 |
| Netherlands | 850 | 741 (87.2) | 0 (0.0) | 30 (3.5) | 33 (3.9) | 46 (5.4) | 2016 |
| North Macedonia | 260 | 230 (88.5) | 1 (0.4) | 18 (6.9) | 10 (3.8) | 1 (0.4) | 2016 |
| Poland | 5904 | 3187 (54.0) | 3 (0.1) | 578 (9.8) | 361(6.1) | 1775 (30.1) | 2016 |
| Portugal | 1833 | 1298 (70.8) | 0 (0.0) | 131 (7.1) | 60 (3.3) | 344 (18.8) | 2016 |
| Republic of Moldova a | 2909 | 2398 (82.4) | 70 (2.4) | 292 (10.0) | 114 (3.9) | 35 (1.2) | 2016 |
| Romania | 12,304 | 10,578 (86.0) | 193 (1.6) | 996 (8.1) | 518 (4.2) | 19 (0.2) | 2016 |
| Russian Federation a | 64,591 | 47,524 (73.6) | 3761 (5.8) | 7098 (11.0) | 3213 (5.0) | 2995 (4.6) | 2016 |
| San Marino | 0 | 0 | 0 | 0 | 0 | 0 | 2015 |
| Serbia | 722 | 583 (80.7) | 6 (0.8) | 64 (8.9) | 26 (3.6) | 43 (6.0) | 2016 |
| Slovakia | 262 | 224 (85.5) | 0 (0.0) | 27 (10.3) | 2 (0.8) | 9 (3.4) | 2016 |
| Slovenia | 129 | 105 (81.4) | 0 (0.0) | 21 (16.3) | 0 (0.0) | 3 (2.3) | 2015 |
| Tajikistan a | 5254 | 4690 (89.3) | 103 (2.0) | 223 (4.2) | 195 (3.7) | 43 (0.8) | 2016 |
| Turkey | 11,851 | 10,323 (87.1) | 31 (0.3) | 698 (5.9) | 311 (2.6) | 488 (4.1) | 2016 |
| Ukraine a | 21,618 | 16,756 (77.5) | 1326 (6.1) | 2112 (9.8) | 1339 (6.2) | 85 (0.4) | 2016 |
| United Kingdom | 5649 | 4554 (80.6) | 0 (0.0) | 315 (5.6) | 262 (4.6) | 518 (9.2) | 2016 |
| Uzbekistan a | 13,783 | 11,667 (84.6) | 272 (2.0) | 615 (4.5) | 677 (4.9) | 552 (4.0) | 2012 |
| b. Penitentiary sector | |||||||
| Country | Overall, n | Favourable Outcome, n (%) | Unfavourable Outcome | Not Evaluated, n (%) | Last Reported Cohort | ||
| Failure, n (%) | Died, n (%) | LTFU, n (%) | |||||
| Albania | 3 | 2 (66.7) | 0 (0.0) | 0 (0.0) | 0 (0.0) | 1 (33.3) | 2016 |
| Andorra | 0 | 0 | 0 | 0 | 0 | 0 | 2016 |
| Armenia a | 8 | 8 (100.0) | 0 (0.0) | 0 (0.0) | 0 (0.0) | 0 (0.0) | 2016 |
| Azerbaijan a | 194 | 177 (91.2) | 2 (1.0) | 10 (5.2) | 5 (2.6) | 0 (0.0) | 2016 |
| Belarus a | 47 | 45 (95.7) | 1 (2.1) | 1 (2.1) | 0 (0.0) | 0 (0.0) | 2016 |
| Belgium | 18 | 11 (61.1) | 0 (0.0) | 0 (0.0) | 4 (22.2) | 3 (16.7) | 2016 |
| Bosnia and Herzegovina | 0 | 0 | 0 | 0 | 0 | 0 | 2016 |
| Bulgaria | 22 | 21 (95.5) | 0 (0.0) | 0 (0.0) | 1 (4.5) | 0 (0.0) | 2016 |
| Cyprus | 1 | 0 (0.0) | 0 (0.0) | 0 (0.0) | 1 (100.0) | 0 (0.0) | 2016 |
| Czechia | 13 | 11 (84.6) | 0 (0.0) | 1 (7.7) | 0 (0.0) | 1 (7.7) | 2016 |
| Estonia | 8 | 8 (100.0) | 0 (0.0) | 0 (0.0) | 0 (0.0) | 0 (0.0) | 2016 |
| Georgia a | 49 | 37 (75.5) | 1 (2.0) | 1 (2.0) | 3 (6.1) | 7 (14.3) | 2016 |
| Hungary | 4 | 2 (50.0) | 0 (0.0) | 0 (0.0) | 2 (50.0) | 0 (0.0) | 2015 |
| Ireland | 0 | 0 | 0 | 0 | 0 | 0 | 2016 |
| Israel | 2 | 2 (100.0) | 0 (0.0) | 0 (0.0) | 0 (0.0) | 0 (0.0) | 2015 |
| Kazakhstan a | 634 | 503 (79.3) | 44 (6.9) | 8 (1.3) | 79 (12.5) | 0 (0.0) | 2015 |
| Kyrgyzstan a | 162 | 130 (80.2) | 4 (2.5) | 9 (5.6) | 18 (11.1) | 1 (0.6) | 2016 |
| Latvia | 32 | 28 (87.5) | 1 (3.1) | 1 (3.1) | 1 (3.1) | 1 (3.1) | 2016 |
| Lithuania | 26 | 18 (69.2) | 0 (0.0) | 2 (7.7) | 6 (23.1) | 0 (0.0) | 2016 |
| Luxembourg | 1 | 1 (100.0) | 0 (0.0) | 0 (0.0) | 0 (0.0) | 0 (0.0) | 2014 |
| Malta | 0 | 0 | 0 | 0 | 0 | 0 | 2013 |
| Monaco | 0 | 0 | 0 | 0 | 0 | 0 | 2014 |
| Montenegro | 1 | 1 (100.0) | 0 (0.0) | 0 (0.0) | 0 (0.0) | 0 (0.0) | 2015 |
| Netherlands | 14 | 6 (42.9) | 0 (0.0) | 0 (0.0) | 4 (28.6) | 4 (28.6) | 2016 |
| North Macedonia | 3 | 2 (66.7) | 0 (0.0) | 0 (0.0) | 1 (33.3) | 0 (0.0) | 2016 |
| Poland | 195 | 113 (57.9) | 0 (0.0) | 4 (2.1) | 3 (1.5) | 75 (38.5) | 2016 |
| Portugal | 39 | 18 (46.2) | 0 (0.0) | 1 (2.6) | 0 (0.0) | 20 (51.3) | 2016 |
| Republic of Moldova a | 139 | 117 (84.2) | 7 (5.0) | 2 (1.4) | 9 (6.5) | 4 (2.9) | 2016 |
| Romania | 155 | 145 (93.5) | 0 (0.0) | 6 (3.9) | 4 (2.6) | 0 (0.0) | 2016 |
| Russian Federation a | 8546 | 4811 (56.3) | 841 (9.8) | 325 (3.8) | 328 (3.8) | 2241 (26.2) | 2016 |
| San Marino | 0 | 0 | 0 | 0 | 0 | 0 | 2015 |
| Serbia | 11 | 7 (63.6) | 0 (0.0) | 1 (9.1) | 3 (27.3) | 0 (0.0) | 2016 |
| Slovakia | 17 | 17 (100.0) | 0 (0.0) | 0 (0.0) | 0 (0.0) | 0 (0.0) | 2016 |
| Slovenia | 0 | 0 | 0 | 0 | 0 | 0 | 2015 |
| Tajikistan a | 70 | 61 (87.1) | 1 (1.4) | 5 (7.1) | 3 (4.3) | 0 (0.0) | 2016 |
| Turkey | 166 | 139 (83.7) | 1 (0.6) | 7 (4.2) | 14 (8.4) | 5 (3.0) | 2016 |
| Ukraine a | 997 | 478 (47.9) | 434 (43.5) | 28 (2.8) | 48 (4.8) | 9 (0.9) | 2016 |
| United Kingdom | 26 | 16 (61.5) | 0 (0.0) | 1 (3.8) | 2 (7.7) | 7 (26.9) | 2016 |
| Uzbekistan a | 349 | 238 (68.2) | 38 (10.9) | 38 (10.9) | 10 (2.9) | 25 (7.2) | 2012 |
Publisher’s Note: MDPI stays neutral with regard to jurisdictional claims in published maps and institutional affiliations. |
© 2021 by the authors. Licensee MDPI, Basel, Switzerland. This article is an open access article distributed under the terms and conditions of the Creative Commons Attribution (CC BY) license (https://creativecommons.org/licenses/by/4.0/).
Share and Cite
Dadu, A.; Ciobanu, A.; Hovhannesyan, A.; Alikhanova, N.; Korotych, O.; Gurbanova, E.; Mehdiyev, R.; Doltu, S.; Gozalov, O.; Ahmedov, S.; et al. Tuberculosis Notification Trends and Treatment Outcomes in Penitentiary and Civilian Health Care Sectors in the WHO European Region. Int. J. Environ. Res. Public Health 2021, 18, 9566. https://doi.org/10.3390/ijerph18189566
Dadu A, Ciobanu A, Hovhannesyan A, Alikhanova N, Korotych O, Gurbanova E, Mehdiyev R, Doltu S, Gozalov O, Ahmedov S, et al. Tuberculosis Notification Trends and Treatment Outcomes in Penitentiary and Civilian Health Care Sectors in the WHO European Region. International Journal of Environmental Research and Public Health. 2021; 18(18):9566. https://doi.org/10.3390/ijerph18189566
Chicago/Turabian StyleDadu, Andrei, Ana Ciobanu, Araksya Hovhannesyan, Natavan Alikhanova, Oleksandr Korotych, Elmira Gurbanova, Rafael Mehdiyev, Svetlana Doltu, Ogtay Gozalov, Sevim Ahmedov, and et al. 2021. "Tuberculosis Notification Trends and Treatment Outcomes in Penitentiary and Civilian Health Care Sectors in the WHO European Region" International Journal of Environmental Research and Public Health 18, no. 18: 9566. https://doi.org/10.3390/ijerph18189566
APA StyleDadu, A., Ciobanu, A., Hovhannesyan, A., Alikhanova, N., Korotych, O., Gurbanova, E., Mehdiyev, R., Doltu, S., Gozalov, O., Ahmedov, S., & Dara, M. (2021). Tuberculosis Notification Trends and Treatment Outcomes in Penitentiary and Civilian Health Care Sectors in the WHO European Region. International Journal of Environmental Research and Public Health, 18(18), 9566. https://doi.org/10.3390/ijerph18189566