
Inequality-Reducing Effects of Tobacco Tax Increase: Accounting for Behavioral Response of Low-, Middle-, and High-Income Households in Serbia


Abstract
:1. Introduction
2. Literature Review: The Impact of Excise Taxes on Different Income Groups
3. Materials and Methods
3.1. Data and Descriptive Statistics
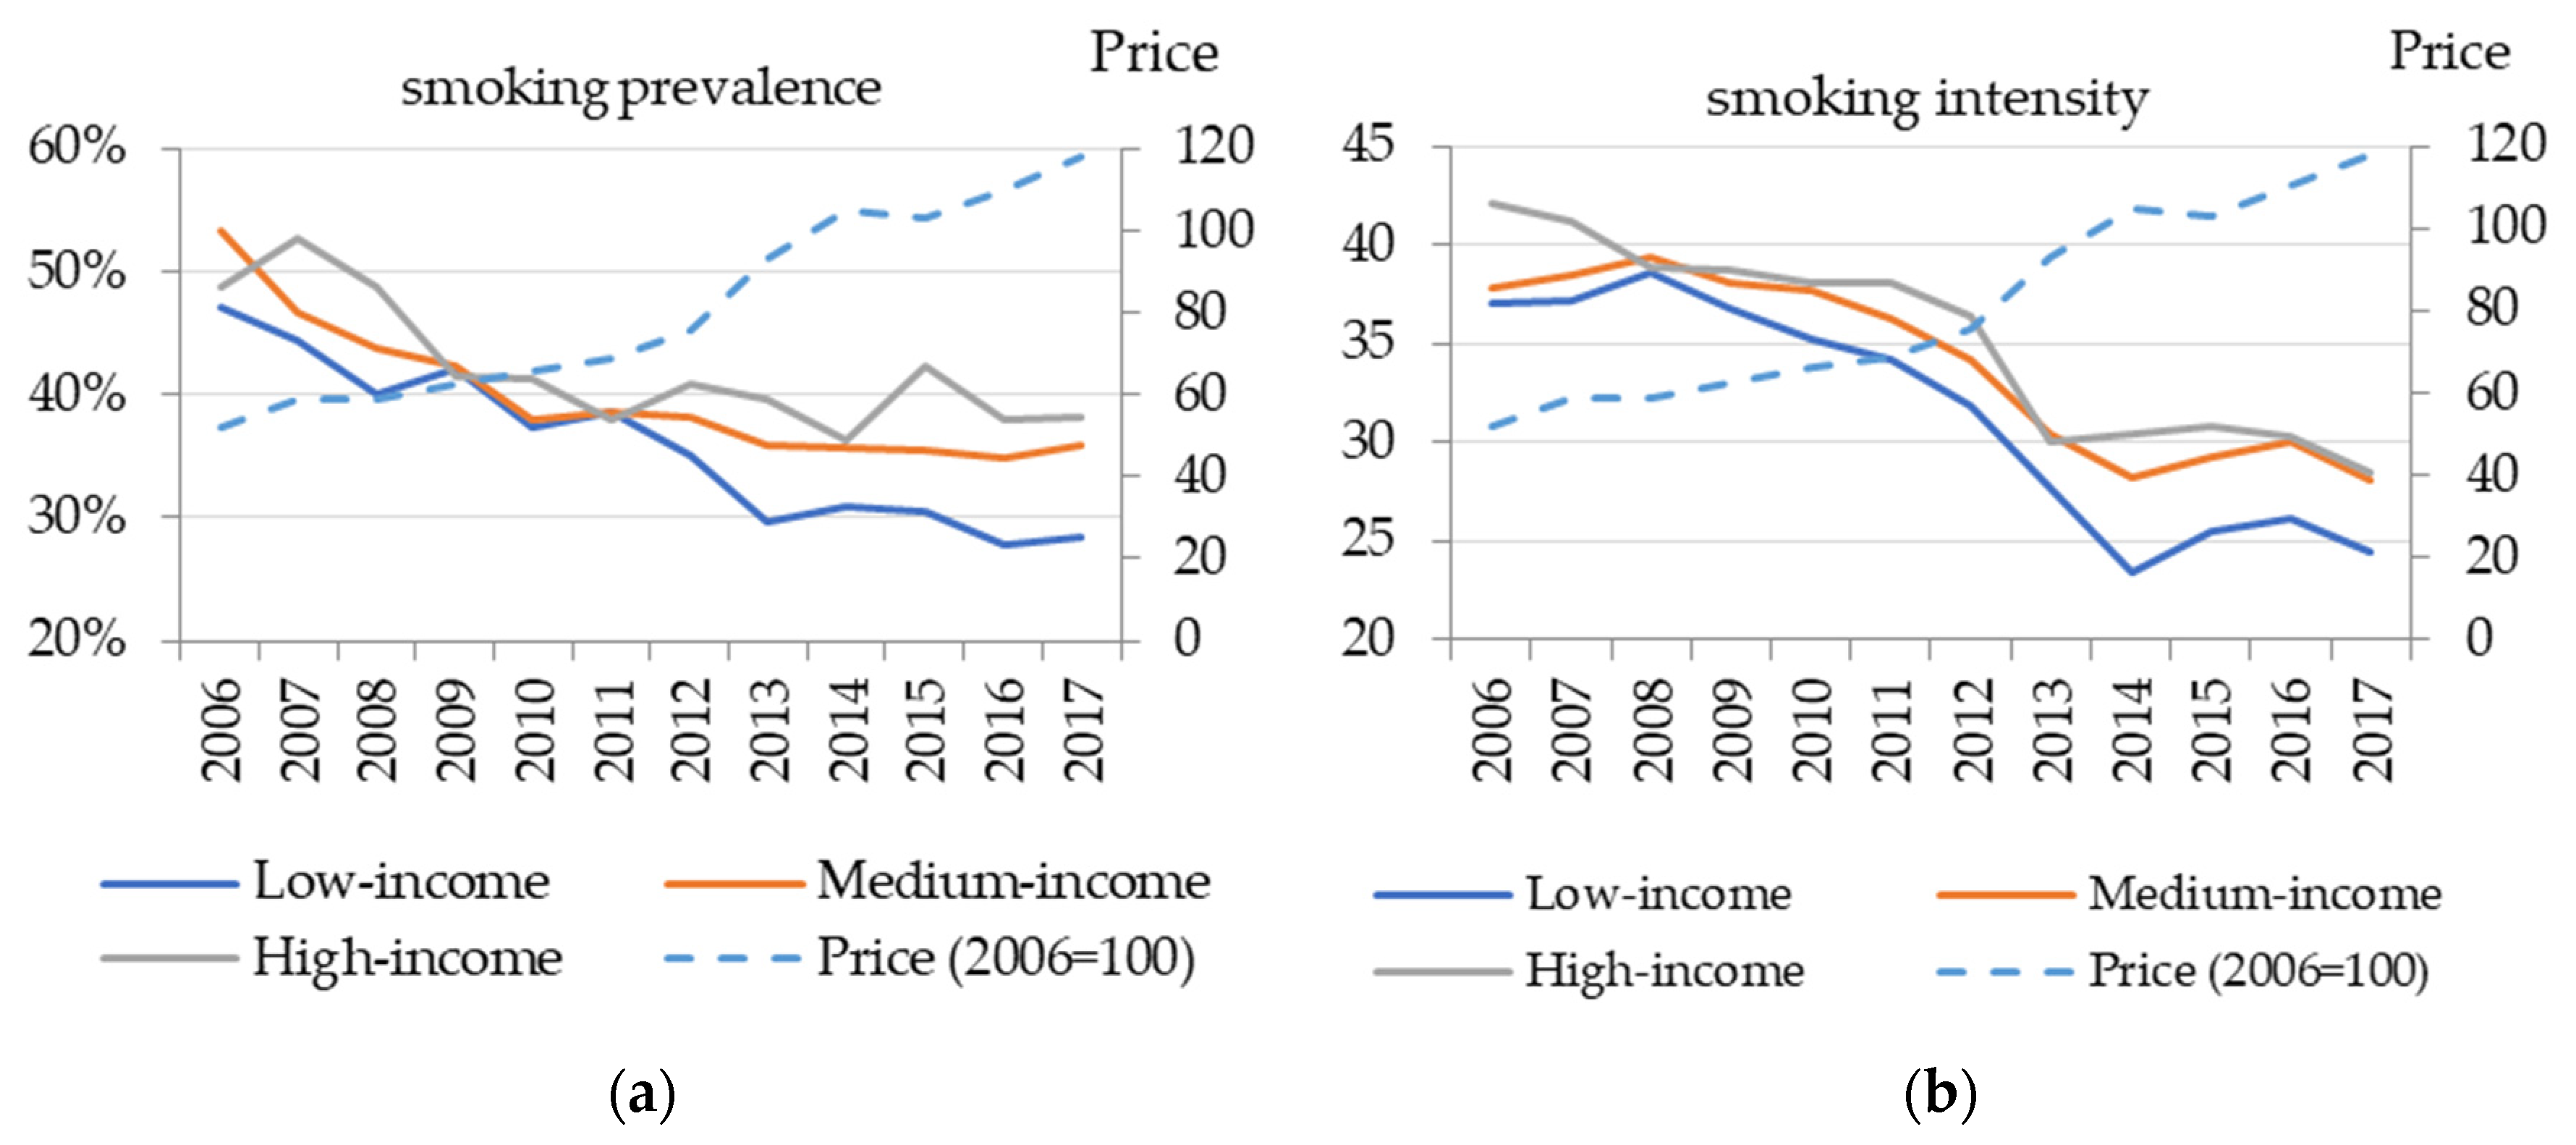
Trends by Income Groups
3.2. Econometric Methods for the Estimation of the Price Elasticity
3.2.1. Theoretical Background and Econometric Model
3.2.2. The Estimation of the Model and the Elasticities
4. Results
4.1. Estimated Elasticities
4.1.1. Overall Elasticity
4.1.2. Elasticities by Income Groups
4.2. Impact of Price Increases on Consumption and Tobacco Taxes
5. Conclusions
Author Contributions
Funding
Institutional Review Board Statement
Informed Consent Statement
Data Availability Statement
Acknowledgments
Conflicts of Interest
Appendix A

| VARIABLES | Linear Price and Income | Log Price and Income | ||
|---|---|---|---|---|
| Price | −0.005 *** | (0.001) | −0.436 *** | (0.083) |
| Income | 0.544 *** | (0.020) | 1.360 *** | (0.058) |
| Income squared | −0.033 *** | (0.002) | −0.215 *** | (0.023) |
| Household size | 0.075 *** | (0.009) | 0.072 *** | (0.009) |
| Male ratio | 0.494 *** | (0.037) | 0.490 *** | (0.038) |
| Adult ratio | 0.490 *** | (0.064) | 0.488 *** | (0.064) |
| Education: Incomplete primary | ||||
| Primary | 0.630 *** | (0.048) | 0.524 *** | (0.050) |
| Secondary (2–3 years) | 0.741 *** | (0.049) | 0.585 *** | (0.051) |
| Secondary (4 years) | 0.462 *** | (0.050) | 0.296 *** | (0.051) |
| Tertiary (2 years) | 0.208 *** | (0.056) | 0.047 | (0.057) |
| Tertiary (3+ years) | −0.079 | (0.055) | −0.225 *** | (0.056) |
| Region: Belgrade | ||||
| Vojvodina | 0.132 *** | (0.051) | 0.144 *** | (0.051) |
| West | 0.244 *** | (0.050) | 0.240 *** | (0.050) |
| East | 0.095 * | (0.055) | 0.102 * | (0.055) |
| HH Activity: Employed | ||||
| Unemployed | 0.043 | (0.049) | 0.156 *** | (0.051) |
| Pensioners | −0.629 *** | (0.027) | −0.618 *** | (0.027) |
| Self-employed | −0.184 *** | (0.030) | −0.195 *** | (0.030) |
| Advertisement ban (2010–2017 = 1) | −0.218 *** | (0.050) | −0.202 *** | (0.053) |
| Constant | −2.384 *** | (0.120) | −0.554 | (0.358) |
| Marginal effects (elasticities) | ||||
| Price | −0.269 *** | (0.051) | −0.265 *** | (0.050) |
| Income | 0.467 *** | (0.016) | 0.609 *** | (0.020) |
| Marginal effects (perc. points) 1 | ||||
| Price | −0.089 *** | (0.017) | −0.090 *** | (0.017) |
| Income | 0.167 *** | (0.005) | 0.181 *** | (0.005) |
| BIC | 73,973.5 | 73967.9 | ||
| Pseudo R square | 0.113 | 0.113 | ||
| Log likelihood | −36,876.4 | −36,879.1 | ||
| Observations | 62,051 | 62,051 | ||
| VARIABLES | Unit Value (Per Pack, ln) | Cigarettes’ Budget Share (in %) | ||
|---|---|---|---|---|
| Total expenditure (ln) | 0.114 *** | (0.003) | −0.034 *** | (0.001) |
| Household size (ln) | −0.060 *** | (0.003) | −0.003 *** | (0.001) |
| Male ratio | −0.026 *** | (0.005) | 0.019 *** | (0.001) |
| Adult ratio | −0.040 *** | (0.008) | 0.009 *** | (0.002) |
| Mean education | −0.007 *** | (0.001) | −0.001** | (0.000) |
| Maximum education | 0.001 | (0.001) | −0.001 *** | (0.000) |
| Rural Settlements | −0.023 *** | (0.003) | 0.000 | (0.001) |
| Household type—Employed | omitted | |||
| Unemployed | 0.014 ** | (0.006) | 0.007 *** | (0.002) |
| Pensioners | −0.030 *** | (0.003) | −0.006 *** | (0.001) |
| Self-employed | 0.002 | (0.004) | −0.001 | (0.001) |
| Cluster dummies | F(1671, 22,461) = 42.513 *** | F(736, 9243) = 2.954 *** | ||
| Constant | 3.198 *** | (0.030) | 0.440 *** | (0.008) |
| Observations | 24,143 | 24,143 | ||
| R-squared | 0.780 | 0.320 | ||
| VARIABLES | Linear Price and Income | Log Price and Income | ||
|---|---|---|---|---|
| Price | −0.005 *** | (0.000) | −0.450 *** | (0.031) |
| Income | 0.217 *** | (0.008) | 0.558 *** | (0.024) |
| Income squared | −0.011 *** | (0.001) | −0.059 *** | (0.009) |
| Household size | 0.039 *** | (0.003) | 0.039 *** | (0.003) |
| Male ratio | 0.186 *** | (0.016) | 0.194 *** | (0.016) |
| Adult ratio | 0.275 *** | (0.026) | 0.282 *** | (0.026) |
| Education: Incomplete primary | ||||
| Primary | 0.039 | (0.027) | −0.001 | (0.027) |
| Secondary (2–3 years) | 0.024 | (0.026) | −0.031 | (0.026) |
| Secondary (4 years) | −0.070 *** | (0.027) | −0.127 *** | (0.026) |
| Tertiary (2 years) | −0.113 *** | (0.029) | −0.169 *** | (0.029) |
| Tertiary (3+ years) | −0.182 *** | (0.030) | −0.237 *** | (0.029) |
| Region: Belgrade | ||||
| Vojvodina | 0.037 * | (0.019) | 0.030 | (0.020) |
| West | 0.073 *** | (0.019) | 0.064 *** | (0.019) |
| East | 0.145 *** | (0.019) | 0.134 *** | (0.019) |
| HH Activity: Employed | ||||
| Unemployed | 0.026 | (0.020) | 0.061 *** | (0.020) |
| Pensioners | −0.045 *** | (0.012) | −0.038 *** | (0.012) |
| Self-employed | −0.027 ** | (0.012) | −0.027 ** | (0.012) |
| Advertisement ban (2010–2017 = 1) | −0.025 | (0.017) | −0.011 | (0.017) |
| Constant | 2.853 *** | (0.049) | 4.453 *** | (0.132) |
| Marginal effects (elasticities) | ||||
| Price | −0.446 *** | (0.031) | −0.450 *** | (0.031) |
| Income | 0.391 *** | (0.011) | 0.413 *** | (0.012) |
| BIC | 218,705 | 218,647 | ||
| Log likelihood | −109,257 | −109,227 | ||
| Observations | 24,356 | 24,356 | ||
| VARIABLES | Low Income | Mid Income | High Income | |||
|---|---|---|---|---|---|---|
| Price (ln) | −0.873 *** | (0.116) | −0.433 *** | (0.116) | −0.069 | (0.115) |
| Income (ln) | 1.311 *** | (0.086) | 1.417 *** | (0.115) | 1.229 *** | (0.126) |
| Income (ln) squared | −0.062 | (0.050) | −0.185 *** | (0.069) | −0.219 *** | (0.041) |
| Household size | 0.068 *** | (0.018) | 0.051 | (0.038) | 0.075 *** | (0.021) |
| Male ratio | 0.686 *** | (0.081) | 0.706 *** | (0.070) | 0.279 *** | (0.051) |
| Adult ratio | 0.283 *** | (0.100) | 0.768 *** | (0.110) | 0.464 *** | (0.133) |
| Education: Incomplete primary | (ommited) | |||||
| Primary | 0.369 *** | (0.081) | 0.585 *** | (0.081) | 0.625 *** | (0.091) |
| Secondary (2–3 years) | 0.371 *** | (0.082) | 0.633 *** | (0.082) | 0.830 *** | (0.086) |
| Secondary (4 years) | 0.053 | (0.083) | 0.353 *** | (0.080) | 0.557 *** | (0.086) |
| Tertiary (2 years) | −0.251** | (0.098) | 0.033 | (0.093) | 0.375 *** | (0.091) |
| Tertiary (3+ years) | −0.483 *** | (0.098) | −0.159* | (0.090) | −0.007 | (0.093) |
| Region: Belgrade | (ommited) | |||||
| Vojvodina | 0.160 * | (0.086) | 0.271 *** | (0.075) | 0.033 | (0.059) |
| West | 0.083 | (0.082) | 0.362 *** | (0.074) | 0.277 *** | (0.058) |
| East | −0.090 | (0.089) | 0.263 *** | (0.080) | 0.197 *** | (0.064) |
| HH Activity: Employed | (ommited) | |||||
| Unemployed | 0.294 *** | (0.071) | 0.122 | (0.100) | −0.006 | (0.103) |
| Pensioners | −0.402 *** | (0.049) | −0.641 *** | (0.050) | −0.753 *** | (0.041) |
| Self-employed | −0.089 * | (0.049) | −0.212 *** | (0.052) | −0.272 *** | (0.051) |
| Advertisement ban (2010–2017 = 1) | −0.134 * | (0.076) | −0.214 *** | (0.077) | −0.253 *** | (0.072) |
| Constant | 1.530 *** | (0.492) | −1.119 ** | (0.515) | −1.975 *** | (0.502) |
| Marginal effects (%, elasticities) | ||||||
| Price | −0.565 *** | (0.075) | −0.261 *** | (0.070) | −0.040 | (0.066) |
| Income | 0.809 *** | (0.044) | 0.665 *** | (0.062) | 0.401 *** | (0.031) |
| Marginal effects (percentage points) | ||||||
| Price | −0.163 *** | (0.022) | −0.087 *** | (0.024) | −0.018 | (0.025) |
| Income | 0.232 *** | (0.013) | 0.204 *** | (0.025) | 0.135 *** | (0.011) |
| Observations | 20,687 | 20,684 | 20,680 | |||
| Low-Income Hh | Mid-Income hh | High-Income Hhs | ||||
|---|---|---|---|---|---|---|
| VARIABLES | Unit Value | Budget Share | Unit Value | Budget Share | Unit Value | Budget Share |
| Total expenditure (ln) | 0.104 *** | −0.031 *** | 0.112 *** | −0.023 *** | 0.110 *** | −0.037 *** |
| (0.008) | (0.003) | (0.017) | (0.005) | (0.008) | (0.002) | |
| Household size (ln) | −0.057 *** | −0.007 ** | −0.052 *** | −0.015 *** | −0.060 *** | 0.001 |
| (0.009) | (0.003) | (0.018) | (0.005) | (0.009) | (0.002) | |
| Male ratio | −0.020 * | 0.021 *** | −0.024 ** | 0.020 *** | −0.027 *** | 0.017 *** |
| (0.010) | (0.004) | (0.010) | (0.003) | (0.008) | (0.002) | |
| Adult ratio | −0.019 | 0.007 | −0.048 *** | 0.005 | −0.068 *** | 0.014 *** |
| (0.012) | (0.004) | (0.014) | (0.004) | (0.018) | (0.004) | |
| Mean education | 0.005 *** | −0.002 *** | 0.002 | −0.001* | 0.013 *** | 0.001 |
| (0.002) | (0.001) | (0.002) | (0.001) | (0.002) | (0.001) | |
| Maximum education | 0.001 | −0.000 | 0.003 | −0.001** | −0.002 | −0.001 *** |
| (0.002) | (0.001) | (0.002) | (0.000) | (0.002) | (0.000) | |
| Rural Settlements | 0.014 *** | −0.001 | 0.026 *** | 0.002 | 0.025 *** | 0.000 |
| (0.005) | (0.002) | (0.005) | (0.002) | (0.006) | (0.001) | |
| Household type—Employed | Omitted | Omitted | Omitted | |||
| Unemployed | 0.013 | 0.009 *** | 0.002 | 0.012 *** | 0.019 | −0.002 |
| (0.009) | (0.003) | (0.013) | (0.004) | (0.014) | (0.003) | |
| Pensioners | −0.012 * | −0.005 ** | −0.025 *** | −0.003* | −0.044 *** | −0.010 *** |
| (0.006) | (0.002) | (0.006) | (0.002) | (0.006) | (0.001) | |
| Self-employed | −0.001 | −0.002 | −0.003 | −0.001 | 0.009 | −0.001 |
| (0.006) | (0.002) | (0.007) | (0.002) | (0.008) | (0.002) | |
| Constant | 4.199 *** | 0.136 *** | 4.250 *** | 0.131 *** | 4.234 *** | 0.111 *** |
| (0.020) | (0.007) | (0.021) | (0.006) | (0.024) | (0.005) | |
| Number of clusters | 1476 | 1476 | 1514 | 1514 | 1384 | 1384 |
| Cluster effect F = | 22.101 *** | 1.625 *** | 16.471 *** | 1.783 *** | 13.988 *** | 1.993 *** |
| Observations | 7265 | 7265 | 8186 | 8186 | 8692 | 8692 |
| R-squared | 0.860 | 0.373 | 0.810 | 0.404 | 0.743 | 0.417 |
| VARIABLES | Low-Income | Mid-Income | High-Income | |||
|---|---|---|---|---|---|---|
| Price | −0.605 *** | (0.044) | −0.441 *** | (0.042) | −0.348 *** | (0.043) |
| Income | 0.562 *** | (0.037) | 0.472 *** | (0.051) | 0.514 *** | (0.055) |
| Income squared | 0.003 | (0.021) | 0.002 | (0.029) | −0.073 *** | (0.018) |
| Household size | 0.024 *** | (0.007) | 0.019 | (0.015) | 0.056 *** | (0.009) |
| Male ratio | 0.194 *** | (0.036) | 0.165 *** | (0.031) | 0.204 *** | (0.022) |
| Adult ratio | 0.178 *** | (0.041) | 0.271 *** | (0.042) | 0.414 *** | (0.053) |
| Education: Incomplete primary | ||||||
| Primary | −0.032 | (0.040) | 0.035 | (0.040) | 0.007 | (0.057) |
| Secondary (2–3 years) | −0.092 ** | (0.040) | 0.021 | (0.039) | 0.025 | (0.055) |
| Secondary (4 years) | −0.179 *** | (0.041) | −0.098 ** | (0.039) | −0.063 | (0.055) |
| Tertiary (2 years) | −0.205 *** | (0.049) | −0.144 *** | (0.043) | −0.111 * | (0.059) |
| Tertiary (3+ years) | −0.312 *** | (0.050) | −0.196 *** | (0.043) | −0.176 *** | (0.058) |
| Region: Belgrade | ||||||
| Vojvodina | −0.059 * | (0.032) | 0.036 | (0.027) | 0.063 *** | (0.024) |
| West | 0.027 | (0.031) | 0.054 ** | (0.026) | 0.078 *** | (0.024) |
| East | 0.084 *** | (0.032) | 0.139 *** | (0.027) | 0.148 *** | (0.025) |
| HH Activity: Employed | ||||||
| Unemployed | 0.118 *** | (0.031) | 0.096 ** | (0.038) | −0.055 | (0.038) |
| Pensioners | 0.010 | (0.022) | −0.020 | (0.021) | −0.098 *** | (0.020) |
| Self-employed | −0.006 | (0.020) | −0.029 | (0.019) | −0.038 * | (0.021) |
| Advertisement ban (2010–2017 = 1) | −0.025 | (0.027) | 0.003 | (0.026) | −0.016 | (0.026) |
| Constant | 5.284 *** | (0.195) | 4.462 *** | (0.186) | 3.881 *** | (0.194) |
| Marginal effects (elasticities) | ||||||
| Price | −0.605 *** | (0.044) | −0.441 *** | (0.042) | −0.348 *** | (0.043) |
| Income | 0.562 *** | (0.037) | 0.472 *** | (0.051) | 0.514 *** | (0.055) |
| Observations | 7309 | 8220 | 8827 | |||
| 2017 | 2018 | Change | |
|---|---|---|---|
| Retail Price (Weighted average price—WAP) | 1.87 | 2.34 | 25% |
| Excise (specific) | 0.53 | 0.77 | 44.1% |
| Excise (ad valorem, 33% of WAP) | 0.62 | 0.77 | 25.0% |
| Total excise | 1.15 | 1.54 | 33.9% |
| VAT | 0.31 | 0.39 | 25.0% |
| Total Tax | 1.46 | 1.93 | 32.0% |
| Net-of-tax price | 0.41 | 0.41 | 0.0% |
Appendix B
Appendix C
| Baseline | Price Increases by 1% | % Change | ||
|---|---|---|---|---|
| Total population | 1 | 10,000,000 | 10,000,000 | |
| Prevalence | 2 | 40.0% | 39.88% | −0.30% |
| Consumption per person (in cigarettes) | 3 | 25 | 24.875 | −0.50% |
| Number of people smoking | 4 = 1 × 2 | 4,000,000 | 3,988,000 | −0.30% |
| Total consumption | 5 = 4 × 3 | 100,000,000 | 99,201,500 | −0.7985% |
References
- Institute of Public Health of Serbia “Batut”. Research on Effects and Attitudes Related to the Law on the Protection of the Population against Tobacco Smoke–Comparison of Results 2010–2019; Institute of Public Health of Serbia “Batut”: Belgrade, Serbia, 2020. [Google Scholar]
- EUROSTAT. Available online: https://ec.europa.eu/eurostat/statisticsexplained/index.php/Tobacco_consumption_statistics (accessed on 15 February 2021).
- Vladisavljević, M.; Zubović, J.; Jovanović, O.; Đukić, M.; Jolović, N. How Do Prices of Manufactured Cigarettes and Roll-Your-Own Tobacco Affect Demand for These Products? Tobacco Price Elasticity in Southeastern Europe; Institute of Economic Sciences: Belgrade, Serbia, 2020. [Google Scholar]
- U.S. National Cancer Institute and World Health Organization. The Economics of Tobacco and Tobacco Control. National Cancer Institute Tobacco Control Monograph 21; NIH Publication No. 16-CA-8029A; U.S. Department of Health and Human Services, National Institutes of Health, National Cancer Institute: Bethesda, MD, USA; World Health Organization: Geneva, Switzerland, 2016. Available online: https://cancercontrol.cancer.gov/sites/default/files/2020-06/m21_complete.pdf (accessed on 27 August 2021).
- European Commission. EC Excise Duty Tables. Part III—Manufactured Tobacco (Shows the Situation as of 01/07/2018). Brussels-Belgium-Office: SPA3 6/70. 2018. Available online: https://ec.europa.eu/taxation_customs/sites/taxation/files/resources/documents/taxation/excise_duties/tobacco_products/rates/excise_duties-part_iii_tobacco_en.pdf (accessed on 18 January 2019).
- European Commission. Directive 2014/40/EU of the European Parliament and of the Council of 3 April 2014 on the approximation of the laws, regulations and administrative provisions of the Member States concerning the manufacture, presentation and sale of tobacco and related products and repealing Directive 2001/37/EC. Off. J. Eur. Union 2014, 127, 1–38. [Google Scholar]
- Vladisavljevic, M.; Zubović, J.; Đukić, M.; Jovanović, O. Tobacco price elasticity in Serbia: Evidence from a middle-income country with high prevalence and low tobacco prices. Tob. Control 2020, 29 (Suppl. 5), s331–s336. [Google Scholar] [CrossRef] [PubMed]
- Belotti, F.; Partha, D.; Manning, W.G.; Norton, E.C. Twopm: Two-Part Models. Stata J. 2015, 15, 3–20. [Google Scholar] [CrossRef] [Green Version]
- Deaton, A. The Analysis of Household Surveys: A Microeconometric Approach to Development Policy; Johns Hopkins University Press: Baltimore, MD, USA, 1997. [Google Scholar]
- World Health Organization; Ciapponi, A. Systematic Review of the Link between Tobacco and Poverty; World Health Organization: Geneva, Switzerland, 2018; pp. 1–414. Available online: https://apps.who.int/iris/handle/10665/136001 (accessed on 10 May 2019).
- Remler, D.K. Poor smokers, poor quitters, and cigarette tax regressivity. Am. J. Public Health 2004, 94, 225–229. [Google Scholar] [CrossRef] [PubMed]
- Warner, K.E. The economics of tobacco: Myths and realities. Tob. Control 2000, 9, 78–89. [Google Scholar] [CrossRef] [PubMed] [Green Version]
- Townsend, J.L.; Roderick, P.; Cooper, J. Cigarette smoking by socioeconomic group, sex, and age: Effects of price, income, and health publicity. BMJ 1994, 309, 923–926. [Google Scholar] [CrossRef] [PubMed] [Green Version]
- Farrelly, M.C.; Bray, J.W.; Office on Smoking and Health. Response to increases in cigarette prices by race/ethnicity, income, and age groups—United States, 1976–1993. MMWR Morb. Mortal. Wkly. Rep. 1998, 47, 605–609. [Google Scholar]
- Chaloupka, F.J. Rational addictive behavior and cigarette smoking. J. Political Econ. 1991, 99, 722–742. [Google Scholar] [CrossRef]
- Nargis, N.; Rutbah, U.; Ghulam Hussein, A.K.M.; Fong, G.T.; Huq, I.; Ashiquzzaman, S.M. The price sensitivity of cigarette consumption in Bangladesh: Evidence from the International Tobacco Control (ITC) Bangladesh Wave 1 (2009) and Wave 2 (2010) surveys. Tob. Control 2014, 23 (Suppl. 1), 39–47. [Google Scholar] [CrossRef] [PubMed]
- Mao, Z.; Sung, H.-Y.; Hu, T.; Yang, G. The demand for cigarettes in China. In Series on Contemporary China: Volume 12. Tobacco Control Policy Analysis in China; Hu, T.-W., Ed.; World Scientific Publishing Co. Pte. Ltd.: Singapore, 2008; pp. 129–157. [Google Scholar] [CrossRef]
- Adioetomo, S.M.; Djutaharta, T.; Hendratno. Cigarette Consumption, Taxation and Household Income: Indonesia Case Study. HNP Discussion Paper: Economics of Tobacco Control Paper no 28. 2005. World Bank. Available online: https://openknowledge.worldbank.org/handle/10986/13737 (accessed on 10 May 2021).
- Van Kinh, H.; Ross, H.; Levy, D.; Minh, N.T.; Ngoc, V.T. The effects of imposing a higher, uniform tobacco tax in Vietnam. Health Res. Policy Syst. 2006, 4, 6. [Google Scholar] [CrossRef] [PubMed] [Green Version]
- Choi, S.E. Are Lower-income smokers more price-sensitive? The evidence from Korean cigarette tax increases. Tob. Control 2006, 25, 141–146. [Google Scholar] [CrossRef] [PubMed]
- World Health Organization. WHO Report on the Global Tobacco Epidemic, 2017: Monitoring Tobacco Use and Prevention Policies; World Health Organization: Geneva, Switzerland, 2017; pp. 1–135. Available online: https://apps.who.int/iris/handle/10665/255874 (accessed on 10 May 2021).
- Deaton, A. Quality, quantity, and spatial variation of price. Am. Econ. Rev. 1988, 78, 418–430. [Google Scholar]
- Kostova, D.; Dave, D. Smokeless tobacco use in India: Role of prices and advertising. Soc. Sci. Med. 2015, 138, 82–90. [Google Scholar] [CrossRef]
- Huang, J.; Gwarnicki, C.; Xu, X.; Caraballo, R.S.; Wada, R.; Chaloupka, F.J. A comprehensive examination of own-and cross-price elasticities of tobacco and nicotine replacement products in the US. Prev. Med. 2018, 117, 107–114. [Google Scholar] [CrossRef]
- John, R. Crowding out effect of tobacco expenditure and its implications on household resource allocation in India. Soc. Sci. Med. 2008, 66, 1356–1367. [Google Scholar] [CrossRef] [PubMed]
- Manning, W.G.; Mullahy, J. Estimating Log Models: To Transform or Not to Transform? J. Health Econ. 2001, 20, 461–494. [Google Scholar] [CrossRef] [Green Version]

| Year | Smoking Prevalence (% of Households) | The Average Number of Cigarettes Smoked (Packs Per Household) 1 | Average Real Household Expenditure on Cigarettes (in RSD) 1,2 | Average Real Price (in RSD) 1,2,3 |
|---|---|---|---|---|
| 2006 | 49.7 | 39.1 | 1988 | 51.9 |
| 2007 | 47.9 | 39.2 | 2279 | 58.7 |
| 2008 | 44.1 | 39.0 | 2268 | 58.9 |
| 2009 | 42.0 | 37.9 | 2353 | 62.7 |
| 2010 | 38.8 | 37.0 | 2442 | 65.9 |
| 2011 | 38.4 | 36.2 | 2487 | 68.7 |
| 2012 | 38.0 | 34.3 | 2609 | 75.8 |
| 2013 | 35.1 | 29.6 | 2758 | 93.0 |
| 2014 | 34.4 | 27.7 | 2922 | 104.9 |
| 2015 | 36.3 | 28.9 | 2985 | 103.2 |
| 2016 | 33.7 | 29.1 | 3219 | 110.2 |
| 2017 | 34.2 | 27.2 | 3241 | 117.8 |
| All Households 1 | Low-Income Households 2 | Middle-Income Households 2 | High-Income Households 2 | |||||
|---|---|---|---|---|---|---|---|---|
| Prevalence elasticities (logit model) 3 | ||||||||
| Price | −0.265 *** | (0.050) | −0.565 *** | (0.075) | −0.261 *** | (0.070) | −0.040 | (0.066) |
| Income | 0.609 *** | (0.020) | 0.809 *** | (0.044) | 0.665 *** | (0.062) | 0.401 *** | (0.031) |
| Conditional demand (intensity) elasticity (Deaton’s model) | ||||||||
| Price | −0.395 *** | (0.053) | −0.514 *** | (0.067) | −0.371 *** | (0.065) | −0.220 *** | (0.041) |
| Income | 0.447 *** | (0.011) | 0.550 *** | (0.037) | 0.598 *** | (0.065) | 0.338 *** | (0.025) |
| Total elasticity 4 | ||||||||
| Price | −0.659 | −1.076 | −0.631 | −0.220 | ||||
| Income | 1.058 | 1.363 | 1.267 | 0.740 | ||||
| Income Group | Consumption | Spending on Cigarettes | Government Revenue | ||||||
|---|---|---|---|---|---|---|---|---|---|
| 2017 1 | 2018 1,* | Change | 2017 2 | 2018 2,* | Change | 2017 2 | 2018 2,* | Change | |
| 1 | 2 | 3 | 4 | 5 | 6 | 7 | 8 | 9 | |
| Low | 162.0 | 127.0 | −21.6% | 302.9 | 296.9 | −2.0% | 236.3 | 244.7 | 3.5% |
| Middle | 238.4 | 210.1 | −11.8% | 445.8 | 491.2 | 10.2% | 347.7 | 404.8 | 16.4% |
| High | 271.0 | 260.1 | −4.0% | 506.8 | 608.0 | 20.0% | 395.3 | 501.0 | 26.7% |
| Total | 671.4 | 597.3 | −11.0% | 1255.4 | 1396.1 | 11.2% | 979.3 | 1150.5 | 17.4% |
Publisher’s Note: MDPI stays neutral with regard to jurisdictional claims in published maps and institutional affiliations. |
© 2021 by the authors. Licensee MDPI, Basel, Switzerland. This article is an open access article distributed under the terms and conditions of the Creative Commons Attribution (CC BY) license (https://creativecommons.org/licenses/by/4.0/).
Share and Cite
Vladisavljević, M.; Zubović, J.; Đukić, M.; Jovanović, O. Inequality-Reducing Effects of Tobacco Tax Increase: Accounting for Behavioral Response of Low-, Middle-, and High-Income Households in Serbia. Int. J. Environ. Res. Public Health 2021, 18, 9494. https://doi.org/10.3390/ijerph18189494
Vladisavljević M, Zubović J, Đukić M, Jovanović O. Inequality-Reducing Effects of Tobacco Tax Increase: Accounting for Behavioral Response of Low-, Middle-, and High-Income Households in Serbia. International Journal of Environmental Research and Public Health. 2021; 18(18):9494. https://doi.org/10.3390/ijerph18189494
Chicago/Turabian StyleVladisavljević, Marko, Jovan Zubović, Mihajlo Đukić, and Olivera Jovanović. 2021. "Inequality-Reducing Effects of Tobacco Tax Increase: Accounting for Behavioral Response of Low-, Middle-, and High-Income Households in Serbia" International Journal of Environmental Research and Public Health 18, no. 18: 9494. https://doi.org/10.3390/ijerph18189494
APA StyleVladisavljević, M., Zubović, J., Đukić, M., & Jovanović, O. (2021). Inequality-Reducing Effects of Tobacco Tax Increase: Accounting for Behavioral Response of Low-, Middle-, and High-Income Households in Serbia. International Journal of Environmental Research and Public Health, 18(18), 9494. https://doi.org/10.3390/ijerph18189494