
Assessment of Future Water Yield and Water Purification Services in Data Scarce Region of Northwest China


Abstract
:1. Introduction
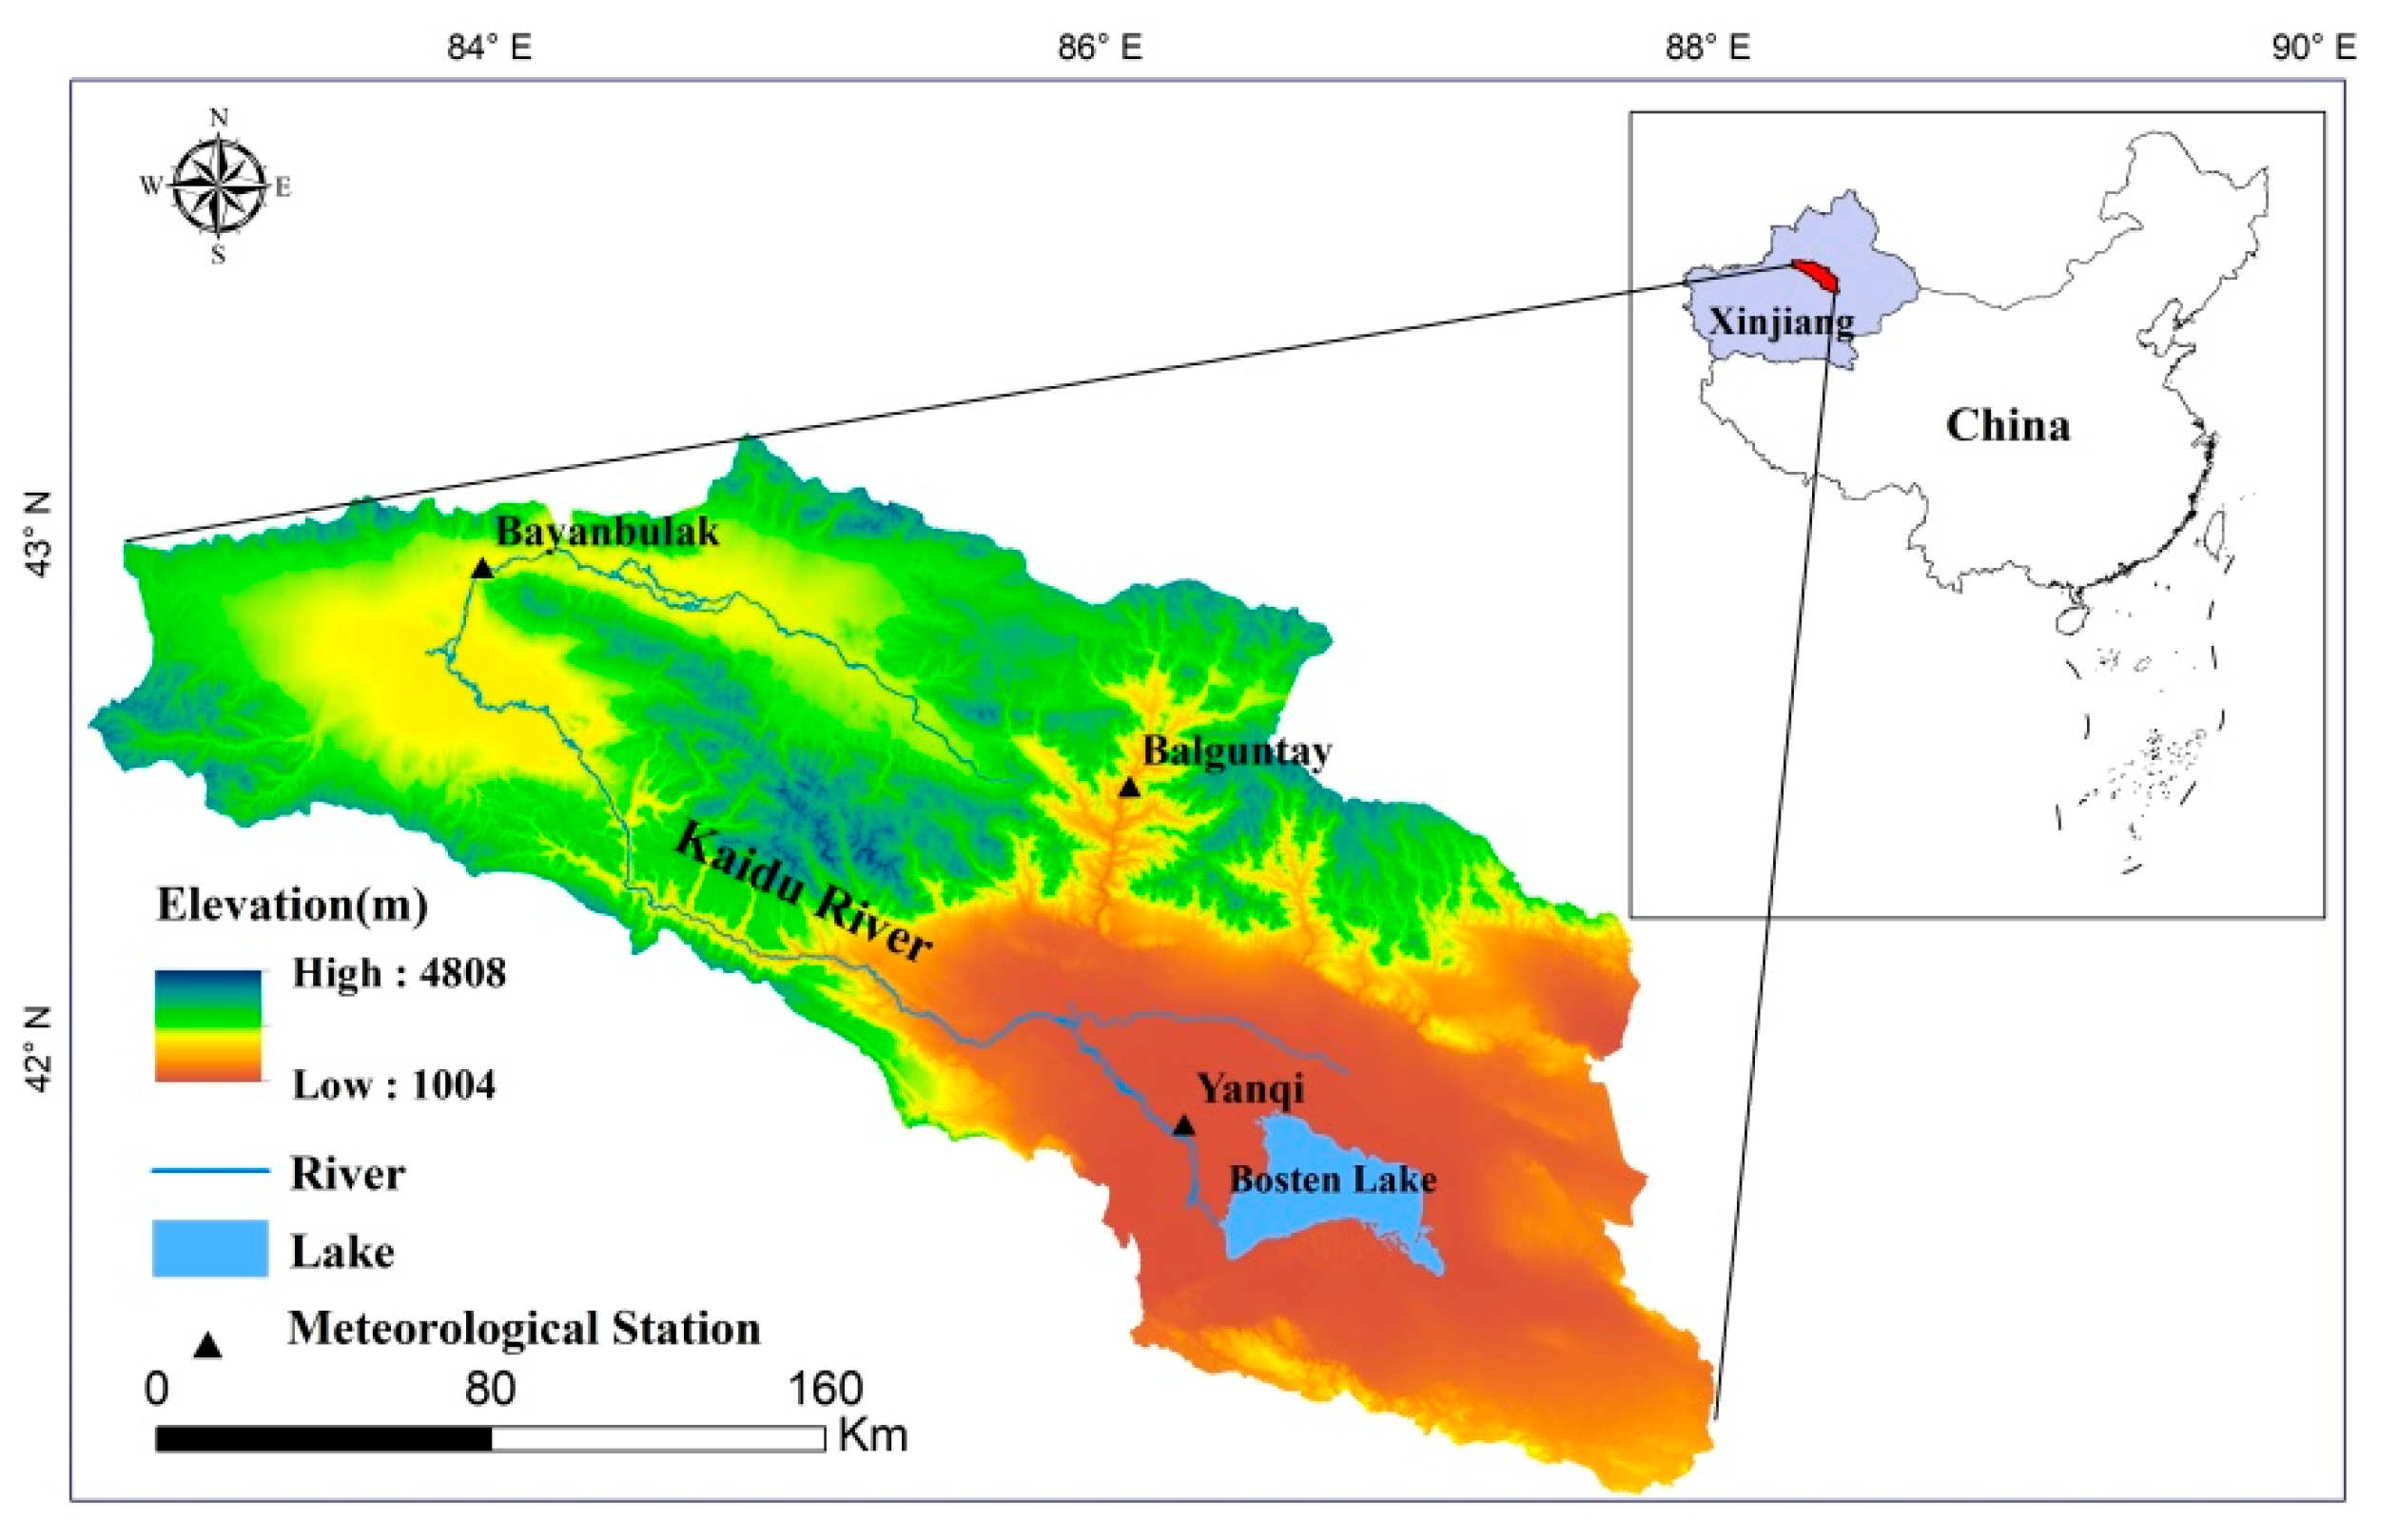
2. Study Region
3. Materials and Methods
3.1. Data Source and Pretreatment
3.2. Research Methods
4. Results
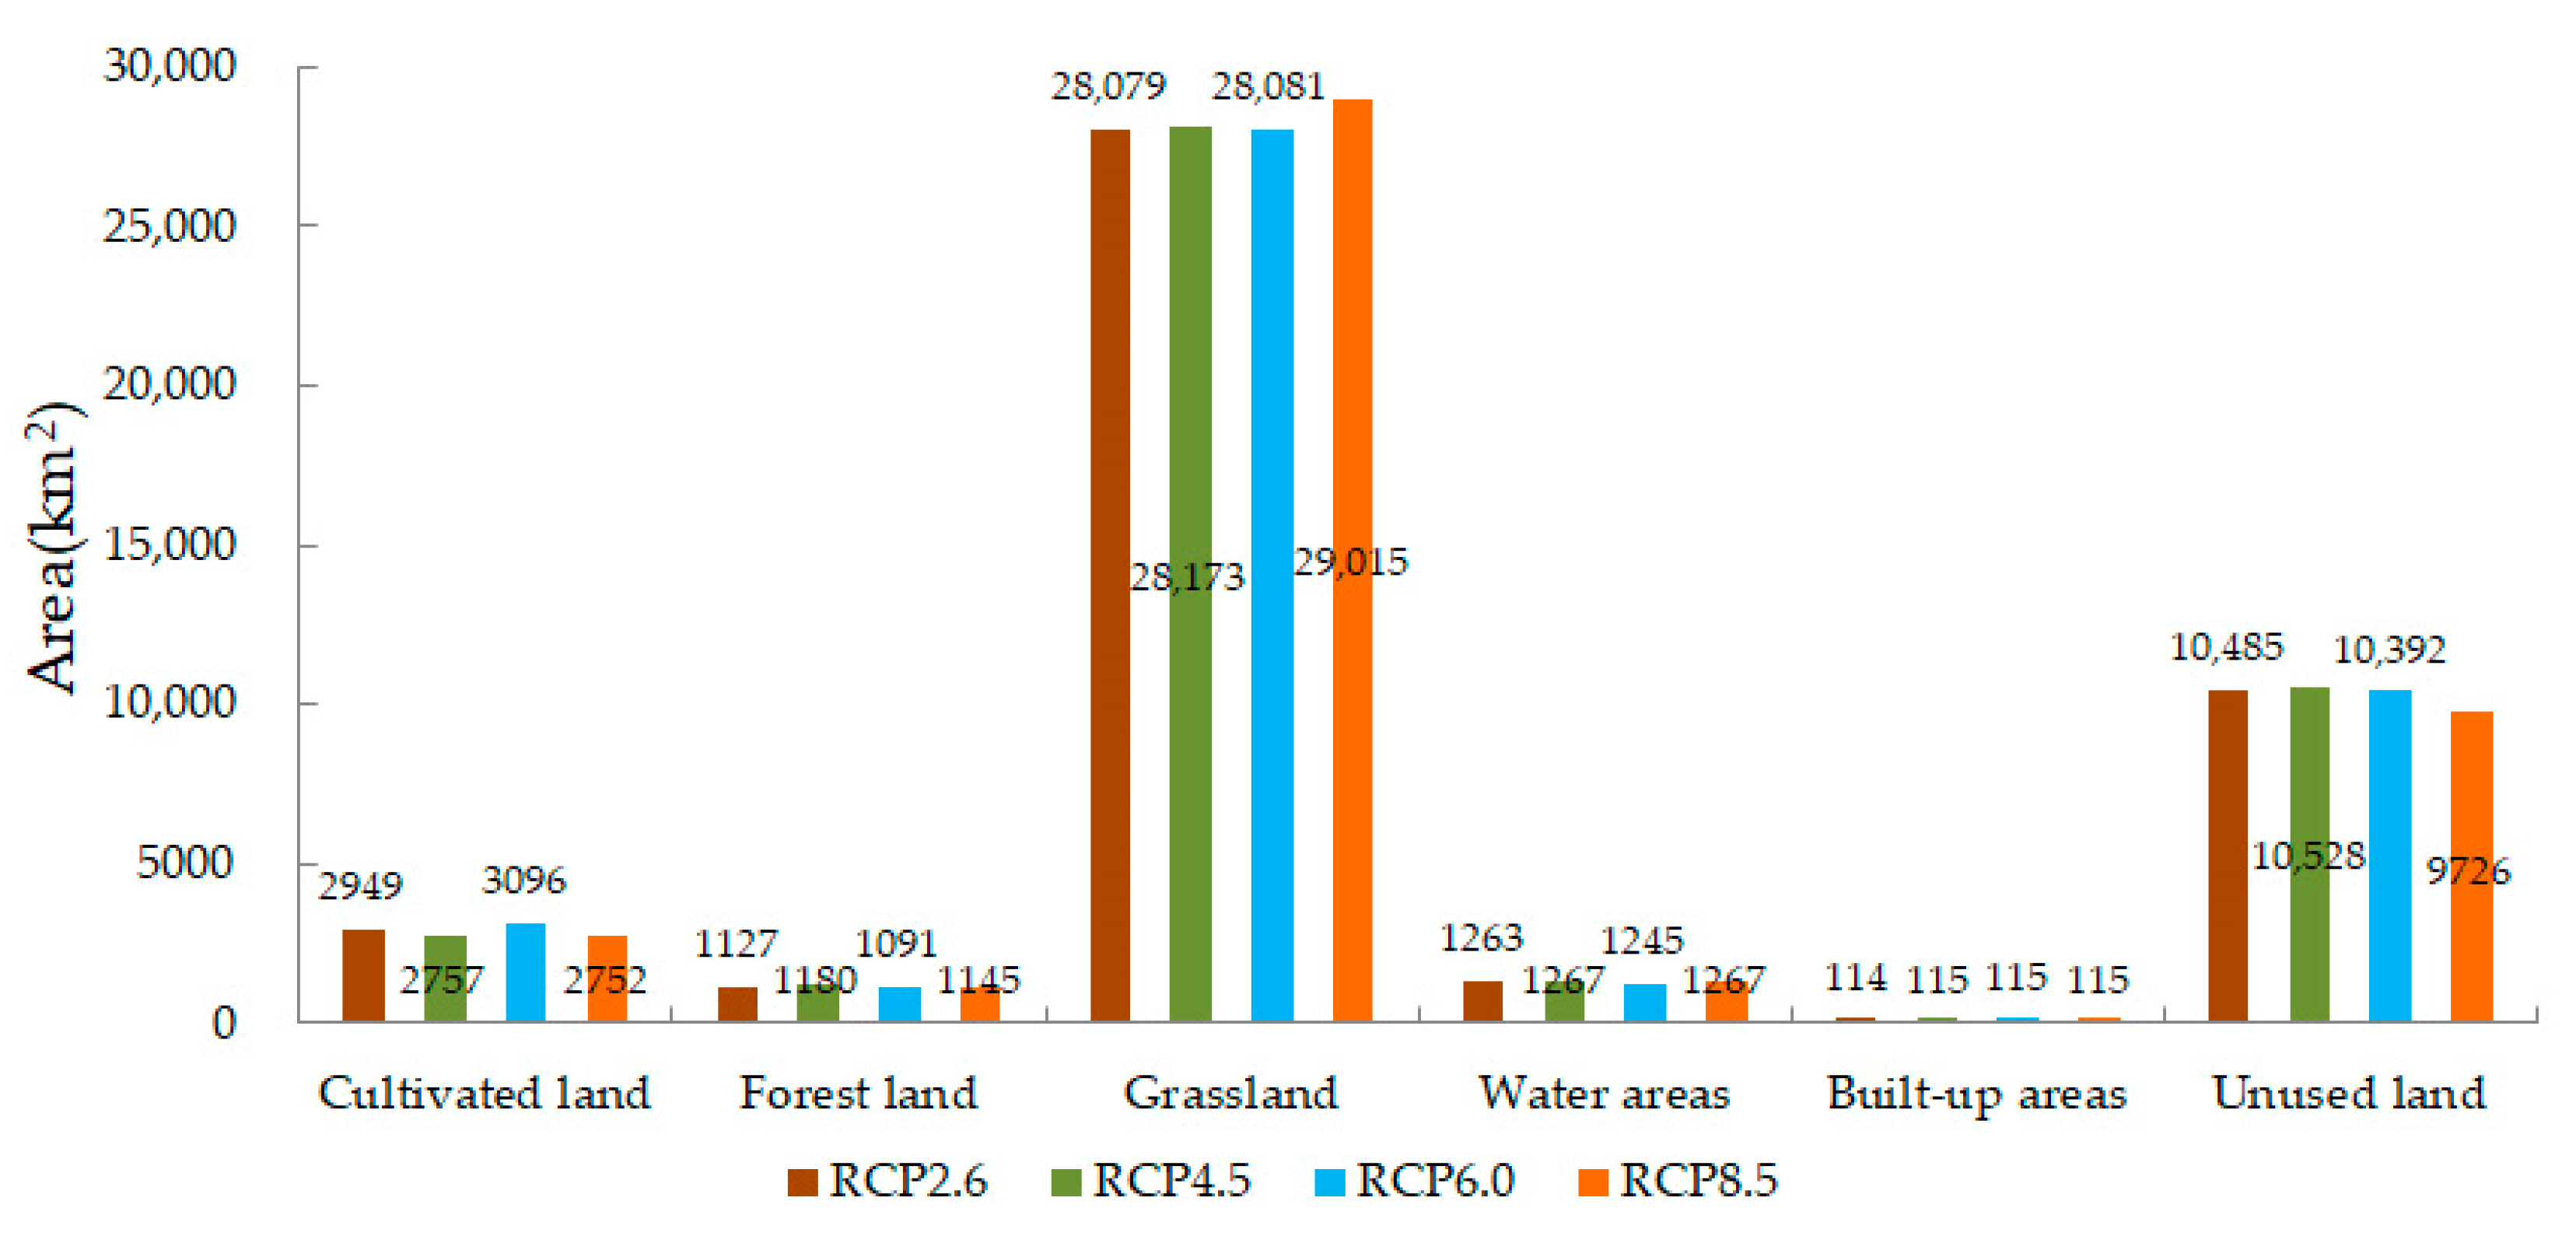
4.1. Distribution of Land Use in 2050 for the RCP Scenarios
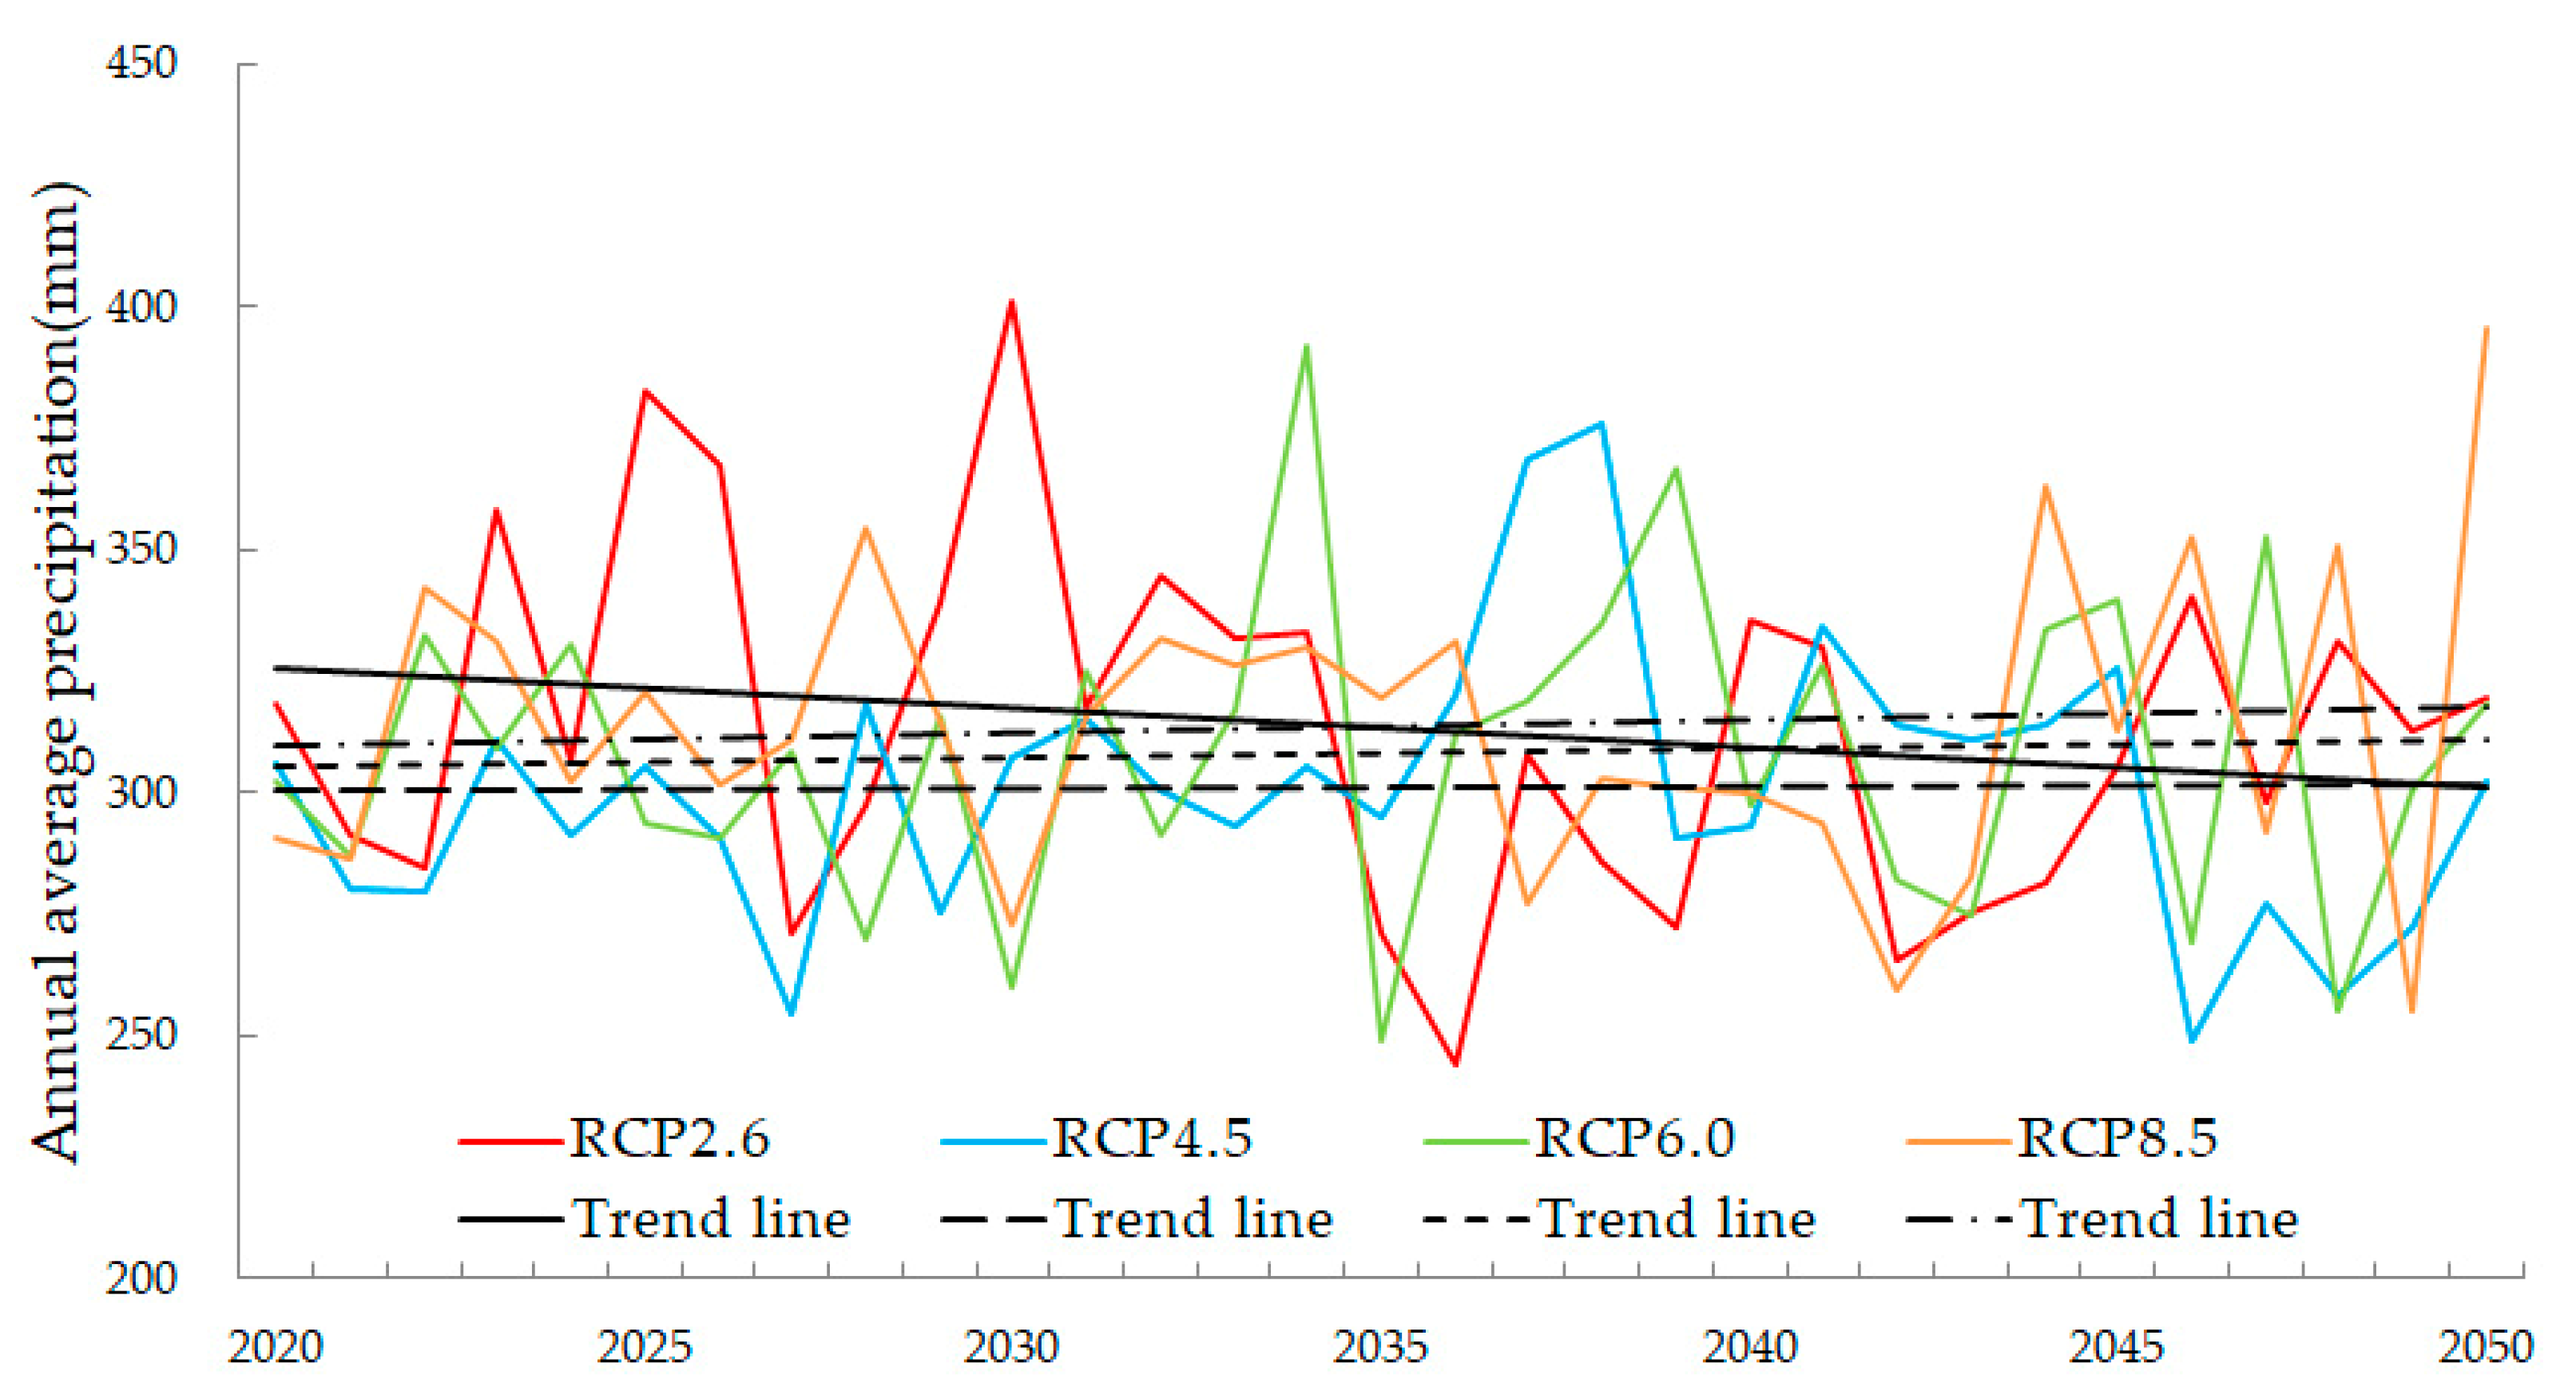
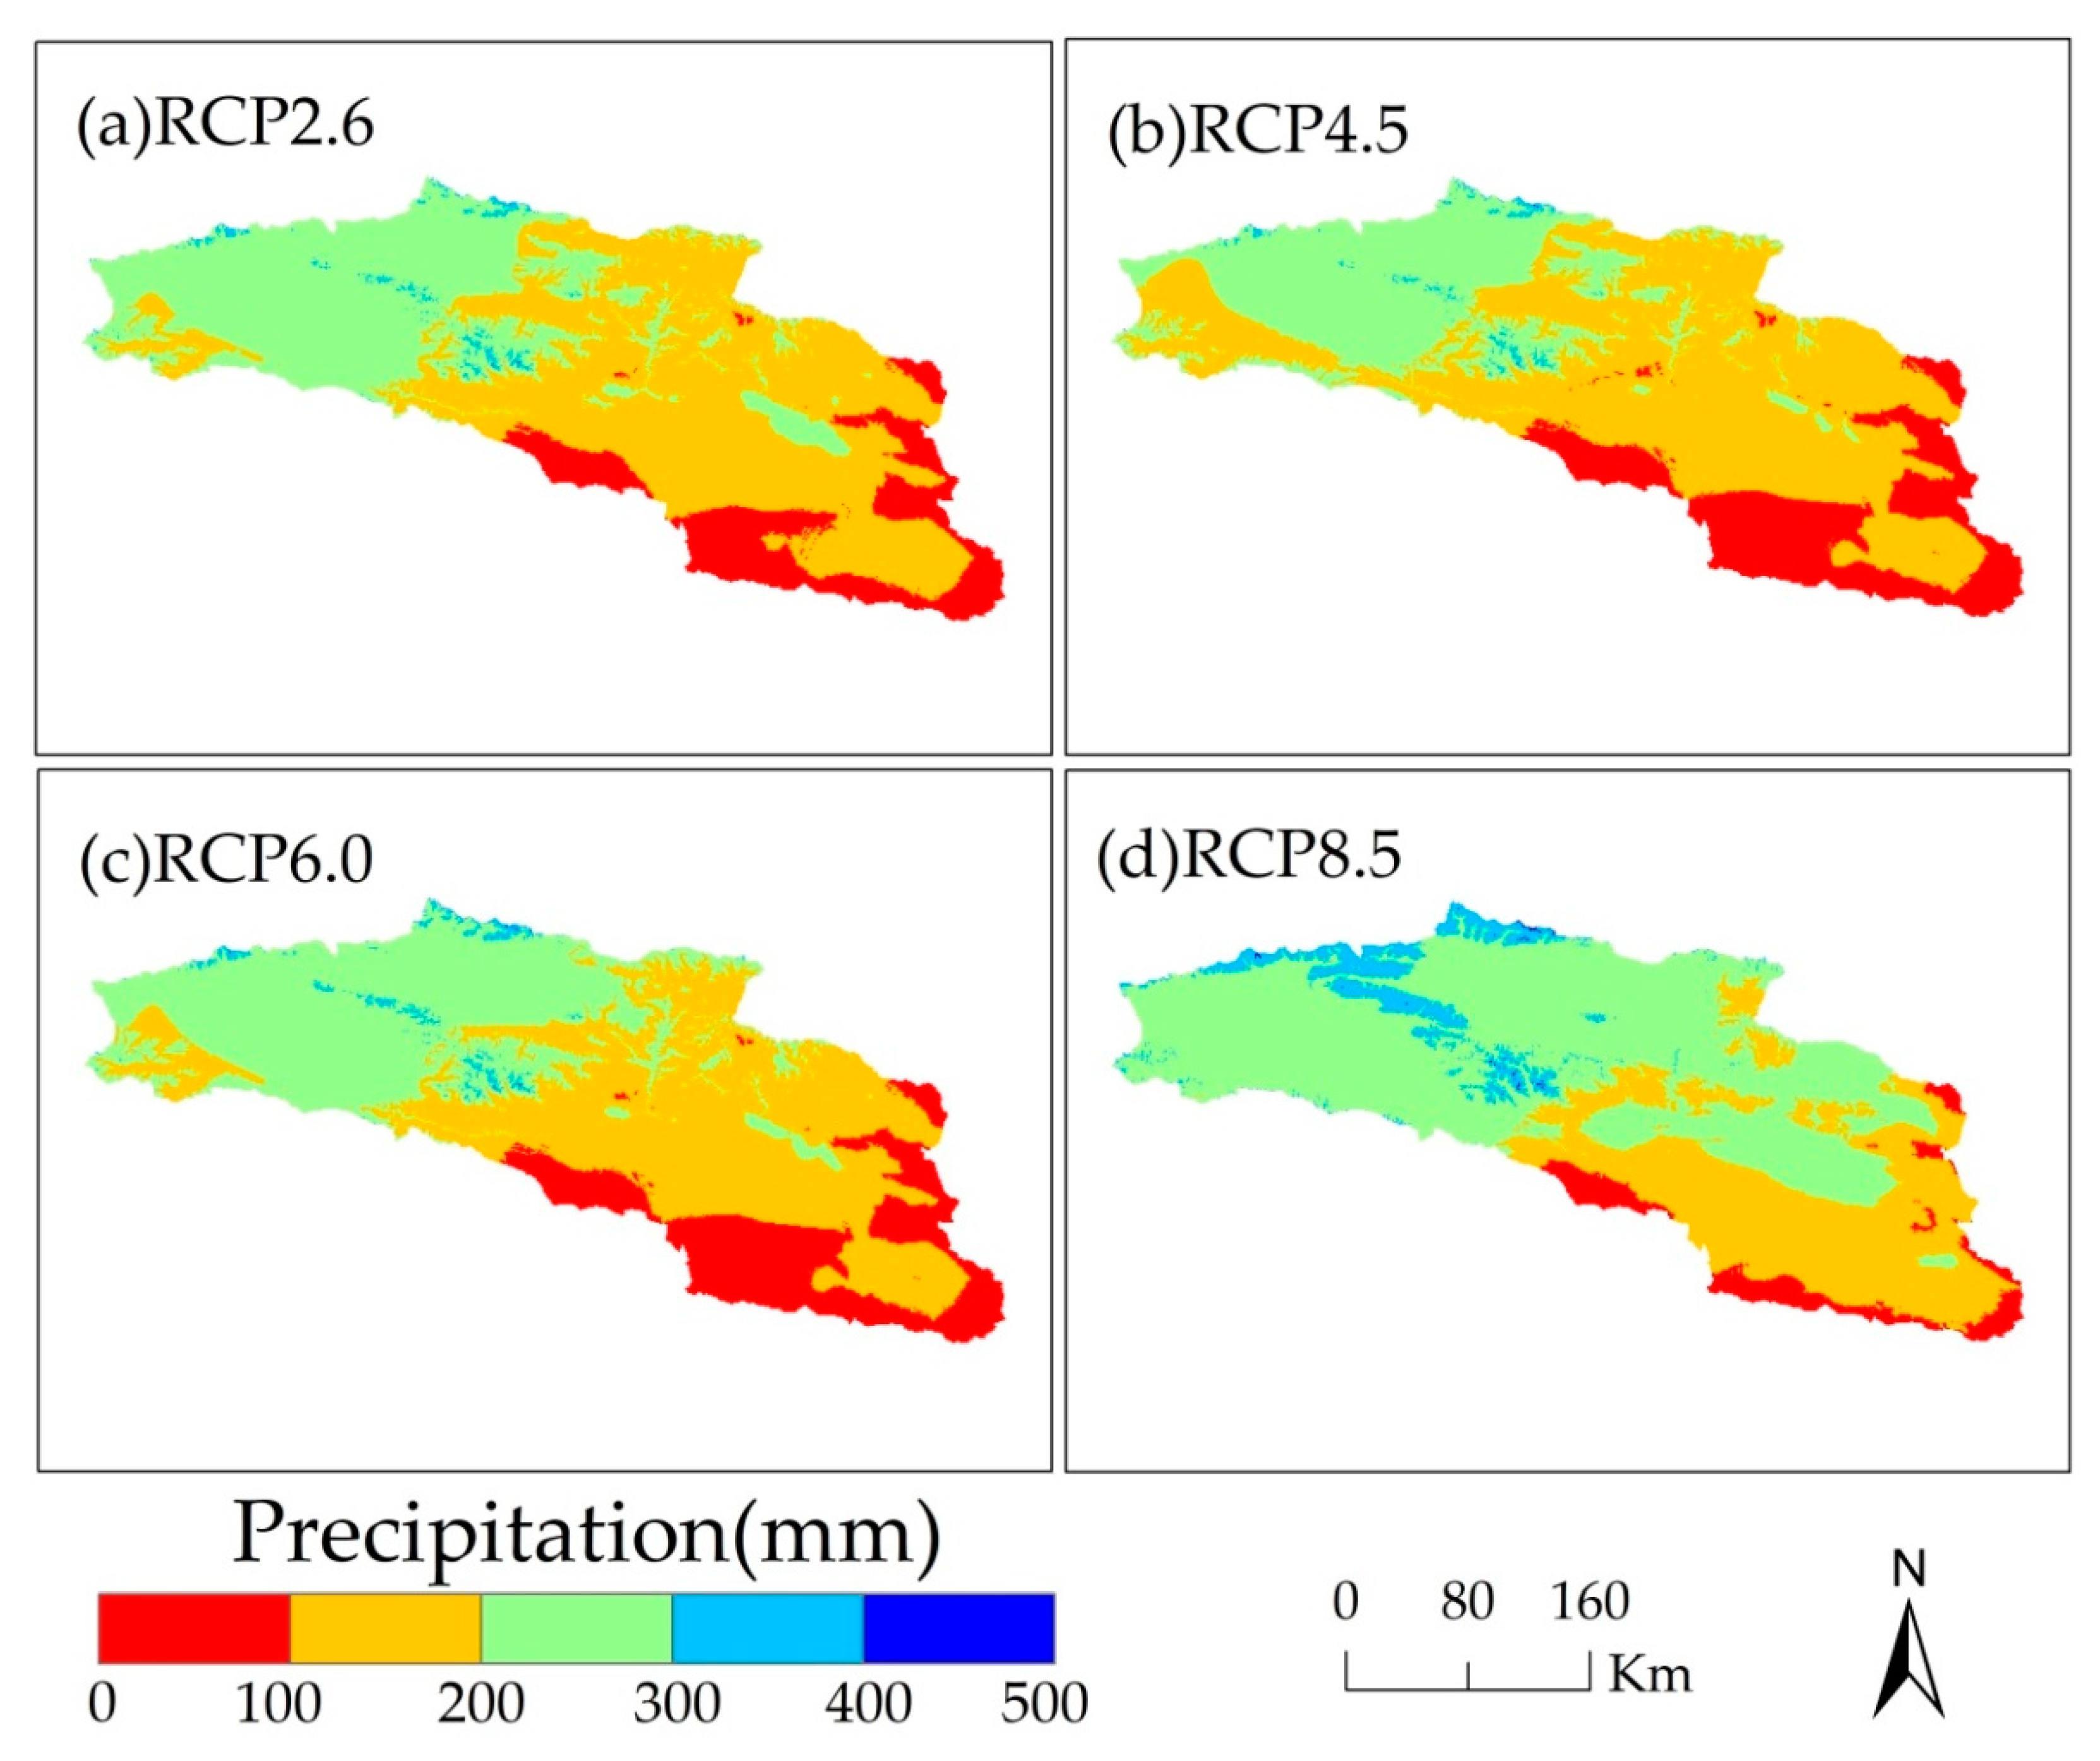
4.2. Precipitation Changes from 2020 to 2050
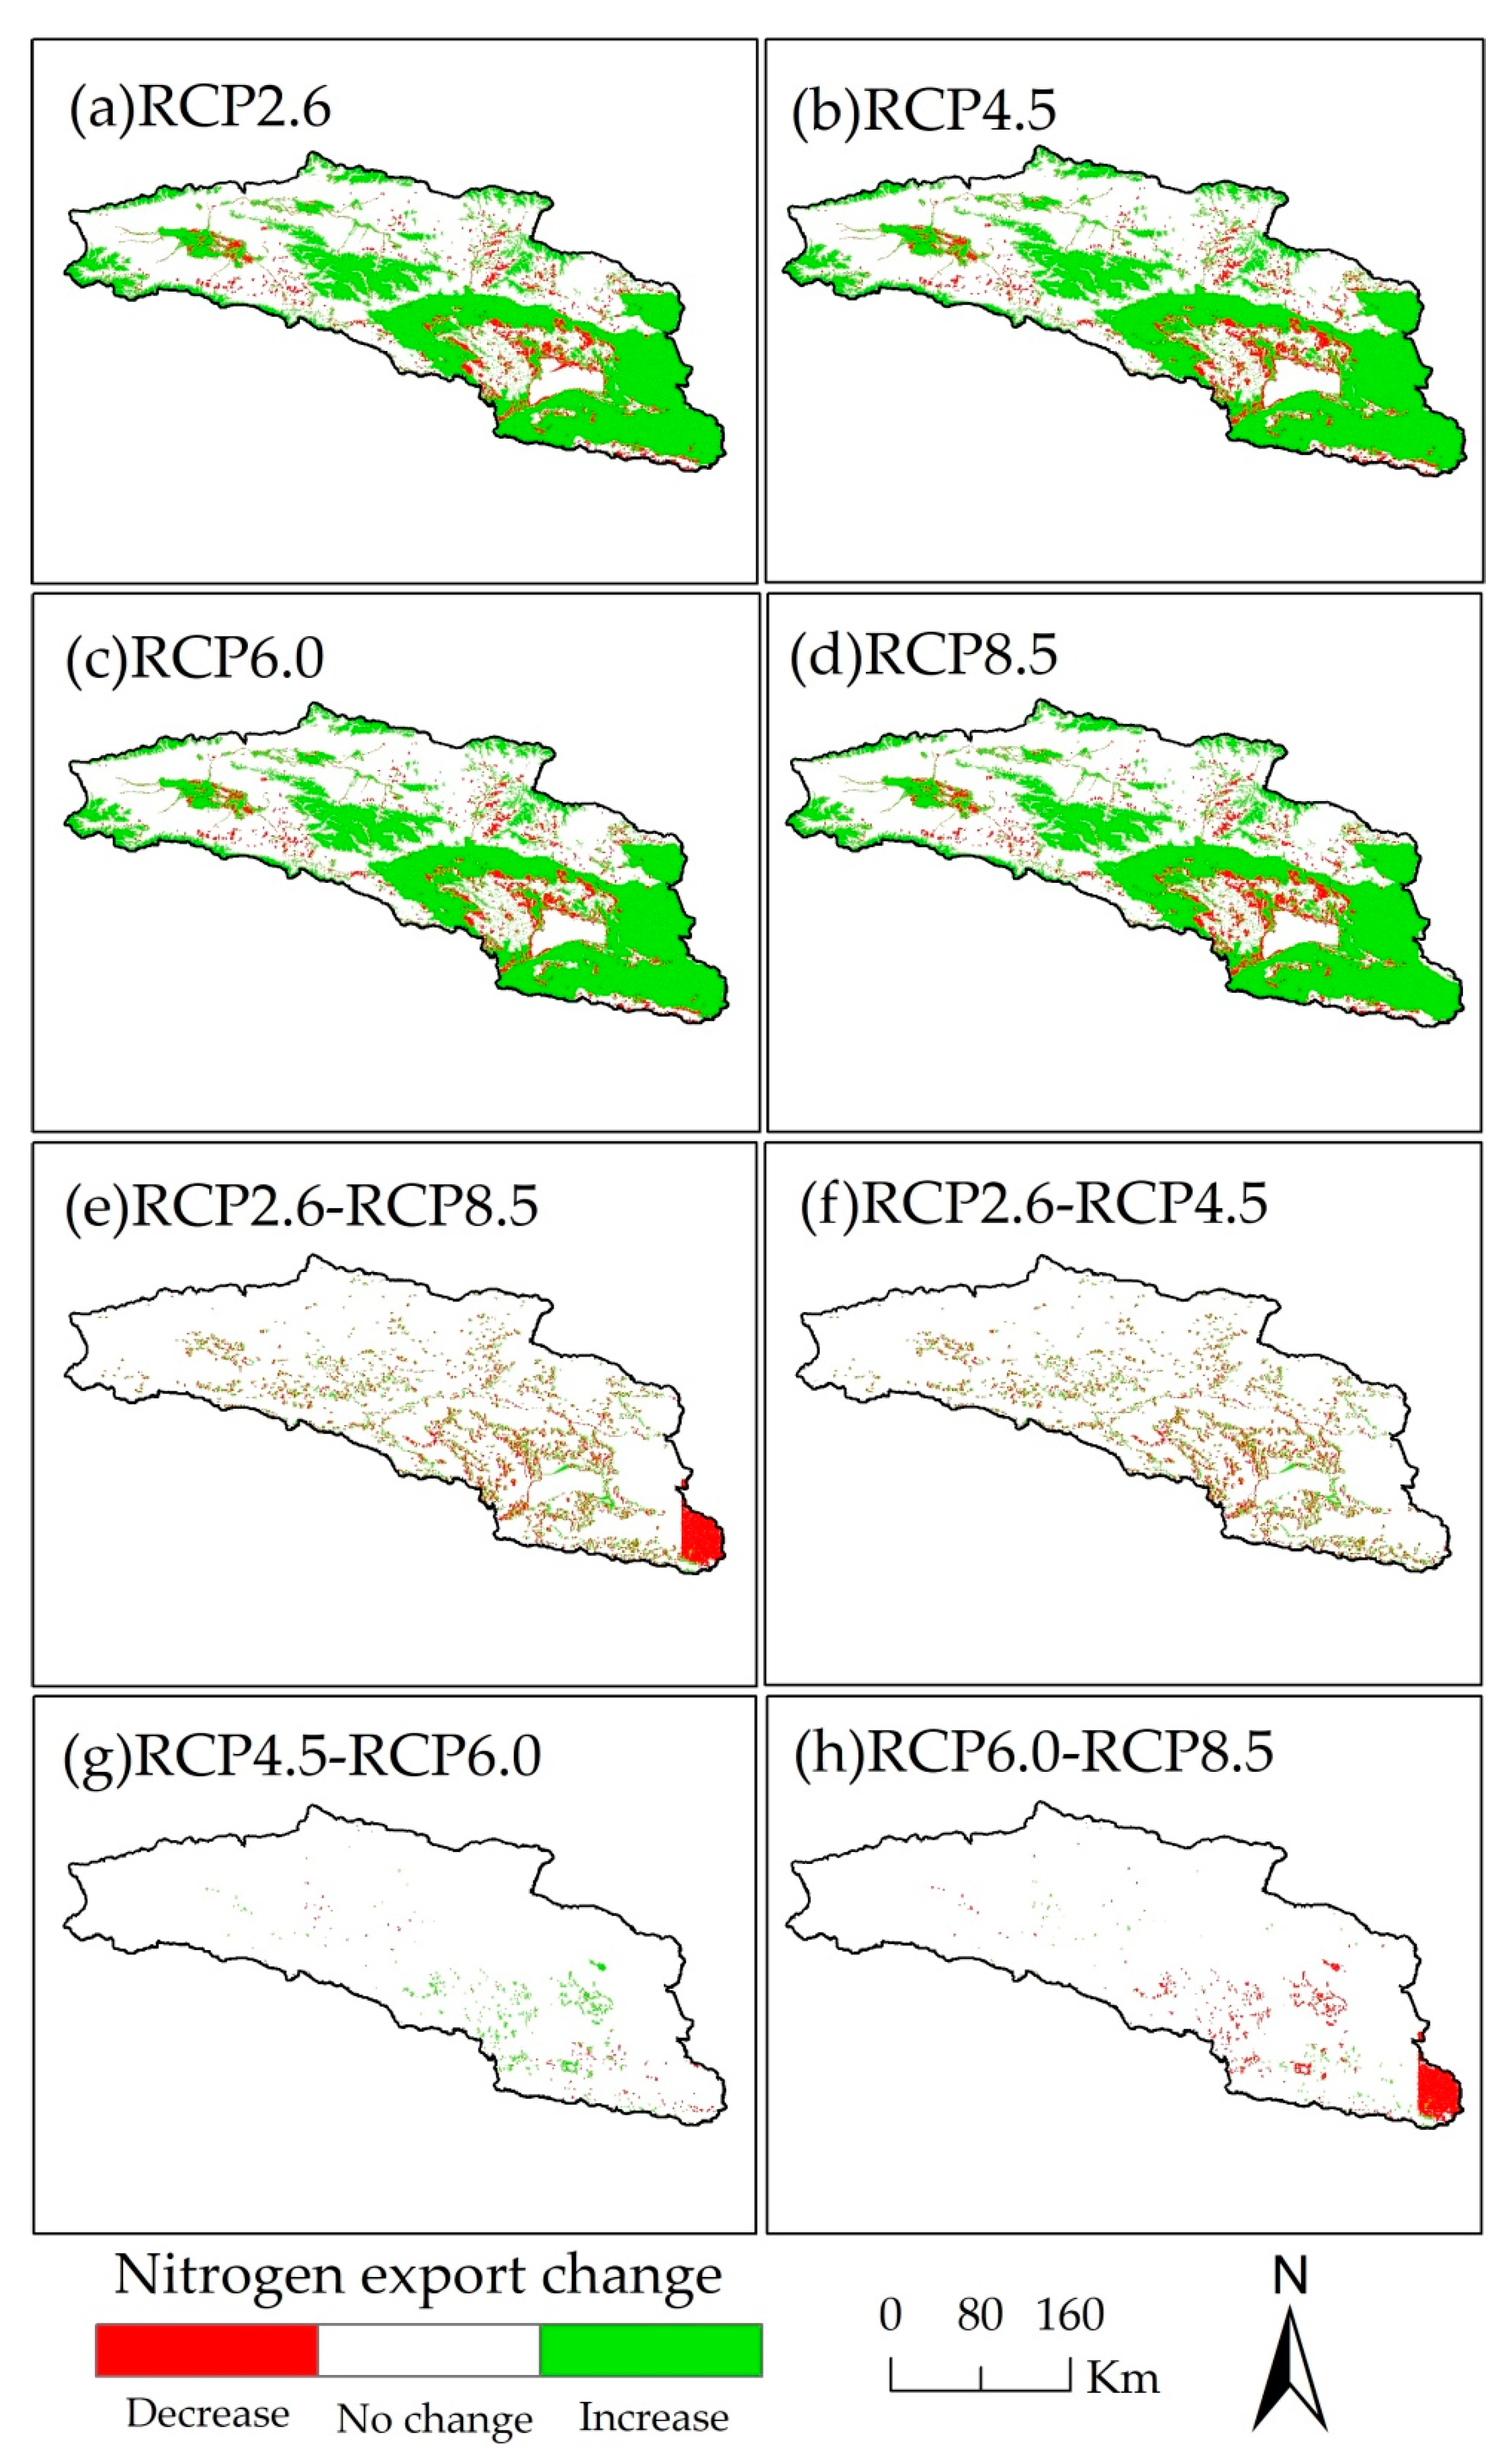
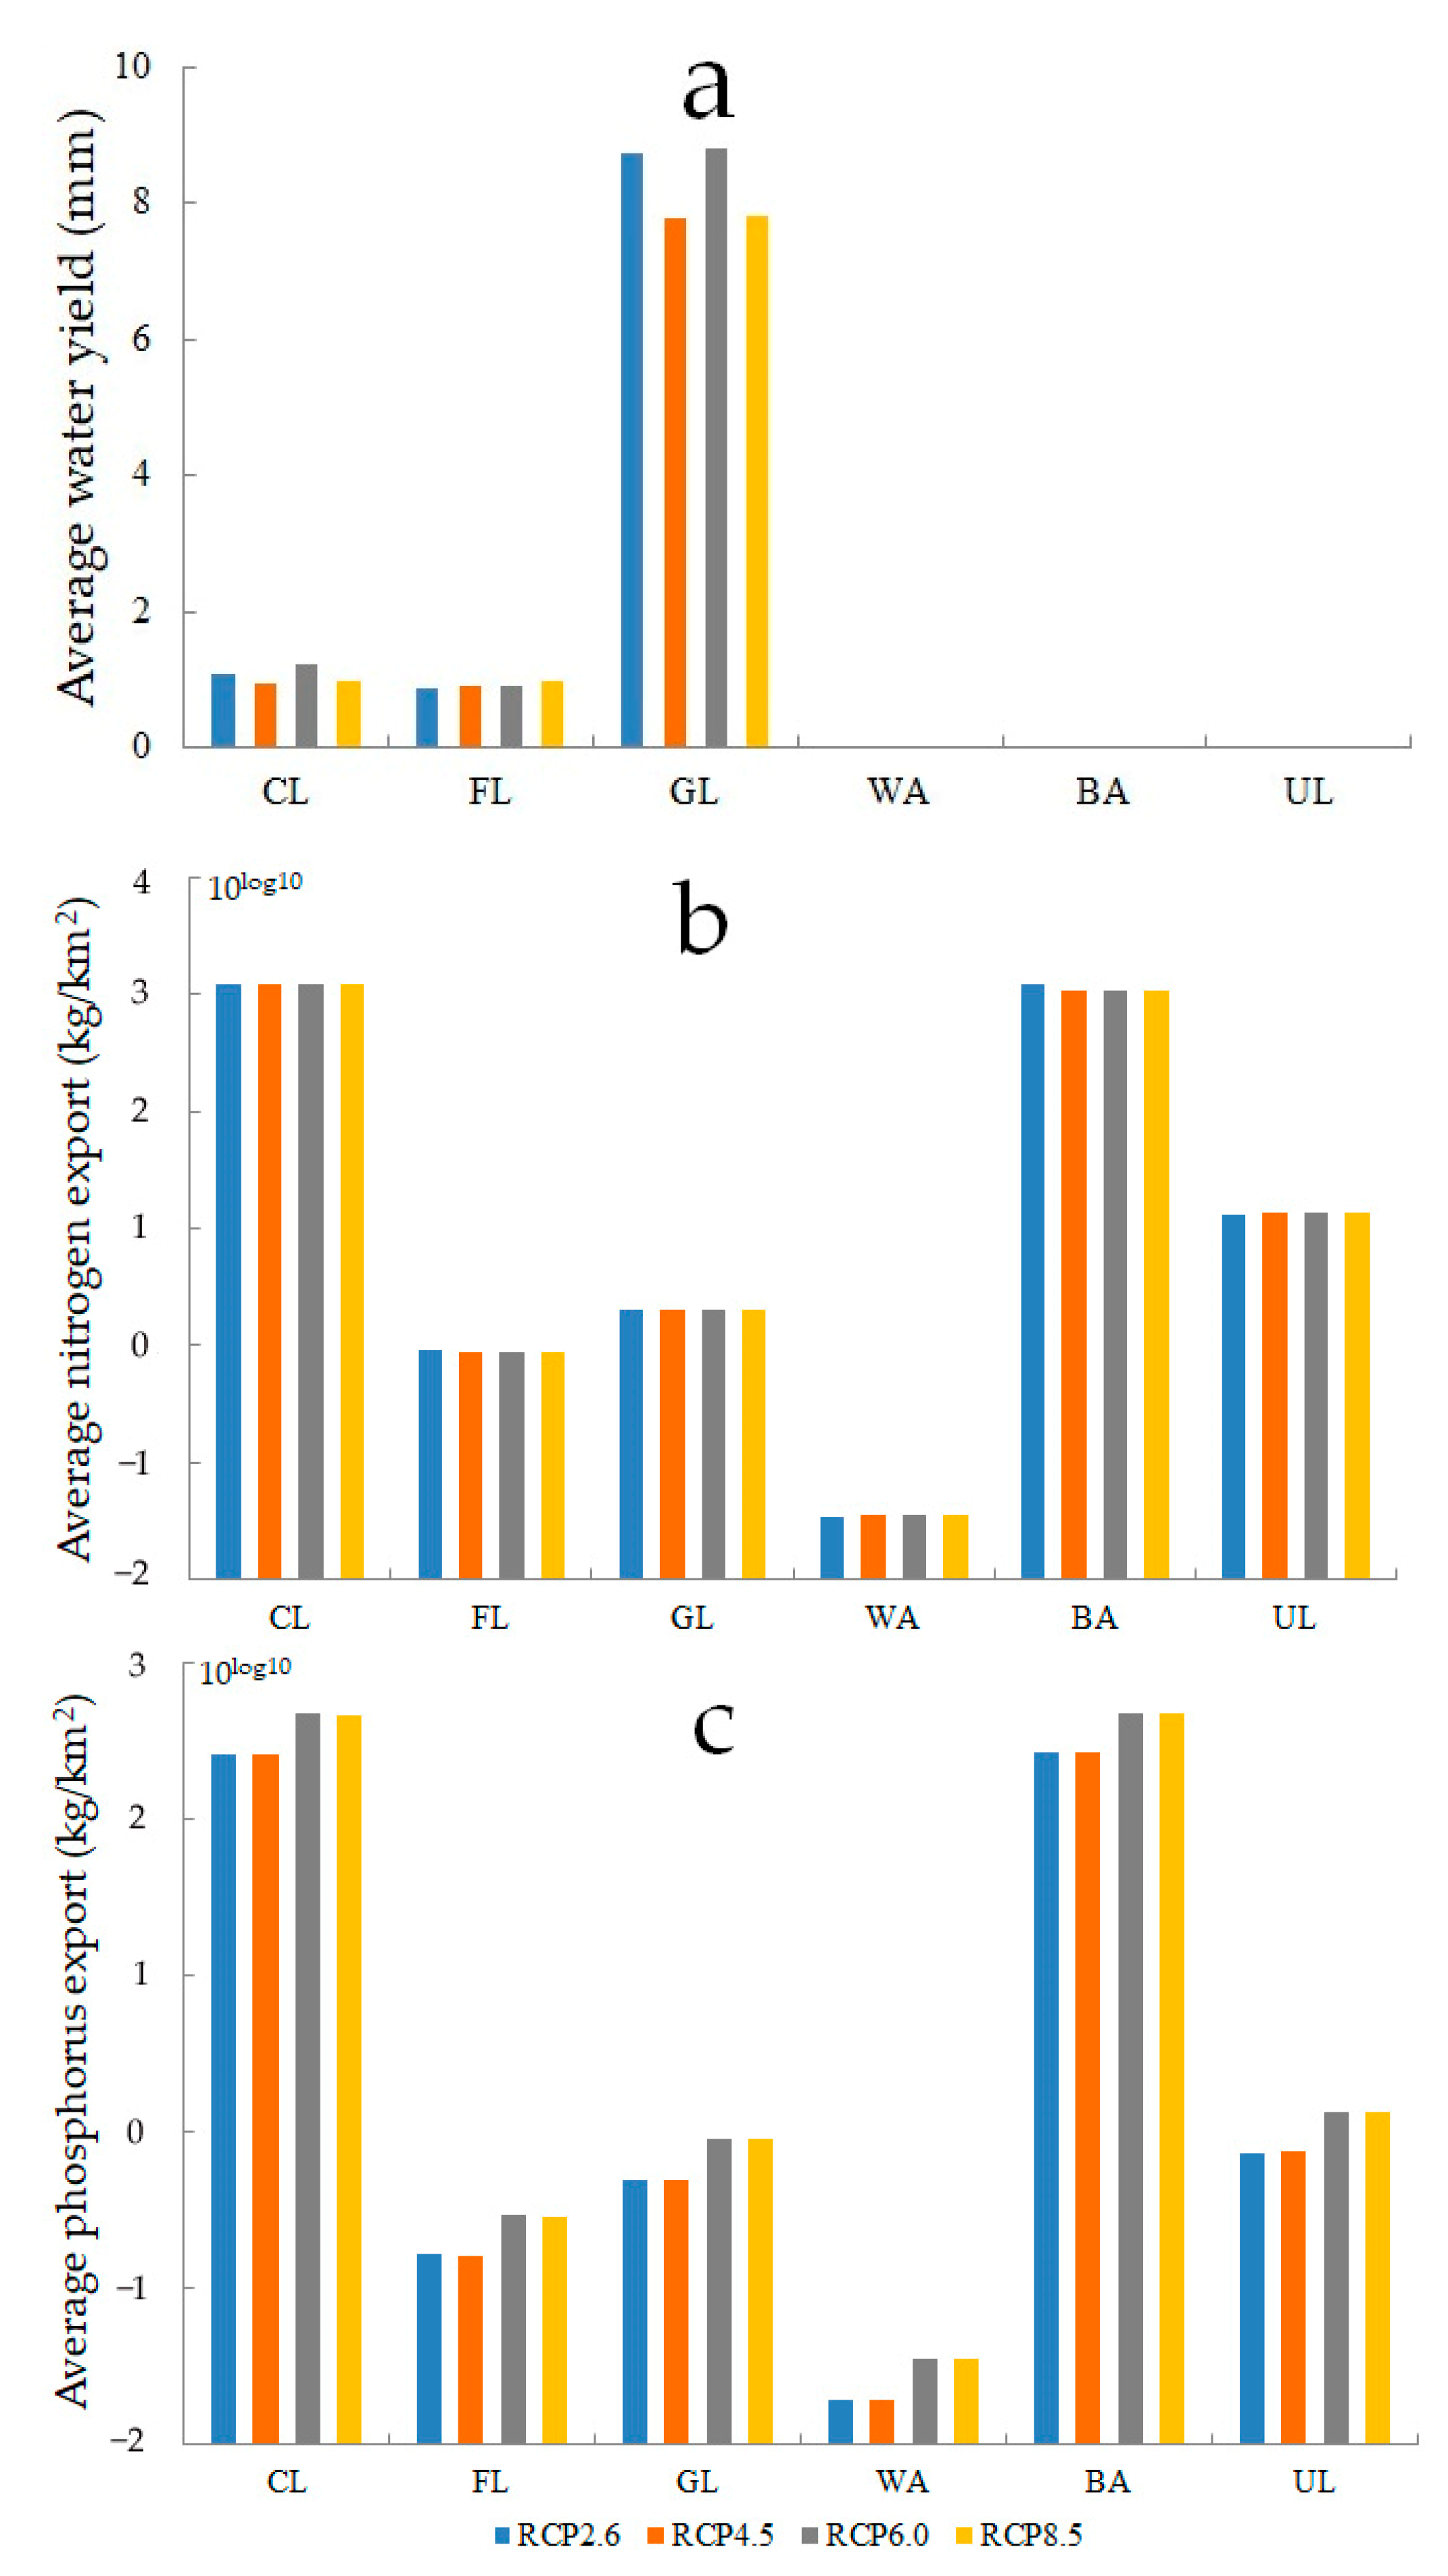
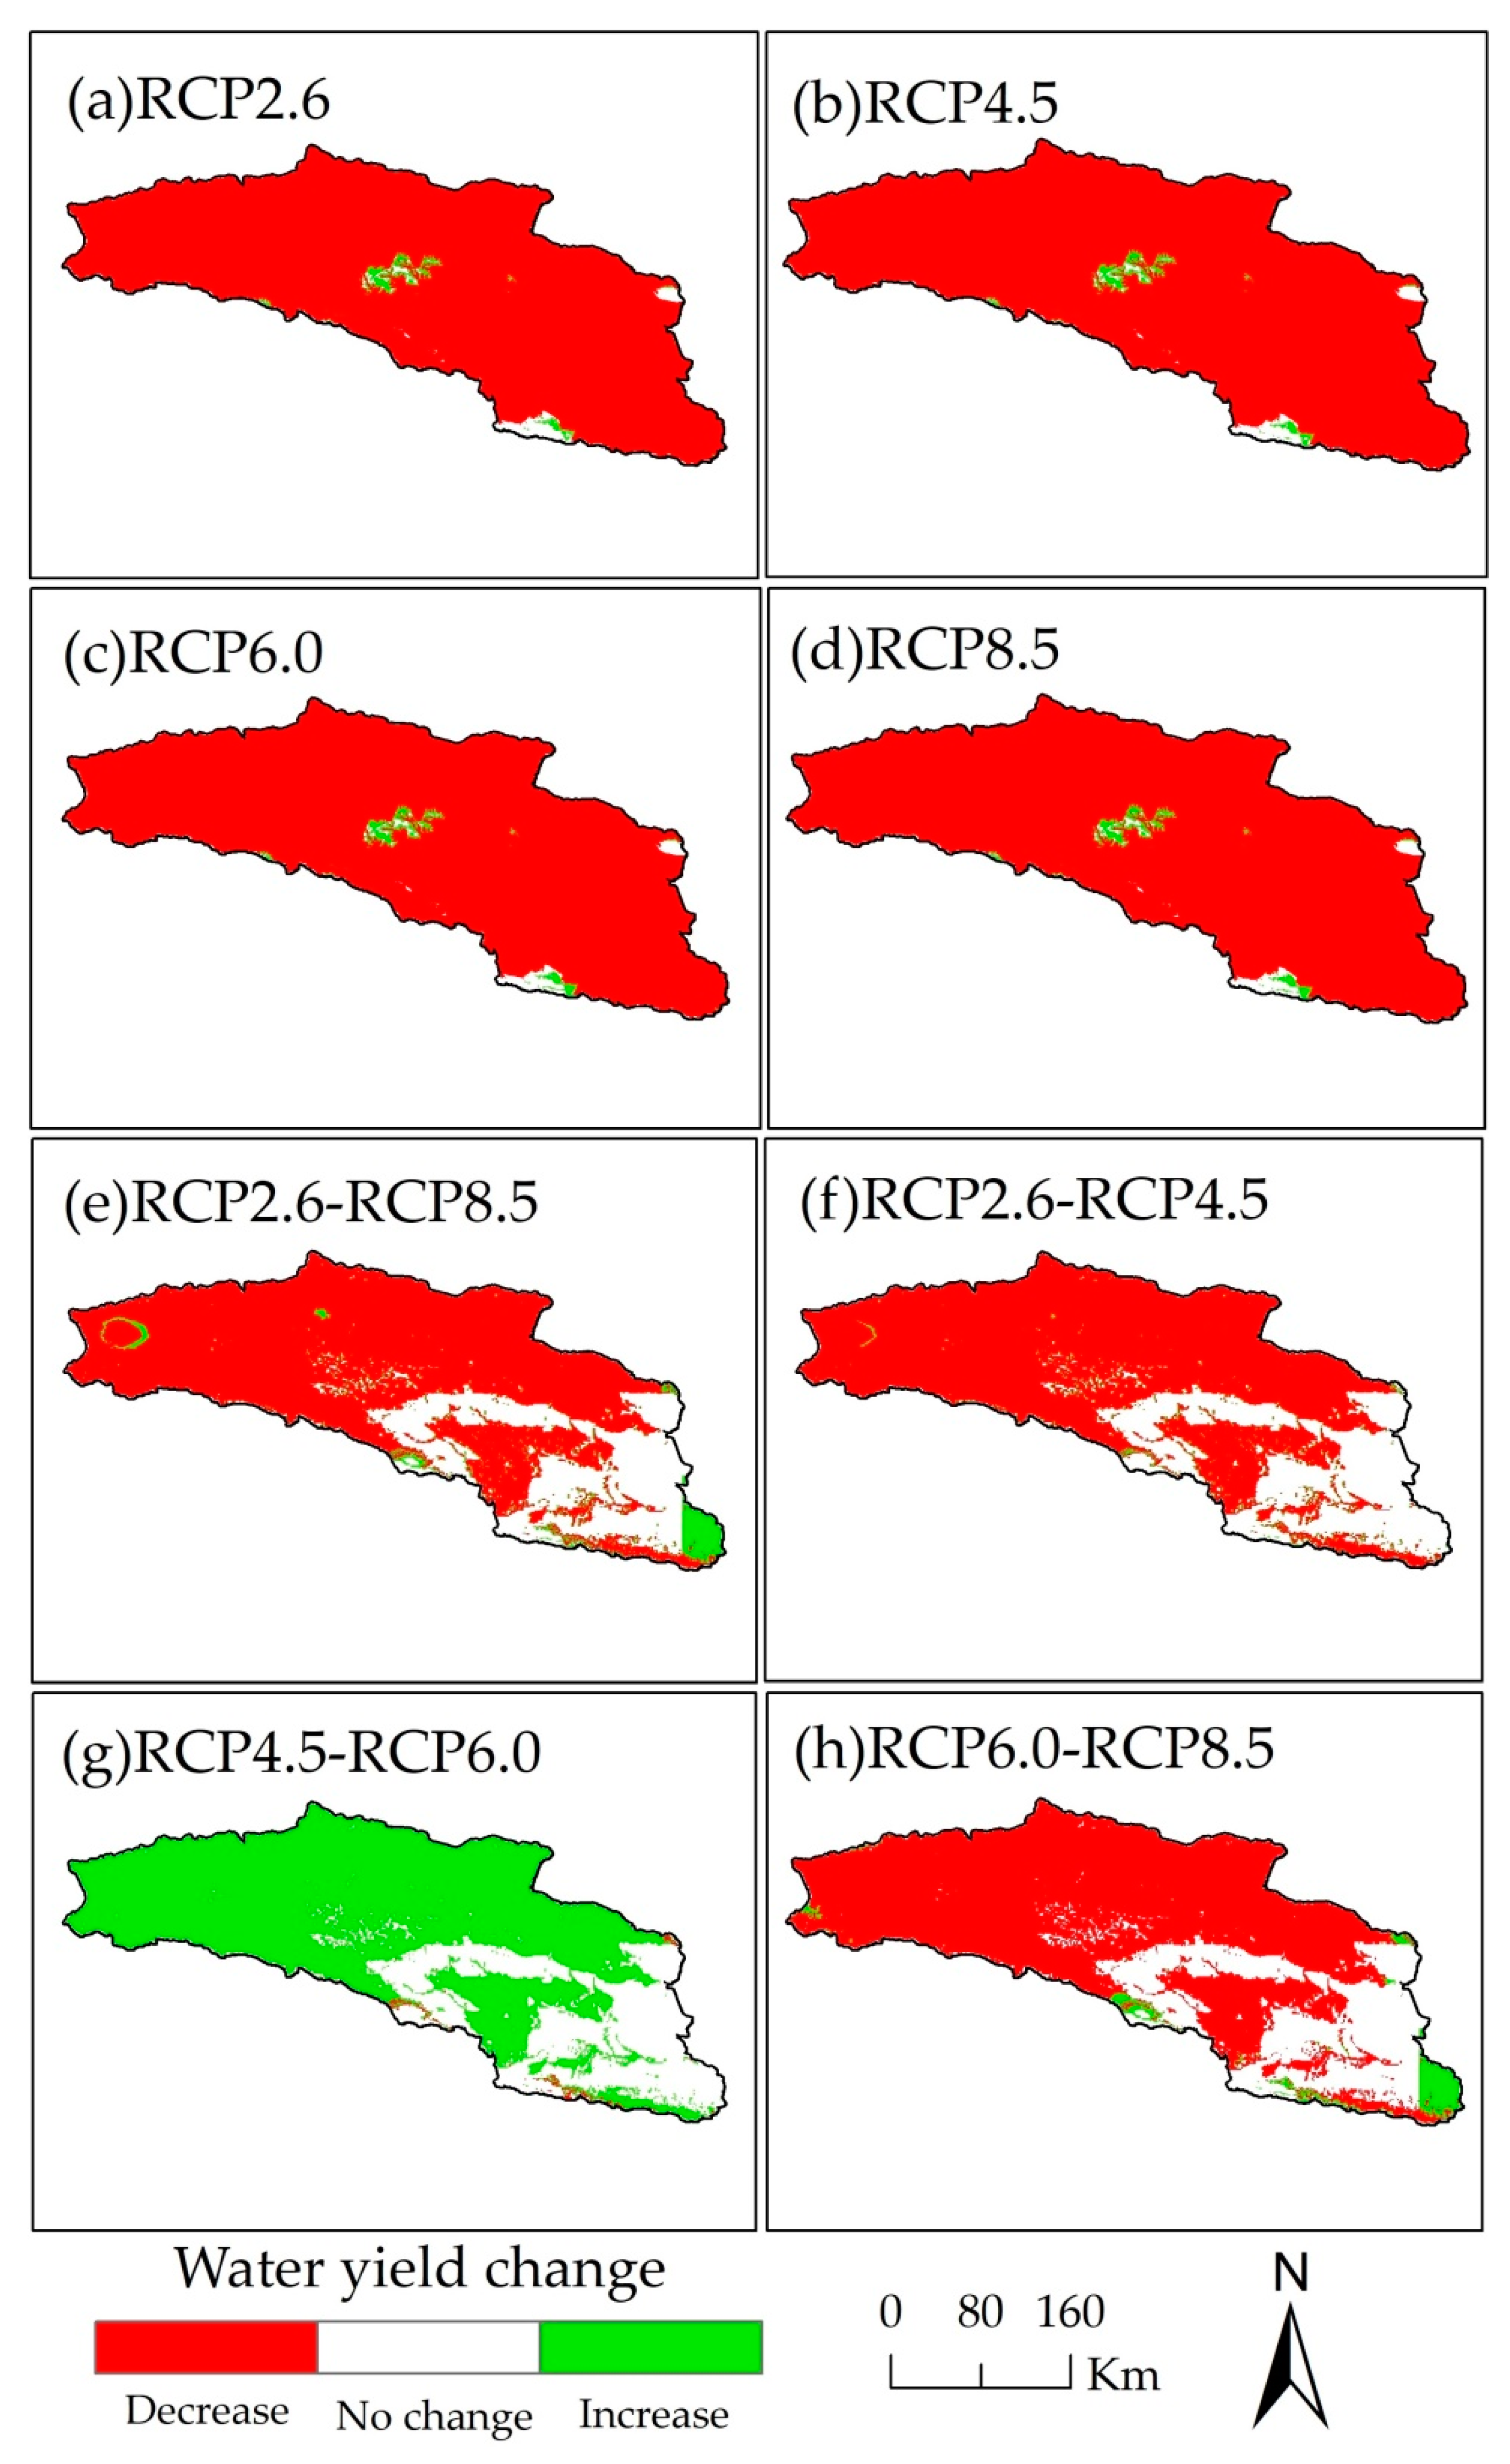
4.3. Spatio-Temporal Distribution of Water Yield, Nitrogen Export, and Phosphorus Export
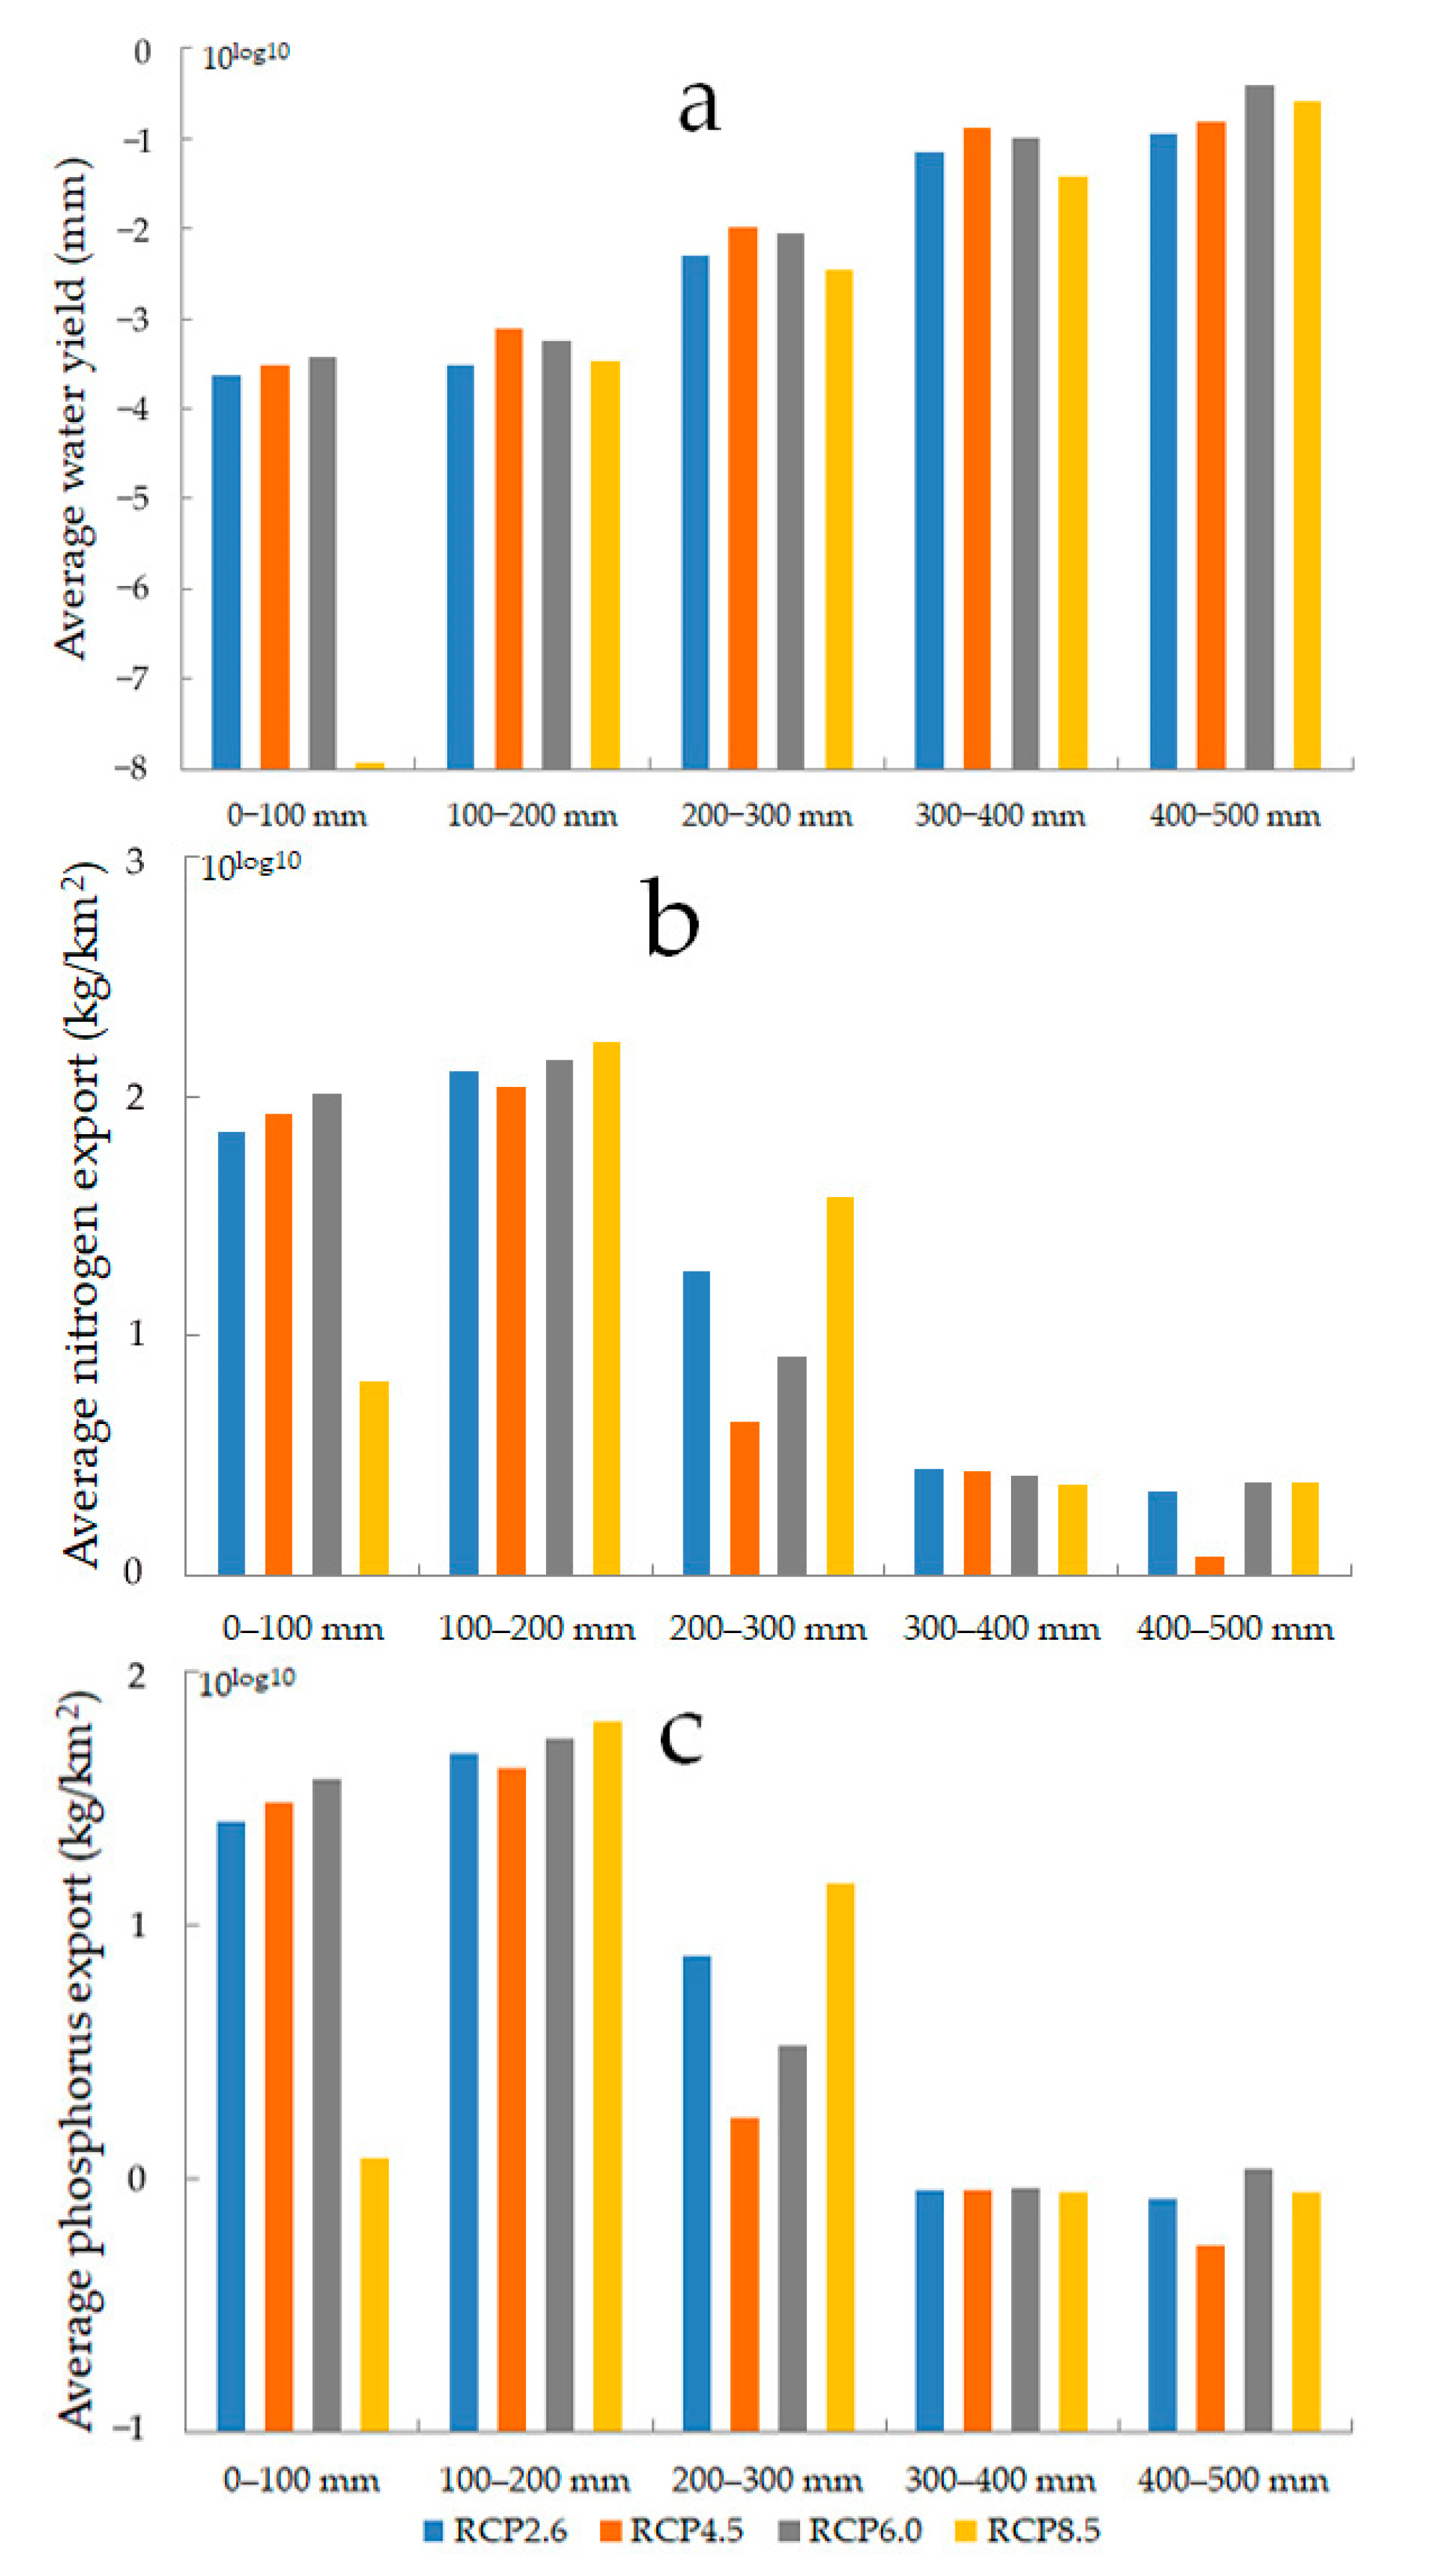
4.4. The Impact of Land Use and Precipitation Change on Water Yield, Nitrogen Export, and Phosphorus Export
5. Discussion
5.1. Future Trend in Water Yield, Nitrogen Export, and Phosphorus Export
5.2. Attribution of Water Ecosystem Services and Implications for Water Resource Policies
5.3. Limitations and Prospects
6. Conclusions
Author Contributions
Funding
Institutional Review Board Statement
Informed Consent Statement
Data Availability Statement
Conflicts of Interest
References
- Zhang, L.W.; Fu, B.J. The progress in ecosystem services mapping: A review. Acta Ecol. Sin. 2014, 34, 316–325. [Google Scholar]
- Yang, L.Y.; Zhang, L.B.; Li, Y.; Wu, S.T. Water-related ecosystem services provided by urban green space: A case study in Yixing city (China). Landsc. Urban Plan 2015, 136, 40–51. [Google Scholar] [CrossRef]
- Chen, J.Y.; Cui, T.; Wang, H.M.; Liu, G.; Gilfedder, M.; Bai, Y. Spatio-temporal evolution of water-related ecosystem services: Taihu basin, China. PeerJ 2018, 6, e5041. [Google Scholar] [CrossRef] [PubMed]
- Shi, Y.F.; Zhang, X.S. Future trend of the impact of climate change on surface water resources in the arid area of Northwest China. Sci. China 1995, 25, 968–977. [Google Scholar]
- Gan, T.Y. Reducing vulnerability of water resources of Canadian Prairies to potential droughts and possible climate warming. Water Resour. Manag. 2000, 14, 111–135. [Google Scholar] [CrossRef]
- Chen, Y.N.; Li, Z.; Fan, Y.T.; Wang, H.J.; Fang, G.H. Research progress on the impact of climate change on hydrology and water resources in the arid area of Northwest China. Acta Geogr. Sin. 2014, 69, 1295–1304. [Google Scholar]
- Deng, X.P.; Shan, L.; Zhang, H.P.; Turner, N.C. Improving agricultural water use efficiency in arid and semiarid areas of China. Agr. Water Manag. 2006, 80, 23–40. [Google Scholar] [CrossRef]
- Jiang, Y. China’s water scarcity. J. Environ. Manag. 2009, 90, 3185–3196. [Google Scholar] [CrossRef] [PubMed]
- Jiang, H.; Yusufujiang, R.S.L.; Adilai, W.F.; Reyilai, K.D.E. Landsat data based monitoring of groundwater depth and its influencing factors in oasis area of Kaidu River both sides. J. Nat. Disast. 2017, 26, 205–214. [Google Scholar]
- Qin, D.H. Assessment of Environmental Evolution in Western China, Volume 2, Prediction of Environmental Changes in Western China; Science Press: Beijing, China, 2002. [Google Scholar]
- Terrado, M.; Acuña, V.; Ennaanay, D.; Tallis, H.; Sabater, S. Impact of climate extremes on hydrological ecosystem services in a heavily humanized Mediterranean basin. Ecol. Indic. 2014, 37, 199–209. [Google Scholar] [CrossRef]
- Taylor, C.; Blair, D.; Keith, H.; Lindenmayer, D. Modelling water yields in response to logging and representative climate futures. Sci. Total Environ. 2019, 688, 890–902. [Google Scholar] [CrossRef]
- Xia, J.; Zuo, Q.T.; Shao, M.C. Sustainable Utilization of Water Resources in Bosten Lake: Theory, Method and Practice; Science Press: Beijing, China, 2003. [Google Scholar]
- Bao, C.; Fang, C.L. Water resources constraint force on urbanization in water deficient regions: A case study of the Hexi Corridor, arid area of NW China. Ecol. Econ. 2007, 62, 508–517. [Google Scholar] [CrossRef]
- Xia, J. Special issue: Climate change impact on water security & adaptive management in China. Water Int. 2012, 37, 509–511. [Google Scholar]
- Geng, X.L.; Wang, X.S.; Yan, H.M.; Zhang, Q.; Jin, G. Land use/land cover change induced impacts on water supply service in the upper reach of Heihe River basin. Sustainability 2015, 7, 366–383. [Google Scholar] [CrossRef] [Green Version]
- Li, M.Y.; Liang, D.; Xia, J.; Song, J.X.; Cheng, D.D.; Wu, J.T.; Cao, Y.L.; Sun, H.T.; Li, Q. Evaluation of water conservation function of Danjiang River Basin in Qinling Mountains, China based on InVEST model. J. Environ. Manag. 2021, 286, 112212. [Google Scholar] [CrossRef]
- Song, J.X.; Yang, Z.Y.; Xia, J.; Cheng, D.D. The impact of mining-related human activities on runoff in northern Shaanxi, China. J. Hydrol. 2021, 598, 126235. [Google Scholar] [CrossRef]
- Arnold, J. SWAT—Soil and Water Assessment Tool; AGRIS, Food and Agriculture Organization of the United Nations: Rome, Italy, 1994. [Google Scholar]
- Ji, G.X.; Lai, Z.Z.; Xia, H.B.; Liu, H. Future runoff variation and flood disaster prediction of the yellow river basin based on CA-Markov and SWAT. Land 2021, 10, 421. [Google Scholar] [CrossRef]
- Leavesley, G.H.; Lichty, R.W.; Troutman, B.M.; Saindon, L.G. Precipitation-Runoff Modeling System: User’s Manual; Water-Resources Investigations Report; U.S. Geological Survey, Water Resources Division: Reston, VA, USA, 1983.
- Bicknell, B.R.; Imhoff, J.C.; Kittle, J.L., Jr.; Donigian, A.S., Jr.; Johanson, R.C. Hydrological Simulation Program—FORTRAN User’s Manual for Version 11; Environmental Protection Agency Report No. EPA/600/R-97/080; US Environmental Protection Agency: Athens, GA, USA, 1997.
- Sharp, R.; Douglass, J.; Wolny, S.; Arkema, K.; Bernhardt, J.; Bierbower, W.; Chaumont, N.; Denu, D.; Fisher, D.; Glowinski, K.; et al. InVEST 3.9.0 User’s Guide; The Natural Capital Project, Stanford University: Palo Alto, CA, USA, 2020. [Google Scholar]
- Chen, L.; Xie, G.D.; Zhang, C.S.; Pei, S.; Fan, N.; Ge, L.Q.; Zhang, C.X. Modelling ecosystem water supply services across the Lancang river basin. J. Res. Ecol. 2011, 2, 322–327. [Google Scholar]
- Leh, M.D.K.; Matlock, M.D.; Cummings, E.C.; Nalley, L.L. Quantifying and mapping multiple ecosystem services change in west Africa. Agric. Ecosyst. Environ. 2013, 165, 6–18. [Google Scholar] [CrossRef]
- Outeiro, L.; Häussermann, V.; Viddi, F.; Hucke-Gaete, R.; Försterra, G.; Oyarzo, H.; Kosiel, K.; Villasante, S. Using ecosystem services mapping for marine spatial planning in southern Chile under scenario assessment. Ecosyst. Serv. 2015, 16, 341–353. [Google Scholar] [CrossRef]
- Posner, S.; Verutes, G.; Koh, I.; Denu, D.; Ricketts, T. Global use of ecosystem service models. Ecosyst. Serv. 2016, 17, 131–141. [Google Scholar] [CrossRef]
- Redhead, J.W.; May, L.; Oliver, T.H.; Hamel, P.; Sharp, R.; Bullock, J.M. National scale evaluation of the InVEST nutrient retention model in the United Kingdom. Sci. Total. Environ. 2018, 610, 666–677. [Google Scholar] [CrossRef]
- Liu, W.G.; Annivaer, M.Z.T.; Lv, G.H. Regional ecological risk assessment by remote sensing in Bosten Lake. J. Arid. Land Resour. Environ. 2008, 22, 33–37. [Google Scholar]
- Zhang, J.P. Eco-environment situation of Bosten Lake basin and its countermeasures. Environ. Sci. Tech. 2010, 23, 76–79. [Google Scholar]
- Hao, Y.Z.; Wang, J.L.; Jia Er Heng, A.H.T. An assessment of the influence of the Basin’s social and economic activities on water environment of Bosten Lake. China Rural Water Hydropow. 2013, 2, 1–3, 7. [Google Scholar]
- Yu, H. Research on the socio-economic regulation and pollution reduction program of Bosten Lake basin. Water Conserv. Sci. Tech. Econ. 2015, 21, 77–79. [Google Scholar]
- Xu, J.H.; Chen, Y.N.; Bai, L.; Xu, Y.W. A hybrid model to simulate the annual runoff of the Kaidu River in northwest China. Hydrol. Earth Syst. Sci. 2016, 20, 1447–1457. [Google Scholar] [CrossRef] [Green Version]
- Available online: https://earthexplorer.usgs.gov/ (accessed on 5 June 2020).
- Available online: https://www.resdc.cn/ (accessed on 8 June 2020).
- Available online: https://www.dess.tsinghua.edu.cn/info/1108/1345.htm (accessed on 6 June 2020).
- Li, X.C.; Yu, L.; Sohl, T.; Clinton, N.; Li, W.Y.; Zhu, Z.L.; Liu, X.P.; Gong, P. Cellular automata downscaling based 1 km global land use datasets (2010–2100). Sci. Bull. 2016, 21, 1651–1661. [Google Scholar] [CrossRef] [Green Version]
- Available online: https://disc.gsfc.nasa.gov/ (accessed on 9 June 2020).
- Available online: https://www.ecmwf.int/ (accessed on 6 June 2020).
- Hamon, W.R. Estimating potential evapotranspiration. J. Hydraul. Div. Proc. Am. Soc. Civ. Eng. 1961, 87, 107–120. [Google Scholar]
- Available online: http://www.fao.org/soils-portal/en/ (accessed on 8 June 2020).
- Allen, R.G.; Pereira, L.S.; Raes, D.; Smith, M. Crop Evapotranspiration. Guidelines for Computing Crop Water Requirements; FAO Irrigation and Drainage Paper 56; Food and Agriculture Organization of the United Nations: Rome, Italy, 1998. [Google Scholar]
- Zhou, W.; Liu, G.; Pan, J.; Feng, X. Distribution of available soil water capacity in China. J. Geogr. Sci. 2005, 15, 3–12. [Google Scholar] [CrossRef]
- Zhou, T.J.; Zou, L.W.; Wu, B.; Jin, C.X.; Song, F.F.; Chen, X.L.; Zhang, L.X. Development of earth/climate system models in China: A review from the Coupled Model Intercomparison Project perspective. Acta Meteorol. Sin. 2014, 72, 892–907. [Google Scholar] [CrossRef]
- Available online: https://esgf-node.llnl.gov/projects/cmip5/ (accessed on 10 June 2020).
- Davie, J.C.S.; Falloon, P.D.; Kahana, R.; Dankers, R.; Betts, R.; Portmann, F.T.; Fekete, B. Comparing projections of future changes in runoff and water resources from hydrological and ecosystem models in ISI-MIP. Earth Syst. Dynam. Discuss. 2013, 4, 279–315. [Google Scholar]
- Portmann, F.T.; Döll, P.; Eisner, S.; Flörke, M. Impact of climate change on renewable groundwater resources: Assessing the benefits of avoided greenhouse gas emissions using selected CMIP5 climate projections. Environ. Res. Lett. 2013, 8, 024023. [Google Scholar] [CrossRef]
- Rosenzweig, C.; Elliott, J.; Deryng, D.; Ruane, A.C.; Müller, C.; Arneth, A.; Neumann, K. Assessing agricultural risks of climate change in the 21st century in a global gridded crop model intercomparison. Proc. Natl. Acad. Sci. USA 2014, 111, 3268–3273. [Google Scholar] [CrossRef] [Green Version]
- Getirana, A.C.V.; Espinoza, J.C.V.; Ronchail, J.; Rotunno Filho, O.C. Assessment of different precipitation datasets and their impacts on the water balance of the Negro River basin. J. Hydrol. 2011, 404, 304–322. [Google Scholar] [CrossRef]
- Liu, Z.F.; Xu, Z.X.; Charles, S.P.; Fu, G.B.; Liu, L. Evaluation of two statistical downscaling models for daily precipitation over an arid basin in China. Int. J. Climatol. 2011, 31, 2006–2020. [Google Scholar] [CrossRef]
- Mahmood, R.; Babel, M.S. Evaluation of SDSM developed by annual and monthly sub-models for downscaling temperature and precipitation in the Jhelum basin, Pakistan and India. Theor. Appl. Climatol. 2013, 113, 27–44. [Google Scholar] [CrossRef]
- Georgakakos, K.P.; Graham, N.E.; Modrick, T.M.; Murphy, M.J.; Shamir, E.; Spencer, C.R.; Sperfslage, J.A. Evaluation of realtime hydrometeorological ensemble prediction on hydrologic scales in Northern California. J. Hydrol. 2014, 519, 2978–3000. [Google Scholar] [CrossRef]
- Wang, C.; Xu, J.H.; Chen, Y.N.; Bai, L.; Chen, Z.S. A hybrid model to assess the impact of climate variability on streamflow for an ungauged mountainous basin. Clim. Dynam. 2017, 50, 2829–2844. [Google Scholar] [CrossRef]
- Fan, Z.X.; Thomas, A. Spatiotemporal variability of reference evapotranspiration and its contributing climatic factors in Yunnan Province, SW China, 1961–2004. Clim. Chang. 2013, 116, 309–325. [Google Scholar] [CrossRef]
- Droogers, P.; Allen, R.G. Estimating reference evapotranspiration under inaccurate data conditions. Irrig. Drain Syst. 2002, 16, 33–45. [Google Scholar] [CrossRef]
- Wolock, D.M.; McCabe, G.J. Estimates of runoff using water-balance and atmospheric general circulation models. J. Am. Water Resour. Assoc. 1999, 35, 1341–1350. [Google Scholar] [CrossRef]
- Yang, X.; Ji, G.X.; Wang, C.; Zuo, J.P.; Yang, H.Q.; Xu, J.H.; Chen, R.S. Modeling nitrogen and phosphorus export with InVEST model in Bosten Lake basin of Northwest China. PLoS ONE 2019, 14, e0220299. [Google Scholar] [CrossRef]
- Yang, X.; Chen, R.S.; Michael, E.M.; Ji, G.X.; Xu, J.H. Modelling water yield with the InVEST model in a data scarce region of northwest China. Water Sci. Technol. Water Supply 2020, 20, 1035–1045. [Google Scholar] [CrossRef]
- Hoyer, R.; Chang, H. Assessment of freshwater ecosystem services in the Tualatin and Yamhill basins under climate change and urbanization. Appl. Geogr. 2014, 53, 402–416. [Google Scholar] [CrossRef]


| RCP Scenario | Water Yield (m3) | Nitrogen Export (t) | Phosphorus Export (t) |
|---|---|---|---|
| RCP2.6 | 2.49 × 10⁸ | 3766.92 | 1414.19 |
| RCP4.5 | 2.22 × 10⁸ | 3518.51 | 1307.81 |
| RCP6.0 | 2.51 × 10⁸ | 3974.48 | 1499.95 |
| RCP8.5 | 2.29 × 10⁸ | 3504.87 | 1305.86 |
Publisher’s Note: MDPI stays neutral with regard to jurisdictional claims in published maps and institutional affiliations. |
© 2021 by the authors. Licensee MDPI, Basel, Switzerland. This article is an open access article distributed under the terms and conditions of the Creative Commons Attribution (CC BY) license (https://creativecommons.org/licenses/by/4.0/).
Share and Cite
Yang, X.; Chen, R.; Ji, G.; Wang, C.; Yang, Y.; Xu, J. Assessment of Future Water Yield and Water Purification Services in Data Scarce Region of Northwest China. Int. J. Environ. Res. Public Health 2021, 18, 8960. https://doi.org/10.3390/ijerph18178960
Yang X, Chen R, Ji G, Wang C, Yang Y, Xu J. Assessment of Future Water Yield and Water Purification Services in Data Scarce Region of Northwest China. International Journal of Environmental Research and Public Health. 2021; 18(17):8960. https://doi.org/10.3390/ijerph18178960
Chicago/Turabian StyleYang, Xu, Ruishan Chen, Guangxing Ji, Chao Wang, Yuanda Yang, and Jianhua Xu. 2021. "Assessment of Future Water Yield and Water Purification Services in Data Scarce Region of Northwest China" International Journal of Environmental Research and Public Health 18, no. 17: 8960. https://doi.org/10.3390/ijerph18178960
APA StyleYang, X., Chen, R., Ji, G., Wang, C., Yang, Y., & Xu, J. (2021). Assessment of Future Water Yield and Water Purification Services in Data Scarce Region of Northwest China. International Journal of Environmental Research and Public Health, 18(17), 8960. https://doi.org/10.3390/ijerph18178960