
Impact of Safety Culture on Safety Performance; Mediating Role of Psychosocial Hazard: An Integrated Modelling Approach

 ,
,  , ,
, ,
Abstract
:1. Introduction
2. Literature Review
2.1. Safety Culture
2.2. The Dimension of Safety Culture
2.2.1. Management Commitment
2.2.2. Work Environment
2.2.3. Involvement
2.3. Psychosocial Hazards
2.4. Safety Performance
2.4.1. Lagging and Leading Metrics
2.4.2. Psychosocial Hazard Mediates the Relationship between Safety Culture and Its Impact on Employees Performance
3. Methods and Materials
3.1. Participants and Procedures
3.2. Measures
3.2.1. Safety Culture Scale (SCS)
3.2.2. Management Commitment (MC)
3.2.3. Work Environment (WE)
3.2.4. Involvement (INV)
3.2.5. Psychosocial Hazards (PSH)
3.2.6. Safety Performance Scale (SPS)
3.2.7. Leading Indicators (SPLD)
3.2.8. Lagging Indicators (SPLG)
3.3. Sampling and Study Design
3.4. Structural Equation Modeling (SEM)
4. Results
4.1. Reliability Analysis
4.2. Discriminant Validity
4.3. Structural Model
4.3.1. Direct Effect
| Construct | R2 Included | R2 Excluded | R2 Included-R2 Excluded | 1-R2 Included | F2 | Result |
| SC | 0.209 | 0.184 | 0.025 | 0.791 | 0.032 | Small |
| PSH | 0.209 | 0.147 | 0.062 | 0.791 | 0.078 | Small |
4.3.2. Measurement Model Test
4.3.3. Mediation Effect Measurement
5. Discussion
6. Conclusions
Study Limitations
Author Contributions
Funding
Institutional Review Board Statement
Informed Consent Statement
Data Availability Statement
Conflicts of Interest
References
- Tang, D.K.H.; Leiliabadi, F.; Olugu, E.U.; Dawal, S.Z.M. Factors affecting safety of processes in the Malaysian oil and gas industry. Saf. Sci. 2017, 92, 44–52. [Google Scholar] [CrossRef]
- Hoffmann, R.; Lerner, N.; Critchley, S.; Cislo, G. Human Performance and Safety Culture Initiatives Transform Safety Performance. In Proceedings of the SPE International Conference and Exhibition on Health, Safety, Security, Environment, and Social Responsibility, Abu Dhabi, United Arab Emirates, 16–18 April 2018. [Google Scholar]
- Weiner, L.M.; Webb, A.K.; Limbago, B.; Dudeck, M.A.; Patel, J.; Kallen, A.J.; Edwards, J.R.; Sievert, D.M. Antimicrobial-Resistant Pathogens Associated With Healthcare-Associated Infections: Summary of Data Reported to the National Healthcare Safety Network at the Centers for Disease Control and Prevention, 2011–2014. Infect. Control Hosp. Epidemiol. 2016, 37, 1288–1301. [Google Scholar] [CrossRef] [Green Version]
- Jamil, R.; Wei, W.F. Leading change in Social Security Organization (SOCSO). Int. J. Innov. Bus. Strat. 2015, 4, 6–13. [Google Scholar]
- Yang, C.C.; Wang, Y.S.; Chang, S.T.; Guo, S.E.; Huang, M.F. A study on the leadership behavior, safety culture, and safety performance of the healthcare industry. World Acad. Sci. Eng. Technol. 2009, 53, 1148–1155. [Google Scholar]
- Salas, R.; Hallowell, M. Predictive Validity of Safety Leading Indicators: Empirical Assessment in the Oil and Gas Sector. J. Constr. Eng. Manag. 2016, 142, 04016052. [Google Scholar] [CrossRef]
- Ali, S.; Shariff, A.M. An integrated conceptual framework for proactive improvement of safety culture. Int. Rev. Market. 2016, 6, 120–124. [Google Scholar]
- Kim, Y.; Park, J.; Park, M. Creating a Culture of Prevention in Occupational Safety and Health Practice. Saf. Health Work 2016, 7, 89–96. [Google Scholar] [CrossRef] [PubMed] [Green Version]
- Salas, R.I. Empirical Evaluation of Construction Safety: Insights from Economic Trends, National Cultures and Workplace Injury Rates; University of Colorado at Boulder: Boulder, CO, USA, 2020; p. 27835552. [Google Scholar]
- Alhassan, M.A.; Zulkipli, G.; Nizam Isha, A.S. Role of Organizational Culture, Organizational Communication and Temperament in the Choice of Conflict Management Styles among Plant Turnaround Maintenance Employees in PETRONAS Petro-Chemical Companies in Malaysia: A Conceptual Framework. Glob. Bus. Manag. Res. 2014, 6, 4. [Google Scholar]
- Lilley, R.; McNoe, B.; Davie, G.; De Graaf, B.; Driscoll, T. Work-Related Fatalities Involving Children in New Zealand, 1999–2014. Children 2020, 8, 4. [Google Scholar] [CrossRef]
- Shamsuddin, K.A.; Ani, M.N.C.; Ismail, A.K.; Ibrahim, M.R. Investigation the Safety, Health and Environment (SHE) protection in construction area. Int. Res. J. Eng. Technol. 2015, 2, 624–636. [Google Scholar]
- Yorio, P.L.; Edwards, J.; Hoeneveld, D. Safety culture across cultures. Saf. Sci. 2019, 120, 402–410. [Google Scholar] [CrossRef] [PubMed]
- Fernández-Muñiz, B.; Montes-Peón, J.M.; Vázquez-Ordás, C.J. Safety culture: Analysis of the causal relationships between its key dimensions. J. Saf. Res. 2007, 38, 627–641. [Google Scholar] [CrossRef]
- Guldenmund, F. The nature of safety culture: A review of theory and research. Saf. Sci. 2000, 34, 215–257. [Google Scholar] [CrossRef]
- Cox, S.; Cox, T. The structure of employee attitudes to safety: A European example. Work Stress 1991, 5, 93–106. [Google Scholar] [CrossRef]
- Wilkinson, F.C.; Lewis, L.K. Developing a Safety Training Program. Libr. Arch. Secur. 2008, 21, 77–85. [Google Scholar] [CrossRef]
- Chiang, F.F.; Birtch, T.A.; Kwan, H.K. The moderating roles of job control and work-life balance practices on employee stress in the hotel and catering industry. Int. J. Hosp. Manag. 2010, 29, 25–32. [Google Scholar] [CrossRef]
- Henning, J.B.; Stufft, C.J.; Payne, S.C.; Bergman, M.E.; Mannan, M.S.; Keren, N. The influence of individual differences on organizational safety attitudes. Saf. Sci. 2009, 47, 337–345. [Google Scholar] [CrossRef]
- Liu, S.; Nkrumah, E.N.K.; Akoto, L.S.; Gyabeng, E.; Nkrumah, E. The State of Occupational Health and Safety Management Frameworks (OHSMF) and Occupational Injuries and Accidents in the Ghanaian Oil and Gas Industry: Assessing the Mediating Role of Safety Knowledge. BioMed Res. Int. 2020, 2020, 6354895. [Google Scholar] [CrossRef]
- Ajmal, M.; Nizam Isha, A.S.; Md Nordin, S.; Kanwal, N.; Al-Mekhlafi, A.A.; Naji, G.M.A. A conceptual framework for the determinants of organizational agility: Does safety commitment matters? Solid State Technol. 2020, 63, 4112–4119. [Google Scholar]
- Akalp, G.; Aytac, S.; Yamankaradeniz, N.; Cankaya, O.; Gokce, A.; Tufekci, U. Perceived Safety Culture and Occupational Risk Factors among women in Metal Industries: A Study in Turkey. Procedia Manuf. 2015, 3, 4956–4963. [Google Scholar] [CrossRef] [Green Version]
- Cox, S.; Flin, R. Safety culture: Philosopher’s stone or man of straw? Work Stress 1998, 12, 189–201. [Google Scholar] [CrossRef]
- Cooper, M.D. Towards a model of safety culture. Saf. Sci. 2000, 36, 111–136. [Google Scholar] [CrossRef]
- Choudhry, R.; Fang, D.; Mohamed, S. The nature of safety culture: A survey of the state-of-the-art. Saf. Sci. 2007, 45, 993–1012. [Google Scholar] [CrossRef]
- Zohar, D.M.; Hofmann, D.A. Organizational Culture and Climate; American Psychological Association: Washington, DC, USA, 2012; Volume 1, pp. 643–666. [Google Scholar]
- Kozlowski, S.W. The Oxford Handbook of Organizational Psychology; Oxford University Press: Oxford, UK, 2012; Volume 1. [Google Scholar]
- Schein, E. (Ed.) Organizational Culture and Leadership, 2nd ed.; Jossey Bass: San Francisco, CA, USA, 1992. [Google Scholar]
- Hansez, I.; Chmiel, N. Safety behavior: Job demands, job resources, and perceived management commitment to safety. J. Occup. Health Psychol. 2010, 15, 267–278. [Google Scholar] [CrossRef]
- Joung, H.-W.; Goh, B.K.; Huffman, L.; Yuan, J.; Surles, J. Investigating relationships between internal marketing practices and employee organizational commitment in the foodservice industry. Int. J. Contemp. Hosp. Manag. 2015, 27, 1618–1640. [Google Scholar] [CrossRef]
- Kirwan, M.; Matthews, A.; Scott, P.A. The impact of the work environment of nurses on patient safety outcomes: A multi-level modelling approach. Int. J. Nurs. Stud. 2013, 50, 253–263. [Google Scholar] [CrossRef]
- Ocloo, J.; Garfield, S.; Dawson, S.; Franklin, B.D. Exploring the theory, barriers and enablers for patient and public involvement across health, social care and patient safety: A protocol for a systematic review of reviews. BMJ Open 2017, 7, e018426. [Google Scholar] [CrossRef] [PubMed] [Green Version]
- Chirico, F.; Heponiemi, T.; Pavlova, M.; Zaffina, S.; Magnavita, N. Psychosocial Risk Prevention in a Global Occupational Health Perspective. A Descriptive Analysis. Int. J. Environ. Res. Public Health 2019, 16, 2470. [Google Scholar] [CrossRef] [Green Version]
- Milczarek, M.; Brun, E.; Houtman, I.; Goudswaard, A.; Evers, M.; Bovenkamp, M.; Roskams, N.; Op de Beeck, R.; Pahkin, K.; Berthet, M.; et al. Expert Forecast on Emerging Psychosocial Risks Related to Occupational Safety and Health; Volume 5 of European Risk Observatory Report; European Agency for Safety and Health at Work: Bilbao, Spain, 2007. [Google Scholar]
- Ganzeboom, H.; Treiman, D.J. Internationally Comparable Measures of Occupational Status for the 1988 International Standard Classification of Occupations. Soc. Sci. Res. 1996, 25, 201–239. [Google Scholar] [CrossRef]
- Leka, S.; Jain, A.; World Health Organization. Health Impact of Psychosocial Hazards at Work: An Overview; WHO: Geneva, Switzerland, 2010; p. 126. [Google Scholar]
- Leka, S.; Jain, A.; Lerouge, L. Work-Related Psychosocial Risks: Key Definitions and an Overview of the Policy Context in Europe. In Psychosocial Risks in Labour and Social Security Law; Springer: Berlin/Heidelberg, Germany, 2017; pp. 1–12. [Google Scholar]
- Bergh, L.I.V.; Hinna, S.; Leka, S.; Jain, A. Developing a performance indicator for psychosocial risk in the oil and gas industry. Saf. Sci. 2014, 62, 98–106. [Google Scholar] [CrossRef]
- Ruiz, L.; Brown, M.; Li, Y.; Boots, E.; Barnes, L.; Jason, L.; Zenk, S.; Clarke, P.; Lamar, M. Neighborhood Socioeconomic Resources and Crime-Related Psychosocial Hazards, Stroke Risk, and Cognition in Older Adults. Int. J. Environ. Res. Public Health 2021, 18, 5122. [Google Scholar] [CrossRef] [PubMed]
- Cooper, C.L. (Ed.) Theories of Organizational Stress; Oup: Oxford, UK, 1998. [Google Scholar]
- Ilo, S.; Just, C.; Xhiku, F. Optimisation of multiple quality characteristics of hardfacing using grey-based Taguchi method. Mater. Des. 2012, 33, 459–468. [Google Scholar] [CrossRef]
- Kortum, E.; Leka, S.; Cox, T. Perceptions of Psychosocial Hazards, Work-related Stress and Workplace Priority Risks in Developing Countries. J. Occup. Health 2011, 53, 144–155. [Google Scholar] [CrossRef] [PubMed] [Green Version]
- Neal, A.; Griffin, M.; Hart, P. The impact of organizational climate on safety climate and individual behavior. Saf. Sci. 2000, 34, 99–109. [Google Scholar] [CrossRef]
- Naji, G.M.A.; Isha, A.S.N.; Alzoraiki, M.; Al-Mekhlafi, A.B.A.; Sharafaddin, O.; Saleem, M.S. Impact of Safety Culture And Psychosocial Hazard On Safety Performance Among Upstream Employees In Malaysia At Oil And Gas Industry. Solid State Technol. 2020, 63, 4120–4126. [Google Scholar]
- Bunner, J.; Prem, R.; Korunka, C. How Work Intensification Relates to Organization-Level Safety Performance: The Mediating Roles of Safety Climate, Safety Motivation, and Safety Knowledge. Front. Psychol. 2018, 9, 2575. [Google Scholar] [CrossRef] [PubMed]
- Chen, Y.; McCabe, B.; Hyatt, D. Impact of individual resilience and safety climate on safety performance and psychological stress of construction workers: A case study of the Ontario construction industry. J. Saf. Res. 2017, 61, 167–176. [Google Scholar] [CrossRef]
- Hinze, J.; Thurman, S.; Wehle, A. Leading indicators of construction safety performance. Saf. Sci. 2013, 51, 23–28. [Google Scholar] [CrossRef]
- Versteeg, K.; Bigelow, P.; Dale, A.M.; Chaurasia, A. Utilizing construction safety leading and lagging indicators to measure project safety performance: A case study. Saf. Sci. 2019, 120, 411–421. [Google Scholar] [CrossRef] [Green Version]
- Reiman, T.; Pietikäinen, E. Leading indicators of system safety—Monitoring and driving the organizational safety potential. Saf. Sci. 2012, 50, 1993–2000. [Google Scholar] [CrossRef]
- Tamim, N.; Laboureur, D.M.; Mentzer, R.A.; Hasan, A.R.; Mannan, M.S. A framework for developing leading indicators for offshore drillwell blowout incidents. Process. Saf. Environ. Prot. 2017, 106, 256–262. [Google Scholar] [CrossRef]
- Sarkheil, H.; Rahbari, S. HSE Key Performance indicators in HSE-MS establishment and sustainability: A case of south pars gas complex, Iran. Int. J. Occup. Hyg. 2016, 8, 45–53. [Google Scholar]
- Frankish, K.; Ramsey, W.M. (Eds.) The Cambridge Handbook of Artificial Intelligence; Cambridge University Press (CUP): Cambridge, UK, 2014. [Google Scholar]
- Ask, K.; Jasencakova, Z.; Ménard, P.; Feng, Y.; Almouzni, G.; Groth, A. Codanin-1, mutated in the anaemic disease CDAI, regulates Asf1 function in S-phase histone supply. EMBO J. 2012, 31, 2013–2023. [Google Scholar] [CrossRef] [PubMed]
- Martin, A.; Walker, K. Oil and Gas Industry Leading Health Performance Indicators. In Proceedings of the SPE International Conference on Health, Safety, and Environment, Long Beach, CA, USA, 17–19 March 2014. [Google Scholar]
- Sinelnikov, S.; Inouye, J.; Kerper, S. Using leading indicators to measure occupational health and safety performance. Saf. Sci. 2015, 72, 240–248. [Google Scholar] [CrossRef]
- Neal, A.; Griffin, M.A. Perceptions of safety at work: Developing a model to link organizational safety climate and individual behavior. In Proceedings of the 12th Annual Conference of the Society for Industrial and Organizational Psychology, St. Louis, MO, USA, 11–13 April 1997. [Google Scholar]
- Mearns, K.; Whitaker, S.M.; Flin, R. Safety climate, safety management practice and safety performance in offshore environments. Saf. Sci. 2003, 41, 641–680. [Google Scholar] [CrossRef]
- Wadsworth, E.; Smith, A. Safety Culture, Advice and Performance. Policy Pract. Health Saf. 2009, 7, 5–31. [Google Scholar] [CrossRef]
- Jasiulewicz-Kaczmarek, M.; Szwedzka, K.; Szczuka, M. Behaviour Based Intervention for Occupational Safety—Case Study. Procedia Manuf. 2015, 3, 4876–4883. [Google Scholar] [CrossRef] [Green Version]
- Molenaar, K.R.; Park, J.-I.; Washington, S. Framework for Measuring Corporate Safety Culture and Its Impact on Construction Safety Performance. J. Constr. Eng. Manag. 2009, 135, 488–496. [Google Scholar] [CrossRef] [Green Version]
- Kortum, E. Psychosocial Risks and Work-Related Stress in Developing Countries: A Call for Research and Action in Policy Development; University of Nottingham: Nottingham, UK, 2011. [Google Scholar]
- Kortum, E.; Leka, S.; Cox, T. Psychosocial risks and work-related stress in developing countries: Health impact, priorities, barriers and solutions. Int. J. Occup. Med. Environ. Health 2010, 23, 225–238. [Google Scholar] [CrossRef] [Green Version]
- Lunt, J. Health Psychology: The Missing Ingredient from Health and Safety? In Health Psychology in Action; Wiley: Hoboken, NJ, USA, 2012; p. 80. [Google Scholar]
- Rick, J.; Briner, R.B.; Daniels, K.; Perryman, S.; Guppy, A. A Critical Review of Psychosocial Hazard Measures; University of Sussex: Brighton, UK, 2001. [Google Scholar]
- Wang, H. Safety Factors and Leading Indicators in Shipping Organizations: Tanker and Container Operations; Rensselaer Polytechnic Institute: St. Troy, NY, USA, 2008. [Google Scholar]
- Siu, O.L.; Phillips, D.R.; Leung, T.W. Safety climate and safety performance among construction workers in Hong Kong: The role of psychological strains as mediators. Accid. Anal. Prev. 2004, 36, 359–366. [Google Scholar] [CrossRef]
- Manapragada, A.; Bruk-Lee, V.; Thompson, A.H.; Heron, L.M. When safety climate is not enough: Examining the moderating effects of psychosocial hazards on nurse safety performance. J. Adv. Nurs. 2019, 75, 1207–1218. [Google Scholar] [CrossRef] [PubMed]
- Emerson, R.M. Social Exchange Theory. Annu. Rev. Sociol. 1976, 2, 335–362. [Google Scholar] [CrossRef]
- Mohyaldinn, M.E.; Husin, H.; Hasan, N.; Elmubarak, M.M.; Genefid, A.M.; Dheeb, M.E. Challenges during Operation and Shutdown of Waxy Crude Pipelines. In Processing of Heavy Crude Oils—Challenges and Opportunities; IntechOpen: Rijeka, Croatia, 2019; p. 153. [Google Scholar] [CrossRef] [Green Version]
- Penkey, S.P.; Siddiqui, N.A. A review on accident pyramid and its empirical interpretation in oil & gas industry (upstream). Int. J. Sci. Res. Publ. 2015, 5, 1–3. [Google Scholar]
- Naji, G.M.A.; Isha, A.S.N.; Al-Mekhlafi, A.-B.A.; Sharafaddin, O.; Ajmal, M. Implementation of Leading and Lagging Indicators to Improve Safety Performance in the Upstream Oil and Gas Industry. J. Crit. Rev. 2020, 7, 265–269. [Google Scholar]
- Mirza, M.Z.; Isha, A.S.N. Context matters: A research agenda to move beyond conventional leadership-safety relationship. Saf. Sci. 2017, 98, 167–173. [Google Scholar] [CrossRef]
- Cox, S.; Cheyne, A. Assessing safety culture in offshore environments. Saf. Sci. 2000, 34, 111–129. [Google Scholar] [CrossRef]
- Vinodkumar, M.; Bhasi, M. Safety management practices and safety behaviour: Assessing the mediating role of safety knowledge and motivation. Accid. Anal. Prev. 2010, 42, 2082–2093. [Google Scholar] [CrossRef] [PubMed]
- Bjorner, J.B.; Pejtersen, J.H. Evaluating construct validity of the second version of the Copenhagen Psychosocial Questionnaire through analysis of differential item functioning and differential item effect. Scand. J. Public Health 2009, 38, 90–105. [Google Scholar] [CrossRef]
- Sheehan, C.; Donohue, R.; Shea, T.; Cooper, B.; De Cieri, H. Leading and lagging indicators of occupational health and safety: The moderating role of safety leadership. Accid. Anal. Prev. 2016, 92, 130–138. [Google Scholar] [CrossRef]
- Shamim, M.Y. Development and Quantitative Evaluation of Leading and Lagging Metrics for PHA, OP, and EPR for Process Safety Performance; Universiti Teknologi PETRONAS: Seri Iskandar, Malaysia, 2019. [Google Scholar]
- Ringle, C.M.; Wende, S.; Becker, J.-M. SmartPLS 3.; SmartPLS GmbH: Boenningstedt, Germany, 2015. [Google Scholar]
- Williams, L.J.; Vandenberg, R.J.; Edwards, J.R. 12 structural equation modeling in management research: A guide for improved analysis. Acad. Manag. Ann. 2009, 3, 543–604. [Google Scholar] [CrossRef]
- Lei, P.-W.; Wu, Q. Introduction to Structural Equation Modeling: Issues and Practical Considerations. Educ. Meas. Issues Pract. 2007, 26, 33–43. [Google Scholar] [CrossRef]
- Anderson, J.C.; Gerbing, D.W. Structural equation modeling in practice: A review and recommended two-step approach. Psychol. Bull. 1988, 103, 411. [Google Scholar] [CrossRef]
- Faul, F.; Erdfelder, E.; Lang, A.; Buchner, A. G* Power (Version 3.1. 9.2); Software; Universitat Kiel: Kiel, Germany, 2014. [Google Scholar]
- Reinartz, W.; Haenlein, M.; Henseler, J. An empirical comparison of the efficacy of covariance-based and variance-based SEM. Int. J. Res. Mark. 2009, 26, 332–344. [Google Scholar] [CrossRef] [Green Version]
- Reimer, B.; D’Ambrosio, L.A.; Coughlin, J.F.; Fried, R.; Biederman, J. Task-Induced Fatigue and Collisions in Adult Drivers with Attention Deficit Hyperactivity Disorder. Traffic Inj. Prev. 2007, 8, 290–299. [Google Scholar] [CrossRef]
- Kecklund, L.; Ingre, M.; Kecklund, G.; Söderström, M.; Åkerstedt, T.; Lindberg, E.; Jansson, A.; Olsson, E.; Sandblad, B.; Almqvist, P. The TRAIN-project: Railway safety and the train driver information environment and work situation-A summary of the main results. In Proceedings of the Signalling Safety 2001, London, UK, 26–27 February 2001; pp. 26–27. [Google Scholar]
- Jap, B.T.; Lal, S.; Fischer, P. Inter-hemispheric electroencephalography coherence analysis: Assessing brain activity during monotonous driving. Int. J. Psychophysiol. 2010, 76, 169–173. [Google Scholar] [CrossRef] [Green Version]
- Mohd Azlis Sani, M.J. Development of an Integrated Train Driver Performance Model/Mohd Azlis Sani Md Jalil; University of Malaya: Kuala Lumpur, Malaysia, 2015. [Google Scholar]
- Ghaleb, E.; Dominic, P.; Fati, S.; Muneer, A.; Ali, R. The Assessment of Big Data Adoption Readiness with a Technology–Organization–Environment Framework: A Perspective towards Healthcare Employees. Sustainability 2021, 13, 8379. [Google Scholar] [CrossRef]
- MacKinnon, D.P. Integrating Mediators and Moderators in Research Design. Res. Soc. Work. Pract. 2011, 21, 675–681. [Google Scholar] [CrossRef] [Green Version]
- Hamidun, R.; Hoong, A.P.W.; Roslan, A.; Shabadin, A.; Jamil, H. Characteristics of heavy goods vehicles (HGV) accidents in Malaysia. IOP Conf. Series Mater. Sci. Eng. 2019, 512, 012021. [Google Scholar] [CrossRef]
- Bergh, L.I.V.; Leka, S.; Zwetsloot, G.I. Tailoring Psychosocial Risk Assessment in the Oil and Gas Industry by Exploring Specific and Common Psychosocial Risks. Saf. Health Work. 2018, 9, 63–70. [Google Scholar] [CrossRef]
- Al-Mekhlafi, A.-B.A.; Isha, A.S.N.; Naji, G.M.A. The relationship between fatigue and driving performance: A review and directions for future research. J. Crit. Rev. 2020, 7, 134–141. [Google Scholar]
- Nkrumah, E.; Liu, S.; Fiergbor, D.D.; Akoto, L. Improving the Safety–Performance Nexus: A Study on the Moderating and Mediating Influence of Work Motivation in the Causal Link between Occupational Health and Safety Management (OHSM) Practices and Work Performance in the Oil and Gas Sector. Int. J. Environ. Res. Public Health 2021, 18, 5064. [Google Scholar] [CrossRef]
- Shaikh, S.A. Impact of Internal Marketing and Human Resource Management to Foster Customer Oriented Behavior among Employees: A Study on Mega Retail Stores in Karachi. NICE Res. J. 2018, 183–199. [Google Scholar] [CrossRef]
- Al-Mekhlafi, A.-B.; Isha, A.; Chileshe, N.; Abdulrab, M.; Saeed, A.; Kineber, A. Modelling the Relationship between the Nature of Work Factors and Driving Performance Mediating by Role of Fatigue. Int. J. Environ. Res. Public Health 2021, 18, 6752. [Google Scholar] [CrossRef]
- Bauer, I.M.; Baumeister, R.F. Self-regulatory strength. In Handbook of Self-Regulation: Research, Theory, and Applications; Guilford Publications: New York, NY, USA, 2011; Volume 2, pp. 64–82. [Google Scholar]
- Javaid, M.U.; Isha, A.S.N.; Ghazali, Z.; Langove, N. Psychosocial stressors in relation to unsafe acts. Int. Rev. Manag. Mark. 2016, 6, 4S. [Google Scholar]
- Wetzels, M.; Odekerken-Schröder, G.; Van Oppen, C. Using PLS Path Modeling for Assessing Hierarchical Construct Models: Guidelines and Empirical Illustration. MIS Q. 2009, 33, 177. [Google Scholar] [CrossRef]
- Mikalef, P.; Pateli, A. Information technology-enabled dynamic capabilities and their indirect effect on competitive performance: Findings from PLS-SEM and fsQCA. J. Bus. Res. 2017, 70, 1–16. [Google Scholar] [CrossRef]
- Aboelmaged, M. The drivers of sustainable manufacturing practices in Egyptian SMEs and their impact on competitive capabilities: A PLS-SEM model. J. Clean. Prod. 2018, 175, 207–221. [Google Scholar] [CrossRef]
- Zeng, F.; Huang, W.-C.; Hueng, C.J. On Chinese Government’s Stock Market Rescue Efforts in 2015. Mod. Econ. 2016, 7, 411–418. [Google Scholar] [CrossRef] [Green Version]
- Henseler, J.; Ringle, C.M.; Sarstedt, M. A new criterion for assessing discriminant validity in variance-based structural equation modeling. J. Acad. Mark. Sci. 2015, 43, 115–135. [Google Scholar] [CrossRef] [Green Version]
- Kineber, A.F.; Othman, I.; Oke, A.E.; Chileshe, N.; Alsolami, B. Critical Value Management Activities in Building Projects: A Case of Egypt. Buildings 2020, 10, 239. [Google Scholar] [CrossRef]
- Love, P.E.D.; Davis, P.R.; Chevis, R.; Edwards, D.J. Risk/Reward Compensation Model for Civil Engineering Infrastructure Alliance Projects. J. Constr. Eng. Manag. 2011, 137, 127–136. [Google Scholar] [CrossRef]
- Falk, R.F.; Miller, N.B. A Primer for Soft Modeling; University of Akron Press: Akron, OH, USA, 1992. [Google Scholar]
- Ab Hamid, M.R.; Sami, W.; Sidek, M.H.M. Discriminant Validity Assessment: Use of Fornell & Larcker criterion versus HTMT Criterion. J. Phys. Conf. Ser. 2017, 890, 012163. [Google Scholar] [CrossRef]
- Ryan, B.; Wilson, J.R.; Sharples, S.; Clarke, T. Attitudes and opinions of railway signallers and related staff, using the Rail Ergonomics Questionnaire (REQUEST). Appl. Ergon. 2008, 40, 230–238. [Google Scholar] [CrossRef] [PubMed]
- Austin, A.; Drummond, P. Work problems associated with suburban train driving. Appl. Ergon. 1986, 17, 111–116. [Google Scholar] [CrossRef]
- Cohen, J. In Statistical Power Analysis for the Behaviour Sciences (Revised Edition). Biometrics 1988, 73, 19–74. [Google Scholar]
- Cheung, G.W.; Lau, R.S. Testing mediation and suppression effects of latent variables: Bootstrapping with structural equation models. Org. Res. Methods 2008, 11, 296–325. [Google Scholar] [CrossRef]
- Hayes, A.F.; Scharkow, M. The relative trustworthiness of inferential tests of the indirect effect in statistical mediation analysis: Does method really matter? Psychol. Sci. 2013, 24, 1918–1927. [Google Scholar] [CrossRef] [PubMed]
- Hobfoll, S.E. Conservation of resources: A new attempt at conceptualizing stress. Am. Psychol. 1989, 44, 513. [Google Scholar] [CrossRef]
- Zhang, J.; Bal, P.M.; Akhtar, M.N.; Long, L.; Zhang, Y.; Ma, Z. High-performance work system and employee performance: The mediating roles of social exchange and thriving and the moderating effect of employee proactive personality. Asia Pac. J. Hum. Resour. 2019, 57, 369–395. [Google Scholar] [CrossRef]
- Zadow, A.J.; Dollard, M.F.; McLinton, S.; Lawrence, P.; Tuckey, M.R. Psychosocial safety climate, emotional exhaustion, and work injuries in healthcare workplaces. Stress Health 2017, 33, 558–569. [Google Scholar] [CrossRef]
- Zohar, D. Thirty years of safety climate research: Reflections and future directions. Accid. Anal. Prev. 2010, 42, 1517–1522. [Google Scholar] [CrossRef]
- Yang, R. Safety in Construction: Connecting Safety Climate, Safety Performance, and Leading Indicators; University of Toronto: Toronto, ON, Canada, 2021. [Google Scholar]
- Sommer, M.; Ness, O.; Borg, M. Helpful support to promote participation in school and work: Subjective experiences of people with mental health problems—A literature review. Soc. Work. Ment. Health 2017, 16, 346–366. [Google Scholar] [CrossRef]
- Morrow, S.L.; Koves, G.K.; Barnes, V.E. Exploring the relationship between safety culture and safety performance in U.S. nuclear power operations. Saf. Sci. 2014, 69, 37–47. [Google Scholar] [CrossRef]
- Bagozzi, R.P.; Yi, Y. On the evaluation of structural equation models. J. Acad. Mark. Sci. 1988, 16, 74–94. [Google Scholar] [CrossRef]
- Naji, G.M.A.; Isha, A.N.; Abd, S.M.N.B.S. The Role of HR Strategy on Safety Culture and Psychological Stress among Employees in the Upstream Oil and Gas Companies: A Conceptual Review. Solid State Technol. 2020, 63, 9118–9128. [Google Scholar]
- Lei, Z.; Tang, W.; Duffield, C.F.; Zhang, L.; Hui, F.K.P.; You, R. Qualitative Analysis of the Occupational Health and Safety Performance of Chinese International Construction Projects. Sustainability 2018, 10, 4344. [Google Scholar] [CrossRef] [Green Version]
- Preacher, K.J.; Hayes, A.F. Asymptotic and resampling strategies for assessing and comparing indirect effects in multiple mediator models. Behav. Res. Methods 2008, 40, 879–891. [Google Scholar] [CrossRef] [PubMed]
- Gao, R.; Chan, A.P.; Utama, W.P.; Zahoor, H. Multilevel Safety Climate and Safety Performance in the Construction Industry: Development and Validation of a Top-Down Mechanism. Int. J. Environ. Res. Public Health 2016, 13, 1100. [Google Scholar] [CrossRef] [Green Version]
- Kalteh, H.O.; Mortazavi, S.B.; Mohammadi, E.; Salesi, M. The relationship between safety culture and safety climate and safety performance: A systematic review. Int. J. Occup. Saf. Ergon. 2021, 27, 206–216. [Google Scholar] [CrossRef] [PubMed]
- Yiu, N.S.; Chan, D.W.; Sze, N.; Shan, M. Implementation of Safety Management System for Improving Construction Safety Performance: A Structural Equation Modelling Approach. Buildings 2019, 9, 89. [Google Scholar] [CrossRef] [Green Version]
- Zahoor, H.; Chan, A.P.C.; Utama, W.P.; Gao, R.; Zafar, I. Modeling the Relationship between Safety Climate and Safety Performance in a Developing Construction Industry: A Cross-Cultural Validation Study. Int. J. Environ. Res. Public Health 2017, 14, 351. [Google Scholar] [CrossRef] [PubMed] [Green Version]
- Grecco, C.H.D.S.; Vidal, M.C.R.; Cosenza, C.A.N.; Dos Santos, I.J.A.L.; De Carvalho, P.V.R. Safety culture assessment: A fuzzy model for improving safety performance in a radioactive installation. Prog. Nucl. Energy 2014, 70, 71–83. [Google Scholar] [CrossRef]
- Mannan, M.S.; Reyes-Valdes, O.; Jain, P.; Tamim, N.; Ahammad, M. The Evolution of Process Safety: Current Status and Future Direction. Annu. Rev. Chem. Biomol. Eng. 2016, 7, 135–162. [Google Scholar] [CrossRef] [PubMed]

| References | Safety Culture Definitions |
|---|---|
| [23] | Safety culture is considered the values, perceptions, attitudes, behaviors of individuals and groups that evaluate the commitment to health and safety management. |
| [24] | Culture interacts between people’s psychological and work behavior in the organization. Safety culture observes the efforts of organizational members and draws their attention towards daily safety improvement. |
| [15] | Safety culture is characterized as all elements of organizational culture that affect the behaviors and attitudes associated with increased or decreased risk. |
| [25] | To direct people’s activities toward risk, accidents, and prevention, it is required to share and understand all related definitions, experiences, and safety perceptions. |
| [26] | Employees’ decisions also depend on the organizational culture, which influences the overall company’s achievement. |
| [27] | Organizational culture in the workplace can be complex and comprehensive, yet ambiguous enough to be observed by the employees. In other words, if employees could not adapt to their organization’s culture, they will be thought of as outsiders. |
| [28] | A group’s safety culture evolves and changes through time as a result of changes in a variety of influencing elements such as leadership, management techniques, business environment, and formal and informal socialization processes. |
| Construct | Categories | Frequency | Responses % |
|---|---|---|---|
| Gender | Male | 371 | 97.63 |
| Female | 9 | 2.37 | |
| Age | 20–29 Years | 50 | 13.16 |
| 30–39 Years | 210 | 55.26 | |
| 40–49 Years | 90 | 23.68 | |
| 50–59 Years | 30 | 7.90 | |
| Work Experience | 1–5 Years | 102 | 26.84 |
| 6–10 Years | 127 | 33.42 | |
| 11–15 Years | 45 | 11.84 | |
| 16–20 | 64 | 16.84 | |
| 21 Years and above | 42 | 11.06 | |
| Marital Status | Single | 62 | 16.32 |
| Married | 295 | 77.63 | |
| Divorced | 23 | 6.05 | |
| Education | Graduate/Postgraduate | 7 | 1.84 |
| College | 53 | 13.94 | |
| Secondary | 312 | 82.11 | |
| Primary | 8 | 2.11 |
| Constructs | Dimensions | No. of Items | References |
|---|---|---|---|
| Safety Culture | 16 | [73,74] | |
| Management Commitment (MC) | 6 | ||
| Work Environment (WE) | 5 | ||
| Involvement (INV) | 5 | ||
| Safety Performance | 9 | [76,77] | |
| Leading (SPLD) | 4 | ||
| Lagging (SPLG) | 5 | ||
| Psychosocial Hazard (PSH) | 5 | [75] |
| Laten Variable | (AVE) | R Square |
|---|---|---|
| INV | 0.761 | 0.29 |
| Lagging | 0.624 | 0.885 |
| Leading | 0.711 | 0.853 |
| MC | 0.66 | 0.801 |
| Safety Culture | 0.648 | |
| Safety Performance | 0.635 | 0.209 |
| WE | 0.575 | 0.779 |
| Psychosocial Hazard | 0.662 | 0.358 |
| Average The goodness of Fit GoF | 0.6585 | 0.5964 0.61 |
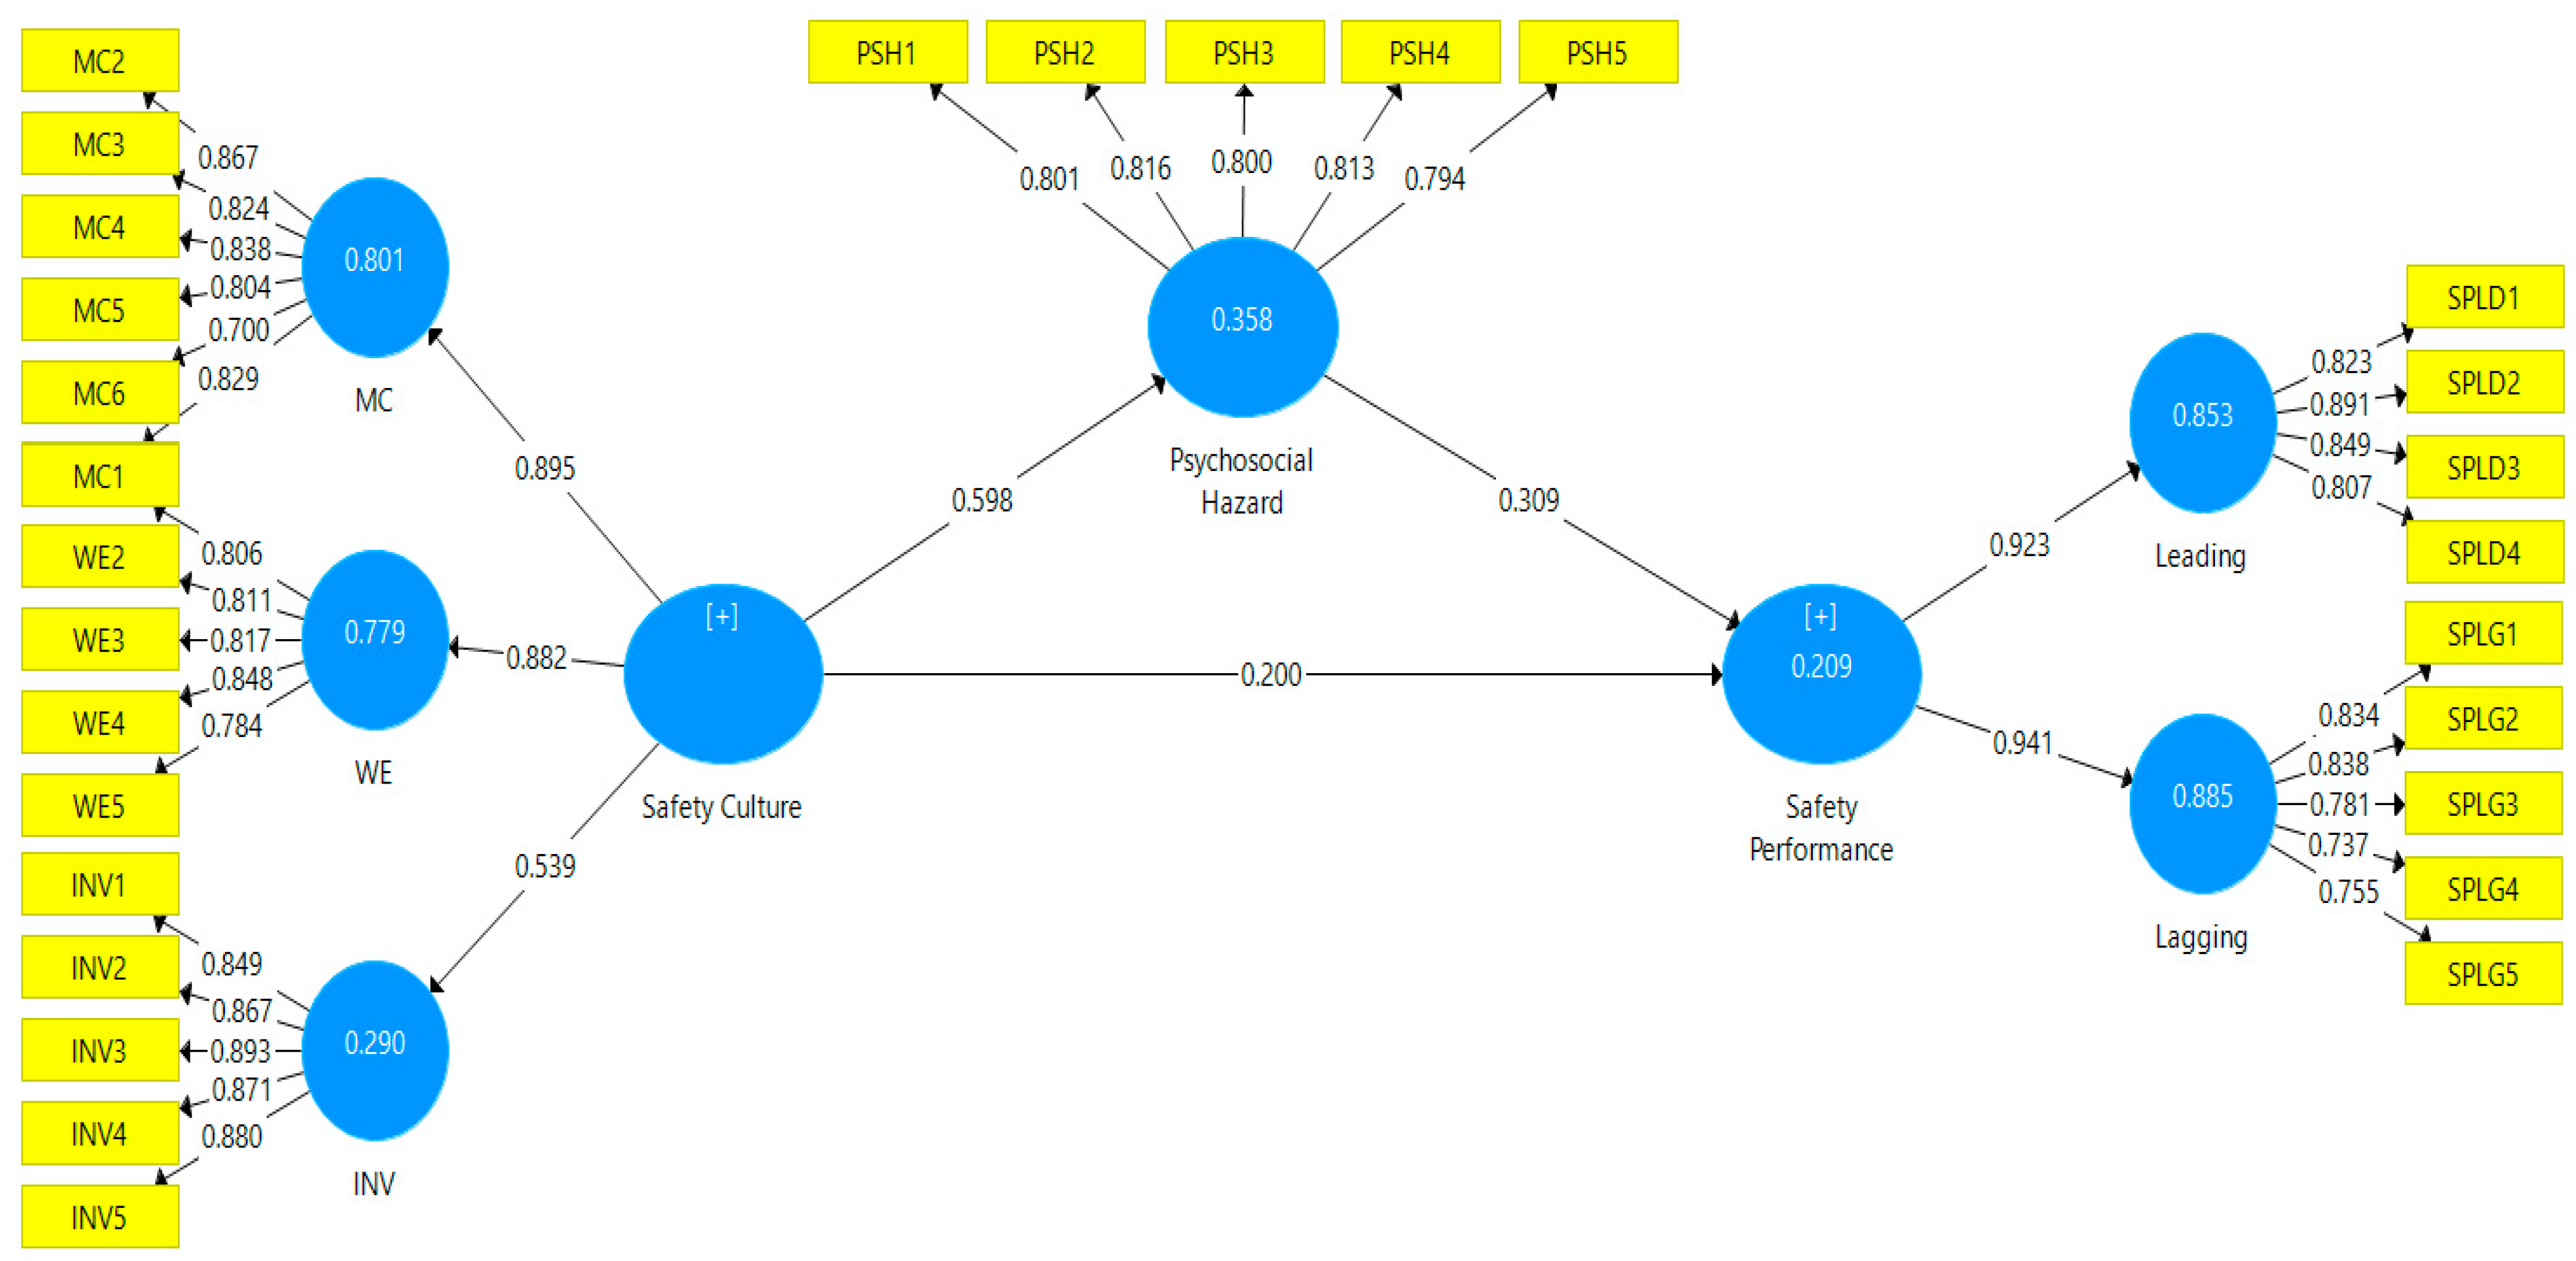
| Constructs | Path Relationship | SIL | CA | CR | AVE | Value | |
|---|---|---|---|---|---|---|---|
| SC | 0.907 | 0.920 | 0.635 | - | - | ||
| MC1←SC | 0.829 | ||||||
| MC2←SC | 0.867 | ||||||
| MC3←SC | 0.824 | ||||||
| MC4←SC | 0.838 | ||||||
| MC5←SC | 0.804 | ||||||
| MC6←SC | 0.700 | ||||||
| WE1←SC | 0.806 | ||||||
| WE2←SC | 0.811 | ||||||
| WE3←SC | 0.817 | ||||||
| WE4←SC | 0.848 | ||||||
| WE5←SC | 0.784 | ||||||
| INV1←SC | 0.849 | ||||||
| INV2←SC | 0.867 | ||||||
| INV3←SC | 0.893 | ||||||
| INV4←SC | 0.871 | ||||||
| INV5←SC | 0.880 | ||||||
| PSH | 0.864 | 0.902 | 0.648 | 0.209 | Medium | ||
| PSH1←PSH | 0.801 | ||||||
| PSH2←PSH | 0.816 | ||||||
| PSH3←PSH | 0.800 | ||||||
| PSH4←PSH | 0.813 | ||||||
| PSH5←PSH | 0.794 | ||||||
| SP | 0.907 | 0.924 | 0.575 | 0.358 | Substantial | ||
| LD1←SP | 0.823 | ||||||
| LD2←SP | 0.891 | ||||||
| LD3←SP | 0.849 | ||||||
| LD4←SP | 0.807 | ||||||
| LG1←SP | 0.834 | ||||||
| LG2←SP | 0.838 | ||||||
| LG3←SP | 0.781 | ||||||
| LG4←SP | 0.737 | ||||||
| LG5←SP | 0.755 |
| INV | LG | LD | MC | PSH | SC | SP | WE | |
|---|---|---|---|---|---|---|---|---|
| INV | 0.872 | |||||||
| LG | 0.193 | 0.79 | ||||||
| LD | 0.196 | 0.739 | 0.843 | |||||
| MC | 0.221 | 0.347 | 0.24 | 0.812 | ||||
| PSH | 0.61 | 0.429 | 0.365 | 0.432 | 0.805 | |||
| SC | 0.539 | 0.406 | 0.303 | 0.589 | 0.598 | 0.654 | ||
| SP | 0.208 | 0.419 | 0.329 | 0.319 | 0.429 | 0.385 | 0.759 | |
| WE | 0.241 | 0.396 | 0.278 | 0.754 | 0.429 | 0.285 | 0.366 | 0.814 |
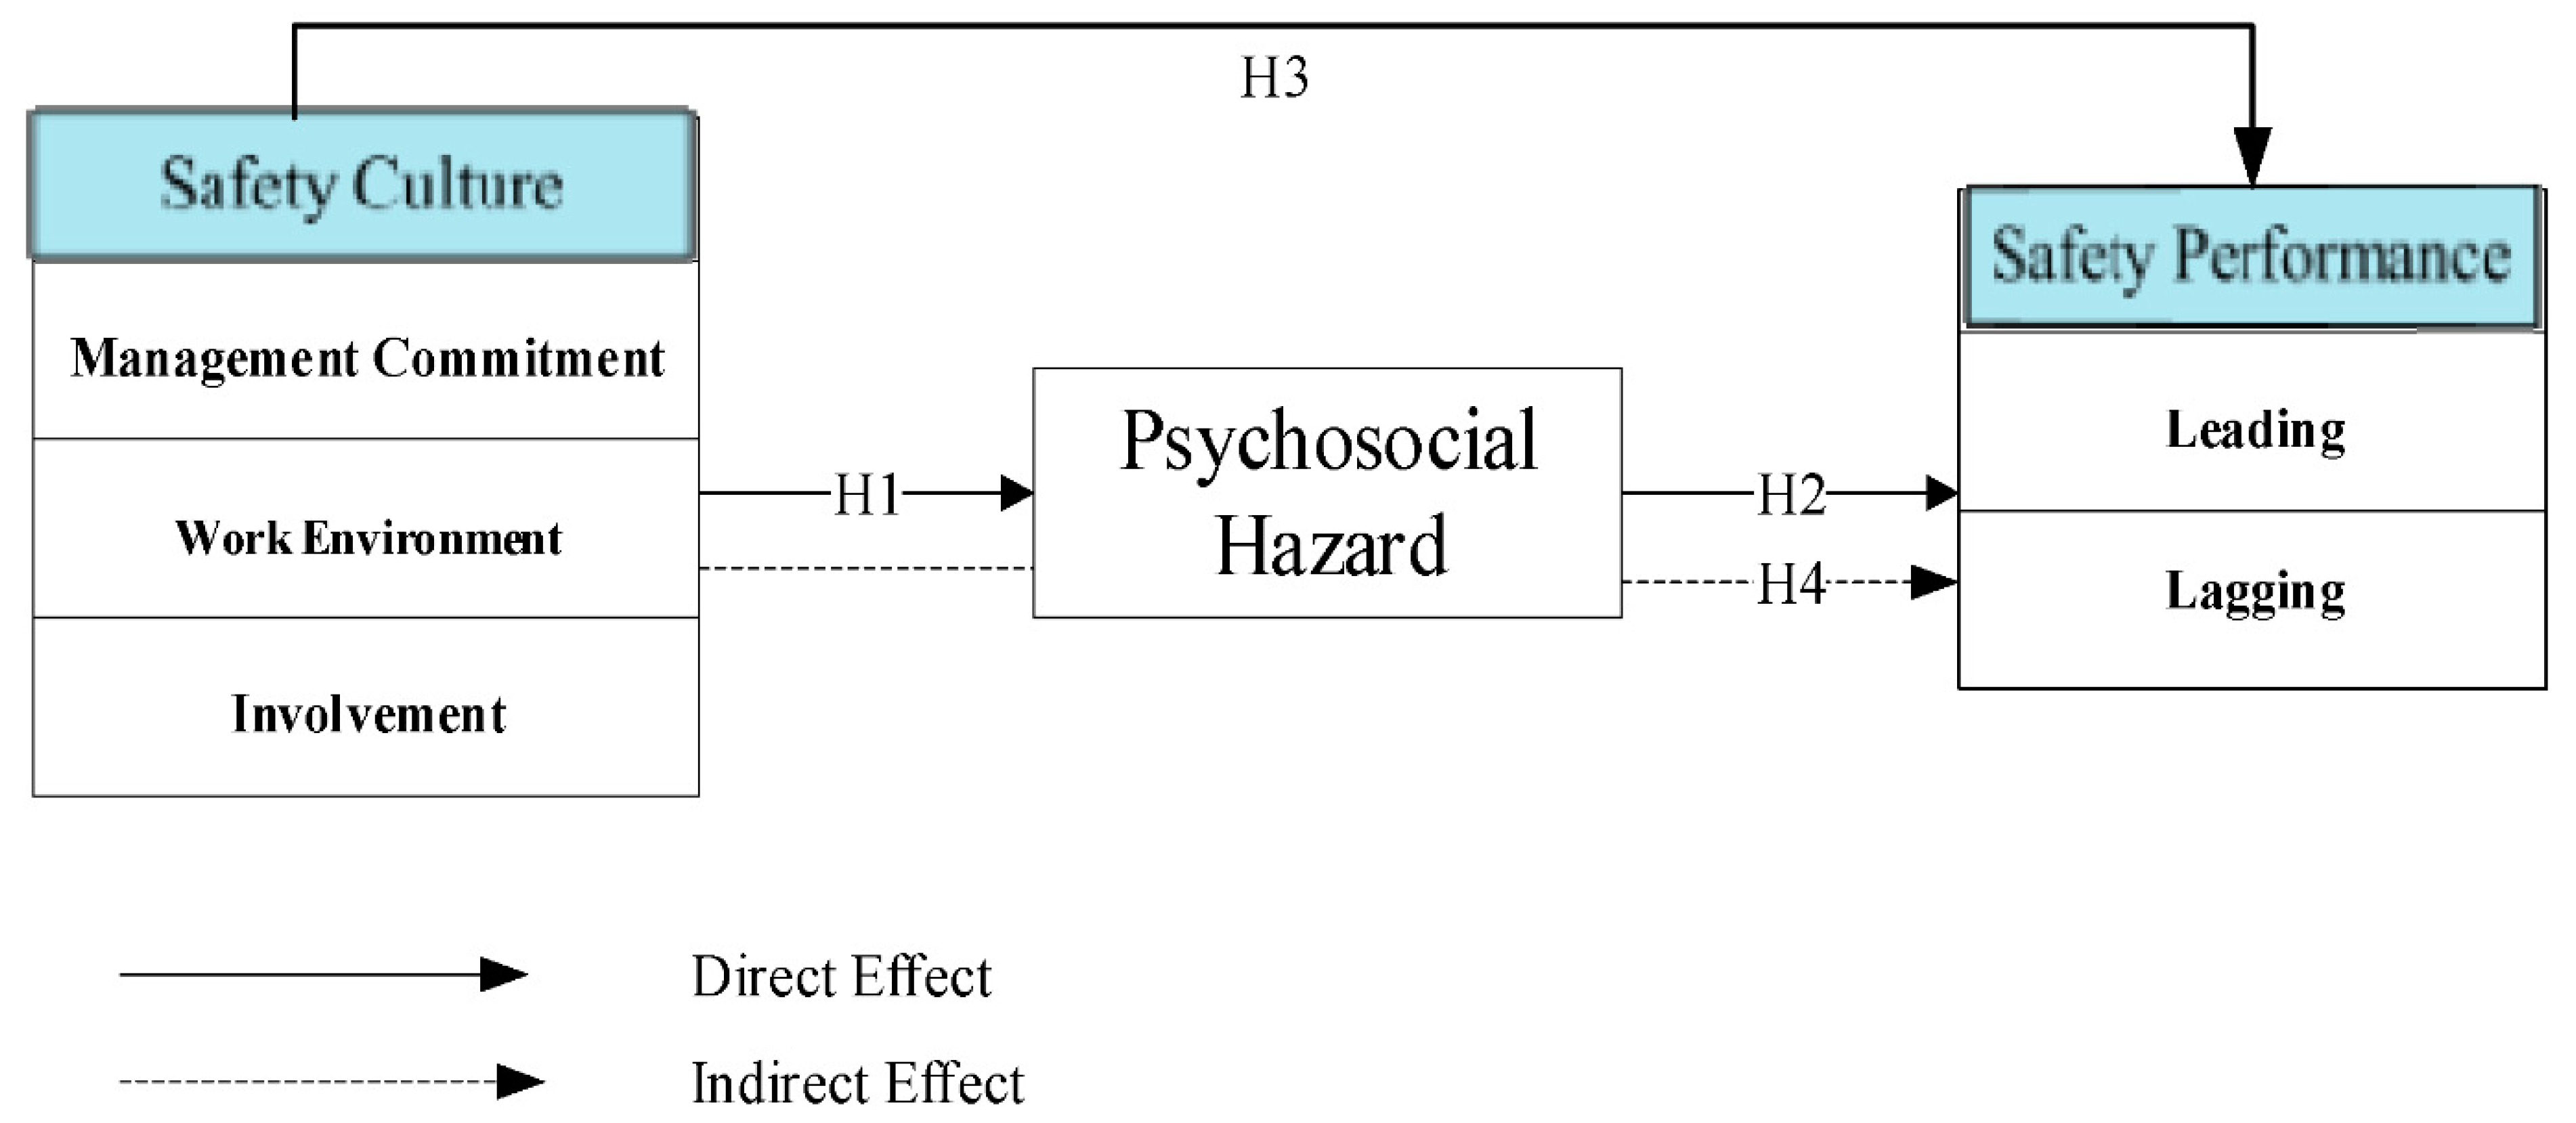
| Hypothesis | H1 | H2 | H3 |
|---|---|---|---|
| Path Relationship | SC→PSH | PSH→SP | SC→SP |
| Path coefficients β | 0.598 | 0.309 | 0.2 |
| Standard Error | 0.041 | 0.073 | 0.069 |
| T values | 14.619 | 4.22 | 2.881 |
| p values | 0.000 | 0.000 | 0.004 |
| Significance level | *** | *** | *** |
| Results | Supported | Supported | Supported |
| Mediation Effect | Path Coef | SD | t-Value | 95% LL | 95% UL | Results |
|---|---|---|---|---|---|---|
| SC-PSH-SP | 0.185 ** | 0.047 | 3.946 | 0.092 | 0.277 | Partial Mediation |
Publisher’s Note: MDPI stays neutral with regard to jurisdictional claims in published maps and institutional affiliations. |
© 2021 by the authors. Licensee MDPI, Basel, Switzerland. This article is an open access article distributed under the terms and conditions of the Creative Commons Attribution (CC BY) license (https://creativecommons.org/licenses/by/4.0/).
Share and Cite
Naji, G.M.A.; Isha, A.S.N.; Mohyaldinn, M.E.; Leka, S.; Saleem, M.S.; Rahman, S.M.N.B.S.A.; Alzoraiki, M. Impact of Safety Culture on Safety Performance; Mediating Role of Psychosocial Hazard: An Integrated Modelling Approach. Int. J. Environ. Res. Public Health 2021, 18, 8568. https://doi.org/10.3390/ijerph18168568
Naji GMA, Isha ASN, Mohyaldinn ME, Leka S, Saleem MS, Rahman SMNBSA, Alzoraiki M. Impact of Safety Culture on Safety Performance; Mediating Role of Psychosocial Hazard: An Integrated Modelling Approach. International Journal of Environmental Research and Public Health. 2021; 18(16):8568. https://doi.org/10.3390/ijerph18168568
Chicago/Turabian StyleNaji, Gehad Mohammed Ahmed, Ahmad Shahrul Nizam Isha, Mysara Eissa Mohyaldinn, Stavroula Leka, Muhammad Shoaib Saleem, Syed Mohamed Nasir Bin Syed Abd Rahman, and Mohammed Alzoraiki. 2021. "Impact of Safety Culture on Safety Performance; Mediating Role of Psychosocial Hazard: An Integrated Modelling Approach" International Journal of Environmental Research and Public Health 18, no. 16: 8568. https://doi.org/10.3390/ijerph18168568
APA StyleNaji, G. M. A., Isha, A. S. N., Mohyaldinn, M. E., Leka, S., Saleem, M. S., Rahman, S. M. N. B. S. A., & Alzoraiki, M. (2021). Impact of Safety Culture on Safety Performance; Mediating Role of Psychosocial Hazard: An Integrated Modelling Approach. International Journal of Environmental Research and Public Health, 18(16), 8568. https://doi.org/10.3390/ijerph18168568