
The Demand–Control Model as a Predictor of Depressive Symptoms—Interaction and Differential Subscale Effects: Prospective Analyses of 2212 German Employees


 ,
,  , ,
, , 
Abstract
:1. Introduction
- Regarding the supposed interaction of psychological demands and job control, the combined effect of high psychological demands and low job control on depressive symptoms is stronger than their mere sum (i.e., superadditivity).
- Regarding differential effects on depressive symptoms of the subscales of psychological demands and job control: 2.a. the subscales of work pace and amount of work have similar associations with depressive symptoms; 2.b. the subscales of decision authority and skill discretion have similar associations with depressive symptoms.
2. Materials and Methods
2.1. Study Overview
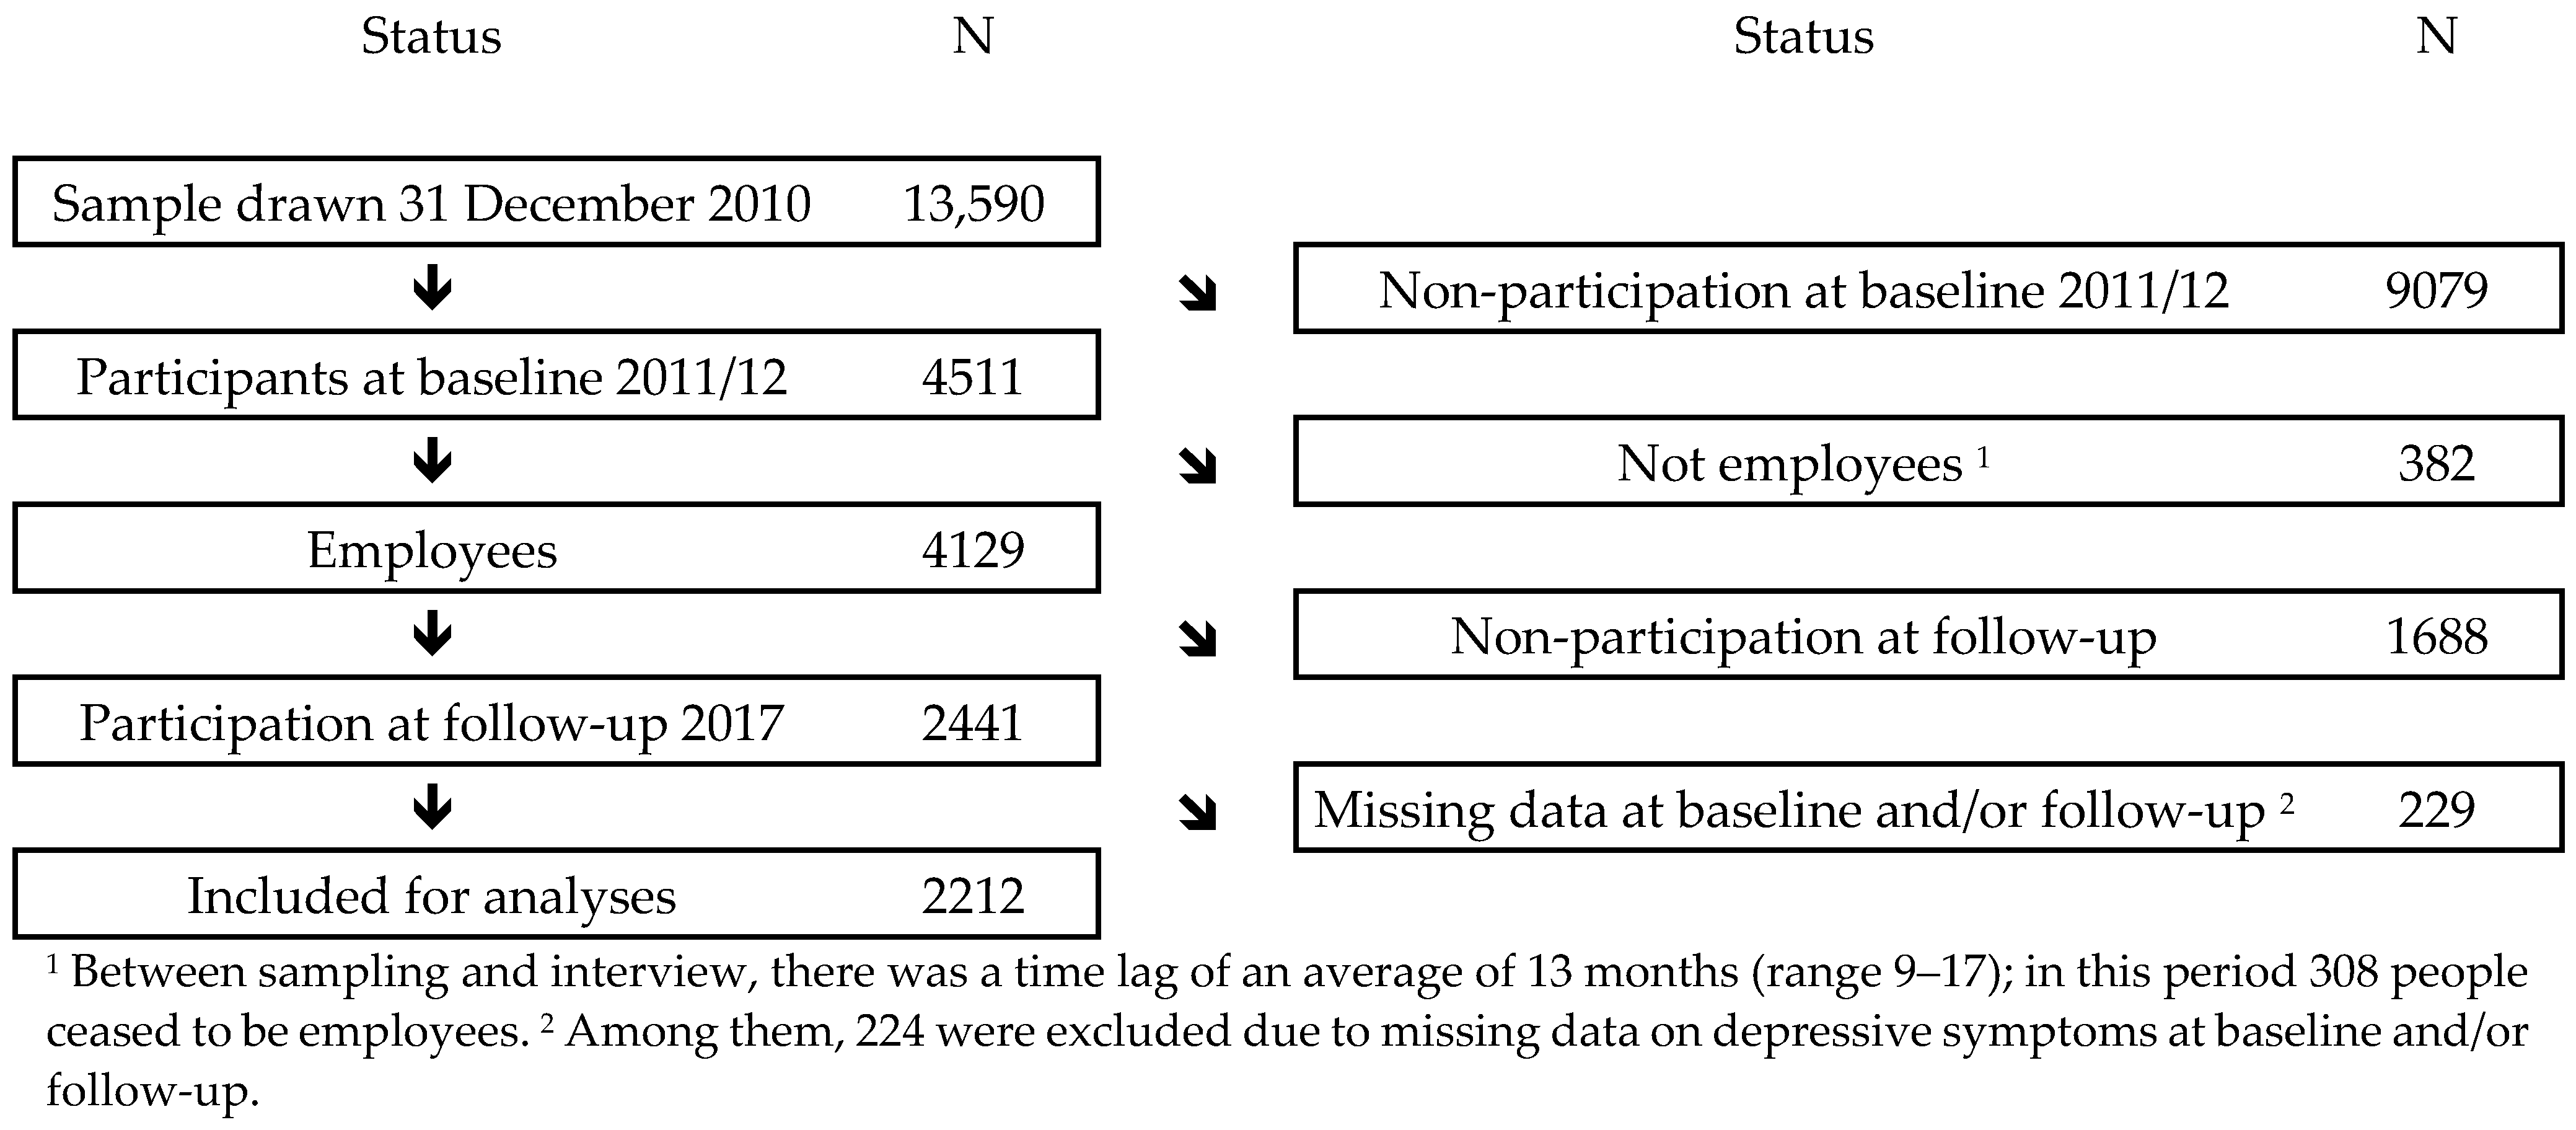
2.2. Population
2.3. Variables
2.3.1. Dependent Variable
2.3.2. Independent Variables
2.4. Analyses
2.4.1. Interaction Analyses
2.4.2. Differential Subscale Effect Analyses
2.4.3. Significance Level and Software Used
3. Results
3.1. Interaction Analysis
3.2. Differential Subscale Effect Analyses
3.2.1. Psychological Demand Subscales
3.2.2. Job Control Subscales
4. Discussion
4.1. Comparison with Other Studies
4.2. Strengths and Weaknesses
5. Conclusions
Author Contributions
Funding
Institutional Review Board Statement
Informed Consent Statement
Data Availability Statement
Acknowledgments
Conflicts of Interest
Appendix A

| DC Quadrants (Based on Medians) | N | Observed Prevalence of Depressive Symptoms at Follow-Up (%) | p1 | RR 2 | 95% CI | RERI 2,3 | 95% CI |
|---|---|---|---|---|---|---|---|
| 0.179 | |||||||
| Low strain | 547 | 5 | 1 | ||||
| Passive | 530 | 9 | 1.61 | 1.01; 2.56 | |||
| Active | 492 | 6 | 1.23 | 0.75; 2.02 | |||
| Strain | 470 | 9 | 1.56 | 0.98; 2.51 | −0.28 | −1.17; 0.61 |
| DC Quadrants (Value Based 1) | N | Observed Prevalence of Depressive Symptoms at Follow-Up (%) | p2 | RR 3 | 95% CI | RERI 3,§ | 95% CI |
|---|---|---|---|---|---|---|---|
| 0.087 | |||||||
| Low strain | 492 | 6 | 1 | ||||
| Passive | 238 | 10 | 1.37 | 0.84; 2.34 | |||
| Active | 967 | 9 | 1.38 | 0.93; 2.03 | |||
| Strain | 515 | 16 | 1.66 | 1.12; 2.48 | −0.08 | −0.81; 0.63 |
| Dimension | Subscale | N | Observed Prevalence of Depressive Symptoms at Follow-Up (%) | p 1 | RR 2 | 95% CI |
|---|---|---|---|---|---|---|
| Psychological demands | Work pace | 0.510 | ||||
| Low (≤1) 3 | 243 | 8 | 1 | |||
| Medium (2) 3 | 579 | 9 | 0.91 | 0.57; 1.46 | ||
| High (≥3) 3 | 1390 | 11 | 1.08 | 0.70; 1.65 | ||
| Amount of work | 0.103 | |||||
| Low (<1⅓) 4 | 741 | 8 | 1 | |||
| Medium (1⅓–<2⅔) 4 | 1015 | 10 | 1.19 | 0.88; 1.61 | ||
| High (≥2⅔) 4 | 456 | 15 | 1.41 | 1.02; 1.94 | ||
| Job control | Decision authority | 0.110 | ||||
| Low (<1⅓) 4 | 667 | 13 | 1.59 | 1.03; 2.44 | ||
| Medium (1⅓–<2⅔) 4 | 1111 | 10 | 1.46 | 0.97; 2.22 | ||
| High (≥2⅔) 4 | 434 | 6 | 1 | |||
| Skill discretion | 0.528 | |||||
| Low (<1⅓) 4 | 113 | 10 | 0.81 | 0.50; 1.33 | ||
| Medium (1⅓–<2⅔) 4 | 536 | 12 | 1.06 | 0.83; 1.36 | ||
| High (≥2⅔) 4 | 1598 | 9 | 1 |
References
- Burr, H.; d’Errico, A. Priority, methodological and conceptual issues regarding epidemiological research of occupational psychosocial risk factors for poor mental health and coronary heart disease. Sociol. Del. Lav. 2018, 63, 159–181. [Google Scholar] [CrossRef]
- Karasek, R.A. Job Demands, Job Decision Latitude, and Mental Strain: Implications for Job Redesign. Adm. Sci. Q. 1979, 24, 285–308. [Google Scholar] [CrossRef]
- Karasek, R.; Theorell, T. Healthy Work: Stress, Productivity, and the Reconstruction of Working Life; Basic Books: New York, NY, USA, 1990. [Google Scholar]
- Karasek, R. Job Content Questionnaire and User’s Guide, Rev. 1.7; University of Massachusetts-Lowel: Lowell, MA, USA, 1997. [Google Scholar]
- Choi, B.; Kawakami, N.; Chang, S.; Koh, S.; Bjorner, J.; Punnett, L.; Karasek, R. A cross-national study on the multidimensional characteristics of the five-item psychological demands scale of the Job Content Questionnaire. Int. J. Behav. Med. 2008, 15, 120–132. [Google Scholar] [CrossRef] [PubMed]
- Madsen, I.E.H.; Nyberg, S.T.; Magnusson Hanson, L.L.; Ferrie, J.E.; Ahola, K.; Alfredsson, L.; Batty, G.D.; Bjorner, J.B.; Borritz, M.; Burr, H.; et al. Job strain as a risk factor for clinical depression: Systematic review and meta-analysis with additional individual participant data. Psychol. Med. 2017, 47, 1342–1356. [Google Scholar] [CrossRef] [PubMed] [Green Version]
- Theorell, T.; Hammarstrom, A.; Aronsson, G.; Traskman Bendz, L.; Grape, T.; Hogstedt, C.; Marteinsdottir, I.; Skoog, I.; Hall, C. A systematic review including meta-analysis of work environment and depressive symptoms. BMC Public Health 2015, 15, 738. [Google Scholar] [CrossRef] [PubMed] [Green Version]
- Clays, E.; de Bacquer, D.; Leynen, F.; Kornitzer, M.; Kittel, F.; de Backer, G. Job stress and depression symptoms in middle-aged workers--prospective results from the Belstress study. Scand. J. Work Environ. Health 2007, 33, 252–259. [Google Scholar] [CrossRef] [PubMed] [Green Version]
- Niedhammer, I.; Goldberg, M.; Leclerc, A.; Bugel, I.; David, S. Psychosocial factors at work and subsequent depressive symptoms in the Gazel cohort. Scand. J. Work Environ. Health 1998, 24, 197–205. [Google Scholar] [CrossRef] [Green Version]
- Virtanen, M.; Honkonen, T.; Kivimaki, M.; Ahola, K.; Vahtera, J.; Aromaa, A.; Lonnqvist, J. Work stress, mental health and antidepressant medication findings from the Health 2000 Study. J. Affect. Disord. 2007, 98, 189–197. [Google Scholar] [CrossRef]
- Fandino-Losada, A.; Forsell, Y.; Lundberg, I. Demands, skill discretion, decision authority and social climate at work as determinants of major depression in a 3-year follow-up study. Int. Arch. Occup. Environ. Health 2013, 86, 591–605. [Google Scholar] [CrossRef]
- Stansfeld, S.A.; Fuhrer, R.; Shipley, M.J.; Marmot, M.G. Work characteristics predict psychiatric disorder: Prospective results from the Whitehall II Study. Occup. Environ. Med. 1999, 56, 302–307. [Google Scholar] [CrossRef] [Green Version]
- Rose, U.; Schiel, S.; Schroder, H.; Kleudgen, M.; Tophoven, S.; Rauch, A.; Freude, G.; Muller, G. The Study on Mental Health at Work: Design and sampling. Scand. J. Public Health 2017, 45, 584–594. [Google Scholar] [CrossRef] [Green Version]
- D’Errico, A.; Burr, H.; Pattloch, D.; Kersten, N.; Rose, U. Working conditions as risk factors for early exit from work—in a cohort of 2351 employees in Germany. Int. Arch. Occup. Environ. Health 2021, 94, 117–138. [Google Scholar] [CrossRef] [PubMed]
- Gräfe, K.; Zipfel, S.; Herzog, W.; Löwe, B. Screening psychischer Störungen mit dem “Gesundheitsfragebogen für Patienten (PHQ-D)”. Ergebnisse der deutschen Validierungsstudie [Screening of mental disorders with the “Patient Health Questionnaire Germany (PHQ-D)”. Results of a German validation study]. Diagnostica 2004, 50, 10. [Google Scholar]
- Spitzer, R.L.; Kroenke, K.; Williams, J.B. Validation and utility of a self-report version of PRIME-MD: The PHQ primary care study. Primary Care Evaluation of Mental Disorders. Patient Health Questionnaire. JAMA 1999, 282, 1737–1744. [Google Scholar] [CrossRef] [Green Version]
- Manea, L.; Gilbody, S.; McMillan, D. A diagnostic meta-analysis of the Patient Health Questionnaire-9 (PHQ-9) algorithm scoring method as a screen for depression. Gen. Hosp. Psychiatry 2015, 37, 67–75. [Google Scholar] [CrossRef]
- Nübling, M.; Stößel, U.; Hasselhorn, H.M.; Michaelis, M.; Hofmann, F. Measuring psychological stress and strain at work—Evaluation of the COPSOQ Questionnaire in Germany. Psychosoc. Med. 2006, 3, Doc05. [Google Scholar] [PubMed]
- Kristensen, T.S.; Hannerz, H.; Hogh, A.; Borg, V. The Copenhagen Psychosocial Questionnaire—A tool for the assessment and improvement of the psychosocial work environment. Scand. J. Work Environ. Health 2005, 31, 11. [Google Scholar] [CrossRef] [PubMed] [Green Version]
- Busch, M.A.; Maske, U.E.; Ryl, L.; Schlack, R.; Hapke, U. Prevalence of depressive symptoms and diagnosed depression among adults in Germany: Results of the German Health Interview and Examination Survey for Adults (DEGS1). Bundesgesundheitsblatt Gesundh. Gesundh. 2013, 56, 733–739. [Google Scholar] [CrossRef]
- Schmitt, M.; Altstötter-Gleich, C.; Hinz, A.; Maes, J.; Brähler, E. Normwerte für das Vereinfachte Beck-Depressions-Inventar (BDI-V) in der Allgemeinbevölkerung [Norm values for the simplified Beck Depression Inventory (BDI-V) in the general population]. Diagnostica 2006, 52, 8. [Google Scholar] [CrossRef]
- Goldthorpe, J.H. On Sociology: Numbers, Narratives, and the Integration of Research and Theory; Oxford University Press: Oxford, UK, 2000. [Google Scholar]
- International Labor Office Staff. International Standard Classification of Occupations 2008 (ISCO-08): Structure, Group Definitions and Correspondence Tables; International Labour Office: Geneva, Switzerland, 2012. [Google Scholar]
- Skov, T.; Deddens, J.; Petersen, M.R.; Endahl, L. Prevalence proportion ratios: Estimation and hypothesis testing. Int. J. Epidemiol. 1998, 27, 91–95. [Google Scholar] [CrossRef]
- Rothman, K. Epidemiology. An Introduction; Oxford University Press: New York, NY, USA, 2002. [Google Scholar]
- Andersson, T.; Alfredsson, L.; Kallberg, H.; Zdravkovic, S.; Ahlbom, A. Calculating measures of biological interaction. Eur. J. Epidemiol. 2005, 20, 575–579. [Google Scholar] [CrossRef]
- Andersson, T.; Alfredsson, L.; Källberg, H.; Zdravkovic, S.; Ahlbom, A. Excel Sheet to Calculate Measures of Biological Interaction. Available online: https://www.researchgate.net/publication/342077886_August_26_2020_Alternative_working_link_to_referred_excel_file_httpswwwbiostatistikseepinetcalculationxls (accessed on 9 December 2020).
- Greenland, S. Quantitative methods in the review of epidemiologic literature. J. Epidemiol. Rev. 1987, 9, 1–30. [Google Scholar] [CrossRef] [PubMed]
- Rothman, K. No Adjustments Are Needed for Multiple Comparisons. Epidemiology 1990, 1, 43–46. [Google Scholar] [CrossRef] [Green Version]
- Fransson, E.I.; Nyberg, S.T.; Heikkila, K.; Alfredsson, L.; de Bacquer, D.; Batty, G.D.; Bonenfant, S.; Casini, A.; Clays, E.; Goldberg, M.; et al. Comparison of alternative versions of the job demand-control scales in 17 European cohort studies: The IPD-Work consortium. BMC Public Health 2012, 12, 62. [Google Scholar] [CrossRef] [PubMed] [Green Version]
- Bultmann, U.; Christensen, K.B.; Burr, H.; Lund, T.; Rugulies, R. Severe depressive symptoms as predictor of disability pension: A 10-year follow-up study in Denmark. Eur. J. Public Health 2008, 18, 232–234. [Google Scholar] [CrossRef] [PubMed] [Green Version]
- Porru, F.; Burdorf, A.; Robroek, S.J.W. The impact of depressive symptoms on exit from paid employment in Europe: A longitudinal study with 4 years follow-up. Eur. J. Public Health 2019, 29, 134–139. [Google Scholar] [CrossRef] [PubMed] [Green Version]
- Bickel, P.J.; Kjell, A.D. Mathematical Statistics: Basic Ideas and Selected Topics; Prentice Hall: Upper Saddle River, NJ, USA, 1977. [Google Scholar]
- Pejtersen, J.H.; Kristensen, T.S.; Borg, V.; Bjorner, J.B. The second version of the Copenhagen Psychosocial Questionnaire. Scand. J. Public Health 2010, 38, 8–24. [Google Scholar] [CrossRef]
- Burr, H.; Berthelsen, H.; Moncada, S.; Nübling, M.; Dupret, E.; Demiral, Y.; Oudyk, J.; Kristensen, T.S.; Llorens, C.; Navarro, A.; et al. The Third Version of the Copenhagen Psychosocial Questionnaire. Saf. Health Work 2019, 10, 482–503. [Google Scholar] [CrossRef]
| Variables | N | % | 1st Quartile | Median | 3rd Quartile | Cronbach’s Alpha | Inter Item Correlation Range |
|---|---|---|---|---|---|---|---|
| Gender | |||||||
| Men | 1079 | 49 | |||||
| Women | 1133 | 51 | |||||
| Age | 41 | 47 | 53 | ||||
| Socioeconomic position | |||||||
| Un- and semiskilled workers, category (ISCO 1 main group 8,9) | 255 | 12 | |||||
| Skilled workers, category (ISCO 1 main group 4–7) | 784 | 35 | |||||
| Semi-professionals, category (ISCO 1 main group 3) | 629 | 28 | |||||
| Professionals/managers, category (ISCO 1 main group 1,2) | 544 | 25 | |||||
| Demand control quadrants 2 | |||||||
| Low strain, category 2 | 563 | 26 | |||||
| Passive, category 2 | 568 | 26 | |||||
| Active, category 2 | 532 | 24 | |||||
| Strain, category 2 | 549 | 25 | |||||
| Psychological demands, scale 3 | 1.8 | 2.3 | 2.8 | 0.82 | 0.26–0.67 | ||
| Work pace, subscale 3 | 2.0 | 3.0 | 3.0 | n/a 4 | n/a 4 | ||
| Amount of work, subscale 3 | 1.3 | 1.8 | 2.5 | 0.84 | 0.48–0.67 | ||
| Job control, scale 3 | 1.8 | 2.3 | 2.8 | 0.75 | 0.14–0.45 | ||
| Decision authority, subscale 3 | 1.1 | 1.8 | 2.4 | 0.71 | 0.32–0.43 | ||
| Skill discretion, subscale 3 | 2.2 | 2.8 | 3.3 | 0.70 | 0.41–0.45 | ||
| Depressive symptoms at baseline, scale 5 | 2.0 | 4.0 | 6.0 | 0.83 | 0.21–0.51 | ||
| No, category (PHQ-9 < 10) 6 | 2039 | 92 | |||||
| Yes, category (PHQ-9 ≥ 10) 6 | 173 | 8 | |||||
| Depressive symptoms at follow-up, scale 5 | 2.0 | 4.0 | 6.0 | 0.83 | 0.18–0.55 | ||
| No, category (PHQ-9 < 10) 6 | 1989 | 90 | |||||
| Yes, category (PHQ-9 ≥ 10) 6 | 223 | 10 |
| Job Content Questionnaire (JCQ) Items, Version R-1.11 [4] | Copenhagen Psychosocial Questionnaire (COPSOQ) Items in the German Study on Mental Health at Work (S-MGA) [18] | |||
|---|---|---|---|---|
| Scale | Subscale | Item | Item | Item Weight for Subscale and Scale |
| Psychological demands 1 | Work pace 2 | My job requires working very fast | Do you have to work very fast? | 4 |
| My job requires working very hard | ||||
| Amount of work 2 | I am not asked to do an excessive amount of work 3 | Is your workload unevenly distributed so it piles up? | 1 | |
| Do you fall behind with your work? | 1 | |||
| I have enough time to get the job done 3 | How often do you not have time to complete all your work tasks? | 1 | ||
| Do you have enough time for your work tasks? | 1 | |||
| Job control | Decision authority | My job allows me to make a lot of decisions on my own | Do you have a large degree of influence concerning your work? | 3 |
| I have a lot of say about what happens in my job | Do you have a say in choosing who you work with? | 2 | ||
| Do you have any influence on what you do at work? | 2 | |||
| In my job, I have very little freedom to decide how I do my work 3 | ||||
| Can you influence the amount of work assigned to you? | 2 | |||
| Skill discretion | My job requires that I learn new things | Do you have the possibility of learning new things through your work? | 4.5 | |
| I have an opportunity to develop my own special abilities | ||||
| My job requires me to be creative | ||||
| My job requires a high level of skill | Can you use your skills or expertise in your work? | 1.5 | ||
| My job involves a lot of repetitive work 3 | Is your work varied? | 3 | ||
| I get to do a variety of different things on my job | ||||
| DC Quadrants (Based on Medians) | N | Observed Prevalence of Depressive Symptoms at Follow-Up (%) | p 1 | RR 2 | 95% CI | RERI 2,3 | 95% CI |
|---|---|---|---|---|---|---|---|
| 0.204 | |||||||
| Low strain | 563 | 6 | 1 | ||||
| Passive | 568 | 11 | 1.42 | 0.96; 2.10 | |||
| Active | 532 | 9 | 1.31 | 0.87; 1.96 | |||
| Strain | 549 | 14 | 1.51 | 1.03; 2.23 | −0.21 | −0.85; 0.43 |
| Dimension | Subscale | N | Observed Prevalence of Depressive Symptoms at Follow-Up (%) | p 1 | RR 2 | 95% CI |
|---|---|---|---|---|---|---|
| Psychological demands | Work pace | 0.267 | ||||
| <median 3 | 822 | 9 | 1 | |||
| ≥median 3 | 1390 | 11 | 1.15 | 0.90; 1.48 | ||
| Amount of work | 0.201 | |||||
| <median 3 | 1202 | 8 | 1 | |||
| ≥median 3 | 1010 | 12 | 1.17 | 0.92; 1.49 | ||
| Job control | Decision authority | 0.037 | ||||
| <median 3 | 1123 | 13 | 1.30 | 1.01; 1.66 | ||
| ≥median 3 | 1089 | 8 | 1 | |||
| Skill discretion | 0.180 | |||||
| <median 3 | 1022 | 12 | 1.18 | 0.93; 1.51 | ||
| ≥median 3 | 1190 | 8 | 1 |
Publisher’s Note: MDPI stays neutral with regard to jurisdictional claims in published maps and institutional affiliations. |
© 2021 by the authors. Licensee MDPI, Basel, Switzerland. This article is an open access article distributed under the terms and conditions of the Creative Commons Attribution (CC BY) license (https://creativecommons.org/licenses/by/4.0/).
Share and Cite
Burr, H.; Müller, G.; Rose, U.; Formazin, M.; Clausen, T.; Schulz, A.; Berthelsen, H.; Potter, G.; d’Errico, A.; Pohrt, A. The Demand–Control Model as a Predictor of Depressive Symptoms—Interaction and Differential Subscale Effects: Prospective Analyses of 2212 German Employees. Int. J. Environ. Res. Public Health 2021, 18, 8328. https://doi.org/10.3390/ijerph18168328
Burr H, Müller G, Rose U, Formazin M, Clausen T, Schulz A, Berthelsen H, Potter G, d’Errico A, Pohrt A. The Demand–Control Model as a Predictor of Depressive Symptoms—Interaction and Differential Subscale Effects: Prospective Analyses of 2212 German Employees. International Journal of Environmental Research and Public Health. 2021; 18(16):8328. https://doi.org/10.3390/ijerph18168328
Chicago/Turabian StyleBurr, Hermann, Grit Müller, Uwe Rose, Maren Formazin, Thomas Clausen, Anika Schulz, Hanne Berthelsen, Guy Potter, Angelo d’Errico, and Anne Pohrt. 2021. "The Demand–Control Model as a Predictor of Depressive Symptoms—Interaction and Differential Subscale Effects: Prospective Analyses of 2212 German Employees" International Journal of Environmental Research and Public Health 18, no. 16: 8328. https://doi.org/10.3390/ijerph18168328
APA StyleBurr, H., Müller, G., Rose, U., Formazin, M., Clausen, T., Schulz, A., Berthelsen, H., Potter, G., d’Errico, A., & Pohrt, A. (2021). The Demand–Control Model as a Predictor of Depressive Symptoms—Interaction and Differential Subscale Effects: Prospective Analyses of 2212 German Employees. International Journal of Environmental Research and Public Health, 18(16), 8328. https://doi.org/10.3390/ijerph18168328