
Geography as a Determinant of Health: Health Services Utilization of Pediatric Respiratory Illness in a Canadian Province

 , and
, and 
Abstract
1. Introduction
2. Materials and Methods
2.1. Study Design and Setting
2.2. Study Population and Data Sources
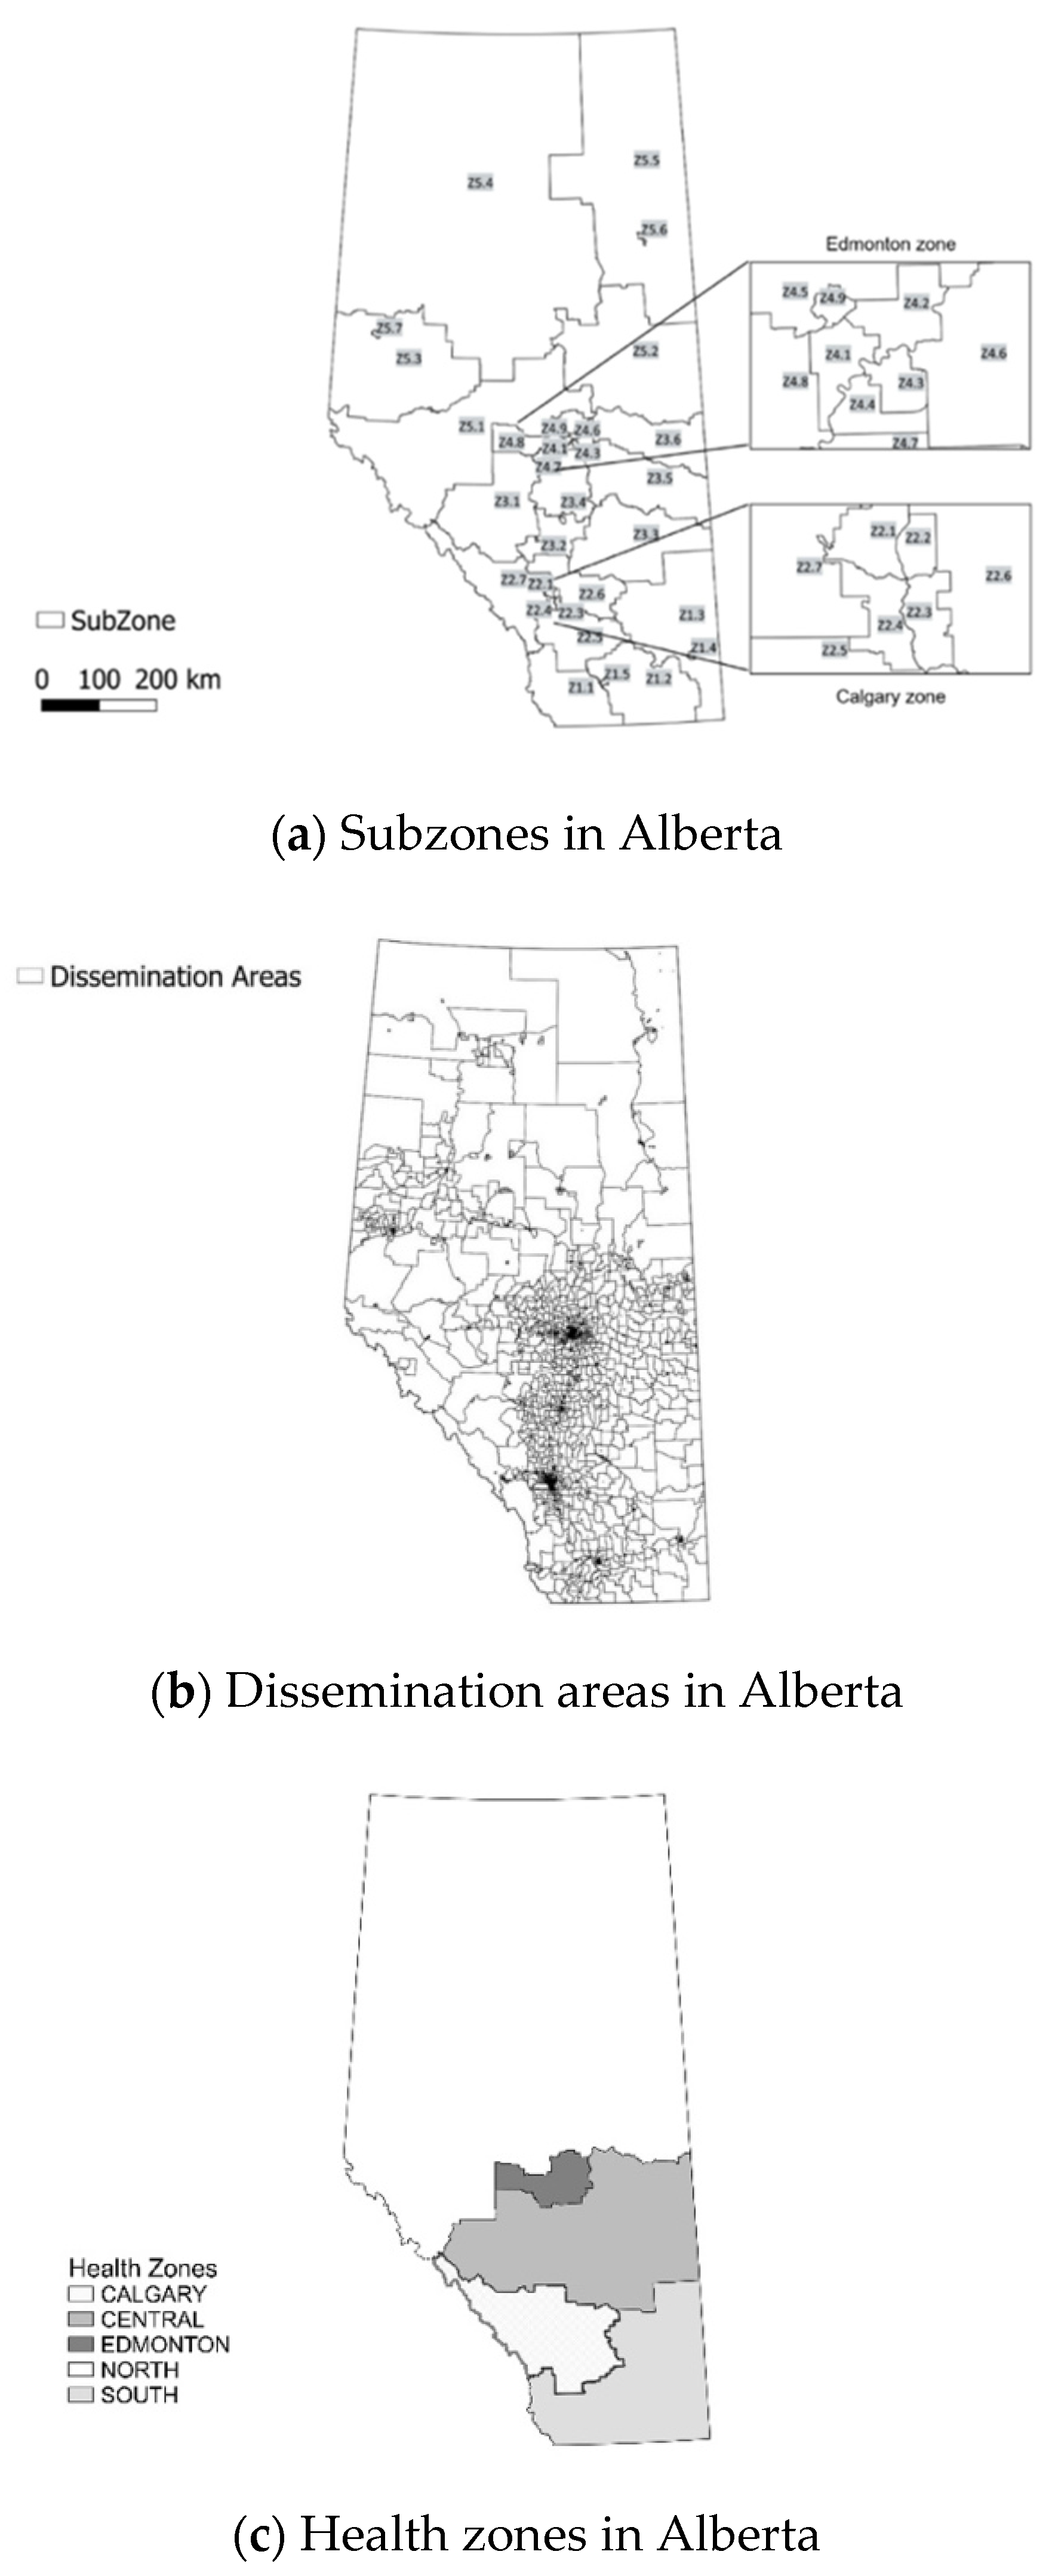
2.3. Definition of Geographic Areas
2.4. Aggregation of Episodes of Acute Respiratory Healthcare Utilization to Health Subzones
2.5. Study Outcomes: Respiratory Events
2.6. Socioeconomic Status
2.7. Statistical Analysis
3. Results
3.1. Respiratory Healthcare Utilization
3.1.1. Regional (Zone)
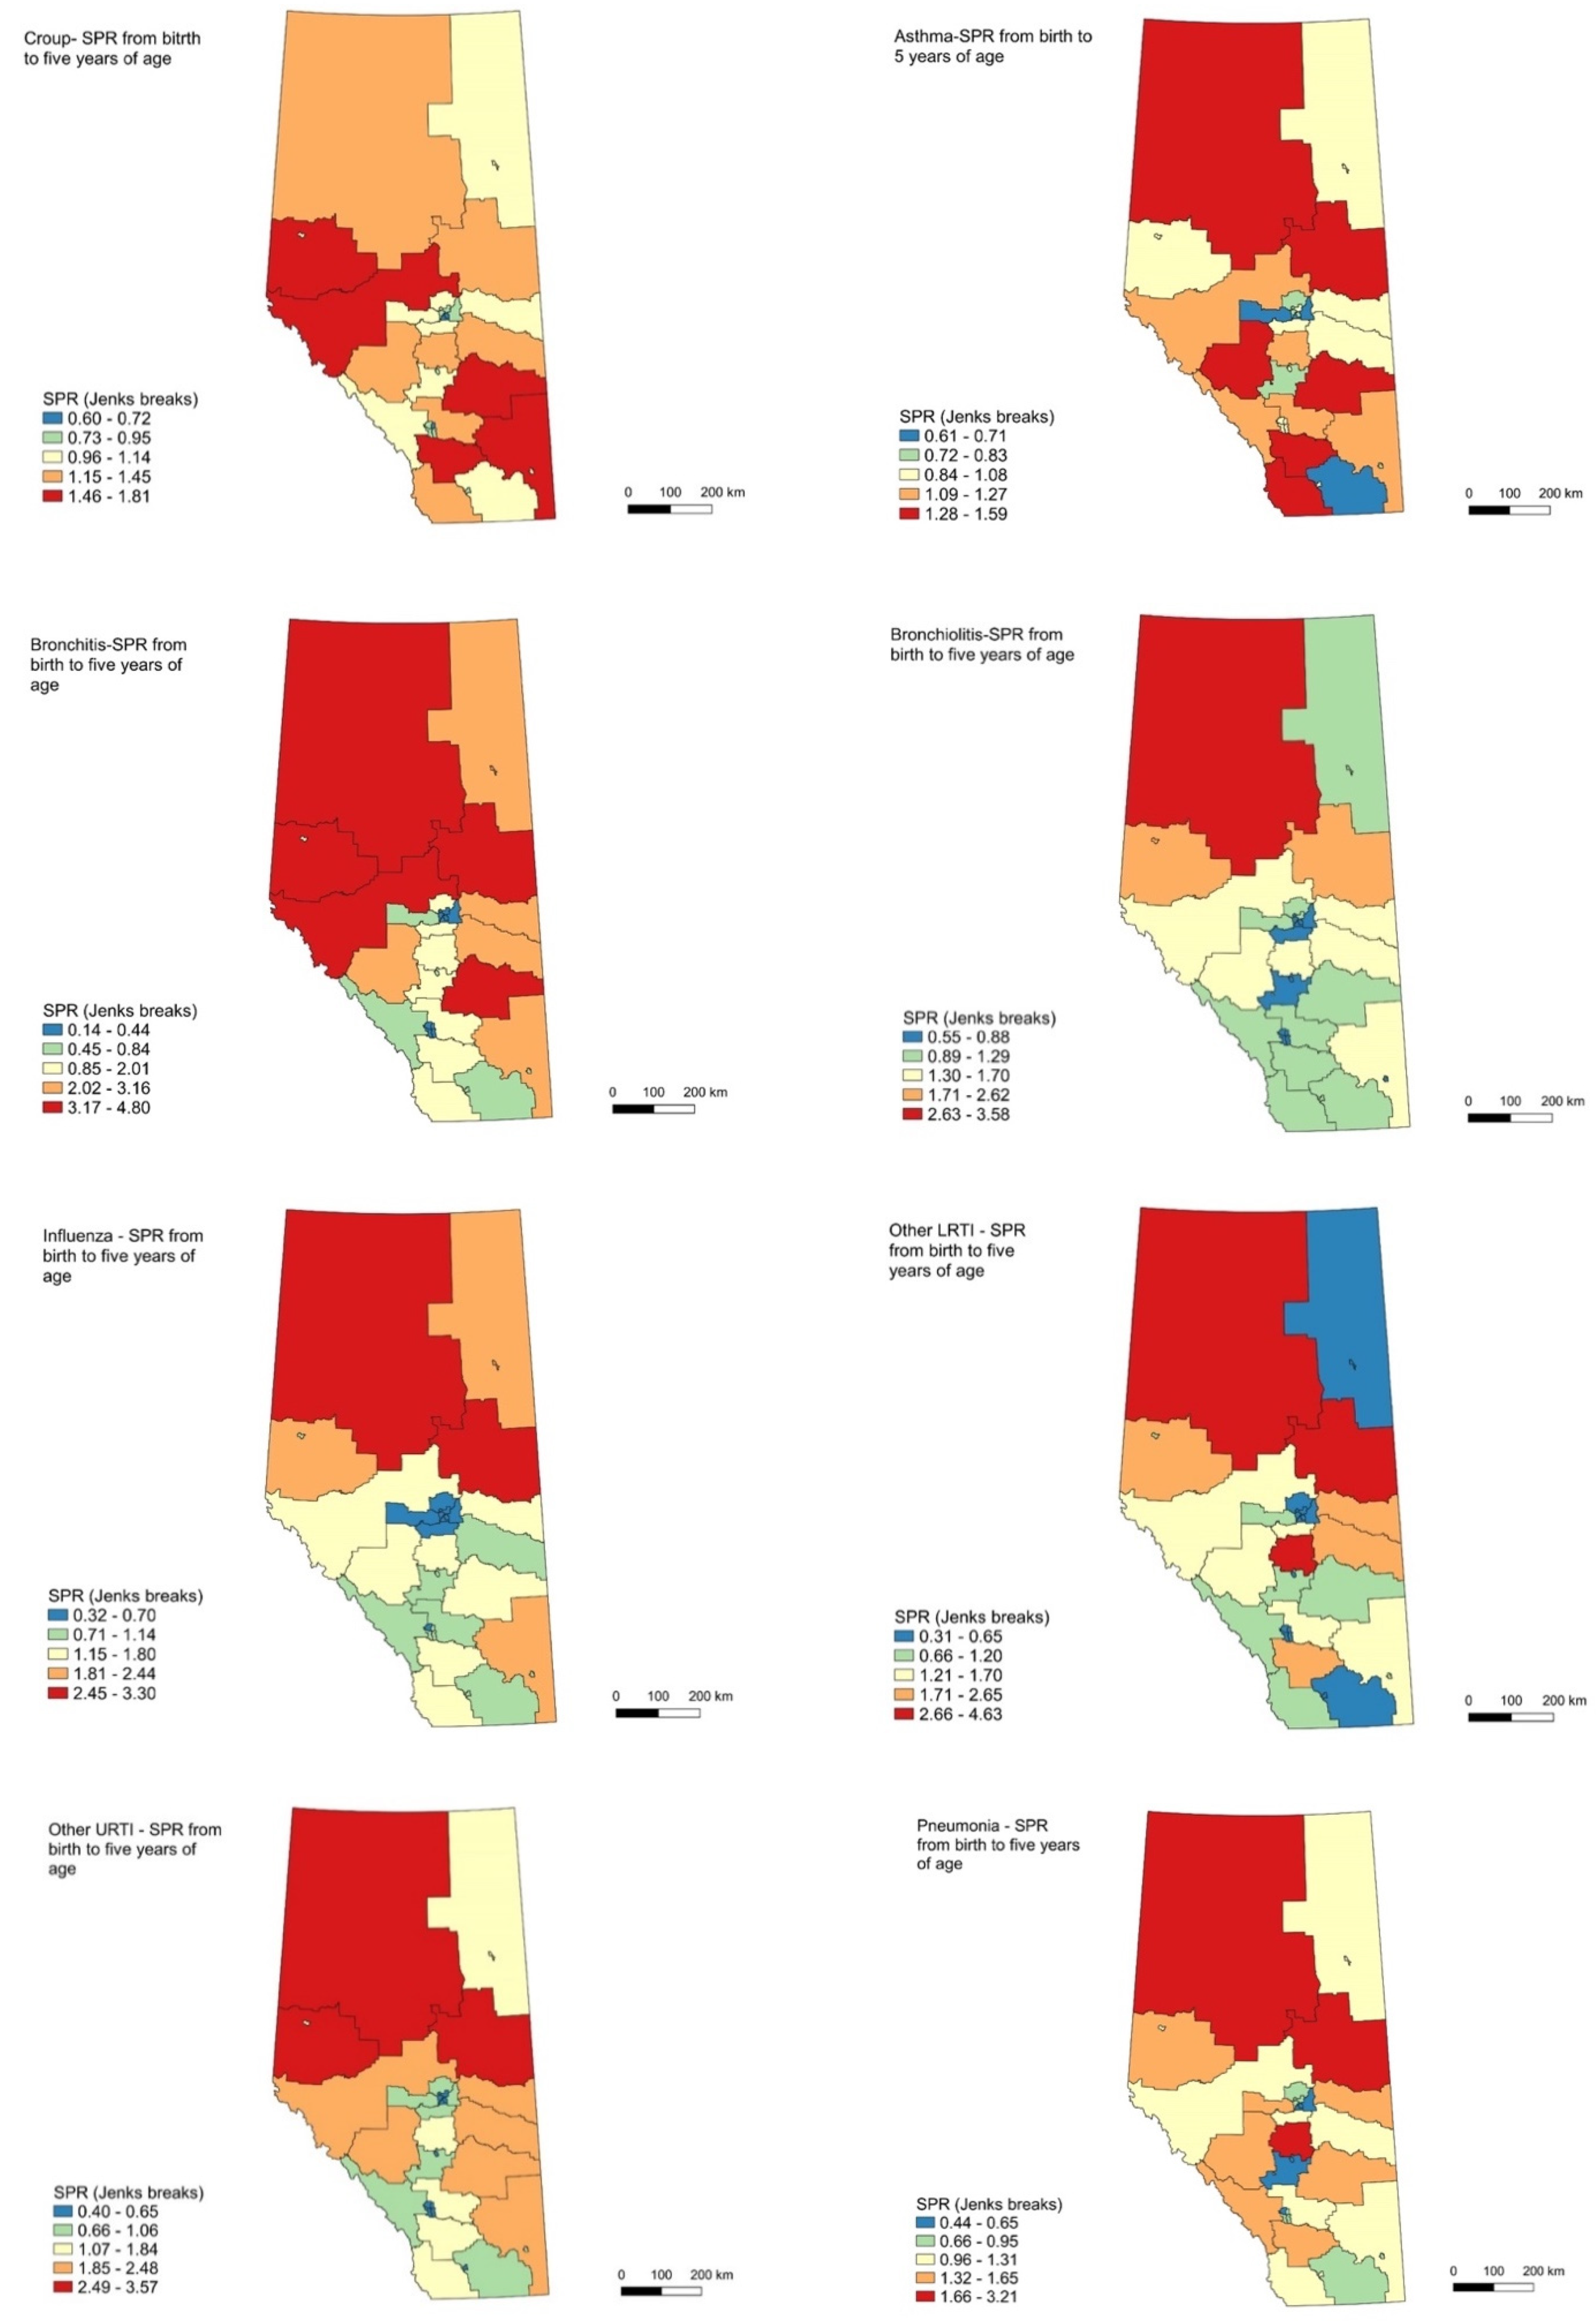
3.1.2. Respiratory Illness
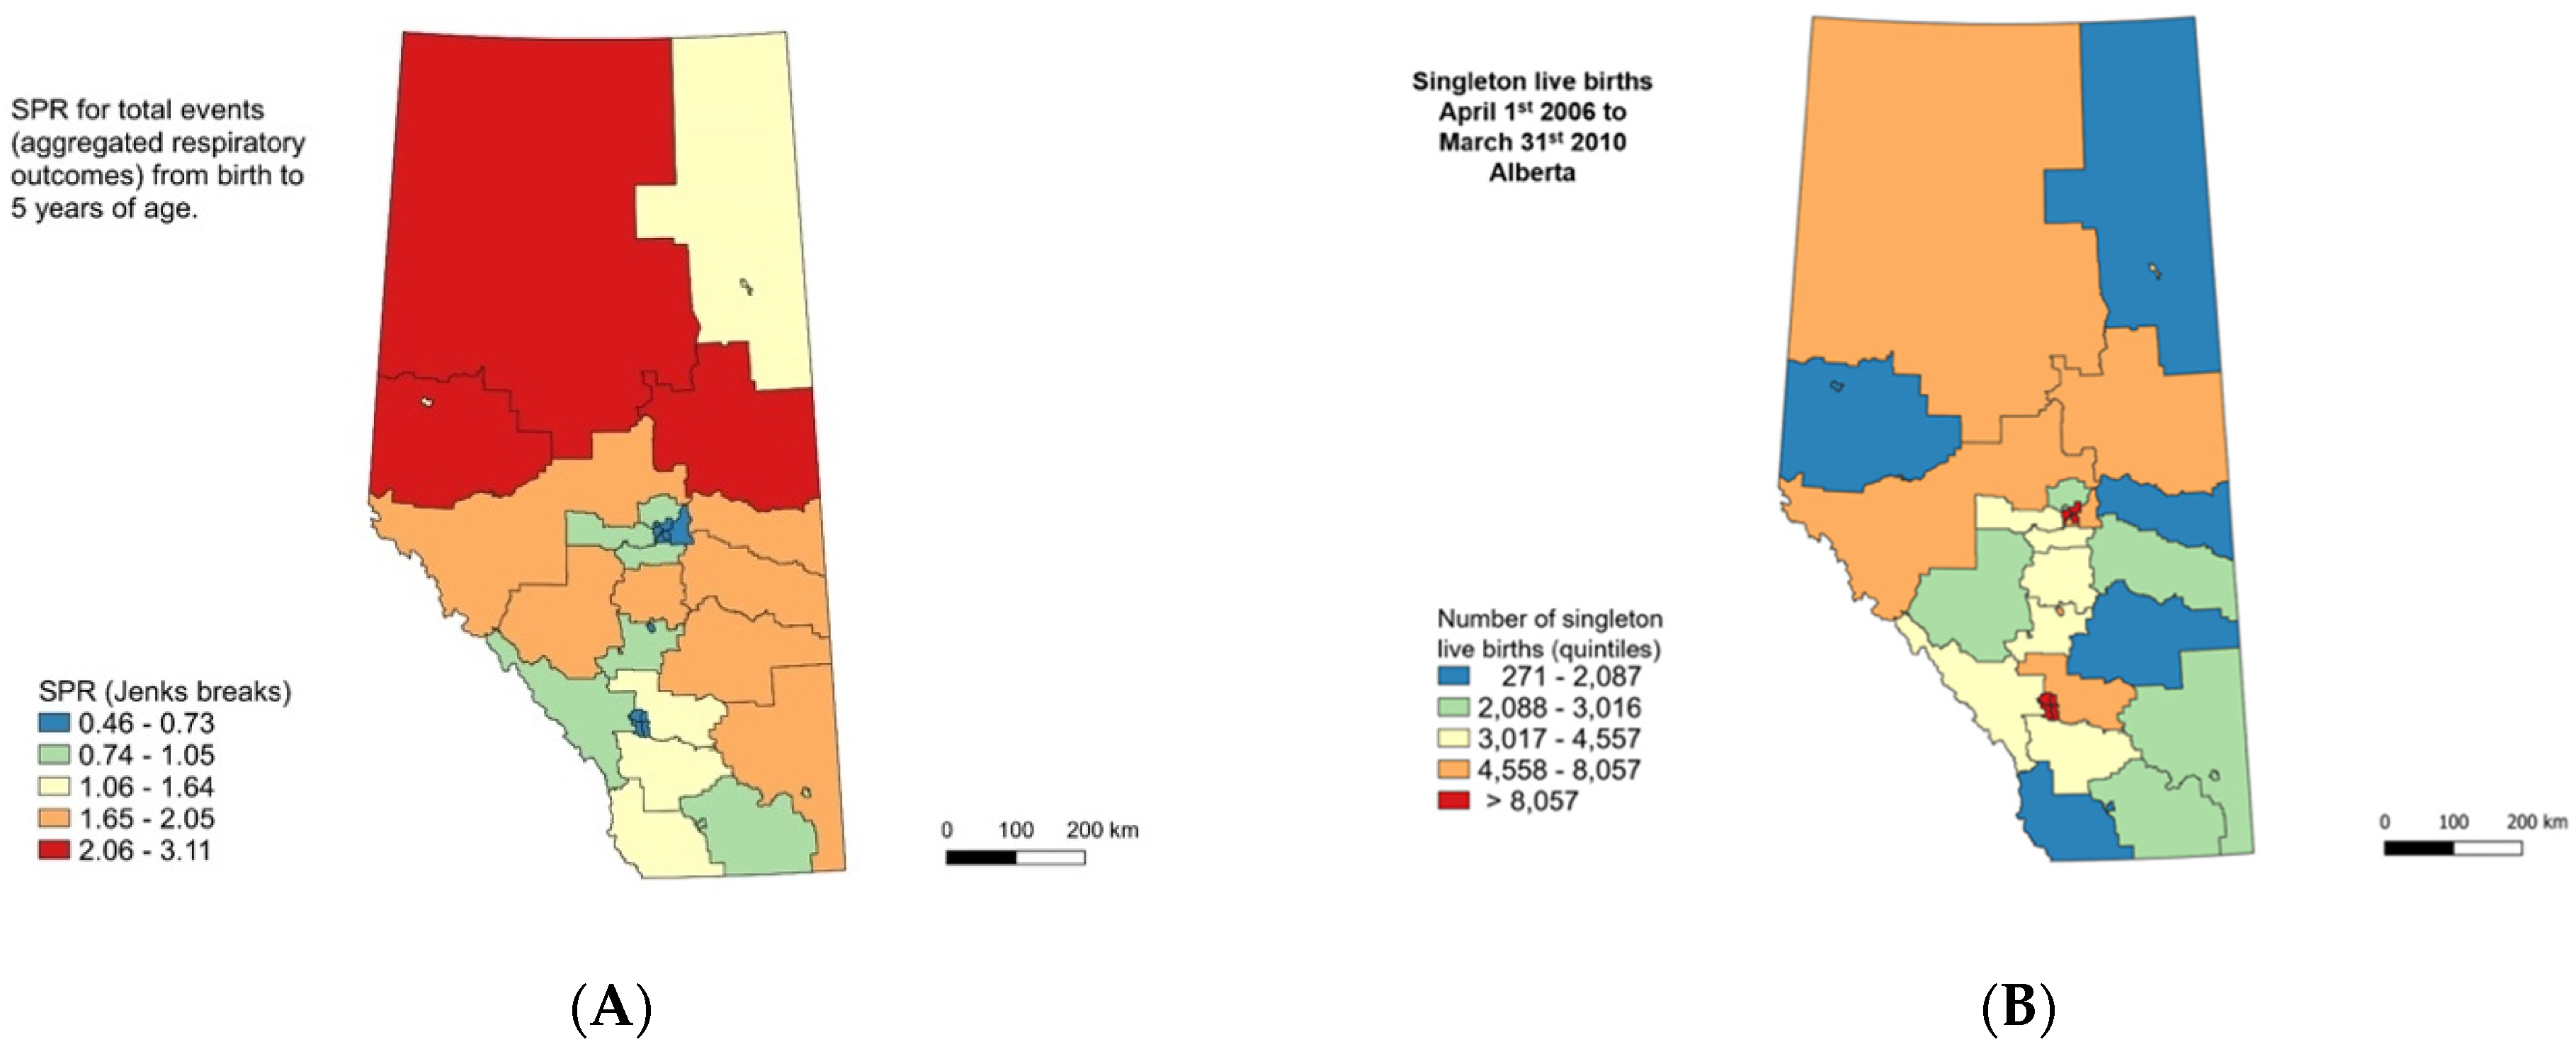
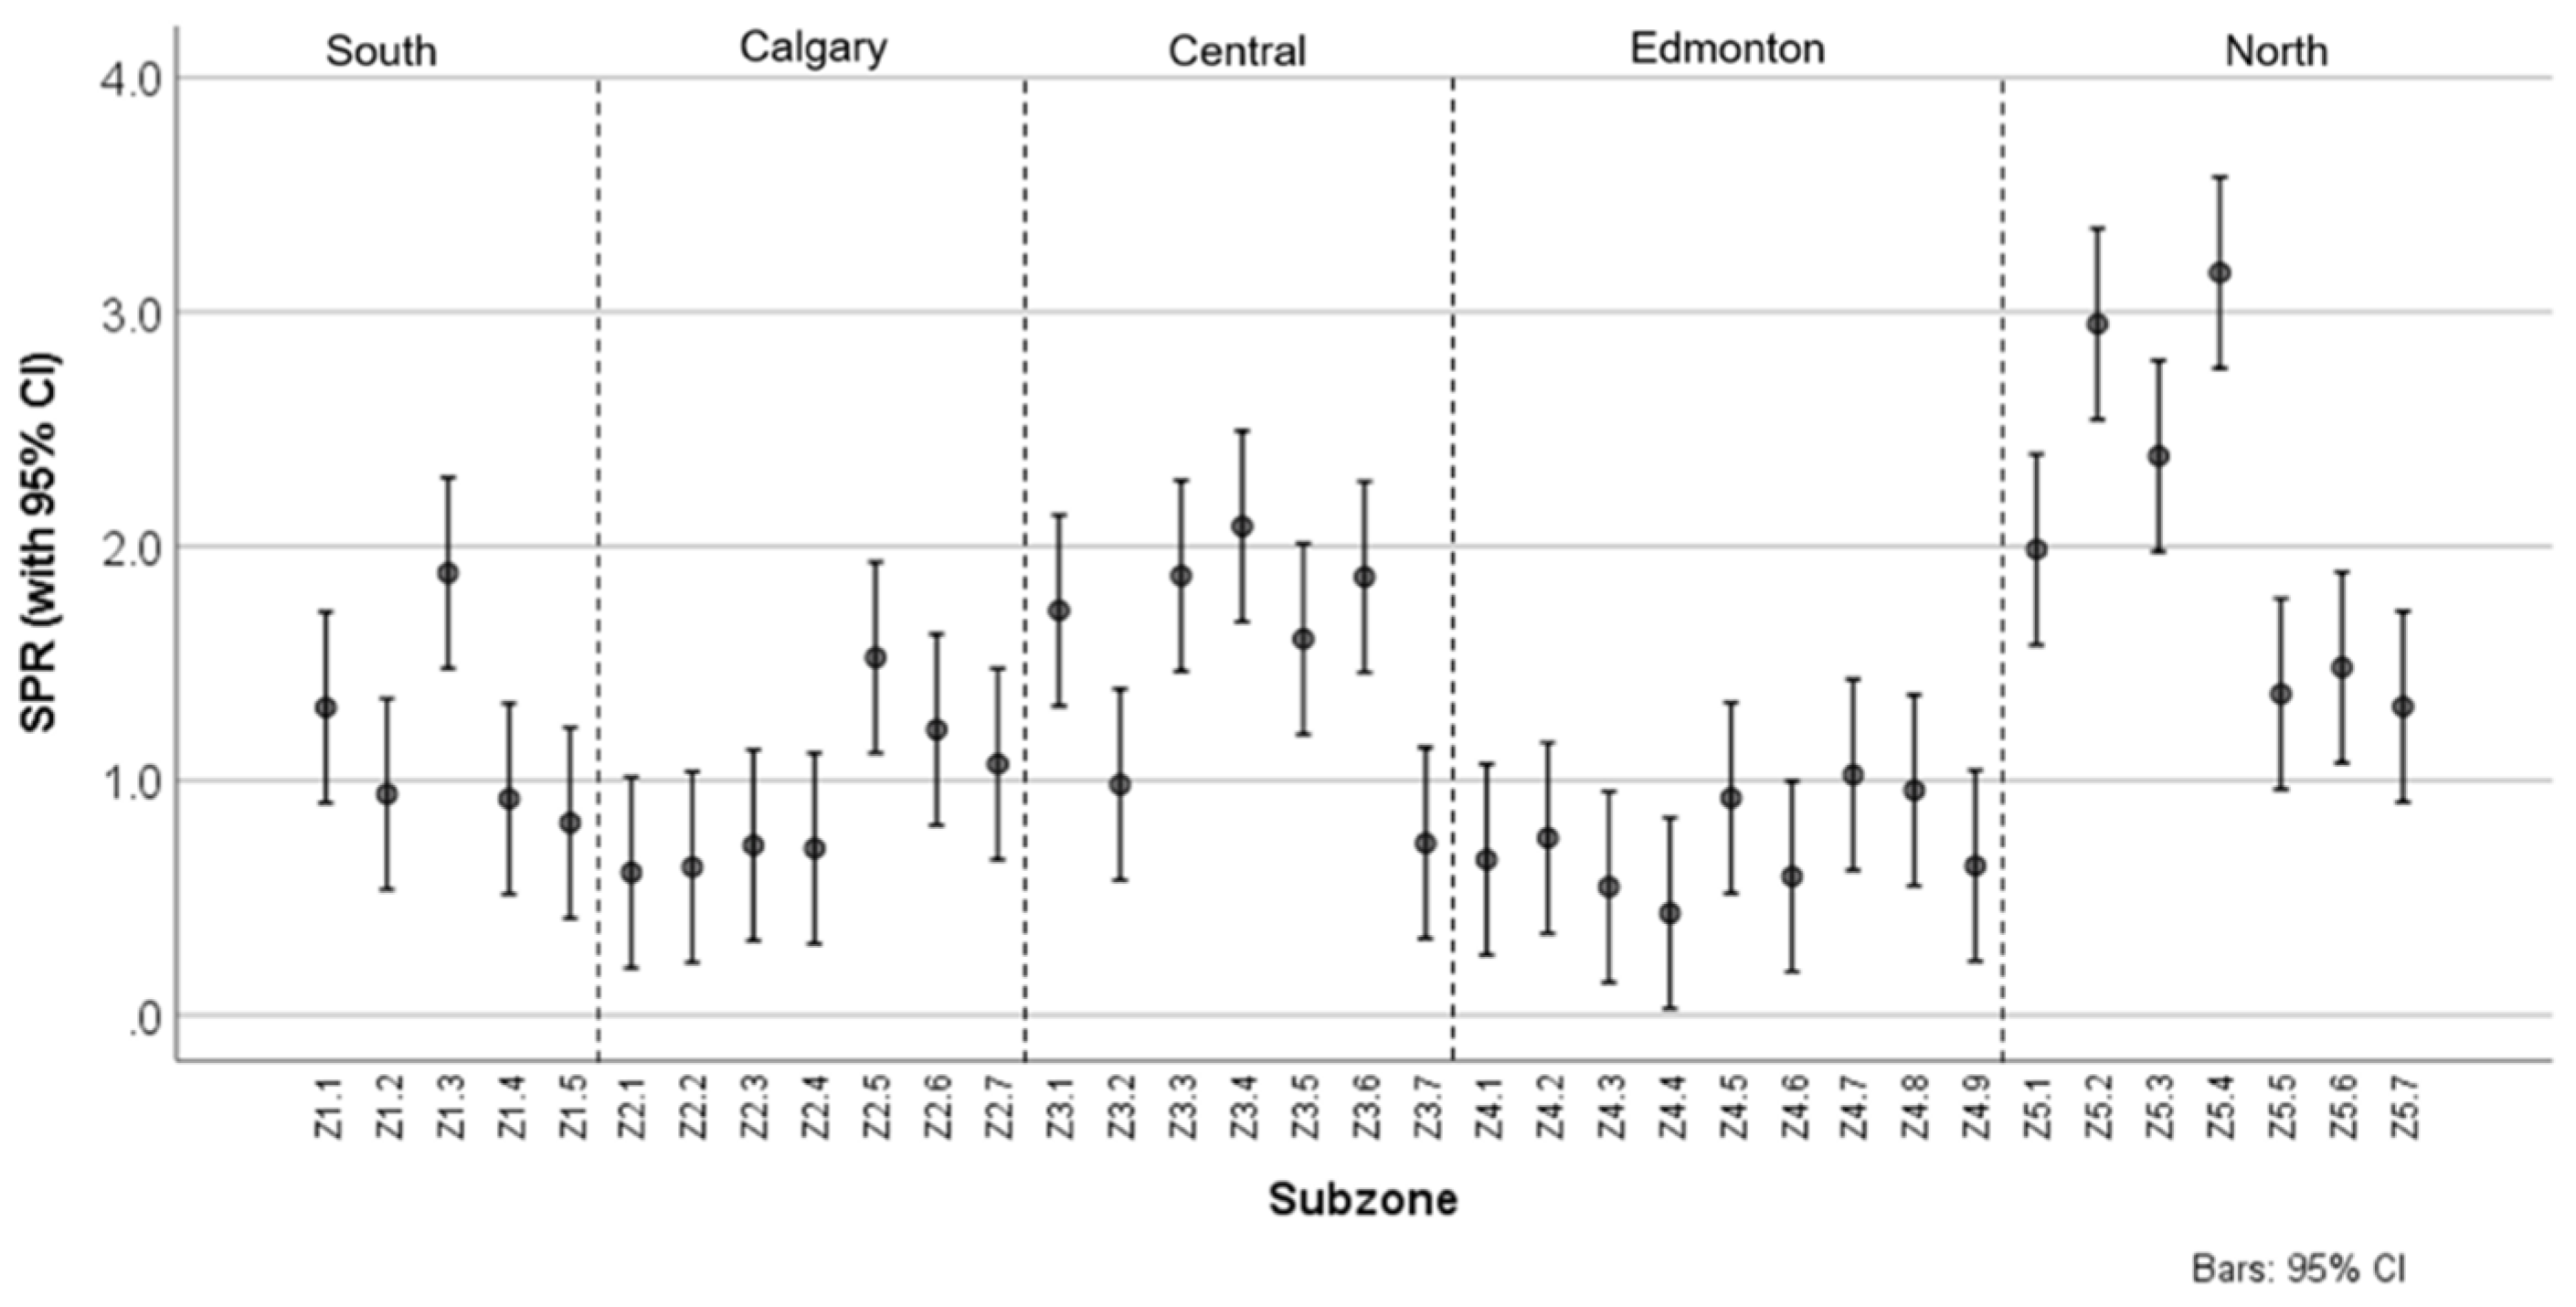
3.1.3. Standardized Prevalence Ratio
3.2. Material and Social Deprivation
4. Discussion
5. Conclusions
Author Contributions
Funding
Institutional Review Board Statement
Informed Consent Statement
Data Availability Statement
Conflicts of Interest
Appendix A


| Subzone Code | Subzone Name | Zone |
|---|---|---|
| Z1.1 | SOUTH ZONE—WEST | SOUTH |
| Z1.2 | SOUTH ZONE—CENTRAL | SOUTH |
| Z1.3 | SOUTH ZONE—EAST | SOUTH |
| Z1.4 | SOUTH ZONE—MEDICINE HAT | SOUTH |
| Z1.5 | SOUTH ZONE—LETHBRIDGE | SOUTH |
| Z2.1 | CALGARY—NW | CALGARY |
| Z2.2 | CALGARY—NE | CALGARY |
| Z2.3 | CALGARY—SE | CALGARY |
| Z2.4 | CALGARY—SW | CALGARY |
| Z2.5 | FOOTHILLS-VULCAN CORRIDOR | CALGARY |
| Z2.6 | HIGHLAND/ROCKVIEW/WHEATLAND CORRIDOR | CALGARY |
| Z2.7 | BOW CORRIDOR | CALGARY |
| Z3.1 | ROCKY MOUNTAIN HOUSE/DRAYTON VALLEY | CENTRAL |
| Z3.2 | CENTRAL ZONE—CENTRAL/SOUTH | CENTRAL |
| Z3.3 | CENTRAL ZONE—SE | CENTRAL |
| Z3.4 | WETASKIWIN/PONOKA/LACOMBE | CENTRAL |
| Z3.5 | CENTRAL ZONE—EAST | CENTRAL |
| Z3.6 | CENTRAL ZONE—NE | CENTRAL |
| Z3.7 | CITY OF RED DEER | CENTRAL |
| Z4.1 | EDMONTON—WEST | EDMONTON |
| Z4.2 | EDMONTON—NE | EDMONTON |
| Z4.3 | EDMONTON—SE | EDMONTON |
| Z4.4 | EDMONTON—SW | EDMONTON |
| Z4.5 | STURGEON COUNTY AND FORT SASKATCHEWAN | EDMONTON |
| Z4.6 | STRATHCONA COUNTY INCLUDING SHERWOOD PARK | EDMONTON |
| Z4.7 | LEDUC COUNTY | EDMONTON |
| Z4.8 | WESTVIEW | EDMONTON |
| Z4.9 | ST. ALBERT | EDMONTON |
| Z5.1 | NORTH ZONE—SW | NORTH |
| Z5.2 | NORTH ZONE—SE | NORTH |
| Z5.3 | NORTH ZONE—CENTRAL WEST | NORTH |
| Z5.4 | NORTH ZONE—NW | NORTH |
| Z5.5 | NORTH ZONE—NE | NORTH |
| Z5.6 | FORT MCMURRAY | NORTH |
| Z5.7 | CITY OF GRANDE PRAIRIE | NORTH |
| Total (Aggregated) | Asthma | Bronchitis | Bronchiolitis | Croup | Influenza | oLRTI | oURTI | Pneumonia | ||||||||||||
|---|---|---|---|---|---|---|---|---|---|---|---|---|---|---|---|---|---|---|---|---|
| #DAs | Births | Events | Rate | Events | Rate | Events | Rate | Events | Rate | Events | Rate | Events | Rate | Events | Rate | Events | Rate | Events | Rate | |
| Z1.1 | 25 | 1283 | 2851 | 2222.14 | 244 | 190.18 | 94 | 73.27 | 173 | 134.84 | 266 | 207.33 | 84 | 65.47 | 29 | 22.6 | 1749 | 1363.21 | 209 | 162.9 |
| Z1.2 | 72 | 2309 | 3274 | 1417.93 | 232 | 100.48 | 138 | 59.77 | 308 | 133.39 | 446 | 193.16 | 93 | 40.28 | 38 | 16.46 | 1708 | 739.71 | 298 | 129.06 |
| Z1.3 | 71 | 2156 | 6247 | 2897.5 | 364 | 168.83 | 482 | 223.56 | 362 | 167.9 | 652 | 302.41 | 191 | 88.59 | 84 | 38.96 | 3752 | 1740.26 | 344 | 159.55 |
| Z1.4 | 94 | 2115 | 2619 | 1238.3 | 232 | 109.69 | 104 | 49.17 | 229 | 108.27 | 362 | 171.16 | 86 | 40.66 | 64 | 30.26 | 1314 | 621.28 | 231 | 109.22 |
| Z1.5 | 118 | 1978 | 2272 | 1148.63 | 273 | 138.02 | 71 | 35.89 | 240 | 121.33 | 301 | 152.17 | 58 | 29.32 | 20 | 10.11 | 979 | 494.94 | 338 | 170.88 |
| Z2.1 | 495 | 24012 | 20535 | 855.2 | 3283 | 136.72 | 230 | 9.58 | 1871 | 77.92 | 3649 | 151.97 | 589 | 24.53 | 266 | 11.08 | 8739 | 363.94 | 1903 | 79.25 |
| Z2.2 | 227 | 12109 | 10796 | 891.57 | 1815 | 149.89 | 116 | 9.58 | 960 | 79.28 | 1222 | 100.92 | 349 | 28.82 | 162 | 13.38 | 5054 | 417.38 | 1130 | 93.32 |
| Z2.3 | 193 | 9643 | 9961 | 1032.98 | 1464 | 151.82 | 189 | 19.6 | 855 | 88.67 | 1516 | 157.21 | 284 | 29.45 | 136 | 14.1 | 4525 | 469.25 | 972 | 100.8 |
| Z2.4 | 600 | 24142 | 24749 | 1025.14 | 3362 | 139.26 | 485 | 20.09 | 2027 | 83.96 | 3886 | 160.96 | 709 | 29.37 | 317 | 13.13 | 11465 | 474.9 | 2514 | 104.13 |
| Z2.5 | 82 | 4132 | 9853 | 2384.56 | 867 | 209.83 | 354 | 85.67 | 572 | 138.43 | 1080 | 261.37 | 216 | 52.27 | 212 | 51.31 | 5758 | 1393.51 | 788 | 190.71 |
| Z2.6 | 115 | 7662 | 13730 | 1791.96 | 1301 | 169.8 | 623 | 81.31 | 906 | 118.25 | 1866 | 243.54 | 317 | 41.37 | 262 | 34.19 | 7253 | 946.62 | 1199 | 156.49 |
| Z2.7 | 94 | 3076 | 4716 | 1533.16 | 549 | 178.48 | 129 | 41.94 | 410 | 133.29 | 533 | 173.28 | 103 | 33.49 | 88 | 28.61 | 2280 | 741.22 | 618 | 200.91 |
| Z3.1 | 47 | 2448 | 7263 | 2966.91 | 482 | 196.9 | 417 | 170.34 | 441 | 180.15 | 564 | 230.39 | 134 | 54.74 | 89 | 36.36 | 4582 | 1871.73 | 543 | 221.81 |
| Z3.2 | 88 | 4280 | 6202 | 1449.07 | 499 | 116.59 | 375 | 87.62 | 429 | 100.23 | 805 | 188.08 | 168 | 39.25 | 109 | 25.47 | 3432 | 801.87 | 379 | 88.55 |
| Z3.3 | 50 | 1852 | 5210 | 2813.17 | 360 | 194.38 | 579 | 312.63 | 270 | 145.79 | 514 | 277.54 | 99 | 53.46 | 53 | 28.62 | 2950 | 1592.87 | 388 | 209.5 |
| Z3.4 | 82 | 3817 | 9512 | 2492.01 | 640 | 167.67 | 543 | 142.26 | 751 | 196.75 | 776 | 203.3 | 248 | 64.97 | 433 | 113.44 | 4793 | 1255.7 | 1331 | 348.7 |
| Z3.5 | 98 | 2209 | 5714 | 2586.69 | 323 | 146.22 | 409 | 185.15 | 404 | 182.89 | 519 | 234.95 | 88 | 39.84 | 102 | 46.17 | 3525 | 1595.74 | 347 | 157.08 |
| Z3.6 | 92 | 1582 | 4667 | 2950.06 | 233 | 147.28 | 311 | 196.59 | 328 | 207.33 | 304 | 192.16 | 86 | 54.36 | 105 | 66.37 | 2947 | 1862.83 | 340 | 214.92 |
| Z3.7 | 118 | 5570 | 5690 | 1021.54 | 729 | 130.88 | 310 | 55.66 | 506 | 90.84 | 776 | 139.32 | 163 | 29.26 | 70 | 12.57 | 2693 | 483.48 | 447 | 80.25 |
| Z4.1 | 317 | 11427 | 10986 | 961.41 | 1345 | 117.7 | 310 | 27.13 | 1166 | 102.04 | 1527 | 133.63 | 253 | 22.14 | 132 | 11.55 | 5058 | 442.64 | 1186 | 103.79 |
| Z4.2 | 394 | 17759 | 19061 | 1073.31 | 2264 | 127.48 | 537 | 30.24 | 2269 | 127.77 | 2485 | 139.93 | 457 | 25.73 | 241 | 13.57 | 8676 | 488.54 | 2148 | 120.95 |
| Z4.3 | 327 | 11662 | 9095 | 779.88 | 1305 | 111.9 | 199 | 17.06 | 1055 | 90.46 | 1431 | 122.71 | 183 | 15.69 | 117 | 10.03 | 3915 | 335.71 | 886 | 75.97 |
| Z4.4 | 152 | 7280 | 4817 | 661.68 | 621 | 85.3 | 89 | 12.23 | 487 | 66.9 | 824 | 113.19 | 83 | 11.4 | 56 | 7.69 | 2218 | 304.67 | 426 | 58.52 |
| Z4.5 | 73 | 2928 | 4053 | 1384.22 | 337 | 115.1 | 269 | 91.87 | 462 | 157.79 | 538 | 183.74 | 72 | 24.59 | 26 | 8.88 | 1961 | 669.74 | 374 | 127.73 |
| Z4.6 | 133 | 5502 | 5506 | 1000.73 | 534 | 97.06 | 176 | 31.99 | 511 | 92.88 | 789 | 143.4 | 72 | 13.09 | 54 | 9.81 | 3018 | 548.53 | 350 | 63.61 |
| Z4.7 | 73 | 4083 | 5650 | 1383.79 | 527 | 129.07 | 406 | 99.44 | 369 | 90.37 | 759 | 185.89 | 90 | 22.04 | 147 | 36 | 2766 | 677.44 | 577 | 141.32 |
| Z4.8 | 92 | 4299 | 5577 | 1297.28 | 391 | 90.95 | 232 | 53.97 | 557 | 129.57 | 811 | 188.65 | 108 | 25.12 | 123 | 28.61 | 2532 | 588.97 | 824 | 191.67 |
| Z4.9 | 85 | 2846 | 2491 | 875.26 | 314 | 110.33 | 46 | 16.16 | 293 | 102.95 | 497 | 174.63 | 59 | 20.73 | 23 | 8.08 | 934 | 328.18 | 323 | 113.49 |
| Z5.1 | 119 | 5000 | 14930 | 2986 | 796 | 159.2 | 1582 | 316.4 | 1026 | 205.2 | 1313 | 262.6 | 293 | 58.6 | 213 | 42.6 | 8822 | 1764.4 | 887 | 177.4 |
| Z5.2 | 97 | 4947 | 20288 | 4101.07 | 1101 | 222.56 | 1601 | 323.63 | 1212 | 245 | 1079 | 218.11 | 589 | 119.06 | 571 | 115.42 | 12229 | 2472 | 1898 | 383.67 |
| Z5.3 | 31 | 750 | 2714 | 3618.67 | 111 | 148 | 254 | 338.67 | 239 | 318.67 | 192 | 256 | 63 | 84 | 43 | 57.33 | 1658 | 2210.67 | 150 | 200 |
| Z5.4 | 77 | 5724 | 25793 | 4506.11 | 1147 | 200.38 | 1830 | 319.71 | 2482 | 433.61 | 1176 | 205.45 | 666 | 116.35 | 651 | 113.73 | 15380 | 2686.93 | 2460 | 429.77 |
| Z5.5 | 14 | 271 | 547 | 2018.45 | 37 | 136.53 | 51 | 188.19 | 38 | 140.22 | 47 | 173.43 | 20 | 73.8 | 3 | 11.07 | 312 | 1151.29 | 40 | 147.6 |
| Z5.6 | 60 | 4229 | 9098 | 2151.34 | 617 | 145.9 | 893 | 211.16 | 588 | 139.04 | 803 | 189.88 | 335 | 79.21 | 67 | 15.84 | 5178 | 1224.4 | 615 | 145.42 |
| Z5.7 | 71 | 434 | 839 | 1933.18 | 58 | 133.64 | 54 | 124.42 | 99 | 228.11 | 81 | 186.64 | 16 | 36.87 | 13 | 29.95 | 451 | 1039.17 | 70 | 161.29 |


References
- Public Health Agency of Canada. Leading Causes of Hospitalizations, Canada, 2009/10, Males and Females Combined, Counts (Age-Specific Hospitalization Rate per 100,000). 2016. Available online: https://www.canada.ca/en/public-health/services/reports-publications/leading-causes-death-hospitalization-canada/2009-10-males-females-combined-counts-specific-hospitalization-rate.html (accessed on 28 July 2020).
- Dixon, J.; Welch, N. Researching the rural-metropolitan health differential using the “social determinants of health”. Aust. J. Rural Health 2000, 8, 254–260. [Google Scholar] [CrossRef]
- Eagan, T.M.L.; Gulsvik, A.; Eide, G.E.; Bakke, P.S. The effect of educational level on the incidence of asthma and respiratory symptoms. Respir. Med. 2004, 98, 730–736. [Google Scholar] [CrossRef]
- Hedlund, U.; Eriksson, K.; Rönmark, E. Socio-economic status is related to incidence of asthma and respiratory symptoms in adults. Eur. Respir. J. 2006, 28, 303–310. [Google Scholar] [CrossRef] [PubMed]
- Karunanayake, C.P.; Hagel, L.; Rennie, D.C.; Lawson, J.A.; Dosman, J.A.; Pahwa, P.; Gordon, J.; Chen, Y.; Dyck, R.; Janzen, B.; et al. Prevalence and risk factors of respiratory symptoms in rural population. J. Agromed. 2015, 20, 310–317. [Google Scholar] [CrossRef]
- Carrière, G.M.; Garner, R.; Sanmartin, C. Housing conditions and respiratory hospitalizations among first nations people in Canada. Health Rep. 2017, 28, 9–15. [Google Scholar] [PubMed]
- Larcombe, L.; Nickerson, P.; Singer, M.; Robson, R.; Dantouze, J.; McKay, L.; Orr, P. Housing conditions in 2 Canadian first nations communities. Int. J. Circumpolar Health 2011, 70, 141–153. [Google Scholar] [CrossRef] [PubMed]
- Moore, H.C.; De Klerk, N.; Richmond, P.; Lehmann, D. A retrospective population-based cohort study identifying target areas for prevention of acute lower respiratory infections in children. BMC Public Health 2010, 10, 757. [Google Scholar] [CrossRef]
- Dales, R.E.; Zwanenburg, H.; Burnett, R.; Franklin, C.A. Respiratory health effects of home dampness and molds among Canadian children. Am. J. Epidemiol. 1991, 134, 196–203. [Google Scholar] [CrossRef]
- Berghout, J.; Miller, J.D.; Mazerolle, R.; O’Neill, L.; Wakelin, C.; Mackinnon, B.; Maybee, K.; Augustine, D.; Levi, C.A.; Levi, C.; et al. Indoor environmental quality in homes of asthmatic children on the Elsipogtog Reserve (NB), Canada. Int. J. Circumpolar Health 2005, 64, 77–85. [Google Scholar] [CrossRef][Green Version]
- Banerji, A.; Greenberg, D.; White, L.F.; MacDonald, W.A.; Saxton, A.; Thomas, E.; Sage, D.; Mamdani, M.; Lanctôt, K.L.; Mahony, J.B.; et al. Risk factors and viruses associated with hospitalization due to lower respiratory tract infections in canadian inuit children: A case-control study. Pediatr. Infect. Dis. J. 2009, 28, 697–701. [Google Scholar] [CrossRef]
- Morris, R.D.; Munasinghe, R.L. Geographic variability in hospital admission rates for respiratory disease among the elderly in the United States. Chest 1994, 106, 1172–1181. [Google Scholar] [CrossRef] [PubMed]
- Siegel, C.; Davidson, A.; Kafadar, K.; Norris, J.M.; Todd, J.; Steiner, J. Geographic analysis of pertussis infection in an urban area: A tool for health services planning. Am. J. Public Health 1997, 87, 2022–2026. [Google Scholar] [CrossRef] [PubMed]
- Crighton, E.J.; Elliott, S.J.; Moineddin, R.; Kanaroglou, P.; Upshur, R.E.G. An exploratory spatial analysis of pneumonia and influenza hospitalizations in Ontario by age and gender. Epidemiol. Infect. 2007, 135, 253–261. [Google Scholar] [CrossRef] [PubMed]
- Haggerty, J.L.; Roberge, D.; Lévesque, J.-F.; Gauthier, J.; Loignon, C. An exploration of rural–urban differences in healthcare-seeking trajectories- Implications for measures of accessibility. Health Place 2014, 28, 92–98. [Google Scholar] [CrossRef]
- Govind, S.K.; Doumouras, A.G.; Nenshi, R.; Hong, D. Geographic variation in appendiceal perforation rates in Canada: A population-based cohort study. J. Gastrointest. Surg. 2020, 24, 2620–2627. [Google Scholar] [CrossRef]
- Lawson, J.A.; Rennie, D.C.; Cockcroft, D.W.; Dyck, R.; Afanasieva, A.; Oluwole, O.; Afsana, J. Childhood asthma, asthma severity indicators, and related conditions along an urban-rural gradient: A cross-sectional study. BMC Pulm. Med. 2017, 17, 15–17. [Google Scholar] [CrossRef] [PubMed]
- Langley, R.L. Consequences of respiratory exposures in the farm environment. N. C. Med. J. 2011, 72, 477–480. [Google Scholar]
- Hoppin, J.A.; Umbach, D.M.; London, S.J.; Alavanja, M.C.R.; Sandler, D.P. Chemical predictors of wheeze among farmer pesticide applicators in the agricultural health study. Am. J. Respir. Crit. Care Med. 2002, 165, 683–689. [Google Scholar] [CrossRef]
- Gomez, M.I.; Hwang, S.A.; Lin, S.; Stark, A.D.; May, J.J.; Hallman, E.M. Prevalence and predictors of respiratory symptoms among New York farmers and farm residents. Am. J. Ind. Med. 2004, 46, 42–54. [Google Scholar] [CrossRef]
- Villeneuve, P.J.; Chen, L.; Rowe, B.H.; Coates, F. Outdoor air pollution and emergency department visits for asthma among children and adults: A case-crossover study in northern Alberta, Canada. Environ. Health 2007, 6, 1–12. [Google Scholar] [CrossRef]
- Serrano-Lomelin, J.; Nielsen, C.C.; Hicks, A.; Crawford, S.; Bakal, J.A.; Ospina, M.B. Geographic inequalities of respiratory health services utilization during childhood in Edmonton and Calgary, Canada: A tale of two cities. Int. J. Environ. Res. Public Health 2020, 17, 8973. [Google Scholar] [CrossRef]
- Statistics Canada. Census Profile, 2016 Census—Alberta [Province] and Canada [Country]. 2017. Available online: https://www12.statcan.gc.ca/census-recensement/2016/dp-pd/prof/details/Page.cfm?Lang=E&Geo1=PR&Code1=48&Geo2=&Code2=&SearchText=Alberta&SearchType=Begins&SearchPR=01&B1=All&GeoLevel=PR&GeoCode=48&type=0 (accessed on 18 April 2021).
- Von Elm, E.; Altman, D.G.; Egger, M.; Pocock, S.J.; Gøtzsche, P.C.; Vandenbrouckef, J.P. The Strengthening the Reporting of Observational Studies in Epidemiology (STROBE) statement: Guidelines for reporting observational studies. Bull. World Health Organ. 2007, 85, 867–872. [Google Scholar] [CrossRef] [PubMed]
- Belon, A.P.; Serrano-Lomelin, J.; Nykiforuk, C.I.J.; Hicks, A.; Crawford, S.; Bakal, J.; Ospina, M.B. Health gradients in emergency visits and hospitalisations for paediatric respiratory diseases: A population-based retrospective cohort study. Paediatr. Perinat. Epidemiol. 2020, 34, 150–160. [Google Scholar] [CrossRef]
- Serrano-Lomelin, J.; Hicks, A.; Kumar, M.; Johnson, D.W.; Chari, R.; Osornio-Vargas, A.; Crawford, S.; Bakal, J.; Ospina, M.B. Patterns of respiratory health services utilization from birth to 5 years of children who experienced adverse birth outcomes. PLoS ONE 2021, 16, e0247527. [Google Scholar] [CrossRef] [PubMed]
- Canadian Institute for Health Information. International Statistical Classification of Diseases and Related Health Problems, Tenth Revision, Canada. 2015. Available online: http://assets.ibc.ca/Documents/Auto%20Insurance/ICD-10-CA%202015.pdf (accessed on 28 July 2020).
- Alberta Health Services and Alberta Health. Official Standard Geographic Areas. 2018. Available online: https://open.alberta.ca/dataset/a14b50c9-94b2-4024-8ee5-c13fb70abb4a/resource/70fd0f2c-5a7c-45a3-bdaa-e1b4f4c5d9a4/download/Official-Standard-Geographic-Area-Document.pdf (accessed on 28 July 2020).
- Alberta Government. Alberta Population Estimates—Data Tables. Sub-Provincial Areas Population Estimates: Census Metropolitan Areas, 2001–2018. 2019. Available online: https://open.alberta.ca/dataset/alberta-population-estimates-data-tables (accessed on 4 May 2021).
- Statistics Canada. Population and Dwelling Count Highlight Tables, 2011 Census. 2011. Available online: https://www12.statcan.gc.ca/census-recensement/2011/dp-pd/hlt-fst/pd-pl/Table-Tableau.cfm?LANG=Eng&T=205&S=3&RPP=50 (accessed on 5 May 2021).
- Natural Regions Committee. Natural Regions and Subregions of Alberta. 2006. Available online: http://albertaparks.ca/albertaparksca/management-land-use/current-parks-system.aspx (accessed on 8 May 2021).
- Statistics Canada. Dissemination Area: Detailed Definition. 2018. Available online: https://www150.statcan.gc.ca/n1/pub/92-195-x/2011001/geo/da-ad/def-eng.htm (accessed on 19 June 2021).
- Statistics Canada. GeoSuite, 2006. Census Geographic Data Products; Statistics Canada: Ottawa, ON, Canada, 2007. [Google Scholar]
- DMTI Spatial Inc. Platinum Postal Suite: CanMap Multiple Enhanced Postal Code Geography 2001–2013; DMTI Spatial Inc.: Markham, ON, Canada, 2014. [Google Scholar]
- QGIS Version 3.4.14. QGIS Org: A Free and Open Source Geographic Information System. 2019. Available online: https://www.qgis.org/en/site/ (accessed on 19 June 2021).
- Pampalon, R.; Hamel, D.; Gamache, P.; Philibert, M.D.; Raymond, G.; Simpson, A. Un indice régional de défavorisation matérielle et sociale pour la santé publique au Québec et au Canada. Can. J. Public Health 2012, 103, S17–S22. [Google Scholar] [CrossRef] [PubMed]
- Pampalon, R.; Hamel, D.; Gamache, P.; Raymond, G. A deprivation index for health planning in Canada. Chronic Dis. Can. 2009, 29, 178–191. [Google Scholar] [CrossRef]
- Material and Social Deprivation Index: A Summary. Institut National de Santé Publique du Québec, Bureau D’information et D’études en Santé des Populations—INSPQWebsite. 2019. Available online: www.inspq.qc.ca/en/publications/2639 (accessed on 18 April 2021).
- Hosseinpoor, A.R.; Schlotheuber, A.; Nambiar, D.; Ross, Z. Health equity assessment toolkit plus (HEAT Plus): Software for exploring and comparing health inequalities using uploaded datasets. Glob. Health Action 2018, 11, 20–30. [Google Scholar] [CrossRef]
- ESRI. What Is the Jenks Optimization Method? 2016. Available online: https://support.esri.com/en/technical-article/000006743 (accessed on 28 April 2021).
- StataCorp. Stata Statistical Software, Version 15.1; College Station: Texas, TX, USA, 2017. [Google Scholar]
- Schober, P.; Schwarte, L.A. Correlation coefficients: Appropriate use and interpretation. Anesth. Analg. 2018, 126, 1763–1768. [Google Scholar] [CrossRef]
- Predy, G.; Lightfoot, P.; Edwards, J.; Sevcik, M.; Fraser-Lee, N.; Zhang, J.; Dominey, J.; Si, J.; Meyer, C.; Pennicott, D.; et al. How Healthy Are We? 2010 Report of the Senior Medical Officer of Health; Population and Public Health, Alberta Health Services: Edmonton, AB, Canada, 2011; pp. 1–9. [Google Scholar]
- McLeod, C.; Adunuri, N.; Booth, R. Risk factors and mitigation of influenza among Indigenous children in Australia, Canada, United States, and New Zealand: A scoping review. Perspect Public Health 2019, 139, 228–235. [Google Scholar] [CrossRef] [PubMed]
- Basnayake, T.L.; Morgan, L.C.; Chang, A.B. The global burden of respiratory infections in indigenous children and adults: A review. Respirology 2017, 22, 1518–1528. [Google Scholar] [CrossRef]
- Guèvremont, A.; Carrière, G.; Bougie, E.; Kohen, D. Acute care hospitalization of Aboriginal children and youth standard table symbols. Health Rep. 2017, 11–17. Available online: https://www150.statcan.gc.ca/n1/pub/82-003-x/2017007/article/14844-eng.pdf (accessed on 28 April 2021).
- Latycheva, O.; Chera, R.; Hampson, C.; Masuda, J.R.; Stewart, M.; Elliott, S.J.; Fenton, N.E. Engaging first nation and inuit communities in asthma management and control: Assessing cultural appropriateness of educational resources. Rural. Remote. Health 2013, 13, 1–11. [Google Scholar]
- Li, F.X.; Robson, P.J.; Ashbury, F.D.; Hatcher, J.; Bryant, H.E. Smoking frequency, prevalence and trends, and their socio-demographic associations in Alberta, Canada. Can. J. Public Health 2009, 100, 453–458. [Google Scholar] [CrossRef]
- Vanker, A.; Gie, R.P.; Zar, H.J. The association between environmental tobacco smoke exposure and childhood respiratory disease: A review. Expert Rev. Respir. Med. 2017, 11, 661–673. [Google Scholar] [CrossRef] [PubMed]
- A Rural-Urban Comparison of Health Indicators. 2003. Available online: https://citeseerx.ist.psu.edu/viewdoc/download?doi=10.1.1.627.4498&rep=rep1&type=pdf (accessed on 18 April 2021).
- A Costly Diagnosis: Subsidizing Coal Power with Albertans’ Health. 2013. Available online: https://www.pembina.org/reports/pi-costly-diagnosis-26032013.pdf (accessed on 18 April 2021).
- La Grutta, S.; Indinnimeo, L.; di Coste, A.; Ferrante, G.; Landi, M.; Pelosi, U.; Rusconi, F. Environmental risk factors and lung diseases in children: From guidelines to health effects. Early Hum. Dev. 2013, 89, S59–S62. [Google Scholar] [CrossRef]
- Passos, S.D.; Gazeta, R.E.; Felgueiras, A.P.; Beneli, P.C.; Coelho, M.D.S.Z.S. Do pollution and climate influence respiratory tract infections in children? Rev. Assoc. Med. Bras. 2014, 60, 276–283. [Google Scholar] [CrossRef] [PubMed][Green Version]
- Wang, K.Y.; Chau, T.T. An association between air pollution and daily outpatient visits for respiratory disease in a heavy industry area. PLoS ONE 2013, 8, e75220. [Google Scholar] [CrossRef] [PubMed]
- Government of Alberta. Alberta Climate Information Service (ACIS) Data Products & Tools. 2020. Available online: http://agriculture.alberta.ca/acis/ (accessed on 18 April 2021).
- Radhakrishnan, D.; Ouedraogo, A.; Shariff, S.Z.; McNally, J.D.; Benchimol, E.I.; Clemens, K.K. The association between climate, geography and respiratory syncitial virus hospitalizations among children in Ontario, Canada: A population-based study. BMC Infect. Dis. 2020, 20, 1–9. [Google Scholar] [CrossRef] [PubMed]
- Mäkinen, T.M.; Juvonen, R.; Jokelainen, J.; Harju, T.H.; Peitso, A.; Bloigu, A.; Silvennoinen-Kassinen, S.; Leinonen, M.; Hassi, J. Cold temperature and low humidity are associated with increased occurrence of respiratory tract infections. Respir. Med. 2009, 103, 456–462. [Google Scholar] [CrossRef] [PubMed]
- Liu, X.; Shahid, R.; Patel, A.B.; McDonald, T.; Bertazzon, S.; Waters, N.; Seidel, J.E.; Marshall, D.A. Geospatial patterns of comorbidity prevalence among people with osteoarthritis in Alberta Canada. BMC Public Health 2020, 20, 1–11. [Google Scholar] [CrossRef]
- Sibley, L.M.; Weiner, J.P. An evaluation of access to health care services along the rural-urban continuum in Canada. BMC Health Serv. Res. 2011, 11, 20. [Google Scholar] [CrossRef] [PubMed]
- Lind, C.; Russell, M.L.; Collins, R.; MacDonald, J.; Frank, C.J.; Davis, A.E. How rural and urban parents describe convenience in the context of school-based influenza vaccination: A qualitative study. BMC Health Serv. Res. 2015, 15, 1–7. [Google Scholar] [CrossRef] [PubMed]
- Government of Alberta. Seasonal Influenza in Alberta—2019–2020 Season. 2020. Available online: https://open.alberta.ca/publications/2561-3154 (accessed on 14 July 2021).
- Health Quality Council of Alberta. Influenza Vaccination Rates for Selected High Risk Groups. 2021. Available online: https://focus.hqca.ca/primaryhealthcare/influenzavaccine-rates/ (accessed on 14 July 2021).
- Estrada, R.D.; Ownby, D.R. Rural asthma: Current understanding of prevalence, patterns, and interventions for children and adolescents. Curr. Allergy Asthma Rep. 2017, 17, 65–78. [Google Scholar] [CrossRef] [PubMed]
- Shah, T.I.; Clark, A.F.; Seabrook, J.A.; Sibbald, S.; Gilliland, J.A. Geographic accessibility to primary care providers: Comparing rural and urban areas in Southwestern Ontario. Can. Geogr 2020, 64, 65–78. [Google Scholar] [CrossRef]
- Amsalu, E.T.; Akalu, T.Y.; Gelaye, K.A.; Anderson, K.; Weis, T.; Thibault, B.; Khan, F.; Nanni, B.; Farber, N.; Atkinson, P.R.T.; et al. Asthma presentations by children to emergency departments in a Canadian province: A population-based study. Pediatr. Infect. Dis. J. 2017, 45, 9–10. [Google Scholar] [CrossRef][Green Version]
- Alberta Health Services. Service Visit Rates. 2017. Available online: https://www.albertahealthservices.ca/about/page13379.aspx (accessed on 18 April 2021).
- Canadian Institute for Health Information. Geographic Distribution of Physicians in Canada—Beyond How Many and Where. 2005. Available online: https://secure.cihi.ca/free_products/Geographic_Distribution_of_Physicians_FINAL_e.pdf (accessed on 14 July 2021).
- Statistics Canada. Guide to the Census of Population, 2016. 2017. Available online: https://www12.statcan.gc.ca/census-recensement/2016/ref/98-304/98-304-x2016001-eng.pdf (accessed on 19 June 2021).


| Alberta | South Z1.1–1.5 | Calgary Z2.1–2.7 | Central Z3.1–3.7 | Edmonton Z4.1–4.9 | North Z5.1–5.7 | |
|---|---|---|---|---|---|---|
| Births, n (%) | 205,516 (100%) | 9841 (4.79%) | 84,776 (41.25%) | 21,758 (10.59%) | 67,786 (32.98%) | 21,335 (10.38%) |
| Events, n (%) | 297,306 (100%) | 17,263 (5.81%) | 94,340 (31.73%) | 44,258 (14.89%) | 67,236 (22.62%) | 74,209 (24.96%) |
| Events per birth | 1.45 | 1.75 | 1.11 | 2.03 | 0.99 | 3.48 |
| Zone | Subzone | Total | Asthma | Bronchitis | Bronchiolitis | Croup | Influenza | oLRTI | oURTI | Pneumonia |
|---|---|---|---|---|---|---|---|---|---|---|
| South | Z1.1 | 1.54 | 1.36 | 1.04 | 1.11 | 1.24 | 1.81 | 0.91 | 1.81 | 1.22 |
| Z1.2 | 0.98 | 0.72 | 0.85 | 1.10 | 1.15 | 1.11 | 0.66 | 0.98 | 0.96 | |
| Z1.3 | 2.00 | 1.21 | 3.17 | 1.39 | 1.81 | 2.45 | 1.56 | 2.31 | 1.19 | |
| Z1.4 | 0.86 | 0.78 | 0.70 | 0.89 | 1.02 | 1.13 | 1.21 | 0.83 | 0.82 | |
| Z1.5 | 0.79 | 0.99 | 0.51 | 1.00 | 0.91 | 0.81 | 0.41 | 0.66 | 1.28 | |
| Calgary | Z2.1 | 0.59 | 0.98 | 0.14 | 0.64 | 0.91 | 0.68 | 0.44 | 0.48 | 0.59 |
| Z2.2 | 0.62 | 1.07 | 0.14 | 0.65 | 0.60 | 0.80 | 0.54 | 0.55 | 0.70 | |
| Z2.3 | 0.71 | 1.09 | 0.28 | 0.73 | 0.94 | 0.82 | 0.57 | 0.62 | 0.75 | |
| Z2.4 | 0.71 | 1.00 | 0.28 | 0.69 | 0.96 | 0.81 | 0.53 | 0.63 | 0.78 | |
| Z2.5 | 1.65 | 1.50 | 1.22 | 1.14 | 1.56 | 1.45 | 2.06 | 1.85 | 1.42 | |
| Z2.6 | 1.24 | 1.21 | 1.15 | 0.98 | 1.46 | 1.15 | 1.37 | 1.26 | 1.17 | |
| Z2.7 | 1.06 | 1.28 | 0.59 | 1.10 | 1.04 | 0.93 | 1.15 | 0.99 | 1.50 | |
| Central | Z3.1 | 2.05 | 1.41 | 2.42 | 1.49 | 1.38 | 1.52 | 1.46 | 2.49 | 1.66 |
| Z3.2 | 1.00 | 0.83 | 1.24 | 0.83 | 1.12 | 1.09 | 1.02 | 1.07 | 0.66 | |
| Z3.3 | 1.94 | 1.39 | 4.43 | 1.20 | 1.66 | 1.48 | 1.15 | 2.12 | 1.56 | |
| Z3.4 | 1.72 | 1.20 | 2.02 | 1.62 | 1.21 | 1.80 | 4.55 | 1.67 | 2.60 | |
| Z3.5 | 1.79 | 1.04 | 2.63 | 1.51 | 1.40 | 1.10 | 1.85 | 2.12 | 1.17 | |
| Z3.6 | 2.04 | 1.05 | 2.79 | 1.71 | 1.15 | 1.50 | 2.66 | 2.48 | 1.60 | |
| Z3.7 | 0.71 | 0.94 | 0.79 | 0.75 | 0.83 | 0.81 | 0.50 | 0.64 | 0.60 | |
| Edmonton | Z4.1 | 0.66 | 0.84 | 0.38 | 0.84 | 0.80 | 0.61 | 0.46 | 0.59 | 0.77 |
| Z4.2 | 0.74 | 0.91 | 0.43 | 1.05 | 0.84 | 0.71 | 0.54 | 0.65 | 0.90 | |
| Z4.3 | 0.54 | 0.80 | 0.24 | 0.75 | 0.73 | 0.43 | 0.40 | 0.45 | 0.57 | |
| Z4.4 | 0.46 | 0.61 | 0.17 | 0.55 | 0.68 | 0.32 | 0.31 | 0.40 | 0.44 | |
| Z4.5 | 0.96 | 0.82 | 1.30 | 1.30 | 1.10 | 0.68 | 0.36 | 0.89 | 0.95 | |
| Z4.6 | 0.69 | 0.69 | 0.45 | 0.77 | 0.86 | 0.36 | 0.39 | 0.73 | 0.47 | |
| Z4.7 | 0.96 | 0.92 | 1.41 | 0.75 | 1.11 | 0.61 | 1.45 | 0.90 | 1.05 | |
| Z4.8 | 0.90 | 0.65 | 0.77 | 1.07 | 1.13 | 0.70 | 1.15 | 0.78 | 1.43 | |
| Z4.9 | 0.61 | 0.79 | 0.23 | 0.85 | 1.04 | 0.57 | 0.32 | 0.44 | 0.85 | |
| North | Z5.1 | 2.06 | 1.14 | 4.49 | 1.69 | 1.57 | 1.62 | 1.71 | 2.35 | 1.32 |
| Z5.2 | 2.83 | 1.59 | 4.59 | 2.02 | 1.30 | 3.30 | 4.63 | 3.29 | 2.86 | |
| Z5.3 | 2.50 | 1.06 | 4.80 | 2.63 | 1.53 | 2.33 | 2.30 | 2.94 | 1.49 | |
| Z5.4 | 3.11 | 1.43 | 4.54 | 3.58 | 1.23 | 3.22 | 4.57 | 3.57 | 3.21 | |
| Z5.5 | 1.40 | 0.98 | 2.67 | 1.16 | 1.04 | 2.04 | 0.44 | 1.53 | 1.10 | |
| Z5.6 | 1.49 | 1.04 | 3.00 | 1.15 | 1.13 | 2.19 | 0.64 | 1.63 | 1.09 | |
| Z5.7 | 1.34 | 0.96 | 1.76 | 1.88 | 1.12 | 1.02 | 1.20 | 1.38 | 1.20 |
| Material Deprivation | Social Deprivation | |
|---|---|---|
| SPR total | 0.48 * | −0.29 |
| SPR asthma | 0.44 * | −0.05 |
| SPR bronchitis | 0.36 * | −0.33 |
| SPR bronchiolitis | 0.36 * | −0.23 |
| SPR croup | 0.40 * | −0.36 * |
| SPR influenza | 0.47 * | −0.16 |
| SPR oLRTI | 0.51 * | −0.16 |
| SPR oURTI | 0.46 * | −0.31 |
| SPR pneumonia | 0.40 * | −0.22 |
Publisher’s Note: MDPI stays neutral with regard to jurisdictional claims in published maps and institutional affiliations. |
© 2021 by the authors. Licensee MDPI, Basel, Switzerland. This article is an open access article distributed under the terms and conditions of the Creative Commons Attribution (CC BY) license (https://creativecommons.org/licenses/by/4.0/).
Share and Cite
Kassam, S.; Serrano-Lomelin, J.; Hicks, A.; Crawford, S.; Bakal, J.A.; Ospina, M.B. Geography as a Determinant of Health: Health Services Utilization of Pediatric Respiratory Illness in a Canadian Province. Int. J. Environ. Res. Public Health 2021, 18, 8347. https://doi.org/10.3390/ijerph18168347
Kassam S, Serrano-Lomelin J, Hicks A, Crawford S, Bakal JA, Ospina MB. Geography as a Determinant of Health: Health Services Utilization of Pediatric Respiratory Illness in a Canadian Province. International Journal of Environmental Research and Public Health. 2021; 18(16):8347. https://doi.org/10.3390/ijerph18168347
Chicago/Turabian StyleKassam, Shehzad, Jesus Serrano-Lomelin, Anne Hicks, Susan Crawford, Jeffrey A. Bakal, and Maria B. Ospina. 2021. "Geography as a Determinant of Health: Health Services Utilization of Pediatric Respiratory Illness in a Canadian Province" International Journal of Environmental Research and Public Health 18, no. 16: 8347. https://doi.org/10.3390/ijerph18168347
APA StyleKassam, S., Serrano-Lomelin, J., Hicks, A., Crawford, S., Bakal, J. A., & Ospina, M. B. (2021). Geography as a Determinant of Health: Health Services Utilization of Pediatric Respiratory Illness in a Canadian Province. International Journal of Environmental Research and Public Health, 18(16), 8347. https://doi.org/10.3390/ijerph18168347