
Factors That Influence Climate Change-Related Mortality in the United States: An Integrative Review


Abstract
:1. Introduction
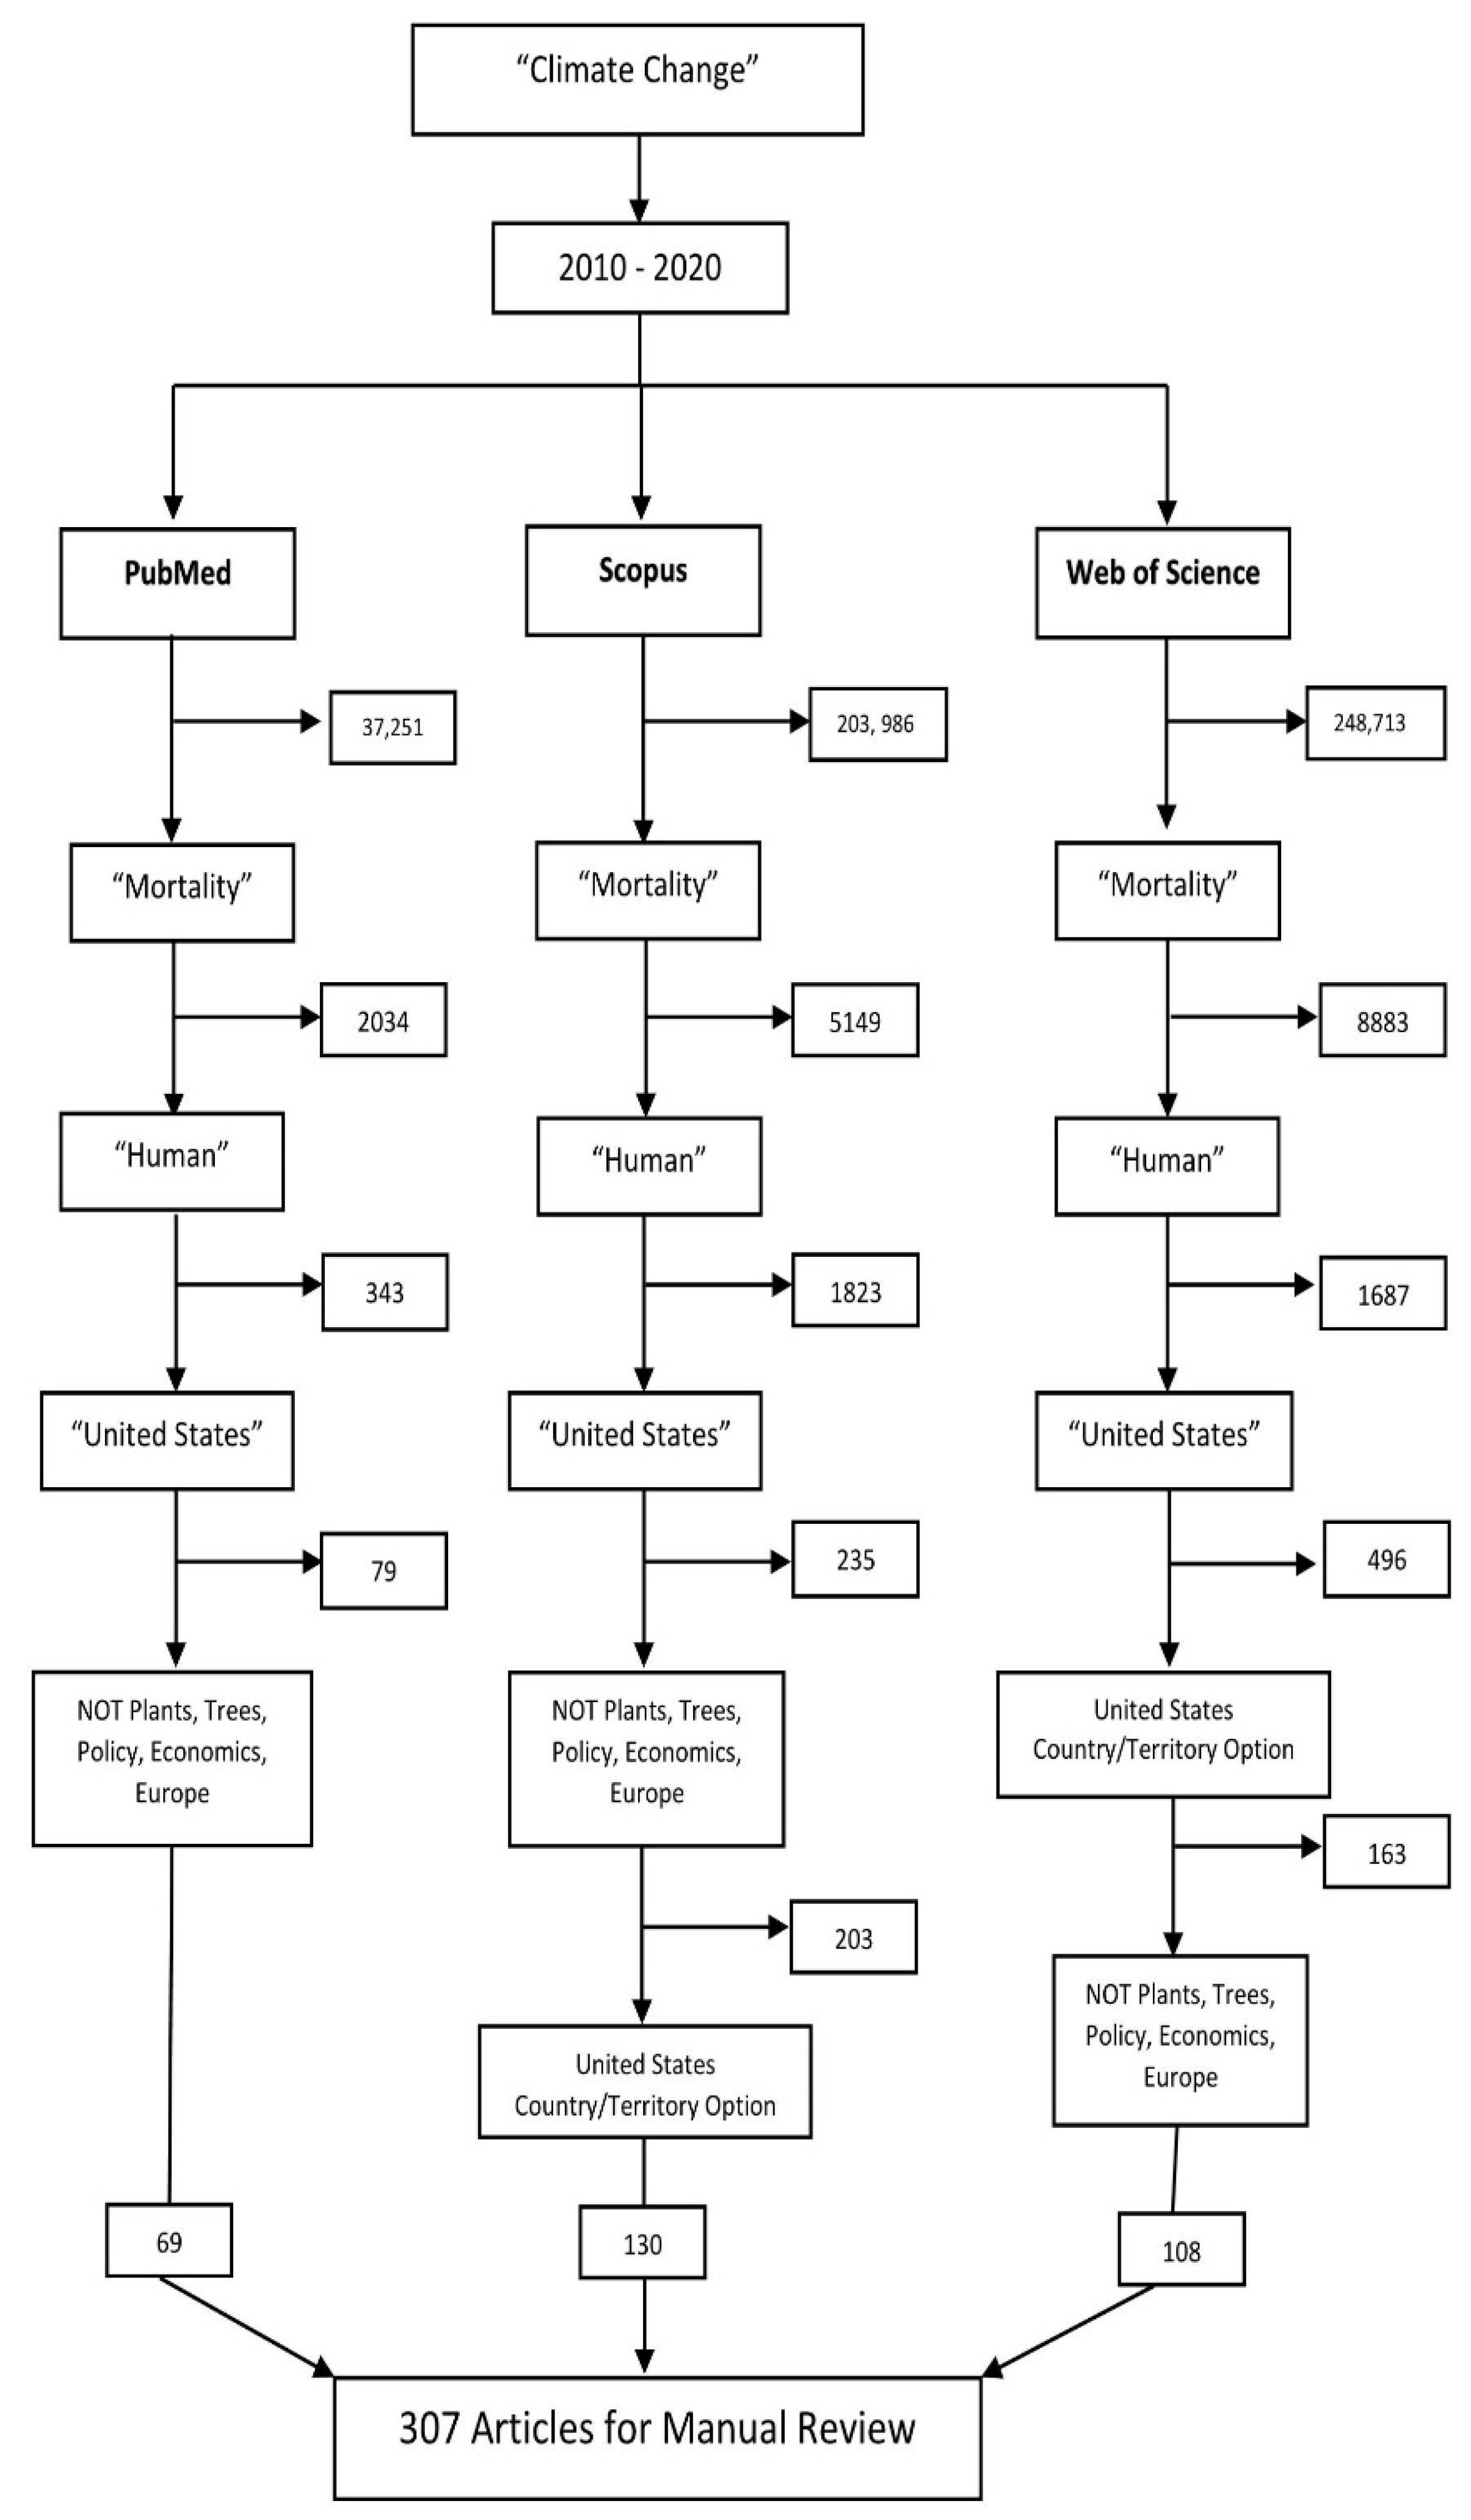
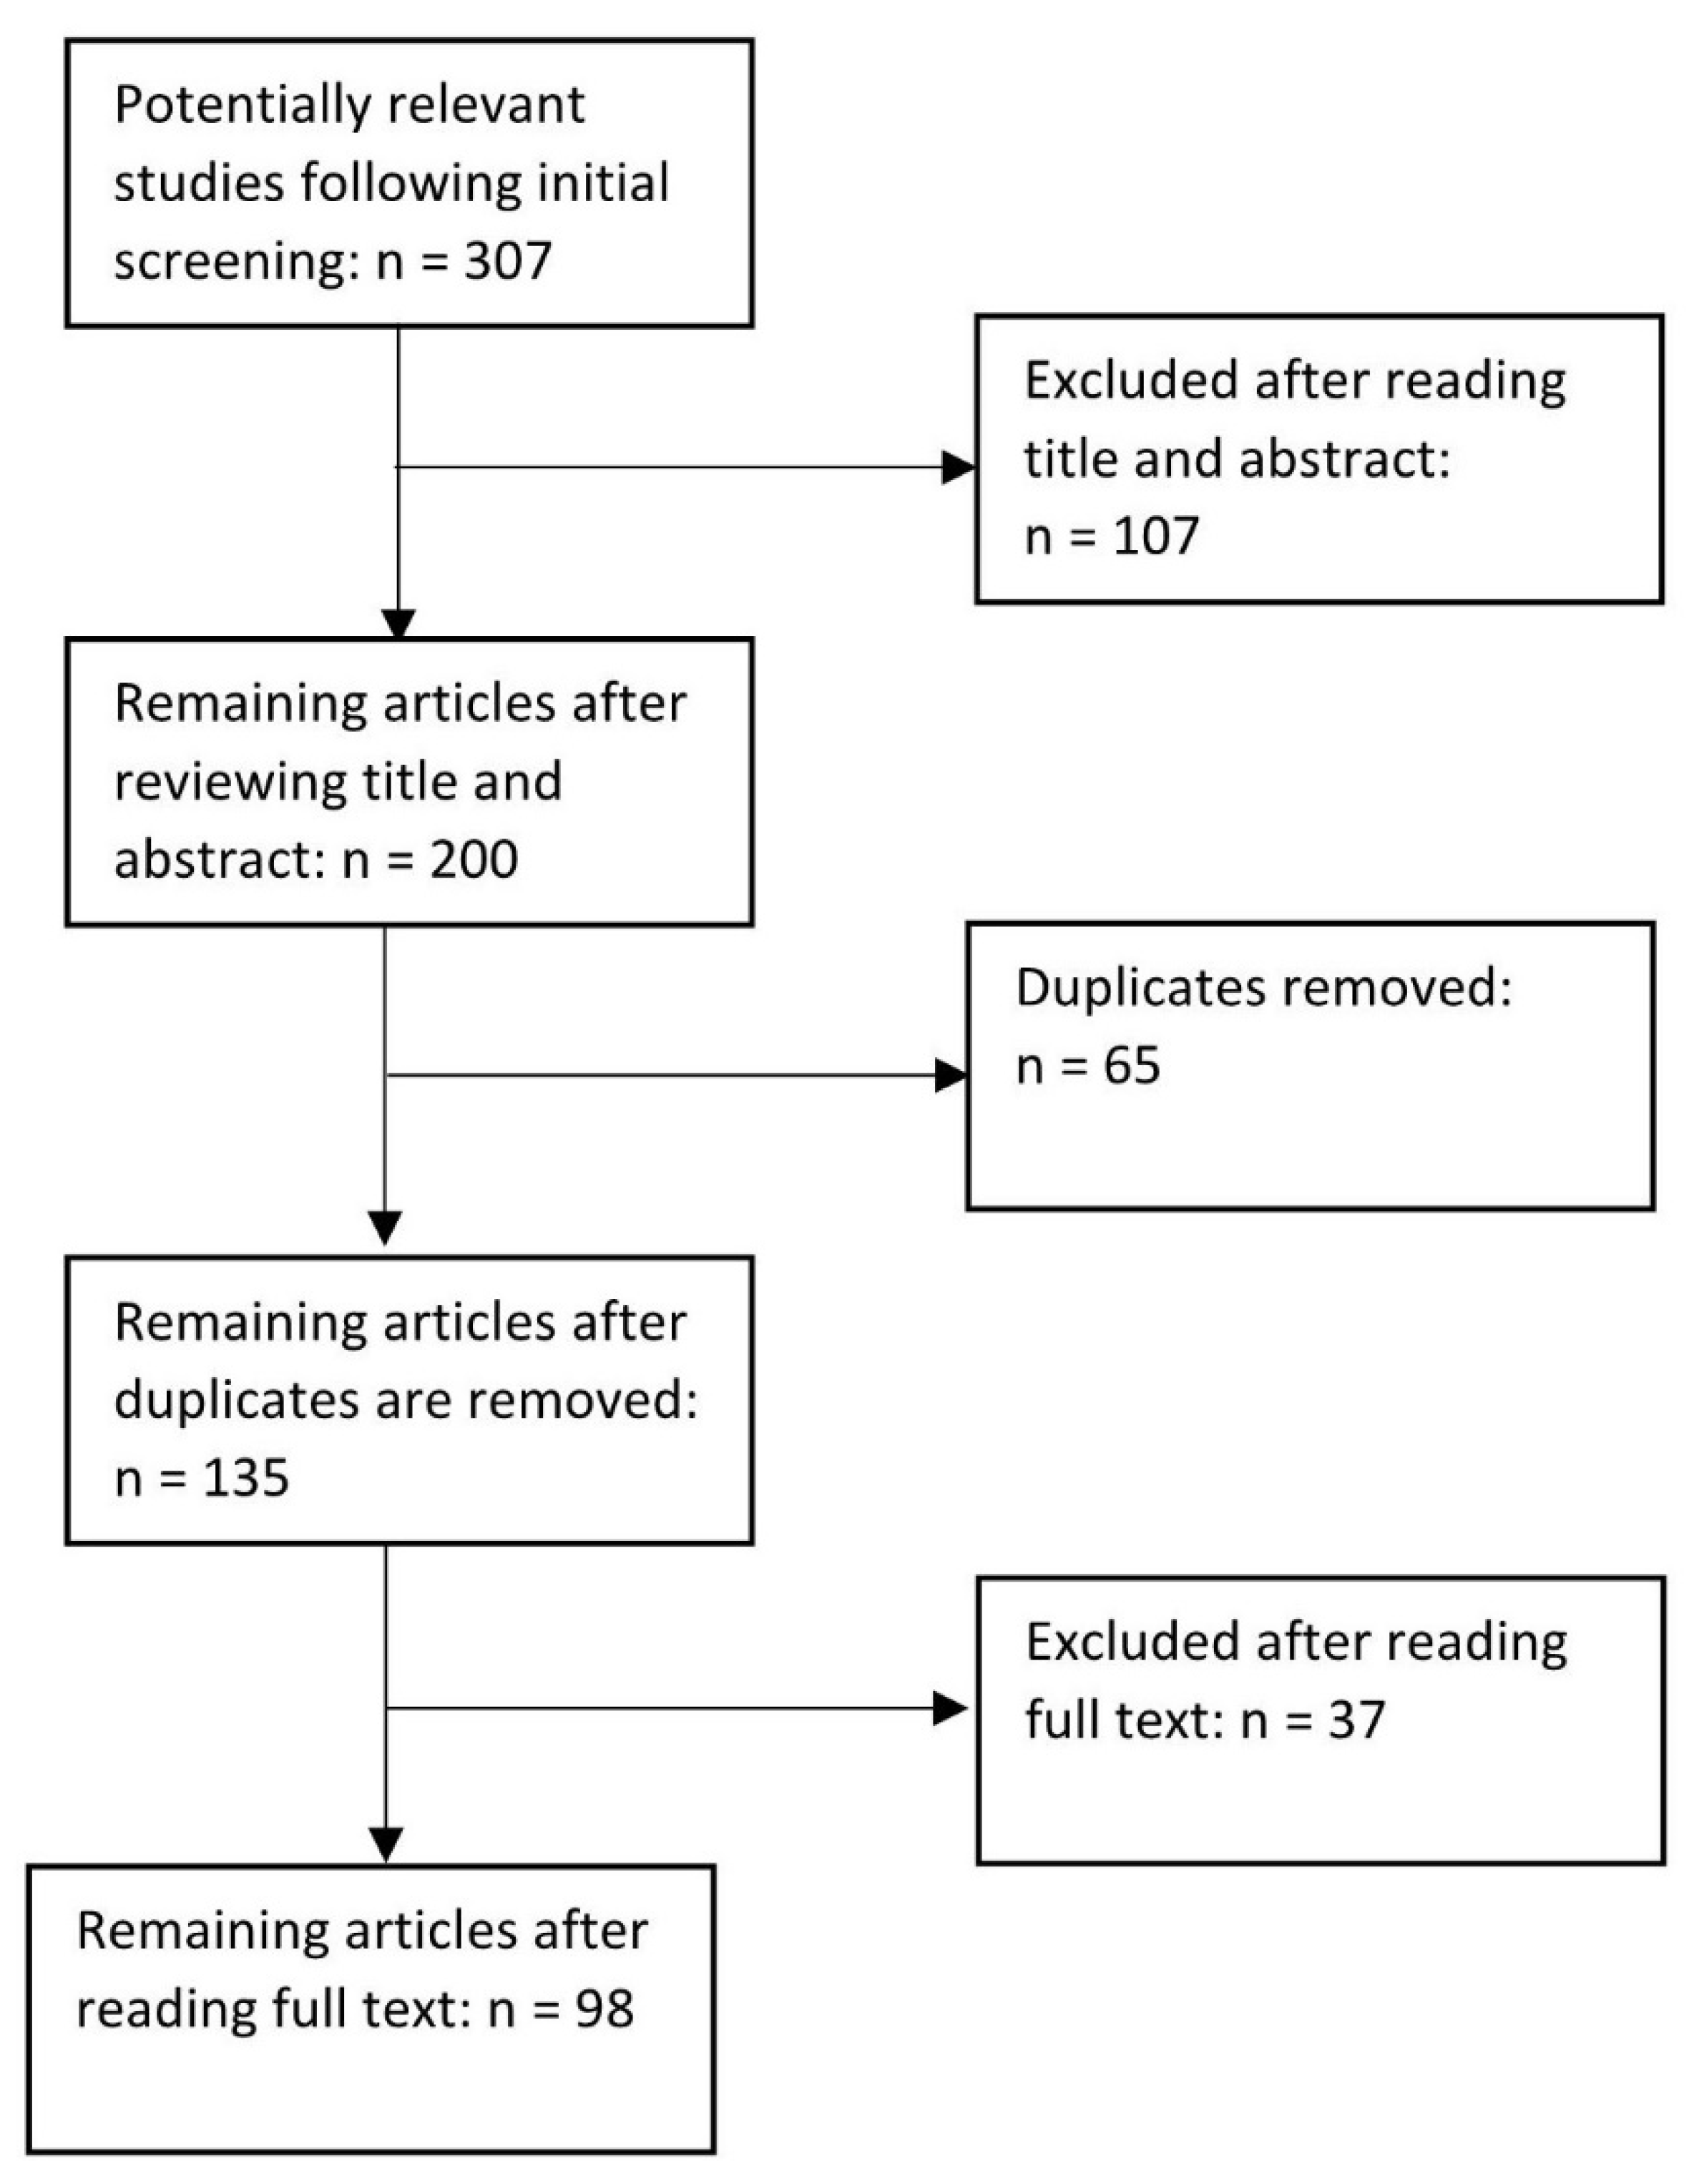
2. Methods
3. Results
3.1. Environmental Changes from Climate Change
3.1.1. Ambient Temperatures
Heat
Cold
Accidents and Injury Related to Ambient Temperatures
3.1.2. Air Quality
3.1.3. Drought and Wildfires
3.1.4. Precipitation and Flooding
3.1.5. Infectious and Vector Borne Disease
3.1.6. Mental Health Related to Environmental Changes
3.2. Social and Demographic Factors
3.2.1. Geographic Factors
3.2.2. Rural
3.2.3. Urban
3.2.4. Influence of Gender
3.2.5. Age
3.2.6. Race and Ethnicity
3.2.7. Occupation
3.2.8. Socioeconomic Status
4. Discussion
5. Conclusions
Author Contributions
Funding
Institutional Review Board Statement
Informed Consent Statement
Acknowledgments
Conflicts of Interest
Appendix A. List of Articles Included in the Review
| Reference Citation (Authors and Year with Corresponding Citation Number), Alphabetical | Climate Change Mortality Risk Factor(s) | Location of Population Studied |
| Achakulwisut, P.; Anenberg, S.; Neumann, J.; Penn, S.L.; Weiss, N. 2019. [58] | Age, air quality, drought, geographic factors | Southwest United States |
| Acharya, P.; Boggess, B.; Zhang, K. 2018. [98] | Age, gender, heat, occupation, race/ethnicity | United States |
| Alexeeff, S.E.; Pfister, G.G.; Nychka, D. 2016. [60] | Air quality, geographic factors | United States |
| Anderson, G.B.; Bell, M.L. 2011. [18] | Heat, socioeconomic status (SES) | United States |
| Anderson, G.B.; Bell, M.L. 2012. [52] | Age, extreme weather, heat, power outages | New York City |
| Barnett, A.G.; Hajat, S.; Gasparrini, A.; Rocklöv, J. 2012. [42] | Extreme cold, heat, SES | United States |
| Barrett, B.; Charles, J.W.; Temte, J.L. 2015. [13] | Changing disease patterns, extreme weather, geographic factors, mental health, SES | Editorial. No location identified. |
| Bell, J.E.; Brown, C.L.; Conlon, K.; Herring, S.; Kunkel, K.E.; Lawrimore, J.; et al. 2018. [3] | Age, extreme weather (heat waves, floods, extreme precipitation, wildfires, droughts, hurricanes), geographic factors, race/ethnicity, SES | United States |
| Berman, J.D.; Ebisu, K.; Peng, R.D.; Dominici, F.; Bell, M.L. 2017. [63] | Drought | Western United States |
| Bobb, J.F.; Dominici, F.; Peng, R.D. 2011. [72] | Air quality | United States |
| Carnes, B.A.; Staats, D.; Willcox, B.J. 2014. [4] | Age, air quality, heat, rural/urban, water borne diseases | United States |
| Chang, H.H.; Zhou, J.; Fuentes, M. 2010. [62] | Air quality | Southeastern United States |
| Clearfield, M.; Pearce, M.; Nibbe, Y.; Crotty, D.; Wagner, A. 2014. [57] | Air quality, chronic diseases | United States |
| Conlon, K.C.; Rajkovich, N.B.; White-Newsome, J.L.; Larsen, L.; O’Neill, M.S. 2011. [43] | Age, extreme events (heat waves, floods, extreme precipitation, wildfires, droughts, hurricanes), geographic factors, race/ethnicity, SES | United States |
| Dominianni, C.; Lane, K.; Johnson, S.; Ito, K.; Matte, T. 2018. [44] | Extreme temperature (heat, cold), extreme weather events | New York City |
| Fang, Y.; Mauzerall, D.L.; Liu, J.; Fiore, A.M.; Horowitz, L.W. 2013. [104] | Air quality, geographic factors | Global |
| Fleischer, N.L.; Melstrom, P.; Yard, E.; Brubaker, M.; Thomas, T. 2014. [51] | Geographic factors, race/ethnicity, temperature (warmer cold seasons) | Alaska |
| Gronlund, C.J.; Cameron, L.; Shea, C.; O’Neill, M.S. 2019. [64] | Age, geographic factors, heat, precipitation | Michigan |
| Gronlund, C.J.; Zanobetti, A.; Schwartz, J.D.; Wellenius, G.A.; O’Neill, M.S. 2014. [27] | Age, heat | United States |
| Gubernot, D.M.; Anderson, G.B.; Hunting, K.L. 2015. [88] | Age, gender, heat, labor, race/ethnicity | United States |
| Guo, Y.; Barnett, A.G.; Tong, S. 2012. [89] | Age, heat | United States |
| Guo, Y.; Gasparrini, A.; Li, S.; Sera, F; Vicedo-Cabrera, A.M.; Tong, S. 2018. [33] | Geographic factors, heat | Global (multicountry) |
| Gutierrez, K.; LePrevost, C. 2016. [76] | Air quality, droughts, extreme weather, heat, race/ethnicity, rural/urban, SES | Southeastern United States |
| Hansel, N.N.; McCormack, M.C.; Kim, V. 2016. [20] | Air quality, temperature, geographic factors, urban/rural | No location identified |
| Harduar Morano, L.; Watkins, S.; Kintziger, K. 2016. [21] | Temperature, gender, race, geographic factors, age | Florida |
| Harlan, S.L.; Declet-Barreto, J.; Stefanov, W.L.; Petitti, D.B. 2013. [100] | Heat, race/ethnicity, rural/urban, SES | Arizona |
| Harlan, S.; Chowell, G.; Yang, S.; Petitti, D.; Morales Butler, E.; Ruddell, B.; et al. 2014. [28] | Age, gender, heat | Arizona |
| Hoehne, C.G.; Hondula, D.M.; Chester, M.V.; Eisenman, D.P.; Middel, A.; Fraser, A.M.; et al. 2018. [86] | Heat, geographic factors, SES, race/ethnicity, gender, age | United States |
| Isaksen, T.B.; Yost, M.; Hom, E.; Fenske, R. 2014. [90] | Heat, age | Washington |
| Isaksen, T.B.; Fenske, R.A.; Hom, E.K.; Ren, Y.; Lyons, H.; Yost, M.G. 2015. [97] | Heat, age | Northwestern United States |
| Jagai, J.S.; Grossman, E.; Navon, L.; Sambanis, A.; Dorevitch, S. 2017. [79] | Heat, geographic factors, rural/urban | Illinois |
| Johnson, M.G.; Brown, S.; Archer, P.; Wendelboe, A.; Magzamen, S.; Bradley, K.K. 2016. [87] | Heat, SES, gender, race/ethnicity, age | Oklahoma |
| Jones, B.; O’Neill, B.C.; McDaniel, L.; McGinnis, S.; Mearns, L.O.; Tebaldi, C. 2015. [5] | Extreme heat events, geographic factors, urban/rural | United States |
| Kalkstein, L.S.; Greene, S.; Mills, D.M.; Samenow, J. 2011. [40] | Heat, geographic factors, SES | United States |
| Kalkstein, A.J.; Kalkstein, L.S.; Vanos, J.K.; Eisenman, D.P.; Grady Dixon, P. 2018. [91] | Heat, heat waves, age | California |
| Kavouras and Chalbot. 2017 [54] | Temperature, air quality | United States |
| Kemble, S.K.; Lynfield, R.; DeVries, A.S.; Drehner, D.; Pomputius, W.F.; Danila, R. 2012. [66] | Infectious disease, heat, geographic factors | Minnesota |
| Kim, B.S.; Gavin, H.E.; Satchell, K.J.F.; D’Orazio, S.E.F. 2017. [67] | Infectious diseases/vector borne disease, heat | No location identified |
| Kingsley, S.L.; Eliot, M.N.; Gold, J.; Vanderslice, R.R.; Wellenius, G.A. 2016. [36] | Heat, race/ethnicity, SES, gender, occupation | Rhode Island |
| Klein Rosanthal, J.; Kinney, P.L.; Metzger, K.B. 2014. [105] | Heat, SES, age, race/ethnicity | New York City |
| Knapp, P.A.; Maxwell, J.T.; Ortegren, J.T. 2016. [69] | Temperature (heat waves and cold spells), geographic factors | 55 U.S. Metro areas |
| Koman, P.D.; Romo, F.; Swinton, P.; Mentz, G.B.; de Majo, R.F.; Sampson, N.R.; et al. 2019. [22] | Heat, race/ethnicity, SES, geographic factors | Michigan |
| Lee, M.; Nordio, F.; Zanobetti, A.; Kinney, P.; Vautard, R.; Schwartz, J. 2014. [70] | Temperature, geographic factors | Unites States |
| Li, B.; Sain, S.; Mearns, L.O.; Anderson, H.A.; Kovats, S.; Patz, J.A. 2012. [92] | Heat | Wisconsin |
| Limaye, V.S.; Vargo, J.; Harkey, M.; Holloway, T.; Patz, J.A. 2018. [73] | Heat, age, geographic factors, SES | Eastern United States |
| Lin, S.; Hsu, W.-H.; Van Zutphen, A.R.; Saha, S.; Luber, G.; Hwang, S.-A. 2012. [84] | Temperature, extreme heat, age, gender, SES, race/ethnicity, urban/rural, geographic factors | New York State |
| MacFadden, D.R.; McGough, S.F.; Fisman, D.; Santillana, M.; Brownstein, J.S. 2018. [68] | Infectious diseases, heat | United States |
| Madrigano, J.; Ito, K.; Johnson, S.; Kinney, P.L.; Matte, T. 2015. [99] | Extreme temperature events (heat waves) (cold waves), race, geographic factors, SES | New York City |
| Madrigano, J.; Jack, D.; Anderson, G.B.; Bell, M.L.; Kinney, P.L. 2015. [85] | Heat, ozone, geographic factors, SES | Northeastern United States |
| Madrigano, J.; Mittleman, M.; Baccarelli, A.; Goldberg, R.; Melly, S.; Von Klot, S.; et al. 2013. [50] | Temperature (heat, cold), SES, age, geographic factors | Massachusetts |
| Matte, T.D.; Lane, K.; Ito, K. 2016. [37] | Heat, geographic factors, SES | New York City |
| Nordio, F.; Zanobetti, A.; Colicino, E.; Kloog, I.; Schwartz, J. 2015. [71] | Temperature-related mortality (heat/ warmer winters), SES, geographic factors | United States |
| Oleson, K.W.; Monaghan, A.; Wilhelmi, O.; Barlage, M.; Brunsell, N.; Feddema, J.; et al. 2013. [77] | Heat, urban/rural | United States and Southern Canada |
| Ostro, B.; Rauch, S.; Green, S. 2011. [29] | Heat | California |
| Parks, R.M.; Bennett, J.E.; Tamura-Wicks, H.; Kontis, V.; Toumi, R.; Danaei, G.; et al. 2020. [39] | Heat (injury deaths), gender, age | United States |
| Peng, R.D.; Bobb, J.F.; Tebaldi, C.; McDaniel, L.; Bell, M.L.; Dominici, F. 2011. [106] | Heat | Illinois |
| Petkova, E.P.; Horton, R.; Bader, D.; Kinney, P.L. 2013. [23] | Heat | Northeast United States |
| Petkova, E.P.; Bader, D.; Anderson, G.; Horton, R.; Knowlton, K.; Kinney, P.L. 2014. [17] | Heat | Pennsylvania, Ohio, Michigan, Minnesota, Oregon, Washington DC |
| Petkova, E.P.; Gasparrini, A.; Kinney, P.L. 2014. [6] | Heat, SES | New York City |
| Petkova, E.P.; Vink, J.K.; Horton, R.M.; Gasparrini, A.; Bader, D.A.; Francis, J.D.; et al. 2017. [38] | Heat, urban/rural | New York City |
| Post, E.S.; Grambsch, A.; Weaver, C.; Morefield, P.; Huang, J.; Leung, L.-Y.; et al. 2012. [61] | Air quality, geographic factors | United States |
| Raffa, R.B.; Eltoukhy, N.S.; Raffa, K.F. 2012. [65] | Disease and vector borne disease | United States |
| Reid, C.E.; Mann, J.K.; Alfasso, R.; English, P.B.; King, G.C.; Balmes, J.R. 2012. [30] | Heat | California, Massachusetts, New Mexico, Oregon, Washington |
| Reid, C.E.; Brauer, M.; Johnston, F.H.; Jerrett, M.; Balmes, J.R.; Elliott, C.T. 2016. [11] | Drought and wildfire, geographic factors, age | Australia, Portugal, Brazil, Canada, India, Greece, Russia, California, North Carolina |
| Riley, K.; Wilhalme, H.; Delp, L.; Eisenman, D. 2018. [101] | Heat | California |
| Roelofs, C. 2018. [102] | Occupation | California, Idaho, Texas, Kansas, Virginia, the “south” |
| Romeo Upperman, C.; Parker, J.; Jiang, C.; He, X.; Murtugudde, R.; Sapkota, A. 2015. [31] | Heat | United States |
| Rosen, J. 2016. [9] | Air quality, disease and vector borne disease, age | Discussion. No location identified. |
| Sampson, N.R.; Gronlund, C.J.; Buxton, M.A.; Catalano, L.; White-Newsome, J.L.; Parker, E.A. 2013. [103] | Heat, SES | Arizona, Michigan, New York, Pennsylvania |
| Schmeltz, M.T.; Marcotullio, P.J. 2019. [24] | Heat, floods, wildfires, vector-borne disease | United States |
| Schwartz, J.D.; Lee, M.; Kinney, P.L.; Yang, S.; Mills, D.; Sarofim, M.C.; et al. 2015. [46] | Winter Temperature | United States |
| Sheffield, P.E.; Landrigan, P.J. 2011. [94] | Vector-borne diseases, chronic disease, extreme weather, heat, air quality, SES | Global |
| Sheridan, S.C.; Allen, M.J. 2018. [74] | Geographic factors | Global, primarily developed countries |
| Sheridan, S.C.; Dixon, P.G. 2017. [93] | Age | United States |
| Sheridan, S.C.; Kalkstein, A.J. 2010. [80] | Geographic factors | United States |
| Shi, L.; Kloog, I.; Zanobetti, A.; Liu, P.; Schwartz, J.D. 2015. [47] | Heat, cold | Northeastern United States |
| Shi, L.; Liu, P.; Wang, Y.; Zanobetti, A.; Kosheleva, A.; Koutrakis, P.; Schwartz, J. 2016. [25] | Heat, winter temperature | Southeastern United States |
| Steinweg, C.; Gutowski, W.J. 2015. [19] | Heat | Missouri |
| Stone, B.; Vargo, J.; Liu, P.; Habeeb, D.; DeLucia, A.; Russel, A. 2014. [82] | Heat | Pennsylvania, Georgia, Arizona |
| Sun, J.; Fu, J.S.; Huang, K.; Gao, Y. 2015. [55] | Air quality | United States |
| Tagaris, E.; Liao, K.-J.; DeLucia, A.J.; Deck, L.; Amar, P.; Russell, A.G. 2010. [12] | Air quality | United States |
| Voorhees, A.S.; Fann, N.; Fulcher, C.; Dolwick, P.; Hubbell, B.; Bierwagen, B.; Morefeild, P. 2011. [34] | Heat | United States |
| Wang, Y.; Shi, L.; Zanobetti, A.; Schwartz, J.D. 2016. [48] | Cold | United States |
| Weinberger, K.R.; Haykin, L.; Eliot, M.N.; Schwartz, J.D.; Gasparrini, A.; Wellenius, G.A. 2017. [45] | Winter temperature; geographic factors | California, Georgia, Illinois, Florida, Massachusetts, New York, Pennsylvania, Texas, Washington DC |
| Weinberger, K.R.; Kirwa, K.; Eliot, M.N.; Gold, J.; Suh, H.H.; Wellenius, G.A. 2018. [49] | Heat, cold | Rhode Island, Massachusetts |
| Wilhelmi, O.V.; Hayden, M.H. 2010. [81] | Geographic factors | United States |
| Wilson, A.; Reich, B.J.; Nolte, C.G.; Spero, T.L.; Hubbell, B.; Rappold, A.G. 2017. [32] | Heat | United States |
| Wu, C.Y.H.; Zaitchik, B.F.; Gohlke, J.M. 2018. [53] | Heat | United States |
| Wu, J.; Zhou, Y.; Gao, Y.; Fu, J.S.; Johnson, B.A.; Huang, C.; et al. 2014. [75] | Geographic factors | Eastern United States |
| Xiao, J.; Peng, J.; Zhang, Y.; Liu, T.; Rutherford, S.; Lin, H.; et al. 2015. [26] | Heat, geographic factors | Eastern United States |
| Yang, T.-C.; Jensen, L. 2016. [14] | Geographic factors | United States |
| Yang, J.; Hu, L.; Wang, C. 2019. [78] | Cold, heat | United States |
| Yang, J.; Zhang, Y.; Wang, K.; Doraiswamy, P.; Cho, S.H. 2019. [56] | Air quality | United States |
| Zanobetti, A.; O’Neill, M.S.; Gronlund, C.J.; Schwartz, J.D. 2012. [95] | Heat, age, chronic disease | United States |
| Zanobetti, A.; O’Neill, M.S.; Gronlund, C.J.; Schwartz, J.D. 2013. [35] | Heat, gender | United States |
| Zhang, Y.; Xiang, Q.; Yu, C.; Bao, J.; Ho, H.C.; Zhang, L. 2019. [41] | Heat, cold (temperature variability) | United States, China, England |
| Zhang, Y.; Smith, S.J.; Bowden, J.H.; Adelman, Z.; West, J.J. 2017. [59] | Air quality | United States |
| Zhao, L.; Oppenheimer, M.; Zhu, Q.; Baldwin, J.W.; Ebi, K.L.; Bou-Zeid, E.; et al. 2018. [83] | Geographic factors | United States |
References
- IPCC. Climate Change 2013: The Physical Science Basis. Contribution of Working Group I to the Fifth Assessment Report of the Intergovernmental Panel on Climate Change; Stocker, T.F., Qin, Q., Plattner, G.-K., Tignor, M., Allen, S.K., Boschung, J., Nauels, A., Xia, Y., Bex, V., Midgley, P.M., et al., Eds.; Cambridge University Press: Cambridge, UK; New York, NY, USA, 2013; ISBN 978-92-9169-138-8.
- U.N. Intergovernmental Panel on Climate Change Understanding Global Warming 1.5 C: Summary for Policy. Projected Climate Change, Potential Impacts and Associated Risks. Available online: https://www.ipcc.ch/sr15/chapter/spm/ (accessed on 27 June 2021).
- Bell, J.E.; Brown, C.L.; Conlon, K.; Herring, S.; Kunkel, K.E.; Lawrimore, J.; Luber, G.; Schreck, C.; Smith, A.; Uejio, C. Changes in extreme events and the potential impacts on human health. J. Air Waste Manag. Assoc. 2018, 68, 265–287. [Google Scholar] [CrossRef] [PubMed] [Green Version]
- Carnes, B.A.; Staats, D.; Willcox, B.J. Impact of Climate Change on Elder Health. J. Gerontol. Ser. A Boil. Sci. Med. Sci. 2013, 69, 1087–1091. [Google Scholar] [CrossRef] [PubMed] [Green Version]
- Jones, B.; O’Neill, B.C.; McDaniel, L.; McGinnis, S.; Mearns, L.O.; Tebaldi, C. Future population exposure to US heat extremes. Nat. Clim. Chang. 2015, 5, 652–655. [Google Scholar] [CrossRef]
- Petkova, E.P.; Gasparrini, A.; Kinney, P.L. Heat and Mortality in New York City Since the Beginning of the 20th Century. Epidemiology 2014, 25, 554–560. [Google Scholar] [CrossRef] [PubMed]
- Reidmiller, D.R.; Avery, C.W.; Easterling, D.R.; Kunkel, K.E.; Lewis, K.L.M.; Maycock, T.K.; Stewart, B.C. Impacts, Risks, and Adaptation in the United States: Fourth National Climate Assessment, Volume II; U.S. Global Change Research Program: Washington, DC, USA, 2018; p. 1515. [Google Scholar] [CrossRef]
- Hopp, S.; Dominici, F.; Bobb, J.F. Medical diagnoses of heat wave-related hospital admissions in older adults. Prev. Med. 2018, 110, 81–85. [Google Scholar] [CrossRef] [PubMed]
- Rosen, J. Climate, Environmental Health Vulnerability, and Physical Planning. J. Plan. Lit. 2015, 31, 3–22. [Google Scholar] [CrossRef]
- Dethloff, K.; Handorf, D.; Jaiser, R.; Rinke, A.; Klinghammer, P. Dynamical mechanisms of Arctic amplification. Ann. N. Y. Acad. Sci. 2018, 1436, 184–194. [Google Scholar] [CrossRef]
- Reid, C.; Brauer, M.; Johnston, F.H.; Jerrett, M.; Balmes, J.R.; Elliott, C.T. Critical Review of Health Impacts of Wildfire Smoke Exposure. Environ. Health Perspect. 2016, 124, 1334–1343. [Google Scholar] [CrossRef] [Green Version]
- Tagaris, E.; Liao, K.-J.; DeLucia, A.J.; Deck, L.; Amar, P.; Russell, A.G. Sensitivity of Air Pollution-Induced Premature Mortality to Precursor Emissions under the Influence of Climate Change. Int. J. Environ. Res. Public Health 2010, 7, 2222–2237. [Google Scholar] [CrossRef] [Green Version]
- Barrett, B.; Charles, J.W.; Temte, J.L. Climate change, human health, and epidemiological transition. Prev. Med. 2015, 70, 69–75. [Google Scholar] [CrossRef] [Green Version]
- Yang, T.-C.; Jensen, L. Climatic conditions and human mortality: Spatial and regional variation in the United States. Popul. Environ. 2016, 38, 261–285. [Google Scholar] [CrossRef] [PubMed]
- Celentano, D.; Szklo, M. Gordis Epidemiology, 6th ed.; Elsevier, Inc.: Philadelphia, PA, USA, 2019. [Google Scholar]
- Whittemore, R.; Knafl, K. The integrative review: Updated methodology. J. Adv. Nurs. 2005, 52, 546–553. [Google Scholar] [CrossRef]
- Petkova, E.P.; Bader, D.A.; Anderson, G.B.; Horton, R.M.; Knowlton, K.; Kinney, P.L. Heat-Related Mortality in a Warming Climate: Projections for 12 U.S. Cities. Int. J. Environ. Res. Public Health 2014, 11, 11371–11383. [Google Scholar] [CrossRef] [PubMed] [Green Version]
- Anderson, G.B.; Bell, M.L. Heat Waves in the United States: Mortality Risk during Heat Waves and Effect Modification by Heat Wave Characteristics in 43 U.S. Communities. Environ. Health Perspect. 2011, 119, 210–218. [Google Scholar] [CrossRef] [Green Version]
- Steinweg, C.; Gutowski, W.J. Projected Changes in Greater St. Louis Summer Heat Stress in NARCCAP Simulations. Weather Clim. Soc. 2015, 7, 159–168. [Google Scholar] [CrossRef] [Green Version]
- Hansel, N.N.; McCormack, M.C.; Kim, V. The Effects of Air Pollution and Temperature on COPD. COPD J. Chronic Obstr. Pulm. Dis. 2015, 13, 372–379. [Google Scholar] [CrossRef]
- Harduar Morano, L.; Watkins, S.; Kintziger, K. A Comprehensive Evaluation of the Burden of Heat-Related Illness and Death within the Florida Population. Int. J. Environ. Res. Public Health 2016, 13, 551. [Google Scholar] [CrossRef] [Green Version]
- Koman, P.D.; Romo, F.; Swinton, P.; Mentz, G.B.; De Majo, R.F.; Sampson, N.R.; Battaglia, M.J.; Hill-Knott, K.; Williams, G.O.; O’Neill, M.S.; et al. MI-Environment: Geospatial patterns and inequality of relative heat stress vulnerability in Michigan. Health Place 2019, 60, 102228. [Google Scholar] [CrossRef]
- Petkova, E.P.; Horton, R.M.; Bader, D.A.; Kinney, P.L. Projected Heat-Related Mortality in the U.S. Urban Northeast. Int. J. Environ. Res. Public Health 2013, 10, 6734–6747. [Google Scholar] [CrossRef]
- Schmeltz, M.T.; Marcotullio, P.J. Examination of Human Health Impacts Due to Adverse Climate Events Through the Use of Vulnerability Mapping: A Scoping Review. Int. J. Environ. Res. Public Health 2019, 16, 3091. [Google Scholar] [CrossRef] [Green Version]
- Shi, L.; Liu, P.; Wang, Y.; Zanobetti, A.; Kosheleva, A.; Koutrakis, P.; Schwartz, J. Chronic effects of temperature on mortality in the Southeastern USA using satellite-based exposure metrics. Sci. Rep. 2016, 6, 30161. [Google Scholar] [CrossRef]
- Xiao, J.; Peng, J.; Zhang, Y.; Liu, T.; Rutherford, S.; Lin, H.; Qian, Z.; Huang, C.; Luo, Y.; Zeng, W.; et al. How much does latitude modify temperature–mortality relationship in 13 eastern US cities? Int. J. Biometeorol. 2014, 59, 365–372. [Google Scholar] [CrossRef]
- Gronlund, C.J.; Zanobetti, A.; Schwartz, J.D.; Wellenius, G.; O’Neill, M.S. Heat, Heat Waves, and Hospital Admissions among the Elderly in the United States, 1992–2006. Environ. Health Perspect. 2014, 122, 1187–1192. [Google Scholar] [CrossRef] [PubMed] [Green Version]
- Harlan, S.L.; Chowell, G.; Yang, S.; Petitti, D.B.; Butler, E.J.M.; Ruddell, B.L.; Ruddell, D.M. Heat-Related Deaths in Hot Cities: Estimates of Human Tolerance to High Temperature Thresholds. Int. J. Environ. Res. Public Health 2014, 11, 3304–3326. [Google Scholar] [CrossRef] [Green Version]
- Ostro, B.; Rauch, S.; Green, S. Quantifying the health impacts of future changes in temperature in California. Environ. Res. 2011, 111, 1258–1264. [Google Scholar] [CrossRef] [PubMed]
- Reid, C.E.; Mann, J.K.; Alfasso, R.; English, P.B.; King, G.C.; Lincoln, R.A.; Margolis, H.G.; Rubado, D.J.; Sabato, J.E.; West, N.L.; et al. Evaluation of a Heat Vulnerability Index on Abnormally Hot Days: An Environmental Public Health Tracking Study. Environ. Health Perspect. 2012, 120, 715–720. [Google Scholar] [CrossRef]
- Romeo Upperman, C.; Parker, J.; Jiang, C.; He, X.; Murtugudde, R.; Sapkota, A. Frequency of Extreme Heat Event as a Surrogate Exposure Metric for Examining the Human Health Effects of Climate Change. PLoS ONE 2015, 10, e0144202. [Google Scholar] [CrossRef] [PubMed]
- Wilson, A.; Reich, B.; Nolte, C.; Spero, T.L.; Hubbell, B.; Rappold, A. Climate change impacts on projections of excess mortality at 2030 using spatially varying ozone–temperature risk surfaces. J. Expo. Sci. Environ. Epidemiol. 2016, 27, 118–124. [Google Scholar] [CrossRef] [Green Version]
- Guo, Y.; Gasparrini, A.; Li, S.; Sera, F.; Cabrera, A.M.V.; Coelho, M.; Saldiva, P.; Lavigne, E.; Tawatsupa, B.; Punnasiri, K.; et al. Quantifying excess deaths related to heatwaves under climate change scenarios: A multicountry time series modelling study. PLoS Med. 2018, 15, e1002629. [Google Scholar] [CrossRef] [PubMed]
- Voorhees, A.S.; Fann, N.; Fulcher, C.; Dolwick, P.; Hubbell, B.; Bierwagen, B.; Morefield, P. Climate Change-Related Temperature Impacts on Warm Season Heat Mortality: A Proof-of-Concept Methodology Using BenMAP. Environ. Sci. Technol. 2011, 45, 1450–1457. [Google Scholar] [CrossRef]
- Zanobetti, A.; O’Neill, M.S.; Gronlund, C.J.; Schwartz, J.D. Susceptibility to Mortality in Weather Extremes. Epidemiology 2013, 24, 809–819. [Google Scholar] [CrossRef] [PubMed] [Green Version]
- Kingsley, S.L.; Eliot, M.N.; Gold, J.; Vanderslice, R.R.; Wellenius, G.A. Current and Projected Heat-Related Morbidity and Mortality in Rhode Island. Environ. Health Perspect. 2016, 124, 460–467. [Google Scholar] [CrossRef] [PubMed] [Green Version]
- Matte, T.D.; Lane, K.; Ito, K. Excess Mortality Attributable to Extreme Heat in New York City, 1997-2013. Health Secur. 2016, 14, 64–70. [Google Scholar] [CrossRef]
- Petkova, E.P.; Vink, J.K.; Horton, R.; Gasparrini, A.; Bader, D.A.; Francis, J.D.; Kinney, P.L. Towards More Comprehensive Projections of Urban Heat-Related Mortality: Estimates for New York City under Multiple Population, Adaptation, and Climate Scenarios. Environ. Health Perspect. 2017, 125, 47–55. [Google Scholar] [CrossRef] [PubMed] [Green Version]
- Parks, R.M.; Bennett, J.E.; Tamura-Wicks, H.; Kontis, V.; Toumi, R.; Danaei, G.; Ezzati, M. Anomalously warm temperatures are associated with increased injury deaths. Nat. Med. 2020, 26, 65–70. [Google Scholar] [CrossRef] [PubMed] [Green Version]
- Kalkstein, L.S.; Greene, S.; Mills, D.M.; Samenow, J. An evaluation of the progress in reducing heat-related human mortality in major U.S. cities. Nat. Hazards 2011, 56, 113–129. [Google Scholar] [CrossRef]
- Zhang, Y.; Xiang, Q.; Yu, C.; Bao, J.; Ho, H.C.; Sun, S.; Ding, Z.; Hu, K.; Zhang, L. Mortality risk and burden associated with temperature variability in China, United Kingdom and United States: Comparative analysis of daily and hourly exposure metrics. Environ. Res. 2019, 179, 108771. [Google Scholar] [CrossRef]
- Barnett, A.; Hajat, S.; Gasparrini, A.; Rocklöv, J. Cold and heat waves in the United States. Environ. Res. 2012, 112, 218–224. [Google Scholar] [CrossRef] [Green Version]
- Conlon, K.C.; Rajkovich, N.; White-Newsome, J.L.; Larsen, L.; O’Neill, M.S. Preventing cold-related morbidity and mortality in a changing climate. Maturitas 2011, 69, 197–202. [Google Scholar] [CrossRef] [Green Version]
- Dominianni, C.; Lane, K.; Johnson, S.; Ito, K.; Matte, T. Health Impacts of Citywide and Localized Power Outages in New York City. Environ. Health Perspect. 2018, 126, 067003. [Google Scholar] [CrossRef]
- Weinberger, K.R.; Haykin, L.; Eliot, M.N.; Schwartz, J.D.; Gasparrini, A.; Wellenius, G. Projected temperature-related deaths in ten large U.S. metropolitan areas under different climate change scenarios. Environ. Int. 2017, 107, 196–204. [Google Scholar] [CrossRef]
- Schwartz, J.D.; Lee, M.; Kinney, P.L.; Yang, S.; Mills, D.; Sarofim, M.C.; Jones, R.; Streeter, R.; Juliana, A.S.; Peers, J.; et al. Projections of temperature-attributable premature deaths in 209 U.S. cities using a cluster-based Poisson approach. Environ. Health 2015, 14, 85. [Google Scholar] [CrossRef] [PubMed] [Green Version]
- Shi, L.; Kloog, I.; Zanobetti, A.; Liu, P.; Schwartz, J.D. Impacts of temperature and its variability on mortality in New England. Nat. Clim. Chang. 2015, 5, 988–991. [Google Scholar] [CrossRef] [Green Version]
- Wang, Y.; Shi, L.; Zanobetti, A.; Schwartz, J.D. Estimating and projecting the effect of cold waves on mortality in 209 US cities. Environ. Int. 2016, 94, 141–149. [Google Scholar] [CrossRef] [Green Version]
- Weinberger, K.R.; Kirwa, K.; Eliot, M.N.; Gold, J.; Suh, H.H.; Wellenius, G.A. Projected Changes in Temperature-related Morbidity and Mortality in Southern New England. Epidemiology 2018, 29, 473–481. [Google Scholar] [CrossRef]
- Madrigano, J.; Mittleman, M.A.; Baccarelli, A.; Goldberg, R.; Melly, S.; von Klot, S.; Schwartz, J. Temperature, Myocardial Infarction, and Mortality: Effect Modification by Individual and Area-Level Characteristics. Epidemiology 2013, 24, 439–446. [Google Scholar] [CrossRef] [PubMed]
- Fleischer, N.L.; Melstrom, P.; Yard, E.; Brubaker, M.; Thomas, T. The epidemiology of falling-through-the-ice in Alaska, 1990–2010. J. Public Health 2013, 36, 235–242. [Google Scholar] [CrossRef] [Green Version]
- Anderson, G.B.; Bell, M. Lights Out: Impact of the August 2003 Power Outage on Mortality in New York, NY. Epidemiology 2012, 23, 189–193. [Google Scholar] [CrossRef] [PubMed] [Green Version]
- Wu, C.Y.; Zaitchik, B.; Gohlke, J. Heat waves and fatal traffic crashes in the continental United States. Accid. Anal. Prev. 2018, 119, 195–201. [Google Scholar] [CrossRef] [PubMed]
- Kavouras, I.G.; Chalbot, M.-C.G. Influence of ambient temperature on the heterogeneity of ambient fine particle chemical composition and disease prevalence. Int. J. Environ. Health Res. 2016, 27, 27–39. [Google Scholar] [CrossRef] [PubMed]
- Sun, J.; Fu, J.S.; Huang, K.; Gao, Y. Estimation of future PM2.5-and ozone-related mortality over the continental United States in a changing climate: An application of high-resolution dynamical downscaling technique. J. Air Waste Manag. Assoc. 2015, 65, 611–623. [Google Scholar] [CrossRef] [PubMed] [Green Version]
- Yang, P.; Zhang, Y.; Wang, K.; Doraiswamy, P.; Cho, S.-H. Health impacts and cost-benefit analyses of surface O3 and PM2.5 over the U.S. under future climate and emission scenarios. Environ. Res. 2019, 178, 108687. [Google Scholar] [CrossRef]
- Clearfield, M.; Pearce, M.; Nibbe, Y.; Crotty, D.; Wagner, A. The “New Deadly Quartet” for Cardiovascular Disease in the 21st Century: Obesity, Metabolic Syndrome, Inflammation and Climate Change: How Does Statin Therapy Fit into this Equation? Curr. Atheroscler. Rep. 2013, 16, 380. [Google Scholar] [CrossRef]
- Achakulwisut, P.; Anenberg, S.C.; Neumann, J.E.; Penn, S.L.; Weiss, N.; Crimmins, A.; Fann, N.; Martinich, J.; Roman, H.; Mickley, L.J. Effects of Increasing Aridity on Ambient Dust and Public Health in the U.S. Southwest Under Climate Change. GeoHealth 2019, 3, 127–144. [Google Scholar] [CrossRef]
- Zhang, Y.; Smith, S.; Bowden, J.; Adelman, Z.; West, J.J. Co-benefits of global, domestic, and sectoral greenhouse gas mitigation for US air quality and human health in 2050. Environ. Res. Lett. 2017, 12, 114033. [Google Scholar] [CrossRef] [PubMed]
- Alexeeff, S.E.; Pfister, G.G.; Nychka, D. A Bayesian model for quantifying the change in mortality associated with future ozone exposures under climate change. Biometrics 2015, 72, 281–288. [Google Scholar] [CrossRef] [Green Version]
- Post, E.S.; Grambsch, A.; Weaver, C.; Morefield, P.; Huang, J.; Leung, L.-Y.; Nolte, C.G.; Adams, P.; Liang, X.-Z.; Zhu, J.-H.; et al. Variation in Estimated Ozone-Related Health Impacts of Climate Change due to Modeling Choices and Assumptions. Environ. Health Perspect. 2012, 120, 1559–1564. [Google Scholar] [CrossRef]
- Chang, H.H.; Zhou, J.; Fuentes, M. Impact of Climate Change on Ambient Ozone Level and Mortality in Southeastern United States. Int. J. Environ. Res. Public Health 2010, 7, 2866–2880. [Google Scholar] [CrossRef]
- Berman, J.D.; Ebisu, K.; Peng, R.D.; Dominici, F.; Bell, M.L. Drought and the risk of hospital admissions and mortality in older adults in western USA from 2000 to 2013: A retrospective study. Lancet Planet. Health 2017, 1, e17–e25. [Google Scholar] [CrossRef]
- Gronlund, C.J.; Cameron, L.; Shea, C.; O’Neill, M.S. Assessing the magnitude and uncertainties of the burden of selected diseases attributable to extreme heat and extreme precipitation under a climate change scenario in Michigan for the period 2041–2070. Environ. Health 2019, 18, 40. [Google Scholar] [CrossRef] [PubMed] [Green Version]
- Raffa, R.B.; Eltoukhy, N.S.; Raffa, K.F. Implications of climate change (global warming) for the healthcare system. J. Clin. Pharm. Ther. 2012, 37, 502–504. [Google Scholar] [CrossRef]
- Kemble, S.K.; Lynfield, R.; DeVries, A.; Drehner, D.M.; Pomputius, W.F.; Beach, M.J.; Visvesvara, G.S.; Da Silva, A.J.; Hill, V.; Yoder, J.S.; et al. Fatal Naegleria fowleri Infection Acquired in Minnesota: Possible Expanded Range of a Deadly Thermophilic Organism. Clin. Infect. Dis. 2012, 54, 805–809. [Google Scholar] [CrossRef] [PubMed] [Green Version]
- Kim, B.S.; Gavin, H.E.; Satchell, K.J.F. Variable Virulence of Biotype 3 Vibrio vulnificus due to MARTX Toxin Effector Domain Composition. mSphere 2017, 2, e00272-17. [Google Scholar] [CrossRef] [Green Version]
- MacFadden, D.R.; McGough, S.F.; Fisman, D.; Santillana, M.; Brownstein, J.S. Antibiotic resistance increases with local temperature. Nat. Clim. Chang. 2018, 8, 510–514. [Google Scholar] [CrossRef]
- Knapp, P.A.; Maxwell, J.T.; Ortegren, J.T.; Soulé, P.T. Spatiotemporal Changes in Comfortable Weather Duration in the Continental United States and Implications for Human Wellness. Ann. Am. Assoc. Geogr. 2015, 106, 1–18. [Google Scholar] [CrossRef]
- Lee, M.; Nordio, F.; Zanobetti, A.; Kinney, P.; Vautard, R.; Schwartz, J. Acclimatization across space and time in the effects of temperature on mortality: A time-series analysis. Environ. Health 2014, 13, 89. [Google Scholar] [CrossRef] [PubMed] [Green Version]
- Nordio, F.; Zanobetti, A.; Colicino, E.; Kloog, I.; Schwartz, J. Changing patterns of the temperature–mortality association by time and location in the US, and implications for climate change. Environ. Int. 2015, 81, 80–86. [Google Scholar] [CrossRef] [PubMed] [Green Version]
- Bobb, J.F.; Dominici, F.; Peng, R.D. A Bayesian Model Averaging Approach for Estimating the Relative Risk of Mortality Associated with Heat Waves in 105 U.S. Cities. Biometrics 2011, 67, 1605–1616. [Google Scholar] [CrossRef]
- Limaye, V.S.; Vargo, J.; Harkey, M.; Holloway, T.; Patz, J.A. Climate Change and Heat-Related Excess Mortality in the Eastern USA. EcoHealth 2018, 15, 485–496. [Google Scholar] [CrossRef] [PubMed]
- Sheridan, S.C.; Allen, M.J. Temporal trends in human vulnerability to excessive heat. Environ. Res. Lett. 2018, 13, 043001. [Google Scholar] [CrossRef]
- Wu, J.; Zhou, Y.; Gao, Y.; Fu, J.; Johnson, B.A.; Huang, C.; Kim, Y.-M.; Liu, Y. Estimation and Uncertainty Analysis of Impacts of Future Heat Waves on Mortality in the Eastern United States. Environ. Health Perspect. 2014, 122, 10–16. [Google Scholar] [CrossRef] [Green Version]
- Gutierrez, K.S.; LePrevost, C.E. Climate Justice in Rural Southeastern United States: A Review of Climate Change Impacts and Effects on Human Health. Int. J. Environ. Res. Public Health 2016, 13, 189. [Google Scholar] [CrossRef] [Green Version]
- Oleson, K.W.; Monaghan, A.; Wilhelmi, O.; Barlage, M.; Brunsell, N.; Feddema, J.; Hu, L.; Steinhoff, D. Interactions between urbanization, heat stress, and climate change. Clim. Chang. 2013, 129, 525–541. [Google Scholar] [CrossRef]
- Yang, J.; Hu, L.; Wang, C. Population dynamics modify urban residents’ exposure to extreme temperatures across the United States. Sci. Adv. 2019, 5, eaay3452. [Google Scholar] [CrossRef] [Green Version]
- Jagai, J.S.; Grossman, E.; Navon, L.; Sambanis, A.; Dorevitch, S. Hospitalizations for heat-stress illness varies between rural and urban areas: An analysis of Illinois data, 1987–2014. Environ. Health 2017, 16, 38. [Google Scholar] [CrossRef] [Green Version]
- Sheridan, S.C.; Kalkstein, A.J. Seasonal variability in heat-related mortality across the United States. Nat. Hazards 2010, 55, 291–305. [Google Scholar] [CrossRef]
- Wilhelmi, O.V.; Hayden, M.H. Connecting people and place: A new framework for reducing urban vulnerability to extreme heat. Environ. Res. Lett. 2010, 5, 014021. [Google Scholar] [CrossRef]
- Stone, B.; Vargo, J.; Liu, P.; Habeeb, D.; DeLucia, A.; Trail, M.; Hu, Y.; Russell, A. Avoided Heat-Related Mortality through Climate Adaptation Strategies in Three US Cities. PLoS ONE 2014, 9, e100852. [Google Scholar] [CrossRef] [PubMed] [Green Version]
- Zhao, L.; Oppenheimer, M.; Zhu, Q.; Baldwin, J.; Ebi, K.L.; Bou-Zeid, E.; Guan, K.; Liu, X. Interactions between urban heat islands and heat waves. Environ. Res. Lett. 2018, 13, 034003. [Google Scholar] [CrossRef]
- Lin, S.; Hsu, W.-H.; Van Zutphen, A.R.; Saha, S.; Luber, G.; Hwang, S.-A. Excessive Heat and Respiratory Hospitalizations in New York State: Estimating Current and Future Public Health Burden Related to Climate Change. Environ. Health Perspect. 2012, 120, 1571–1577. [Google Scholar] [CrossRef]
- Madrigano, J.; Jack, D.; Anderson, G.B.; Bell, M.L.; Kinney, P.L. Temperature, ozone, and mortality in urban and non-urban counties in the northeastern United States. Environ. Health 2015, 14, 3. [Google Scholar] [CrossRef] [Green Version]
- Hoehne, C.G.; Hondula, D.M.; Chester, M.V.; Eisenman, D.P.; Middel, A.; Fraser, A.M.; Watkins, L.; Gerster, K. Heat exposure during outdoor activities in the US varies significantly by city, demography, and activity. Health Place 2018, 54, 1–10. [Google Scholar] [CrossRef]
- Johnson, M.G.; Brown, S.; Archer, P.; Wendelboe, A.; Magzamen, S.; Bradley, K.K. Identifying heat-related deaths by using medical examiner and vital statistics data: Surveillance analysis and descriptive epidemiology—Oklahoma, 1990–2011. Environ. Res. 2016, 150, 30–37. [Google Scholar] [CrossRef]
- Gubernot, D.M.; Anderson, G.B.; Hunting, K.L. Characterizing occupational heat-related mortality in the United States, 2000-2010: An analysis using the census of fatal occupational injuries database. Am. J. Ind. Med. 2015, 58, 203–211. [Google Scholar] [CrossRef] [Green Version]
- Guo, Y.; Barnett, A.; Tong, S. High temperatures-related elderly mortality varied greatly from year to year: Important information for heat-warning systems. Sci. Rep. 2012, 2, 830. [Google Scholar] [CrossRef] [Green Version]
- Isaksen, T.B.; Yost, M.; Hom, E.; Fenske, R. Projected health impacts of heat events in Washington State associated with climate change. Rev. Environ. Health 2014, 29, 119–123. [Google Scholar] [CrossRef]
- Kalkstein, A.J.; Kalkstein, L.S.; Vanos, J.K.; Eisenman, D.P.; Dixon, P.G. Heat/mortality sensitivities in Los Angeles during winter: A unique phenomenon in the United States. Environ. Health 2018, 17, 45. [Google Scholar] [CrossRef] [Green Version]
- Li, B.; Sain, S.; Mearns, L.O.; Anderson, H.A.; Kovats, S.; Ebi, K.L.; Bekkedal, M.Y.V.; Kanarek, M.S.; Patz, J.A. The impact of extreme heat on morbidity in Milwaukee, Wisconsin. Clim. Chang. 2011, 110, 959–976. [Google Scholar] [CrossRef]
- Sheridan, S.C.; Dixon, P.G. Spatiotemporal trends in human vulnerability and adaptation to heat across the United States. Anthropocene 2017, 20, 61–73. [Google Scholar] [CrossRef]
- Sheffield, P.E.; Landrigan, P.J. Global Climate Change and Children’s Health: Threats and Strategies for Prevention. Environ. Health Perspect. 2011, 119, 291–298. [Google Scholar] [CrossRef]
- Zanobetti, A.; O’Neill, M.S.; Gronlund, C.J.; Schwartz, J.D. Summer temperature variability and long-term survival among elderly people with chronic disease. Proc. Natl. Acad. Sci. USA 2012, 109, 6608–6613. [Google Scholar] [CrossRef] [Green Version]
- Schmeltz, M.T.; Sembajwe, G.; Marcotullio, P.; Grassman, J.A.; Himmelstein, D.U.; Woolhandler, S. Identifying Individual Risk Factors and Documenting the Pattern of Heat-Related Illness through Analyses of Hospitalization and Patterns of Household Cooling. PLoS ONE 2015, 10, e0118958. [Google Scholar] [CrossRef]
- Isaksen, T.B.; Fenske, R.A.; Hom, E.K.; Ren, Y.; Lyons, H.; Yost, M.G. Increased mortality associated with extreme-heat exposure in King County, Washington, 1980–2010. Int. J. Biometeorol. 2015, 60, 85–98. [Google Scholar] [CrossRef] [Green Version]
- Acharya, P.; Boggess, B.; Zhang, K. Assessing Heat Stress and Health among Construction Workers in a Changing Climate: A Review. Int. J. Environ. Res. Public Health 2018, 15, 247. [Google Scholar] [CrossRef] [Green Version]
- Madrigano, J.; Ito, K.; Johnson, S.; Kinney, P.L.; Matte, T. A Case-Only Study of Vulnerability to Heat Wave–RelatedMortality in New York City (2000–2011). Environ. Health Perspect. 2015, 123, 672–678. [Google Scholar] [CrossRef]
- Harlan, S.L.; Declet-Barreto, J.; Stefanov, W.L.; Petitti, D.B. Neighborhood Effects on Heat Deaths: Social and Environmental Predictors of Vulnerability in Maricopa County, Arizona. Environ. Health Perspect. 2013, 121, 197–204. [Google Scholar] [CrossRef] [Green Version]
- Riley, K.; Wilhalme, H.; Delp, L.; Eisenman, D.P. Mortality and Morbidity during Extreme Heat Events and Prevalence of Outdoor Work: An Analysis of Community-Level Data from Los Angeles County, California. Int. J. Environ. Res. Public Health 2018, 15, 580. [Google Scholar] [CrossRef] [Green Version]
- Roelofs, C. Without Warning: Worker Deaths from Heat 2014–201. New Solut. A J. Environ. Occup. Health Policy 2018, 28, 344–357. [Google Scholar] [CrossRef]
- Sampson, N.R.; Gronlund, C.J.; Buxton, M.A.; Catalano, L.; White-Newsome, J.L.; Conlon, K.C.; O’Neill, M.S.; McCormick, S.; Parker, E.A. Staying cool in a changing climate: Reaching vulnerable populations during heat events. Glob. Environ. Chang. 2013, 23, 475–484. [Google Scholar] [CrossRef] [Green Version]
- Fang, Y.; Mauzerall, D.L.; Liu, J.; Fiore, A.; Horowitz, L.W. Impacts of 21st century climate change on global air pollution-related premature mortality. Clim. Chang. 2013, 121, 239–253. [Google Scholar] [CrossRef] [Green Version]
- Klein Rosenthal, J.; Kinney, P.L.; Metzger, K.B. Intra-urban vulnerability to heat-related mortality in New York City, 1997–2006. Health Place 2014, 30, 45–60. [Google Scholar] [CrossRef] [Green Version]
- Peng, R.D.; Bobb, J.F.; Tebaldi, C.; McDaniel, L.; Bell, M.; Dominici, F. Toward a Quantitative Estimate of Future Heat Wave Mortality under Global Climate Change. Environ. Health Perspect. 2011, 119, 701–706. [Google Scholar] [CrossRef] [Green Version]
- Costello, A.; Abbas, M.; Allen, A.; Bell, S.; Bellamy, R.; Friel, S.; Groce, N.; Johnson, A.; Kett, M.; Lee, M.; et al. Managing the health effects of climate change. Lancet 2009, 373, 1693–1733. [Google Scholar] [CrossRef]
- Watts, N.; Amann, M.; Arnell, N.; Ayeb-Karlsson, S.; Beagley, J.; Belesova, K.; Boykoff, M.; Byass, P.; Cai, W.; Campbell-Lendrum, D.; et al. The 2020 report of The Lancet Countdown on health and climate change: Responding to converging crises. Lancet 2021, 397, 129–170. [Google Scholar] [CrossRef]

Publisher’s Note: MDPI stays neutral with regard to jurisdictional claims in published maps and institutional affiliations. |
© 2021 by the authors. Licensee MDPI, Basel, Switzerland. This article is an open access article distributed under the terms and conditions of the Creative Commons Attribution (CC BY) license (https://creativecommons.org/licenses/by/4.0/).
Share and Cite
McDermott-Levy, R.; Scolio, M.; Shakya, K.M.; Moore, C.H. Factors That Influence Climate Change-Related Mortality in the United States: An Integrative Review. Int. J. Environ. Res. Public Health 2021, 18, 8220. https://doi.org/10.3390/ijerph18158220
McDermott-Levy R, Scolio M, Shakya KM, Moore CH. Factors That Influence Climate Change-Related Mortality in the United States: An Integrative Review. International Journal of Environmental Research and Public Health. 2021; 18(15):8220. https://doi.org/10.3390/ijerph18158220
Chicago/Turabian StyleMcDermott-Levy, Ruth, Madeline Scolio, Kabindra M. Shakya, and Caroline H. Moore. 2021. "Factors That Influence Climate Change-Related Mortality in the United States: An Integrative Review" International Journal of Environmental Research and Public Health 18, no. 15: 8220. https://doi.org/10.3390/ijerph18158220
APA StyleMcDermott-Levy, R., Scolio, M., Shakya, K. M., & Moore, C. H. (2021). Factors That Influence Climate Change-Related Mortality in the United States: An Integrative Review. International Journal of Environmental Research and Public Health, 18(15), 8220. https://doi.org/10.3390/ijerph18158220