
Analysis of Anthropometric and Body Composition Profile in Male and Female Traditional Rowers


Abstract
1. Introduction
2. Materials and Methods
2.1. Participants
2.2. Procedure
2.3. Statistical Analysis
3. Results
4. Discussion
5. Conclusions
Author Contributions
Funding
Institutional Review Board Statement
Informed Consent Statement
Data Availability Statement
Conflicts of Interest
References
- Lorenzo Buceta, H.; Pérez Treus, S.; García Soidán, J.L.; Arufe Giraldez, V.; Cornes, X.A.; Cornes, A.A. Dynamic analysis on the fixed seat rowing: Trainera. Retos 2014, 2041, 120–123. [Google Scholar]
- Baudouin, A.; Hawkins, D. A biomechanical review of factors affecting rowing performance. Br. J. Sports Med. 2002, 36, 396–402. [Google Scholar] [CrossRef]
- Lorenzo-Buceta, H.; García-Soidán, J.L. Dynamic response analysis of a rowing fixed boat bank (trainerilla) by the application of accelerometry. J. Sport Health Res. 2015, 7, 55–64. [Google Scholar]
- Kleshnev, V. Biomechanics of Rowing; The Crowood Press: Ramsbury, UK, 2016. [Google Scholar]
- Cerasola, D.; Bellafiore, M.; Cataldo, A.; Zangla, D.; Bianco, A.; Proia, P.; Traina, M.; Palma, A.; Capranica, L. Predicting the 2000-m rowing ergometer performance from anthropometric, maximal oxygen uptake and 60-s mean power variables in national level young rowers. J. Hum. Kinet. 2020, 75, 77–83. [Google Scholar] [CrossRef]
- Penichet-tomas, A.; Pueo, B.; Abad-lopez, M.; Jimenez-olmedo, J.M. Acute comparative effect of foam rolling and static stretching on range of motion in rowers. Sustainability 2021, 13, 3631. [Google Scholar] [CrossRef]
- Penichet-Tomás, A.; Pueo, B.; Jiménez-Olmedo, J. Physical performance indicators in traditional rowing championships. J. Sports Med. Phys. Fit. 2019, 59, 767–773. [Google Scholar] [CrossRef]
- León-Guereño, P.; Urdampilleta, A.; Zourdos, M.C.; Mielgo-Ayuso, J. Anthropometric profile, body composition and somatotype in elite traditional rowers: A cross-sectional study. Rev. Española Nutr. Diet. 2018, 2, 279–286. [Google Scholar] [CrossRef]
- González, J.M. Olympic rowing and traditional rowing: Biomechanical, physiological and nutritional aspects. Arch. Med. Deporte 2014, 31, 51–59. [Google Scholar]
- De Larochelambert, Q.; Del Vecchio, S.; Leroy, A.; Duncombe, S.; Toussaint, J.-F.; Sedeaud, A. Body and Boat: Significance of Morphology on Elite Rowing Performance. Front. Sports Act. Living 2020, 2. [Google Scholar] [CrossRef] [PubMed]
- Akça, F. Prediction of rowing ergometer performance from functional anaerobic power, strength and anthropometric components. J. Hum. Kinet. 2014, 41, 133–142. [Google Scholar] [CrossRef]
- Izquierdo-Gabarren, M.; González, R.; Sáez, E.; Izquierdo, M. Physiological factors to predict on traditional rowing performance. Eur. J. Appl. Physiol. 2010, 108, 83–92. [Google Scholar] [CrossRef]
- Kaloupsis, S.; Bogdanis, G.C.; Dimakopoulou, E.; Maridaki, M. Anthropometric characteristics and somatotype of young Greek rowers. Biol. Sport 2008, 25, 57–69. [Google Scholar]
- Mikulić, P. Anthropometric and physiological profiles of rowers of varying ages and ranks. Kinesiology 2008, 40, 80–88. [Google Scholar]
- Gutiérrez-Leyton, L.; Zavala-Crichton, J.; Fuentes-Toledo, C.; Yáñez-Sepúlveda, R. Anthropometric characteristics and somatotype in elite Chilean rowers. Int. J. Morphol. 2020, 38, 114–119. [Google Scholar] [CrossRef]
- Arslanoğlu, E.; Acar, K.; Mor, A.; Baynaz, K.; İpekoğlu, G.; Arslanoglu, C. Body composition and somatotype profiles of rowers. Turk. J. Sport Exerc. 2020, 22, 431–437. [Google Scholar] [CrossRef]
- Adhikari, A.; McNeely, E. Anthropometric characteristic, somatotype and body composition of Canadian female rowers. Am. J. Sports Sci. 2015, 3, 61–66. [Google Scholar] [CrossRef][Green Version]
- Kerr, D.A.; Ross, W.D.; Norton, K.; Hume, P.; Kagawa, M.; Ackland, T.R. Olympic lightweight and open-class rowers possess distinctive physical and proportionality characteristics. J. Sports Sci. 2007, 25, 43–53. [Google Scholar] [CrossRef] [PubMed]
- Winkert, K.; Steinacker, J.M.; Machus, K.; Dreyhaupt, J.; Treff, G. Anthropometric profiles are associated with long-term career attainment in elite junior rowers: A retrospective analysis covering 23 years. Eur. J. Sport Sci. 2019, 19, 208–216. [Google Scholar] [CrossRef] [PubMed]
- Schranz, N.; Tomkinson, G.; Olds, T.; Daniell, N. Three-dimensional anthropometric analysis: Differences between elite Australian rowers and the general population. J. Sports Sci. 2010, 28, 459–469. [Google Scholar] [CrossRef] [PubMed]
- Yoshiga, C.C.; Higuchi, M. Rowing performance of female and male rowers. Scand. J. Med. Sci. Sports 2003, 13, 317–321. [Google Scholar] [CrossRef]
- Ingham, S.; Whyte, G.; Jones, K.; Nevill, A. Determinants of 2,000 m rowing ergometer performance in elite rowers. Eur. J. Appl. Physiol. 2002, 88, 243–246. [Google Scholar] [CrossRef]
- Mikulic, P. Anthropometric and metabolic determinants of 6000-m rowing ergometer performance in internationally competitive rowers. J. Strength Cond. Res. 2009, 23, 1851–1857. [Google Scholar] [CrossRef]
- Campa, F.; Toselli, S.; Mazzilli, M.; Gobbo, L.A.; Coratella, G. Assessment of body composition in athletes: A narrative review of available methods with special reference to quantitative and qualitative bioimpedance analysis. Nutrients 2021, 13, 1620. [Google Scholar] [CrossRef] [PubMed]
- Mejuto, G.; Arratibel, I.; Cámara, J.; Puente, A.; Iturriaga, G.; Calleja-González, J. The effect of a 6-week individual anaerobic threshold based programme in a traditional rowing crew. Biol. Sport 2012, 29, 297–301. [Google Scholar] [CrossRef]
- Sebastia-Amat, S.; Penichet-Tomas, A.; Jimenez-Olmedo, J.M.; Pueo, B. Contributions of anthropometric and strength determinants to estimate 2000 m ergometer performance in traditional rowing. Appl. Sci. 2020, 10, 6562. [Google Scholar] [CrossRef]
- Ross, W.D.; Marfell-Jones, M.J. Kinanthropometry. In Physiological Testing of Elite Athlete; Human Kinetics Publishers Inc.: London, UK, 1991; pp. 223–308. [Google Scholar]
- Pueo, B.; Espina-Agullo, J.J.; Selles-Perez, S.; Penichet-Tomas, A. Optimal body composition and anthropometric profile of world-class beach handball players by playing positions. Sustainability 2020, 12, 6789. [Google Scholar] [CrossRef]
- Sellés-Pérez, S.; García-Jaén, M.; Cortell-Tormo, J.M.; Cejuela, R. A short-term body jump® training program improves physical fitness and body composition in young active women. Appl. Sci. 2021, 11, 3234. [Google Scholar] [CrossRef]
- Withers, R.T.; Craig, N.P.; Bourdon, P.C.; Norton, K.I. Relative body fat and anthropometric prediction of body density of male athletes. Eur. J. Appl. Physiol. Occup. Physiol. 1987, 56, 191–200. [Google Scholar] [CrossRef] [PubMed]
- Lee, R.C.; Wang, Z.; Heo, M.; Ross, R.; Janssen, I.; Heymsfield, S.B. Total-body skeletal muscle mass: Development and cross-validation of anthropometric prediction models. Am. J. Clin. Nutr. 2000, 72, 796–803. [Google Scholar] [CrossRef]
- Rocha, M. Peso ósseo do brasileiro de ambos os sexos de 17 a 25 anhos. Arq. Anatomía Antropol. 1975, 1, 445–451. [Google Scholar]
- Carter, J.E.; Heath, B.H. Somatotyping—Development and Applications; Cambridge University Press: New York, NY, USA, 1990. [Google Scholar]
- Penichet-Tomas, A.; Jimenez-Olmedo, J.M.; Serra Torregrosa, L.; Pueo, B. Acute effects of different postactivation potentiation protocols on traditional rowing performance. Int. J. Environ. Res. Public Health 2021, 18, 80. [Google Scholar] [CrossRef] [PubMed]
- Cohen, J. Statistical Power Analysis for the Behavioral Sciences; Lawrence E.: Mahwah, NJ, USA, 1988; ISBN 0805802835. [Google Scholar]
- Hopkins, W.G. A Scale of Magnitudes for the Effect Statistics. A New View of Statistics. Available online: http://www.sportsci.org/resource/stats/ (accessed on 13 February 2021).
- Mielgo-Ayuso, J.; Calleja-González, J.; Urdampilleta, A.; León-Guereño, P.; Córdova, A.; Caballero-García, A.; Fernandez-Lázaro, D. Effects of vitamin D supplementation on haematological values and muscle recovery in elite male traditional rowers. Nutrients 2018, 10, 1968. [Google Scholar] [CrossRef] [PubMed]
- González, J.M. Remo olímpico y remo tradicional: Aspectos biomecánicos, fisiológicos y nutricionales. Arch. Med. Deporte 2014, 159, 51–59. [Google Scholar]
- Mujika, I.; González, R.; Maldonado-Martín, S.; Pyne, D.B. Warm-up intensity and duration’s effect on traditional rowing time-trial performance. Int. J. Sports Physiol. Perform. 2012, 7, 186–188. [Google Scholar] [CrossRef]
- Rakovac, M.; Smoljanovic, T.; Bojanic, I.; Hannafin, J.A.; Hren, D.; Thomas, P. Body size changes in elite junior rowers: 1997 to 2007. Coll. Antropol. 2011, 35, 127–131. [Google Scholar]
- O’Sullivan, A.J. Does oestrogen allow women to store fat more efficiently? A biological advantage for fertility and gestation. Obes. Rev. 2009, 10, 168–177. [Google Scholar] [CrossRef]
- Cejuela, R.; Pérez-Turpin, J.A.; Cortell, J.M.; Llopis, J.; Chinchilla, J.J. An analysis of performance in long-distance rowing by means of global positioning system technology. Int. J. Comput. Sci. Sport 2008, 7, 59–65. [Google Scholar]
- Wood, R.I.; Stanton, S.J. Testosterone and sport: Current perspectives. Horm. Behav. 2012, 61, 147–155. [Google Scholar] [CrossRef]
- Arazi, H.; Faraji, H.; Mohammadi, S.M. Anthropometric and physiological profiles of elite Iranian junior rowers. Middle-East J. Sci. Res. 2011, 9, 162–166. [Google Scholar]


| Male (n = 13) | Female (n = 11) | t-Test | Cohen’s d | |||||
|---|---|---|---|---|---|---|---|---|
| Mean ± SD | Min–Max | Mean ± SD | Min–Max | p | 95% CI | d | Effect Size | |
| Basic measurements | ||||||||
| Age (years) | 27.3 ± 5.1 | 20.0–37.0 | 27.7 ± 4.3 | 21.0–35.0 | 0.831 | −4.5–3.6 | 0.08 | Trivial |
| Body mass (kg) | 75.3 ± 5.3 * | 66.0–83.1 | 61.9 ± 6.0 | 51.8–69.6 | <0.001 | 8.7–18.2 | 2.4 | Very large |
| Height (cm) | 182.1 ± 6.6 * | 174.0–193.0 | 169.9 ± 6.7 | 160.0–178.0 | <0.001 | 6.5–17.8 | 1.8 | Large |
| BMI (kg/m2) | 22.8 ± 1.3 * | 20.8–24.5 | 21.4 ± 1.0 | 20.1–23.6 | 0.010 | 0.4–2.3 | 1.2 | Large |
| Skinfolds | ||||||||
| Triceps (mm) | 6.2 ± 1.7 | 3.0–10.0 | 12.1 ± 2.4 * | 7.0–15.0 | <0.001 | −7.6–−4.1 | 2.9 | Very large |
| Biceps (mm) | 2.7 ± 0.7 | 2.0–4.0 | 4.4 ± 1.4 * | 2.0–6.0 | 0.004 | −2.7–−0.6 | 1.6 | Large |
| Subscapular (mm) | 7.7 ± 1.4 | 6.0–10.0 | 8.1 ± 1.8 | 6.0–11.0 | 0.463 | −1.9–0.9 | 0.3 | Small |
| Iliac crest (mm) | 9.7 ± 3.4 | 5.0–15.0 | 13.4 ± 3.8 * | 9.0–21.0 | 0.020 | −6.7–−0.6 | 1.0 | Moderate |
| Supraspinal (mm) | 6.8 ± 1.9 | 4.0–10.0 | 8.5 ± 2.7 | 6.0–13.0 | 0.088 | −3.7–0.3 | 0.8 | Moderate |
| Abdominal (mm) | 10.2 ± 3.4 | 6.0–16.0 | 12.1 ± 4.5 | 6.0–20.0 | 0.222 | −5.4–1.3 | 0.5 | Small |
| Front thigh (mm) | 10.1 ± 2.9 | 6.0–15.0 | 18.4 ± 4.5 * | 11.0–24.0 | <0.001 | −11.4–−5.1 | 3.5 | Very large |
| Calf (mm) | 5.1 ± 1.7 | 3.0–9.0 | 10.9 ± 3.6 * | 6.0–18.0 | <0.001 | −8.3–−3.3 | 2.0 | Very large |
| Σ 8 skinfolds (mm) | 58.5 ± 12.4 | 37.0–75.0 | 88.0 ± 17.6 * | 61.0–117.0 | <0.001 | −42.1–−16.9 | 2.0 | Very large |
| Girths | ||||||||
| Relaxed arm (cm) | 31.0 ± 2.0 * | 27.5–34.0 | 26.5 ± 1.5 | 24.0–29.0 | <0.001 | 3.0–6.0 | 2.5 | Very large |
| Tensed arm (cm) | 34.6 ± 2.1 * | 30.5–37.5 | 28.6 ± 1.2 | 27.0–30.8 | <0.001 | 4.5–7.4 | 3.4 | Very large |
| Thigh (cm) | 54.1 ± 2.2 * | 48.5–56.5 | 52.1 ± 2.3 | 48.0–56.0 | 0.034 | 0.2–4.0 | 0.9 | Moderate |
| Medial calf (cm) | 37.2 ± 3.3 | 27.0–39.5 | 36.0 ± 1.9 | 33.0–39.5 | 0.297 | −1.1–3.5 | 0.4 | Small |
| Waist (cm) | 79.6 ± 3.0 * | 74.5–85.0 | 70.5 ± 3.9 | 65.0–76.0 | <0.001 | 6.2–12.1 | 2.7 | Very large |
| Hip (cm) | 95.3 ± 3.4 | 88.0–99.0 | 95.9 ± 4.9 | 89.5–106.0 | 0.763 | −4.0–3.0 | 0.1 | Trivial |
| Breadths | ||||||||
| Humerus (cm) | 7.1 ± 0.3 * | 6.5–7.5 | 6.3 ± 0.3 | 5.7–6.6 | <0.001 | 0.6–1.1 | 2.7 | Very large |
| Femur (cm) | 9.7 ± 0.4 * | 9.0–10.0 | 9.0 ± 0.4 | 8.5–9.5 | <0.001 | 0.3–1.0 | 1.8 | Large |
| Stylion (cm) | 5.7 ± 0.2 * | 5.4–6.5 | 5.1 ± 0.2 | 4.7–5.5 | <0.001 | 0.4–0.9 | 3.0 | Very large |
| Male (n = 13) | Female (n = 11) | t-Test | Cohen’s d | |||||
|---|---|---|---|---|---|---|---|---|
| Mean ± SD | Min–Max | Mean ± SD | Min–Max | p | 95% CI | d | Effect Size | |
| Body composition | ||||||||
| Fat mass (%) | 10.3 ± 2.1 | 6.6–13.1 | 15.4 ± 3.1 * | 10.7–20.5 | <0.001 | −7.3–−3.0 | 2.0 | Very large |
| Muscle mass (%) | 46.7 ± 2.0 * | 43.1–49.7 | 39.1 ± 2.1 | 35.2–43.5 | <0.001 | 5.8–9.3 | 3.7 | Very large |
| Bone mass (%) | 16.2 ± 2.2 | 10.1–18.6 | 16.0 ± 0.8 | 14.7–17.4 | 0.754 | −1.2–1.6 | 0.1 | Trivial |
| Residual mass (%) | 26.4 ± 1.9 | 22.9–29.0 | 29.4 ± 1.9 * | 26.2–32.5 | <0.001 | −4.6–−1.4 | 1.6 | Large |
| Fat mass (kg) | 7.8 ± 1.9 | 4.38–10.4 | 9.6 ± 2.4 | 5.7–12.9 | 0.051 | −3.6–0.1 | 0.8 | Moderate |
| Muscle mass (kg) | 35.1 ± 2.3 * | 31.9–38.6 | 24.2 ± 2.4 | 20.4–28.0 | <0.001 | 8.9–12.9 | 4.7 | Very large |
| Bone mass (kg) | 12.5 ± 1.2 * | 11.1–15.4 | 9.9 ± 1.0 | 8.4–11.2 | <0.001 | 1.7–3.5 | 2.3 | Very large |
| Residual mass (kg) | 19.9 ± 1.9 * | 16.7–22.6 | 18.2 ± 1.9 | 14.7–20.1 | 0.039 | 0.1–3.3 | 0.9 | Moderate |
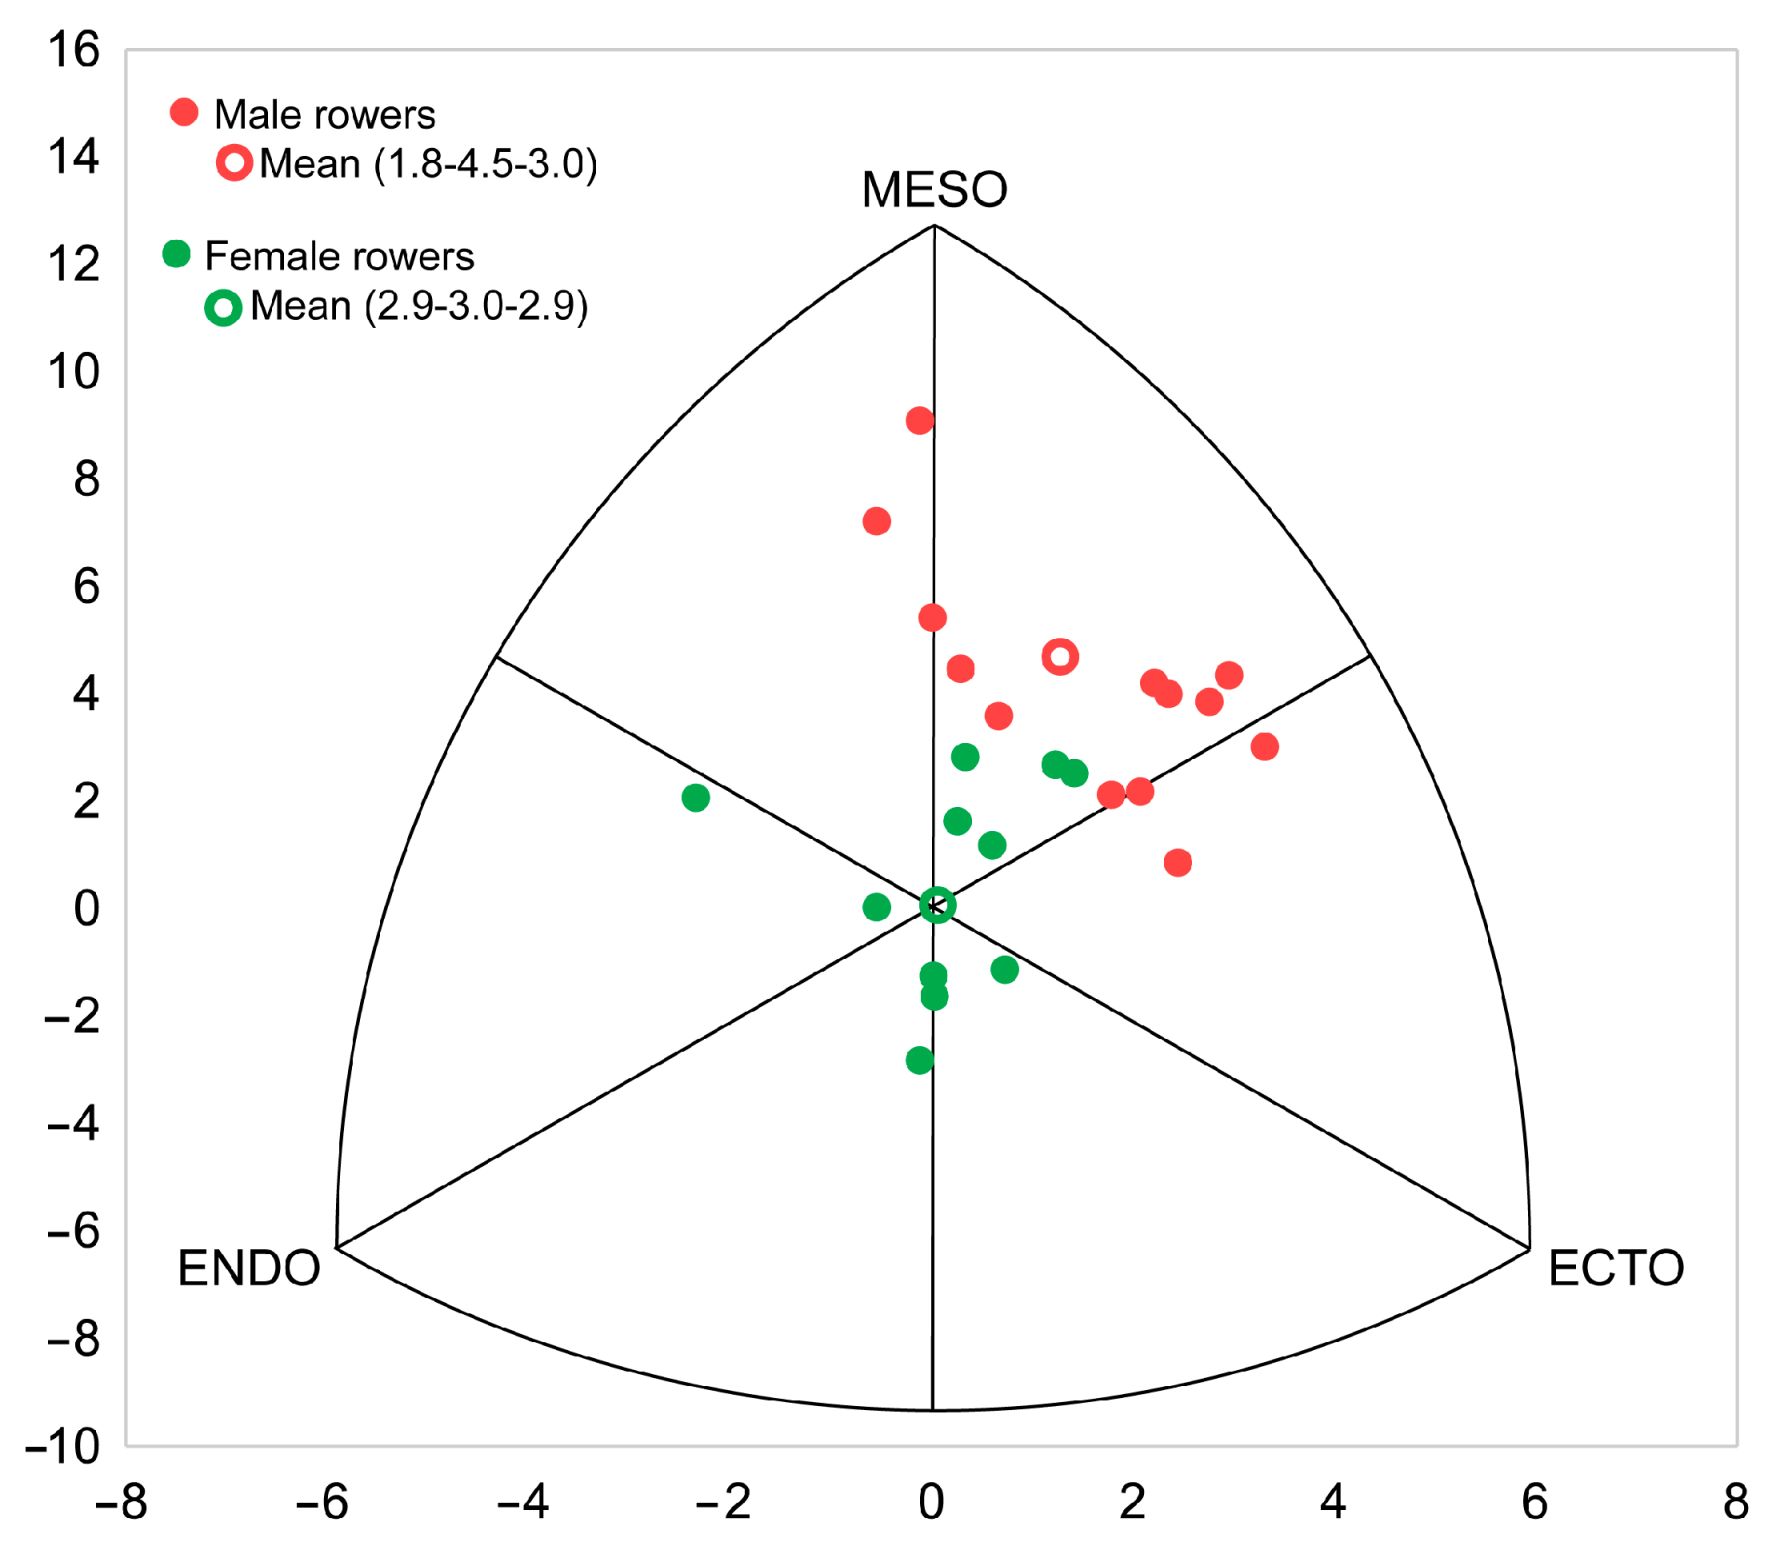
| Somatotype | ||||||||
| Endomorphy | 1.8 ± 0.5 | 1.0–2.4 | 2.9 ± 0.6 * | 2.1–4.0 | <0.001 | −1.5–−0.6 | 2.0 | Very large |
| Mesomorphy | 4.5 ± 0.9 * | 3.1–6.5 | 3.0 ± 0.7 | 1.7–4.0 | <0.001 | 0.9–2.2 | 1.8 | Large |
| Ectomorphy | 3.0 ± 0.8 | 1.8–3.9 | 2.9 ± 0.6 | 1.5–3.5 | 0.685 | −0.5–0.7 | 0.1 | Trivial |
| SAM | 1.1 ± 0.5 | 0.5–2.3 | 0.9 ± 0.5 | 0.5–2.0 | 0.242 | −0.7–0.2 | 0.4 | Small |
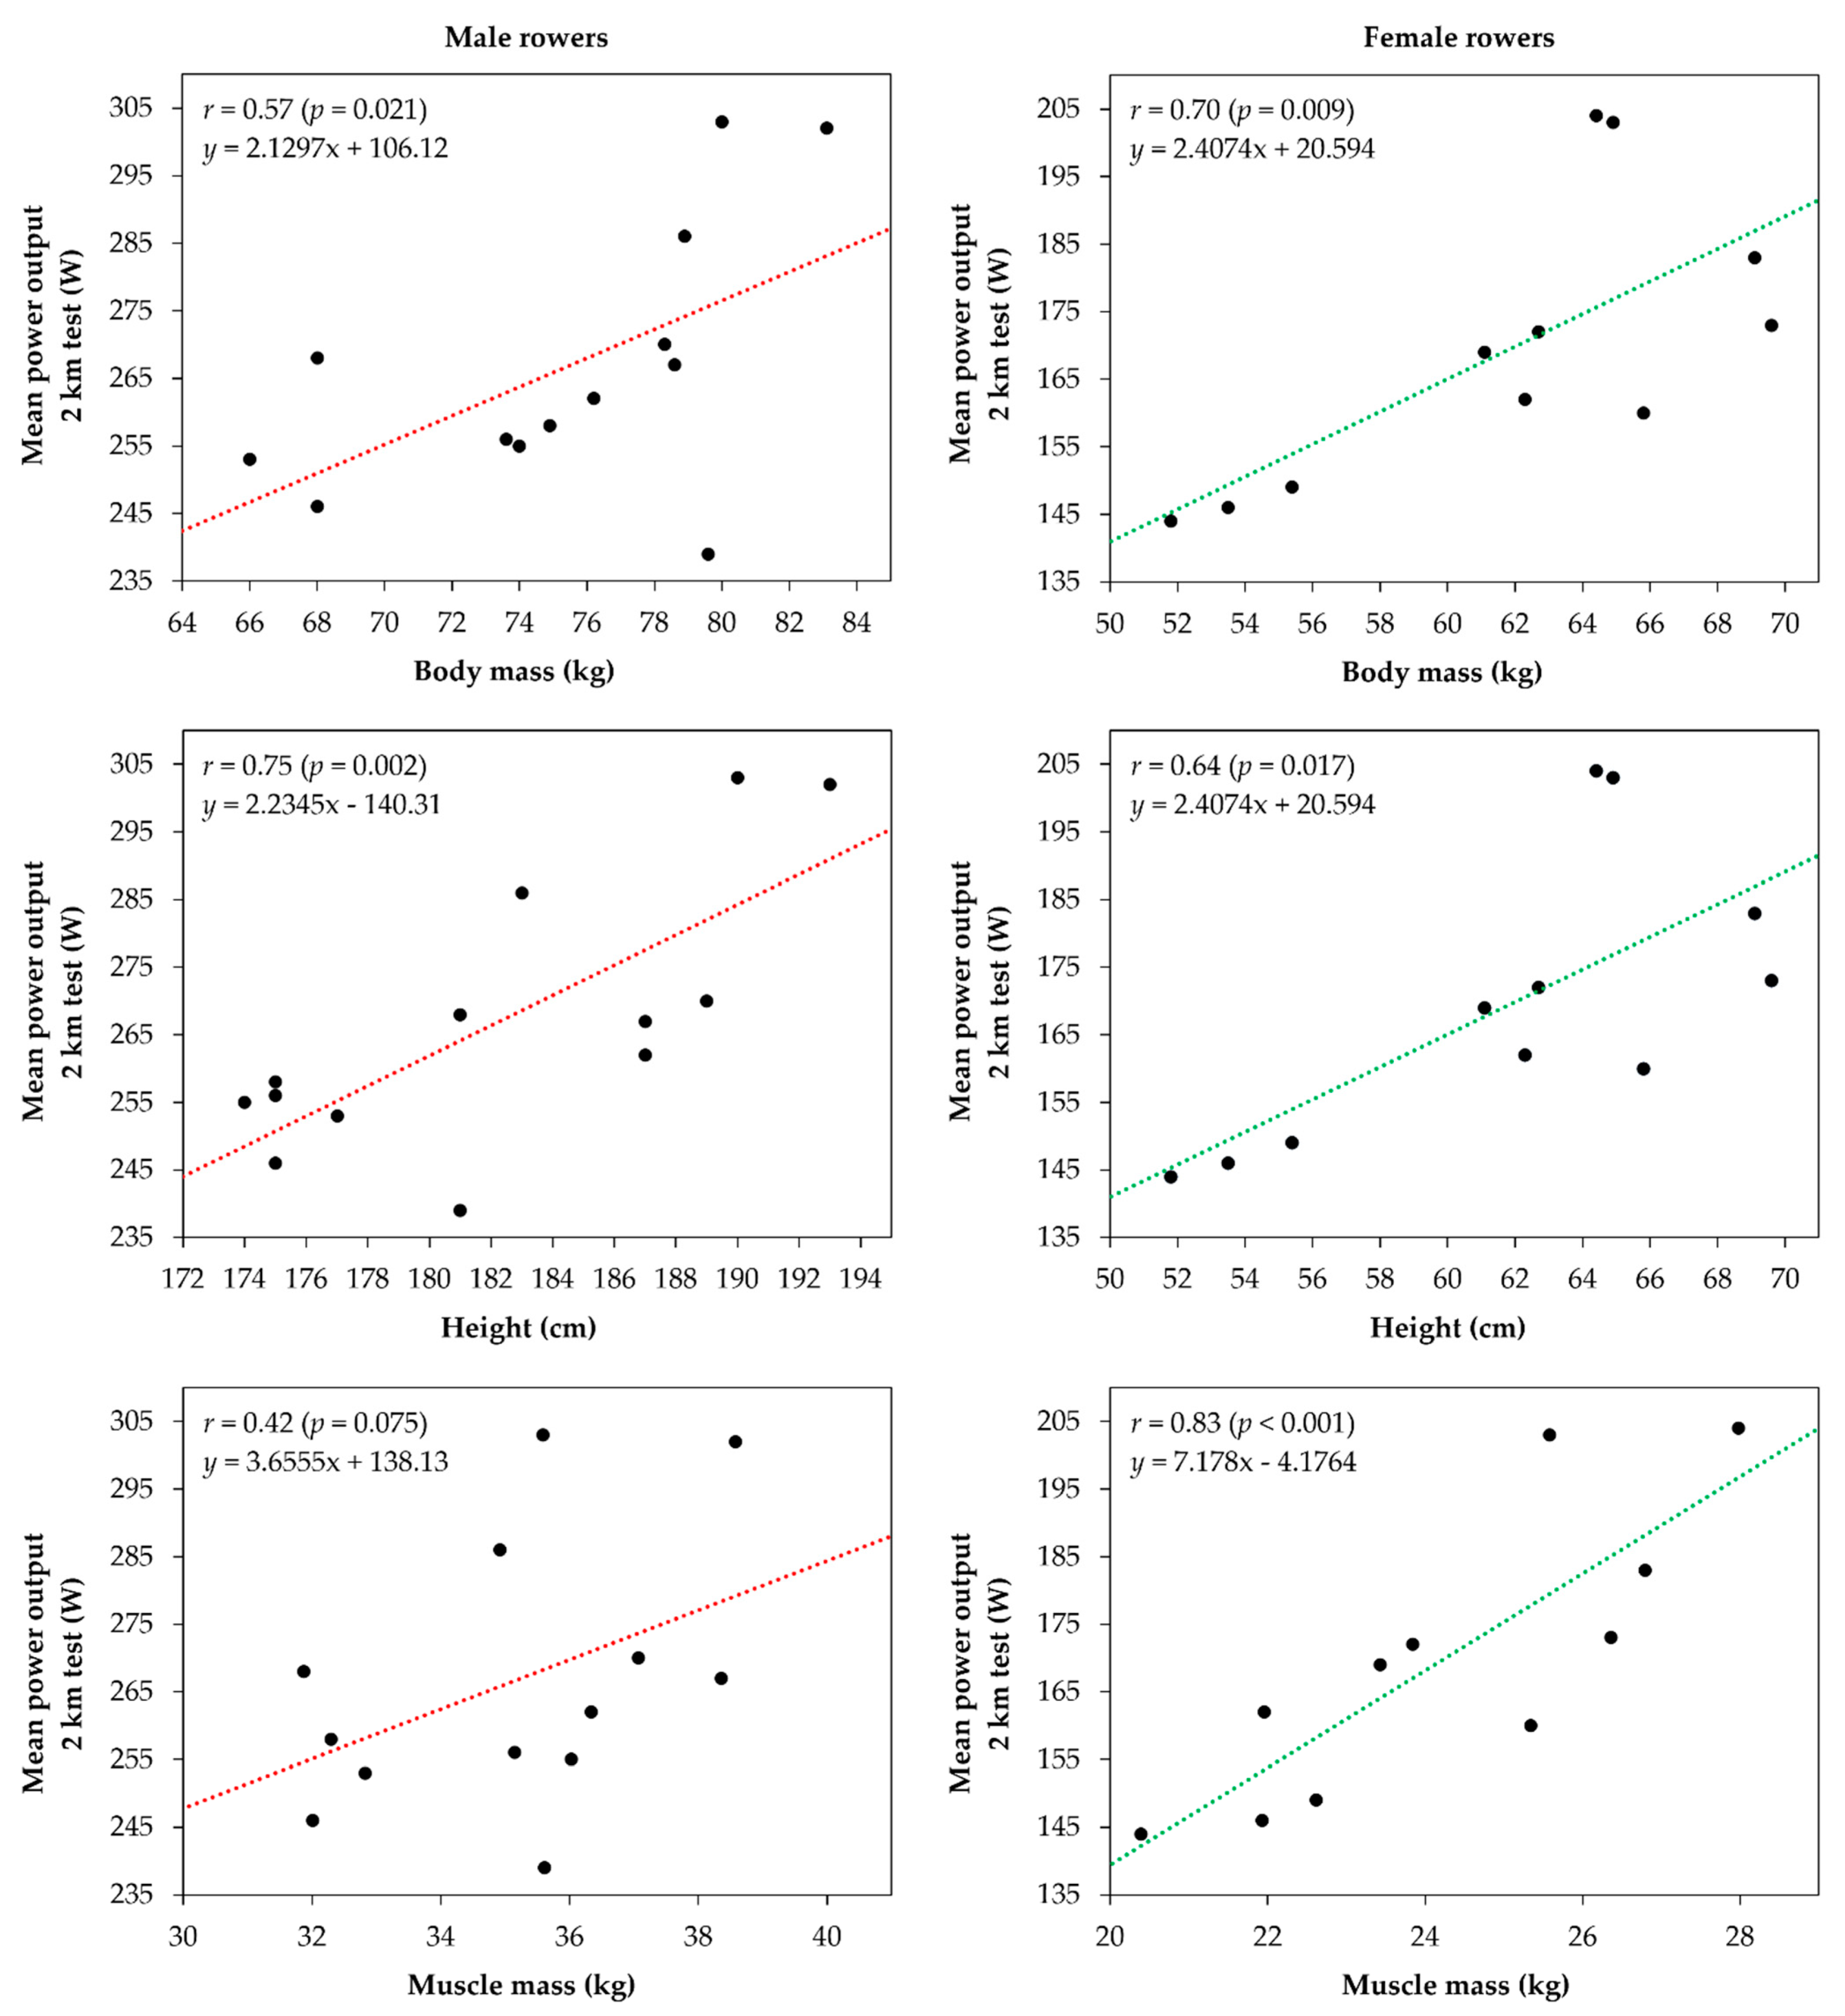
| Rowers | Equation | R2 | Adj. R2 | SEE | p |
|---|---|---|---|---|---|
| Male | W2000m = 2.23 × Height (cm) − 140.31 | 0.56 | 0.52 | 13.72 | 0.003 |
| Female | W2000m = 7.18 × Muscle mass (kg) − 4.18 | 0.68 | 0.65 | 12.28 | 0.002 |
Publisher’s Note: MDPI stays neutral with regard to jurisdictional claims in published maps and institutional affiliations. |
© 2021 by the authors. Licensee MDPI, Basel, Switzerland. This article is an open access article distributed under the terms and conditions of the Creative Commons Attribution (CC BY) license (https://creativecommons.org/licenses/by/4.0/).
Share and Cite
Penichet-Tomas, A.; Pueo, B.; Selles-Perez, S.; Jimenez-Olmedo, J.M. Analysis of Anthropometric and Body Composition Profile in Male and Female Traditional Rowers. Int. J. Environ. Res. Public Health 2021, 18, 7826. https://doi.org/10.3390/ijerph18157826
Penichet-Tomas A, Pueo B, Selles-Perez S, Jimenez-Olmedo JM. Analysis of Anthropometric and Body Composition Profile in Male and Female Traditional Rowers. International Journal of Environmental Research and Public Health. 2021; 18(15):7826. https://doi.org/10.3390/ijerph18157826
Chicago/Turabian StylePenichet-Tomas, Alfonso, Basilio Pueo, Sergio Selles-Perez, and Jose M. Jimenez-Olmedo. 2021. "Analysis of Anthropometric and Body Composition Profile in Male and Female Traditional Rowers" International Journal of Environmental Research and Public Health 18, no. 15: 7826. https://doi.org/10.3390/ijerph18157826
APA StylePenichet-Tomas, A., Pueo, B., Selles-Perez, S., & Jimenez-Olmedo, J. M. (2021). Analysis of Anthropometric and Body Composition Profile in Male and Female Traditional Rowers. International Journal of Environmental Research and Public Health, 18(15), 7826. https://doi.org/10.3390/ijerph18157826