
Association of IL-10 and TNF-α Polymorphisms with Dental Peri-Implant Disease Risk: A Meta-Analysis, Meta-Regression, and Trial Sequential Analysis

 ,
,  and
and
Abstract
1. Introduction
2. Materials and Methods
2.1. Design
2.2. Literature Search Strategy
2.3. Eligibility Criteria
2.4. Data Extraction
2.5. Quality of Assessment
2.6. Statistical Analyses
3. Results
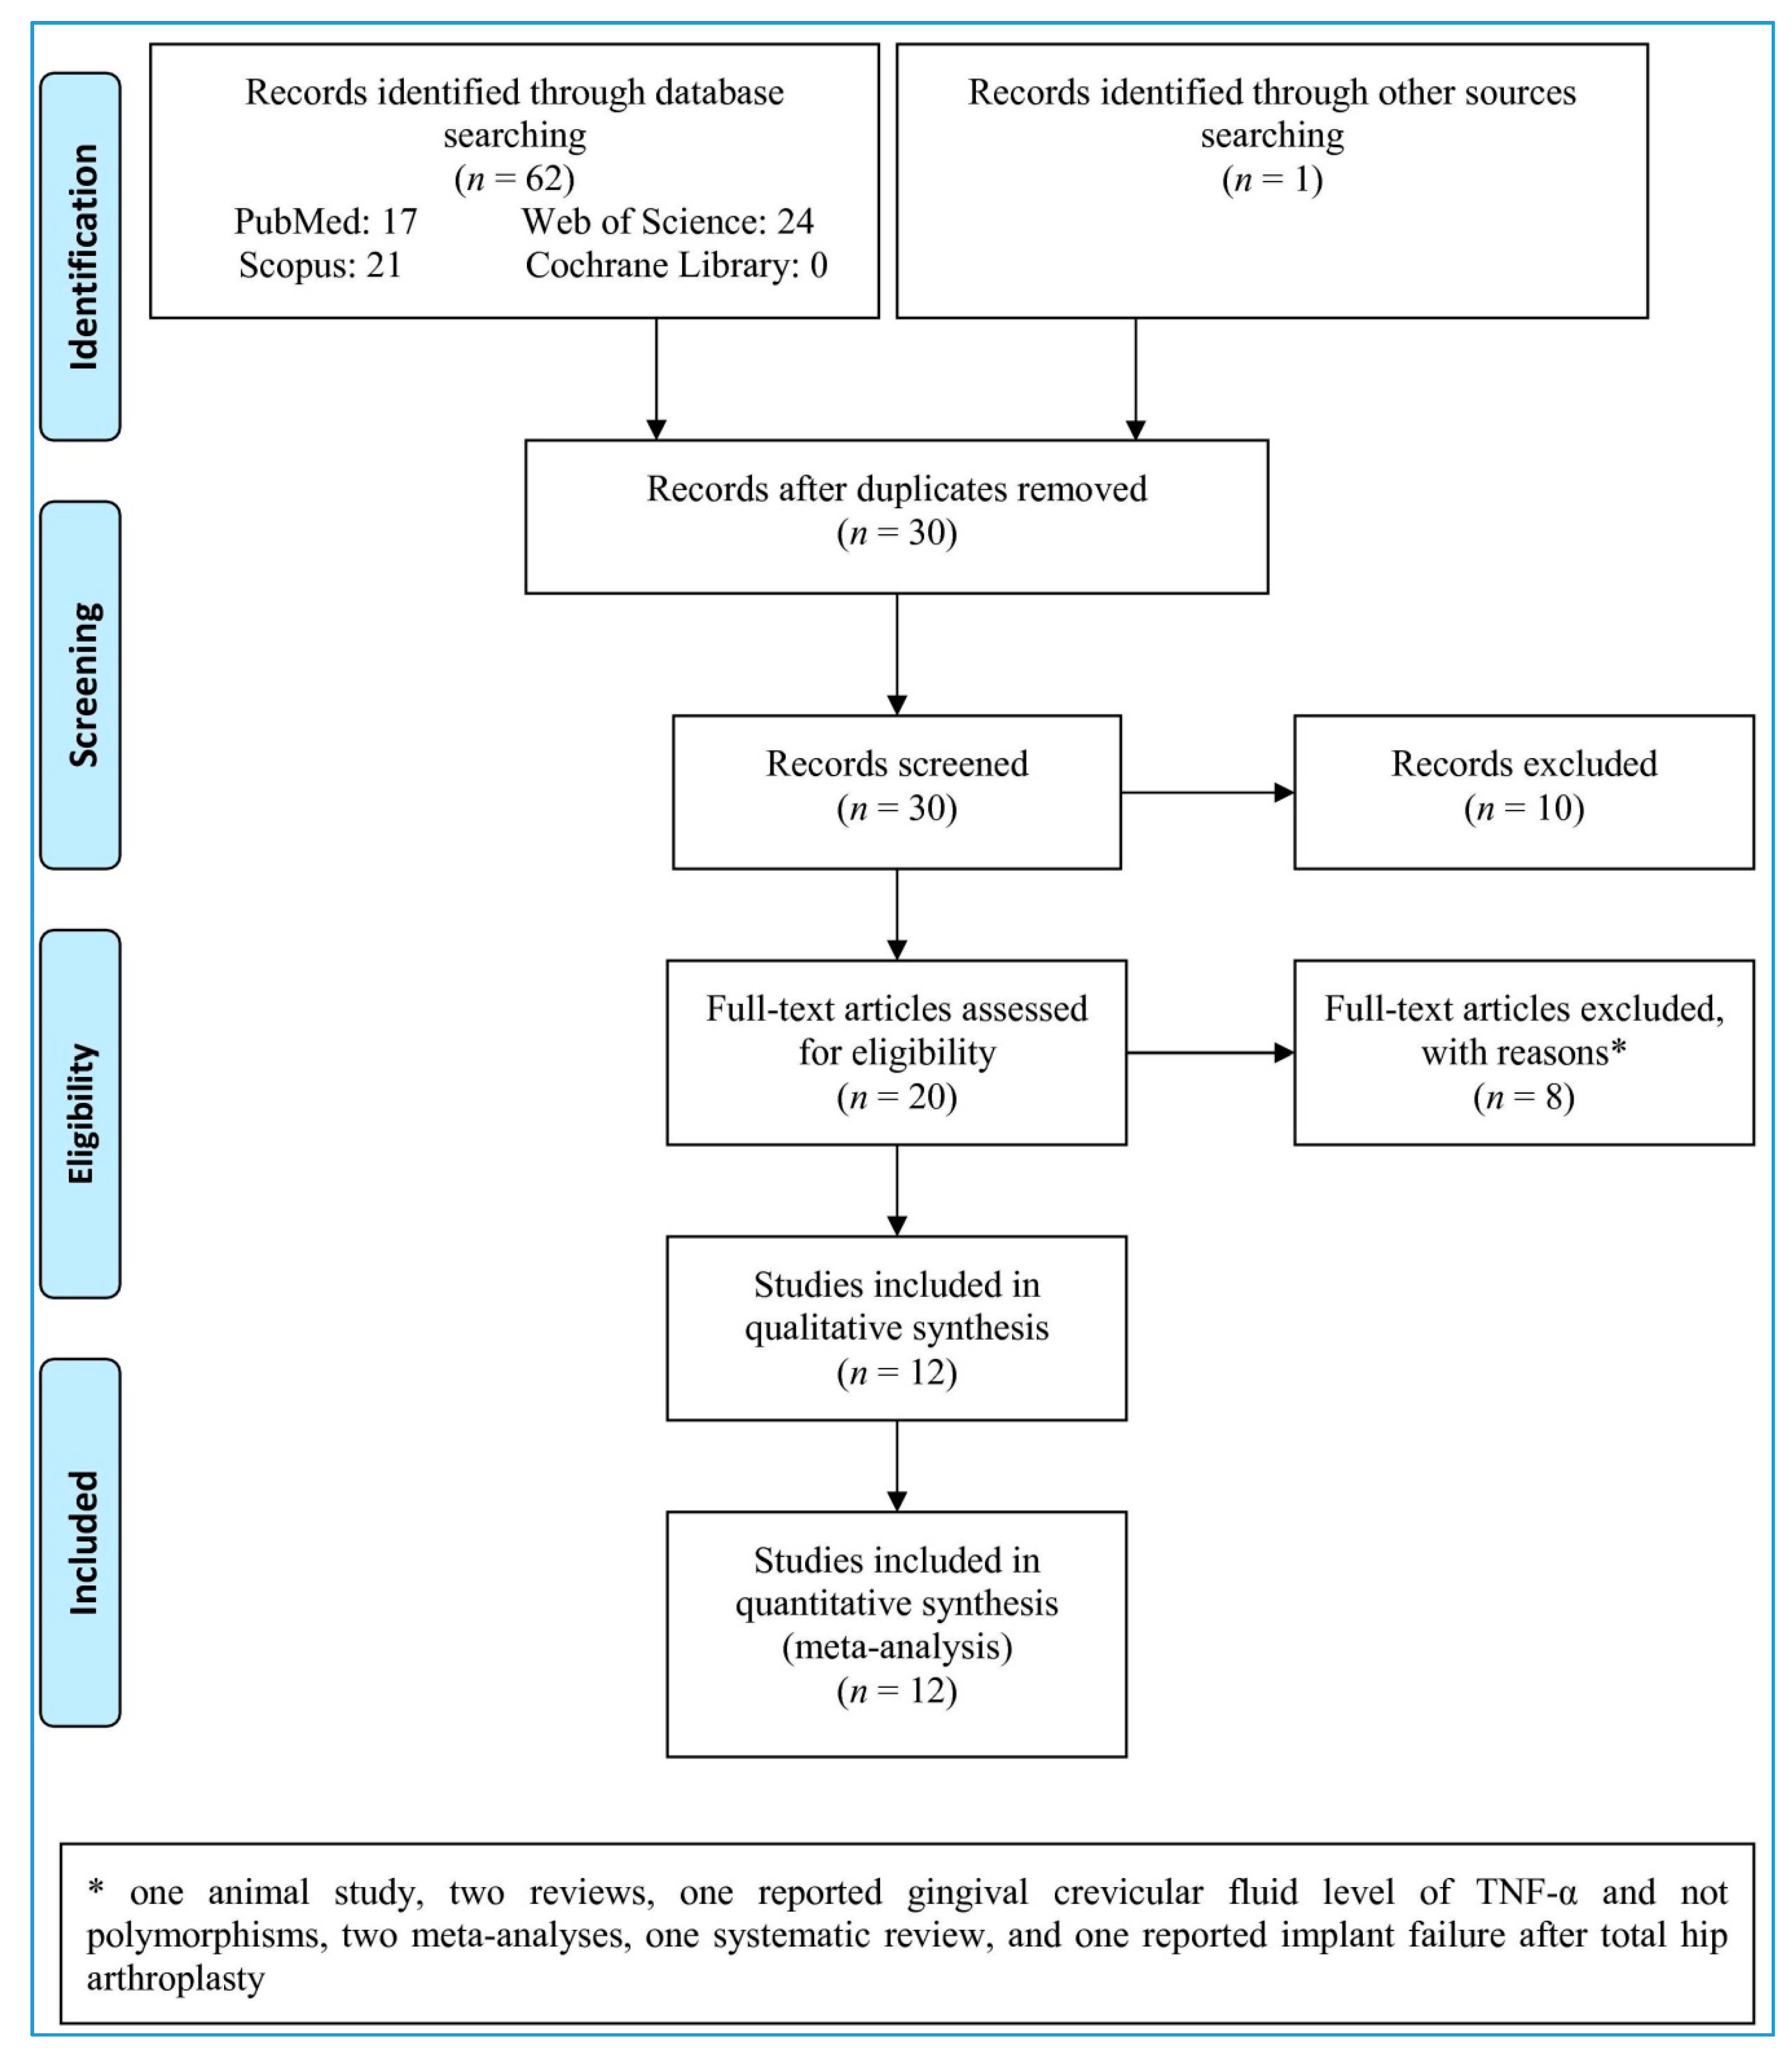
3.1. Study Selection
3.2. Quality Assessment
3.3. Study Characteristics
3.4. Pooled Analyses
3.5. Subgroup Analysis
3.6. Sensitivity Analysis
3.7. Meta-Regression
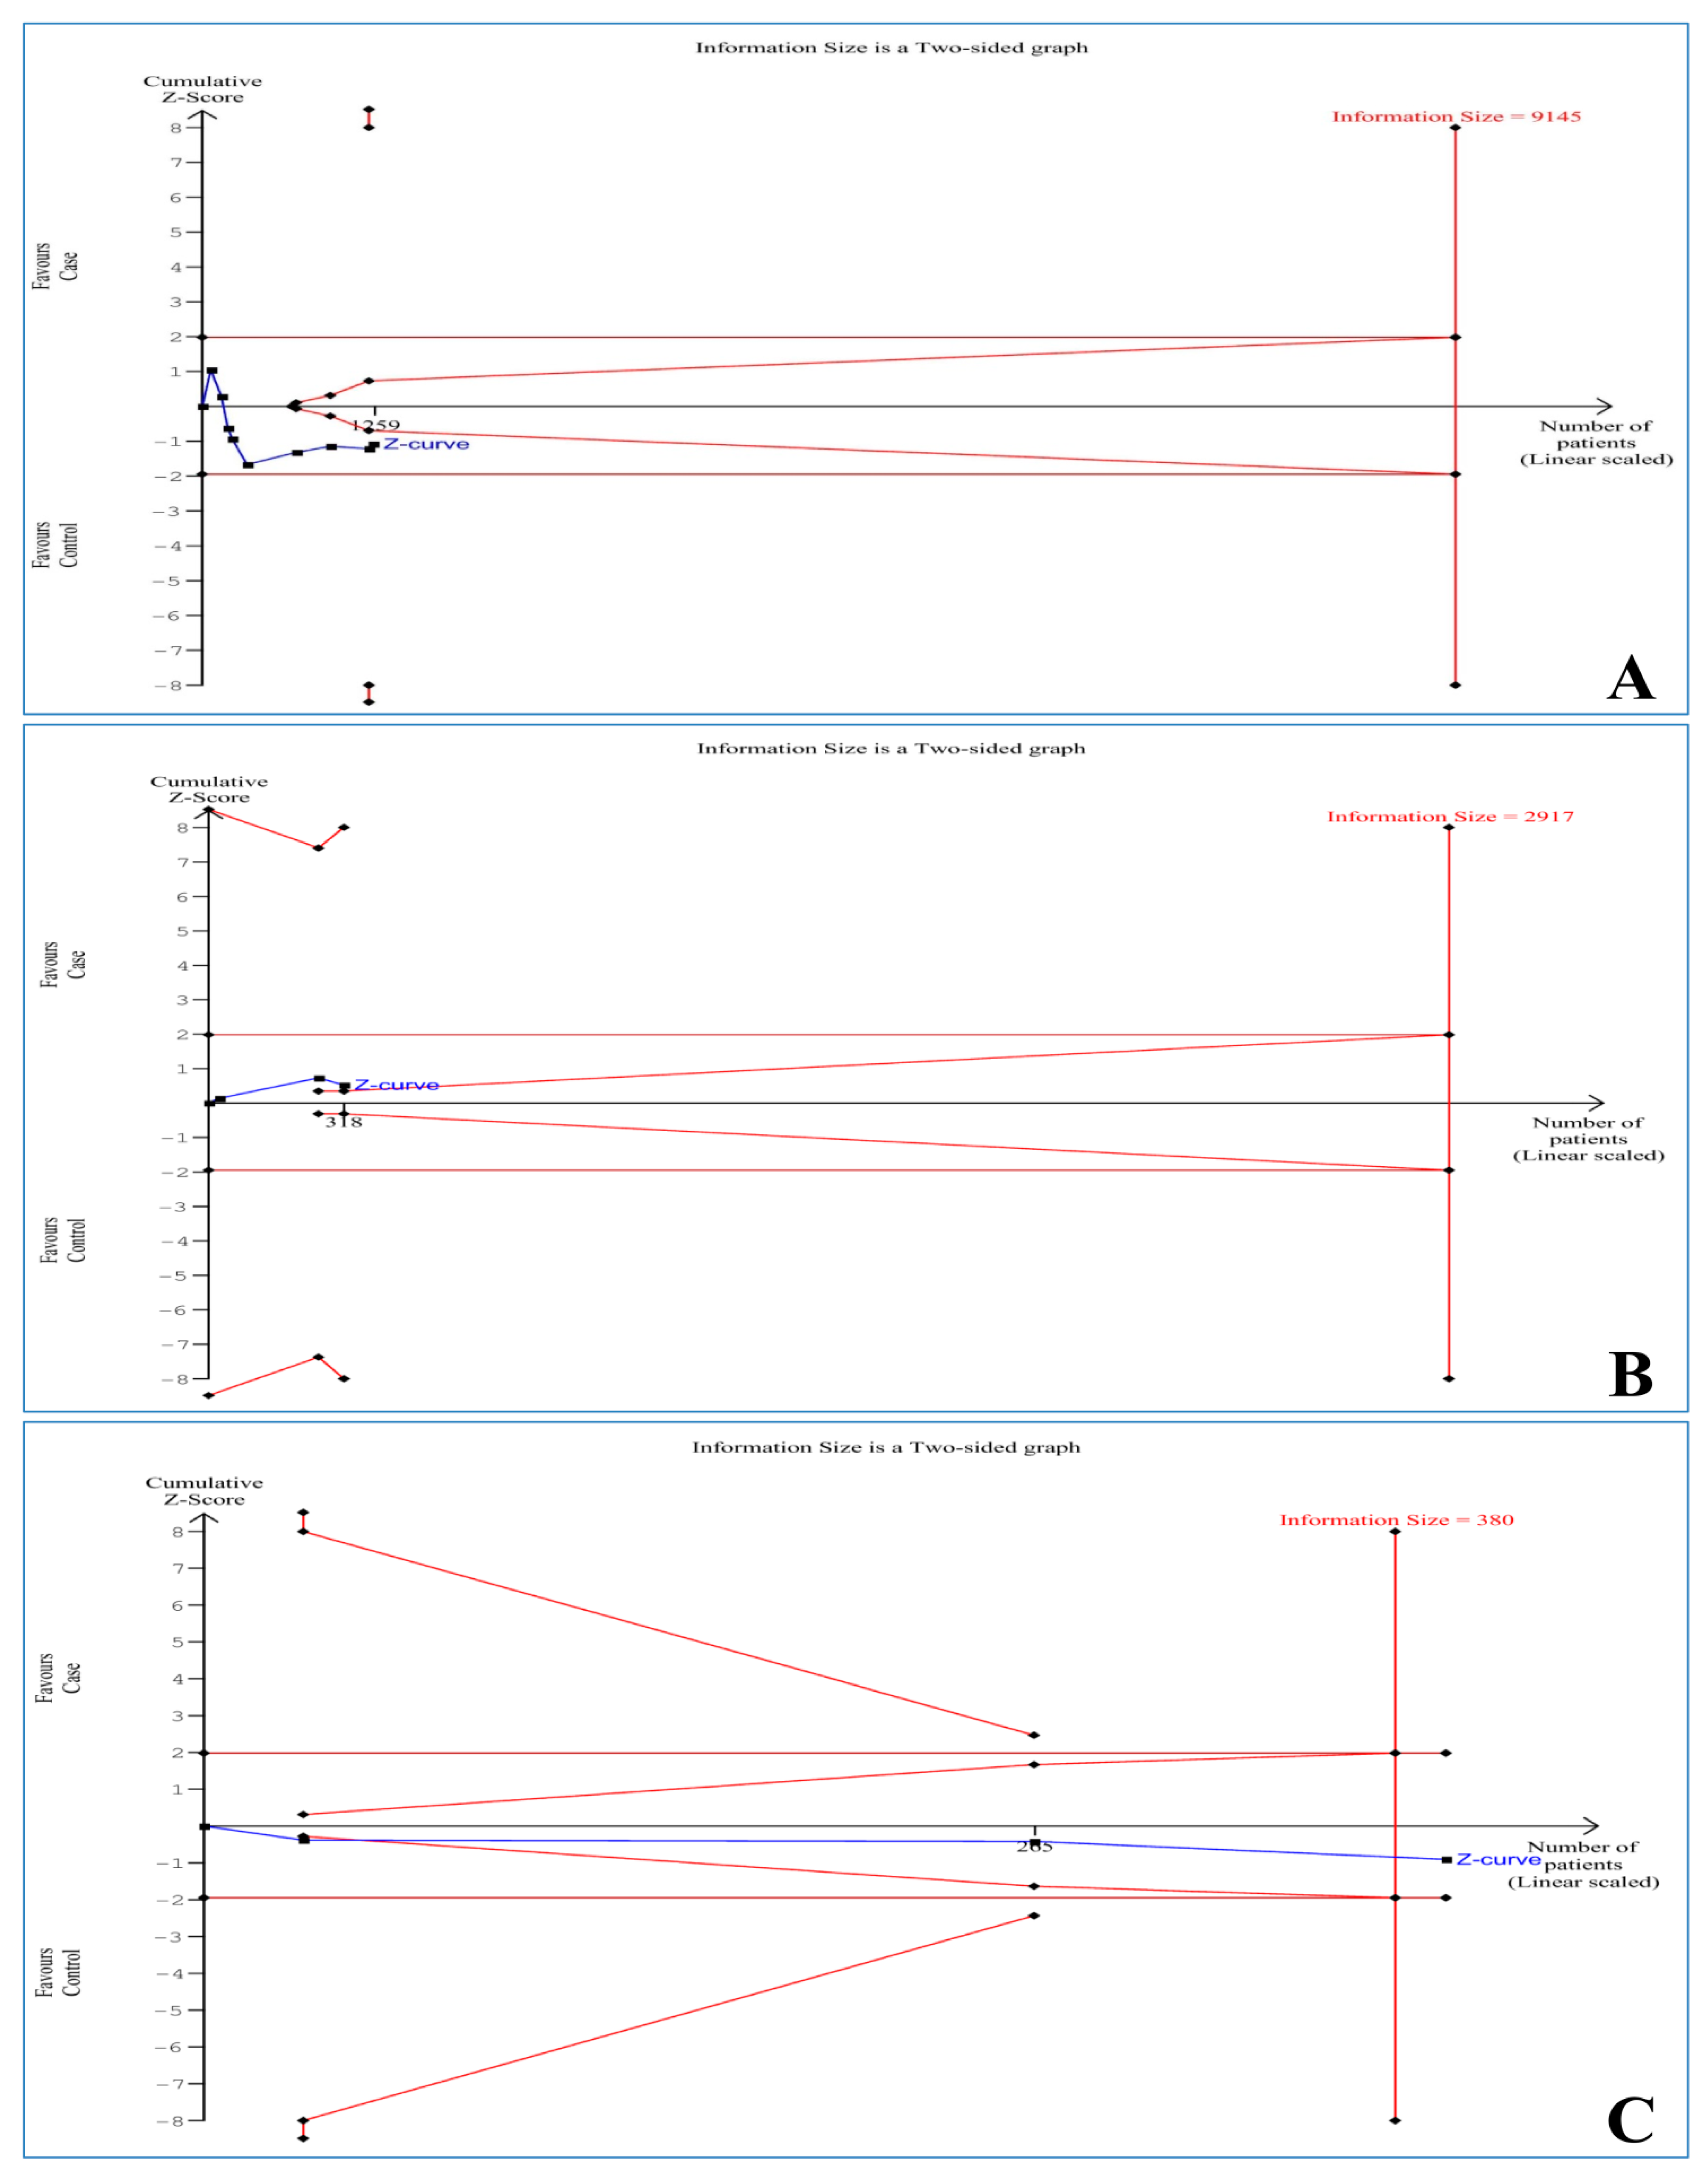
3.8. Trial Sequential Analysis
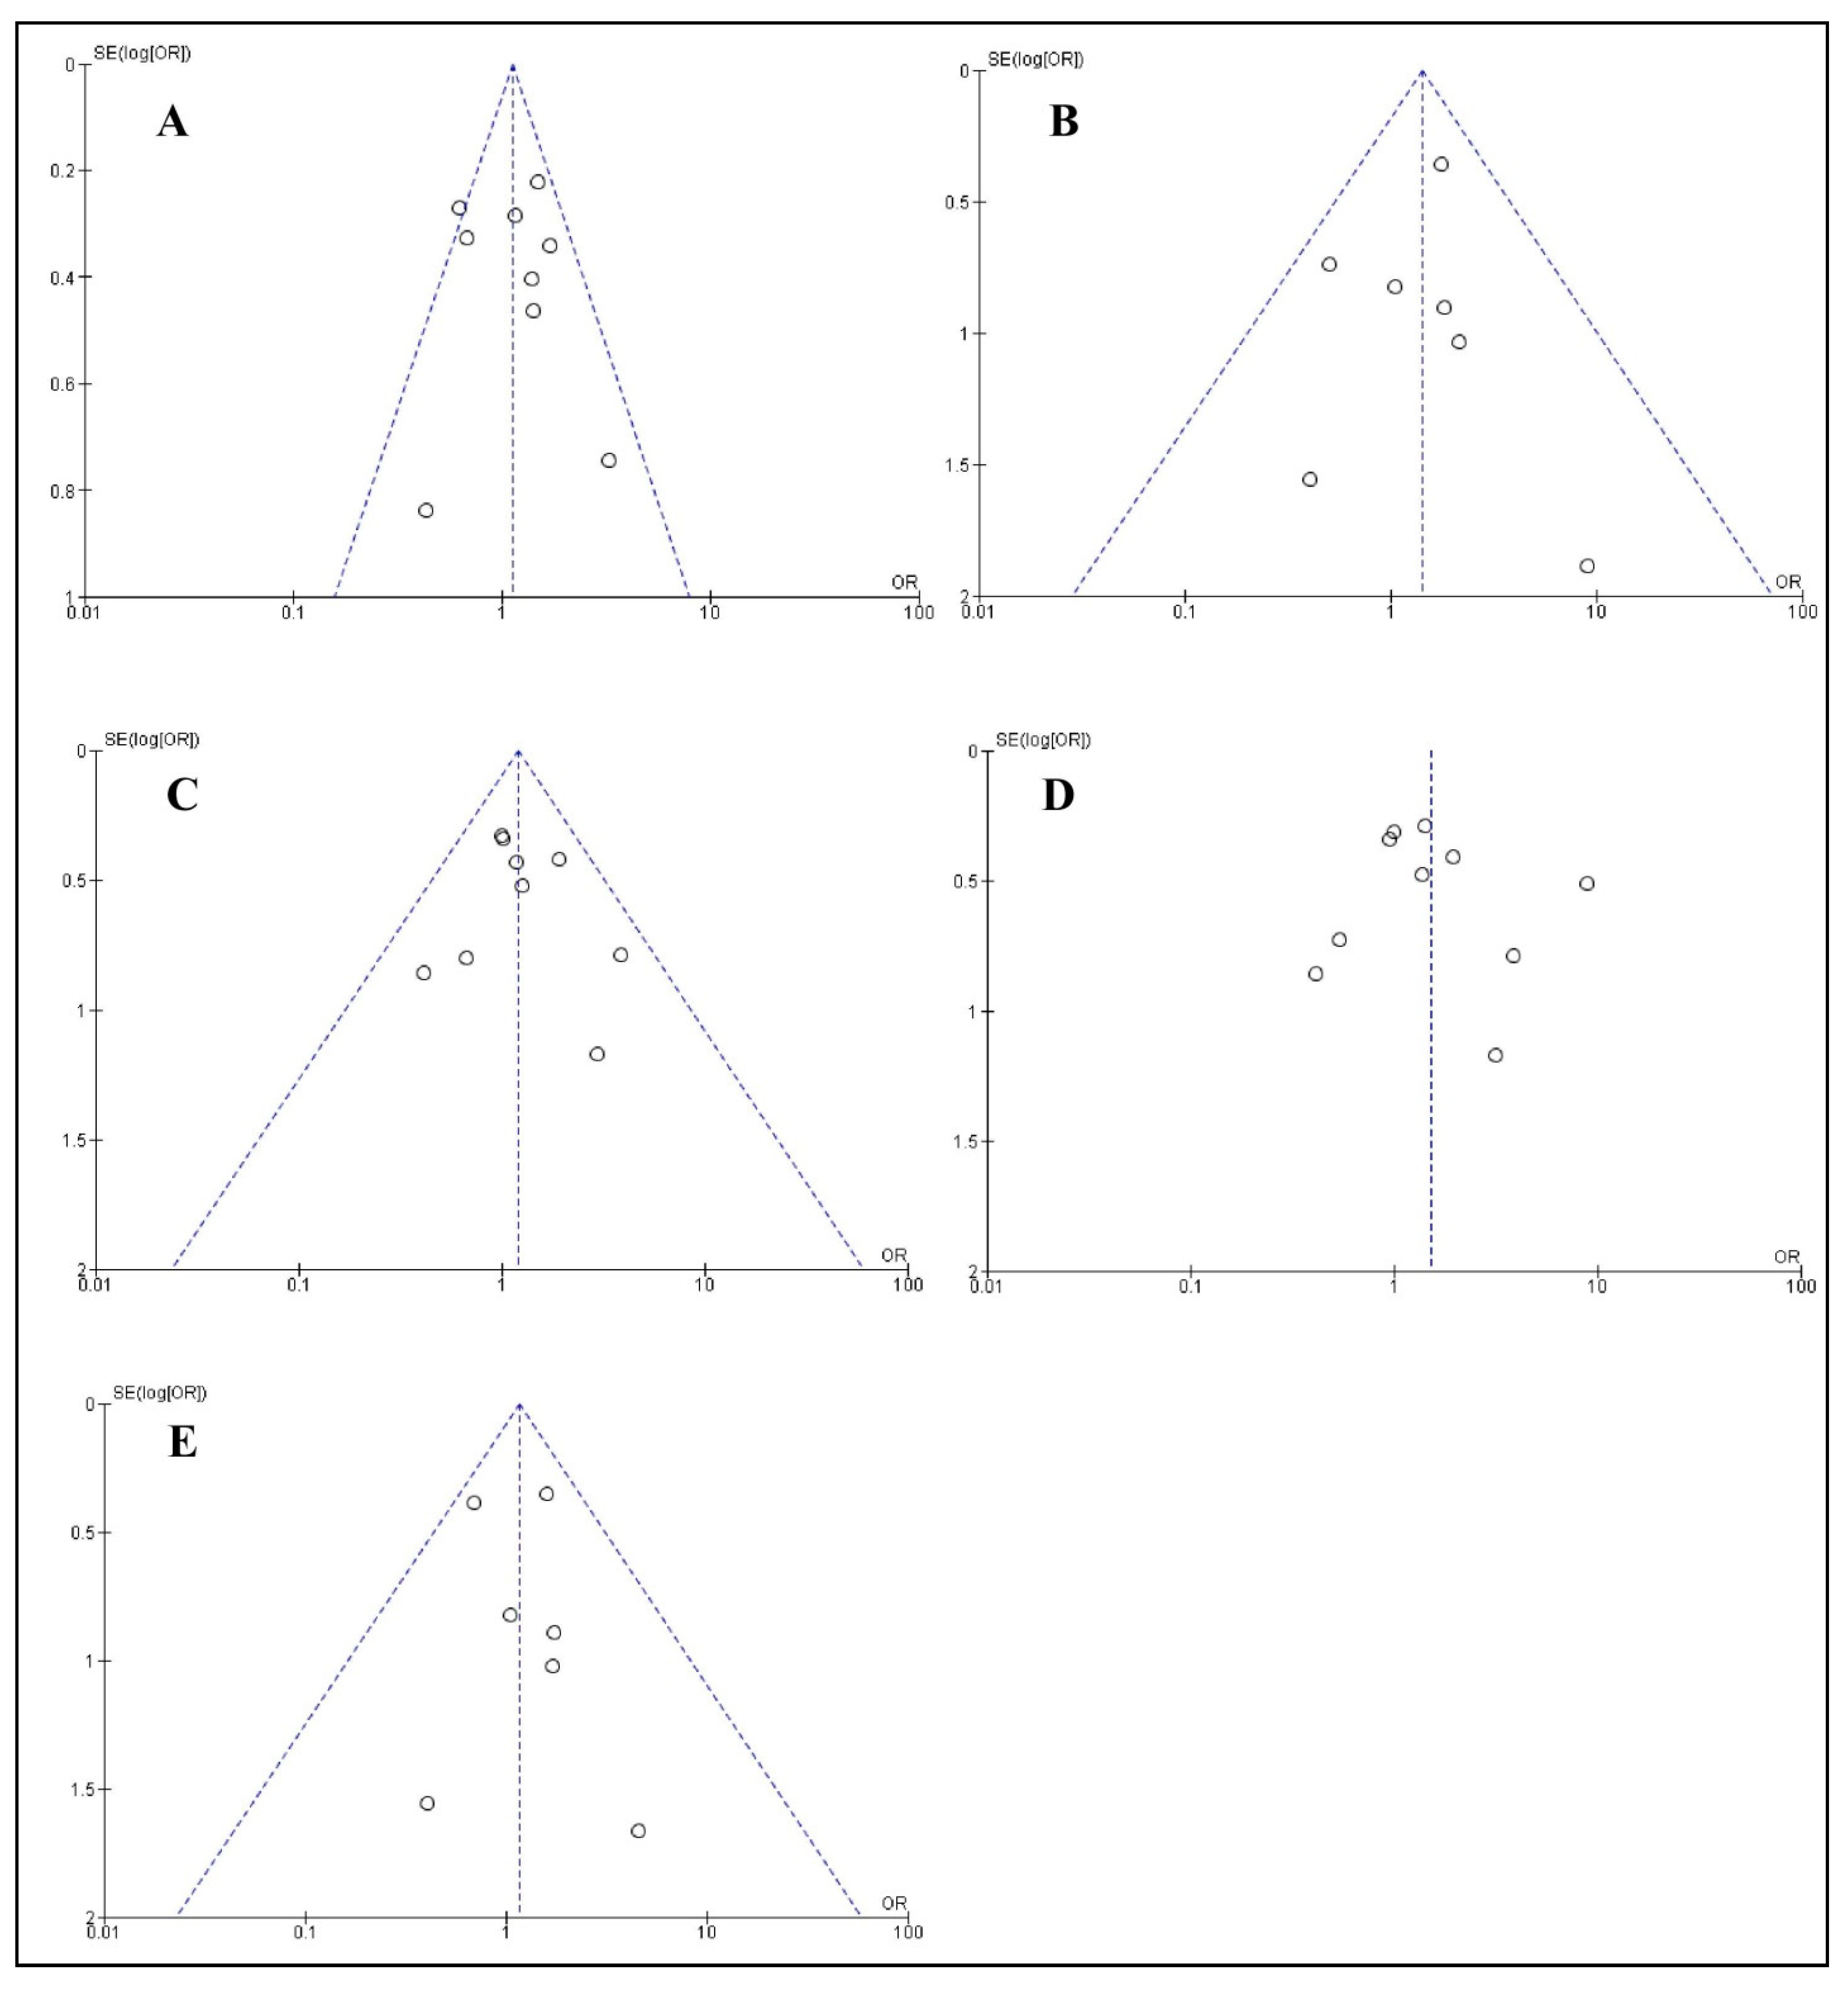
3.9. Publication Bias
4. Discussion
5. Conclusions
Author Contributions
Funding
Institutional Review Board Statement
Informed Consent Statement
Data Availability Statement
Acknowledgments
Conflicts of Interest
References
- Van Steenberghe, D.; Klinge, B.; Lindén, U.; Quirynen, M.; Herrmann, I.; Garpland, C. Periodontal indices around natural and titanium abutments: A longitudinal multicenter study. J. Periodontol. 1993, 64, 538–541. [Google Scholar] [CrossRef]
- Figuero, E.; Graziani, F.; Sanz, I.; Herrera, D.; Sanz, M. Management of peri-implant mucositis and peri-implantitis. Periodontology 2000 2014, 66, 255–273. [Google Scholar] [CrossRef]
- Mo, Y.-Y.; Zeng, X.-T.; Weng, H.; Cen, Y.; Zhao, Q.; Wen, X. Association between tumor necrosis factor-alpha G-308A polymorphism and dental peri-implant disease risk: A meta-analysis. Medicine 2016, 95, e4425. [Google Scholar] [CrossRef]
- Zitzmann, N.U.; Berglundh, T. Definition and prevalence of peri-implant diseases. J. Clin. Periodontol. 2008, 35, 286–291. [Google Scholar] [CrossRef]
- Jepsen, S.; Berglundh, T.; Genco, R.; Aass, A.M.; Demirel, K.; Derks, J.; Figuero, E.; Giovannoli, J.L.; Goldstein, M.; Lambert, F. Primary prevention of peri-implantitis: Managing peri-implant mucositis. J. Clin. Periodontol. 2015, 42, S152–S157. [Google Scholar] [CrossRef]
- Singh, R.; Parihar, A.S.; Vaibhav, V.; Kumar, K.; Singh, R.; Jerry, J.J. A 10 years retrospective study of assessment of prevalence and risk factors of dental implants failures. J. Fam. Med. Prim. Care 2020, 9, 1617. [Google Scholar]
- Cecchinato, D.; Parpaiola, A.; Lindhe, J. A cross-sectional study on the prevalence of marginal bone loss among implant patients. Clin. Oral Implant. Res. 2013, 24, 87–90. [Google Scholar] [CrossRef]
- Moy, P.K.; Medina, D.; Shetty, V.; Aghaloo, T.L. Dental implant failure rates and associated risk factors. Int. J. Oral Maxillofac. Implant. 2005, 20, 569–577. [Google Scholar]
- Kadkhodazadeh, M.; Tabari, Z.A.; Pourseyediyan, T.; Najafi, K.; Amid, R. Relationship between Genetic Polymorphisms with Periodontitis and Peri-Implantitis in the Iranian Population: A Literature Review. J. Long-Term Eff. Med Implant. 2016, 26, 183–190. [Google Scholar] [CrossRef]
- Lee, S.; Kim, J.-Y.; Hwang, J.; Kim, S.; Lee, J.-H.; Han, D.-H. Investigation of pathogenic genes in peri-implantitis from implant clustering failure patients: A whole-exome sequencing pilot study. PLoS ONE 2014, 9, e99360. [Google Scholar] [CrossRef] [PubMed]
- Van Dyke, T.E. The impact of genotypes and immune reactivity on peri-implant inflammation: Identification and therapeutic use of anti-inflammatory drugs and immunomodulators. Eur J Oral Implant. 2012, 5, S51–S60. [Google Scholar]
- Cullinan, M.; Westerman, B.; Hamlet, S.; Palmer, J.; Faddy, M.; Seymour, G.; Middleton, P.; Taylor, J. Progression of periodontal disease and interleukin-10 gene polymorphism. J. Periodontal Res. 2008, 43, 328–333. [Google Scholar] [CrossRef]
- Ding, C.; Ji, X.; Chen, X.; Xu, Y.; Zhong, L. TNF-α gene promoter polymorphisms contribute to periodontitis susceptibility: Evidence from 46 studies. J. Clin. Periodontol. 2014, 41, 748–759. [Google Scholar] [CrossRef] [PubMed]
- He, K.; Jian, F.; He, T.; Tang, H.; Huang, B.; Wei, N. Analysis of the association of TNF-α, IL-1A, and IL-1B polymorphisms with peri-implantitis in a Chinese non-smoking population. Clin. Oral Investig. 2020, 24, 693–699. [Google Scholar] [CrossRef]
- Saremi, L.; Shafizadeh, M.; Esmaeilzadeh, E.; Ghaffari, M.E.; hosein Mahdavi, M.; Amid, R.; Kadkhodazadeh, M. Assessment of IL-10, IL-1ß and TNF-α gene polymorphisms in patients with peri-implantitis and healthy controls. Mol. Biol. Rep. 2021, 48, 2285–2290. [Google Scholar] [CrossRef] [PubMed]
- Ladeira Casado, P.; Villas-Boas, R.; de Mello, W.; Leite Duarte, M.E.; Mauro Granjeiro, J. Peri-implant disease and chronic periodontitis: Is interleukin-6 gene promoter polymorphism the common risk factor in a Brazilian population? Int. J. Oral Maxillofac. Implant. 2013, 28, 35–43. [Google Scholar] [CrossRef][Green Version]
- Petkovic-Curcin, A.; Zeljic, K.; Cikota-Aleksic, B.; Dakovic, D.; Tatic, Z.; Magic, Z. Association of Cytokine Gene Polymorphism with Peri-implantitis, Risk. Int. J. Oral Maxillofac. Implant. 2017, 32, e241–e248. [Google Scholar] [CrossRef]
- Pigossi, S.C.; Alvim-Pereira, F.; Montes, C.C.; Finoti, L.S.; Secolin, R.; Trevilatto, P.C.; Scarel-Caminaga, R.M. Genetic association study between Interleukin 10 gene and dental implant loss. Arch. Oral Biol. 2012, 57, 1256–1263. [Google Scholar] [CrossRef]
- Moore, K.W.; de Waal Malefyt, R.; Coffman, R.L.; O’Garra, A. Interleukin-10 and the interleukin-10 receptor. Annu. Rev. Immunol. 2001, 19, 683–765. [Google Scholar] [CrossRef]
- Duarte, P.M.; De Mendonça, A.C.; Máximo, M.B.B.; Santos, V.R.; Bastos, M.F.; Nociti Júnior, F.H. Differential cytokine expressions affect the severity of peri-implant disease. Clin. Oral Implant. Res. 2009, 20, 514–520. [Google Scholar] [CrossRef]
- Santiago Junior, J.F.; Biguetti, C.C.; Matsumoto, M.A.; Abu Halawa Kudo, G.; Parra da Silva, R.B.; Pinto Saraiva, P.; Fakhouri, W.D. Can genetic factors compromise the success of dental implants? A systematic review and meta-analysis. Genes 2018, 9, 444. [Google Scholar] [CrossRef] [PubMed]
- Moher, D.; Liberati, A.; Tetzlaff, J.; Altman, D.G. Preferred reporting items for systematic reviews and meta-analyses: The PRISMA statement. Int. J. Surg 2010, 8, 336–341. [Google Scholar] [CrossRef] [PubMed]
- DerSimonian, R.; Laird, N. Meta-analysis in clinical trials. Control. Clin. Trials 1986, 7, 177–188. [Google Scholar] [CrossRef]
- Mantel, N.; Haenszel, W. Statistical aspects of the analysis of data from retrospective studies of disease. J. Natl. Cancer Inst. 1959, 22, 719–748. [Google Scholar] [PubMed]
- Imberger, G.; Thorlund, K.; Gluud, C.; Wetterslev, J. False-positive findings in Cochrane meta-analyses with and without application of trial sequential analysis: An empirical review. BMJ Open 2016, 6, e011890. [Google Scholar] [CrossRef]
- Wetterslev, J.; Jakobsen, J.C.; Gluud, C. Trial sequential analysis in systematic reviews with meta-analysis. BMC Med. Res. Methodol. 2017, 17, 1–18. [Google Scholar] [CrossRef]
- Campos, M.I.G.; dos Santos, M.C.L.G.; Trevilatto, P.C.; Scarel-Caminaga, R.M.; Bezerra, F.J.B.; Line, S.R.P. Early failure of dental implants and TNF-α (G-308A) gene polymorphism. Implant Dent. 2004, 13, 95–101. [Google Scholar] [CrossRef]
- Cury, P.R.; Horewicz, V.V.; Ferrari, D.S.; Brito, R., Jr.; Sendyk, W.R.; Duarte, P.M.; Shibli, J.A. Evaluation of the effect of tumor necrosis factor-alpha gene polymorphism on the risk of peri-implantitis: A case-control study. Int. J. Oral Maxillofac. Implant. 2009, 24, 1101–1105. [Google Scholar]
- Lu, X.; Lin, Y.; Li, Z. The relationship between TNF-A-308 gene polymorphism and marginal bone loss around dental implants. Guangdong Periodontol 2009, 1006–5245. [Google Scholar]
- Gurol, C.; Kazazoglu, E.; Dabakoglu, B.; Korachi, M. A Comparative Study of the Role of Cytokine Polymorphisms Interleukin-10 and Tumor Necrosis Factor Alpha in Susceptibility to Implant Failure and Chronic Periodontitis. Int. J. Oral Maxillofac. Implant. 2011, 26, 955–960. [Google Scholar]
- Jacobi-Gresser, E.; Huesker, K.; Schütt, S. Genetic and immunological markers predict titanium implant failure: A retrospective study. Int. J. Oral Maxillofac. Surg. 2013, 42, 537–543. [Google Scholar] [CrossRef] [PubMed]
- Rakic, M.; Petkovic-Curcin, A.; Struillou, X.; Matic, S.; Stamatovic, N.; Vojvodic, D. CD14 and TNFα single nucleotide polymorphisms are candidates for genetic biomarkers of peri-implantitis. Clin. Oral Investig. 2015, 19, 791–801. [Google Scholar] [CrossRef] [PubMed]
- Ribeiro, R.; Melo, R.; Tortamano Neto, P.; Vajgel, A.; Souza, P.R.E.; Cimões, R. Polymorphisms of IL-10 (-1082) and RANKL (-438) genes and the failure of dental implants. Int. J. Dent. 2017, 2017, 1–6. [Google Scholar] [CrossRef]
- Broker, R.d.C.; Doetzer, A.D.; de Souza, C.M.; Alvim-Pereira, F.; Alvim-Pereira, C.C.; Trevilatto, P.C. Clinical aspects and polymorphisms in the LTA, TNFA, LTB genes and association with dental implant loss. Clin. Implant Dent. Relat. Res. 2018, 20, 954–961. [Google Scholar] [CrossRef] [PubMed]
- Gomes, A.M.; Douglas-de-Oliveira, D.W.; Ferreira, S.D.; Silva, T.A.D.; Cota, L.O.M.; Costa, F.O. Periodontal disease, peri-implant disease and levels of salivary biomarkers IL-1β, IL-10, RANK, OPG, MMP-2, TGF-β and TNF-α: Follow-up over 5 years. J. Appl. Oral Sci. 2019, 27. [Google Scholar] [CrossRef] [PubMed]
- Darabi, E.; Kadkhoda, Z.; Amirzargar, A. Comparison of the levels of tumor necrosis factor-α and interleukin-17 in gingival crevicular fluid of patients with peri-implantitis and a control group with healthy implants. Iran. J. Allergy Asthma Immunol. 2013, 12, 75–80. [Google Scholar]
- Farhad, S.Z.; Rezazadeh, F.; Mohammadi, M. Interleukin–17 and interleukin-10 as inflammatory and prevention biomarkers in periimplant diseases. Int. J. Prev. Med. 2019, 10, 137. [Google Scholar] [CrossRef]
- Ata-Ali, J.; Flichy-Fernández, A.J.; Alegre-Domingo, T.; Ata-Ali, F.; Palacio, J.; Peñarrocha-Diago, M. Clinical, microbiological, and immunological aspects of healthy versus peri-implantitis tissue in full arch reconstruction patients: A prospective cross-sectional study. BMC Oral Health 2015, 15, 1–10. [Google Scholar] [CrossRef]
- Casado, P.L.; Canullo, L.; de Almeida Filardy, A.; Granjeiro, J.M.; Barboza, E.P.; Duarte, M.E.L. Interleukins 1β and 10 expressions in the periimplant crevicular fluid from patients with untreated periimplant disease. Implant Dent. 2013, 22, 143–150. [Google Scholar] [CrossRef] [PubMed]
- Ghighi, M.; Llorens, A.; Baroukh, B.; Chaussain, C.; Bouchard, P.; Gosset, M. Differences between inflammatory and catabolic mediators of peri-implantitis and periodontitis lesions following initial mechanical therapy: An exploratory study. J. Periodontal Res. 2018, 53, 29–39. [Google Scholar] [CrossRef]
- Chen, H.; Liu, N.; Xu, X.; Qu, X.; Lu, E. Smoking, radiotherapy, diabetes and osteoporosis as risk factors for dental implant failure: A meta-analysis. PLoS ONE 2013, 8, e71955. [Google Scholar] [CrossRef]
- Galindo-Moreno, P.; Fauri, M.; Ávila-Ortiz, G.; Fernández-Barbero, J.E.; Cabrera-León, A.; Sánchez-Fernández, E. Influence of alcohol and tobacco habits on peri-implant marginal bone loss: A prospective study. Clin. Oral Implant. Res. 2005, 16, 579–586. [Google Scholar] [CrossRef]
- Lindhe, J.; Meyle, J.; Periodontology, G.D.o.t.E.W.o. Peri-implant diseases: Consensus report of the sixth European workshop on periodontology. J. Clin. Periodontol. 2008, 35, 282–285. [Google Scholar] [CrossRef] [PubMed]
- Wilson, T.G., Jr.; Nunn, M. The Relationship between the Interleukin–1 Periodontal Genotype and Implant Loss. Initial Data. J. Periodontol. 1999, 70, 724–729. [Google Scholar] [CrossRef] [PubMed]
- Feloutzis, A.; Lang, N.P.; Tonetti, M.S.; Bürgin, W.; Brägger, U.; Buser, D.; Duff, G.W.; Kornman, K.S. IL-1 gene polymorphism and smoking as risk factors for peri-implant bone loss in a well-maintained population. Clin. Oral Implant. Res. 2003, 14, 10–17. [Google Scholar] [CrossRef] [PubMed]
- Alvim-Pereira, F.; Montes, C.C.; Thomé, G.; Olandoski, M.; Trevilatto, P.C. Analysis of association of clinical aspects and vitamin D receptor gene polymorphism with dental implant loss. Clin. Oral Implant. Res. 2008, 19, 786–795. [Google Scholar] [CrossRef] [PubMed]
- Costa-Junior, F.; Alvim-Pereira, C.; Alvim-Pereira, F.; Trevilatto, P.; de Souza, A.; Santos, M.C.L. Influence of MMP-8 promoter polymorphism in early osseointegrated implant failure. Clin. Oral Investig. 2013, 17, 311–316. [Google Scholar] [CrossRef] [PubMed]
- Dos Santos, M.C.L.G.; Campos, M.I.G.; Souza, A.P.; Scarel-Caminaga, R.M.; Mazzonetto, R.; Line, S.R.P. Analysis of the transforming growth factor-β1 gene promoter polymorphisms in early osseointegrated implant failure. Implant Dent. 2004, 13, 262–269. [Google Scholar] [CrossRef]
- Vaz, P.; Gallas, M.; Braga, A.; Sampaio-Fernandes, J.; Felino, A.; Tavares, P. IL1 gene polymorphisms and unsuccessful dental implants. Clin. Oral Implant. Res. 2012, 23, 1404–1413. [Google Scholar] [CrossRef] [PubMed]
- De Souza Batista, V.E.; Junior, J.F.S.; de Faria Almeida, D.A.; de Toledo Piza Lopes, L.F.; Verri, F.R.; Pellizzer, E.P. The effect of offset implant configuration on bone stress distribution: A systematic review. J. Prosthodont. 2015, 24, 93–99. [Google Scholar] [CrossRef] [PubMed]
- Lemos, C.A.A.; de Souza Batista, V.E.; de Faria Almeida, D.A.; Júnior, J.F.S.; Verri, F.R.; Pellizzer, E.P. Evaluation of cement-retained versus screw-retained implant-supported restorations for marginal bone loss: A systematic review and meta-analysis. J. Prosthet. Dent. 2016, 115, 419–427. [Google Scholar] [CrossRef] [PubMed]


| First Author, Publication Year | Country | Ethnicity | Control Source | Case | Control | Genotyping Method | Form of Disease | Quality Score | ||||
|---|---|---|---|---|---|---|---|---|---|---|---|---|
| Number | Mean/Median Age, Year | Sex (M/F) | Number | Mean/Median Age, Year | Sex (M/F) | |||||||
| Campos, 2004 [27] | Brazil | Mixed | HB | 28 | 52.7 | 13/15 | 38 | 43.2 | 18/20 | PCR | Implant failure | 10 |
| Cury, 2009 [28] | Brazil | Mixed | HB | 49 | 51.1 | 15/34 | 41 | 45.2 | 17/24 | PCR | Peri-implantitis | 8 |
| Lu, 2009 [29] | China | Asian | HB | 18 | 47 | 14/4 | 26 | 48 | 15/11 | PCR | Marginal bone loss | 8 |
| Gurol, 2011 [30] | Turkey | Caucasian | PB | 16 | Range: 15–38 | - | 23 | Range: 15–38 | - | ARMS-PCR | Implant failure | 8 |
| Pigossi, 2012 [18] | Brazil | Mixed | HB | 92 | 55.1 | 37/55 | 185 | 53.1 | 64/121 | RT-PCR | Implant failure | 8 |
| Jacobi-Gresser, 2013 [31] | Germany | Caucasian | HB | 41 | 51.1 | 18/23 | 68 | 51.8 | 16/52 | PCR | Implant failure | 8 |
| Rakic, 2015 [32] | Serbia | Caucasian | HB | 180 | 53.2 | 102/78 | 189 | 49.4 | 99/90 | PCR-RFLP | Peri-implantitis | 10 |
| Petkovic-Curcin, 2017 [17] | Serbia | Caucasian | HB | 34 | 58 | 26/8 | 64 | 58 | 44/20 | PCR-RFLP | Peri-implantitis | 8 |
| Ribeiro, 2017 [33] | Brazil | Mixed | HB | 29 | Range: 21–80 | - | 61 | Range: 21–80 | - | ARMS-PCR | Implant failure | 8 |
| Broker, 2018 [34] | Brazil | Mixed | HB | 81 | 52.9 | 30/51 | 163 | 51 | 52/111 | RT-PCR | Implant failure | 9 |
| He, 2020 [14] | China | Asian | PB | 144 | 45.1 | 88/56 | 174 | 44.3 | 92/82 | PCR | Peri-implantitis | 9 |
| Saremi, 2021 [15] | Iran | Caucasian | PB | 50 | 42.2 | 24/26 | 89 | 40.4 | 43/46 | PCR-RFLP | Peri-implantitis | 9 |
| First Author, Publication Year | TNF-α (−308 G > A) | p-Value of HWE in Control | |||||
|---|---|---|---|---|---|---|---|
| Case | Control | ||||||
| GG | GA | AA | GG | GA | AA | ||
| Campos, 2004 [27] | 26 | 2 | 0 | 32 | 6 | 0 | 0.597 |
| Cury, 2009 [28] | 34 | 11 | 4 | 31 | 8 | 2 | 0.161 |
| Lu, 2009 [29] | 12 | 6 | 0 | 23 | 3 | 0 | 0.746 |
| Gurol, 2011 [30] | 1 | 14 | 1 | 4 | 19 | 0 | < 0.001 |
| Jacobi-Gresser, 2013 [31] | 22 | 17 | 2 | 47 | 19 | 2 | 0.962 |
| Rakic, 2015 [32] | 157 | 20 | 3 | 165 | 21 | 3 | 0.026 |
| Petkovic-Curcin, 2017 [17] | 15 | 19 | 56 | 8 | NA | ||
| Broker, 2018 [34] | 63 | 16 | 0 | 128 | 32 | 2 | 1.000 |
| He, 2020 [14] | 113 | 11 | 20 | 146 | 12 | 16 | < 0.001 |
| Saremi, 2021 [15] | 4 | 12 | 34 | 4 | 18 | 67 | 0.074 |
| IL-10 (−1082 A > G) | |||||||
| AA | AG | GG | AA | AG | GG | ||
| Gurol, 2011 [30] | 2 | 9 | 4 | 3 | 15 | 4 | 0.086 |
| Pigossi, 2012 [18] | 36 | 41 | 15 | 65 | 90 | 24 | 0.412 |
| Petkovic-Curcin, 2017 [17] | 6 | 28 | 25 | 39 | NA | ||
| Ribeiro, 2017 [33] | 6 | 16 | 7 | 11 | 24 | 26 | 0.204 |
| IL-10 (−819 C > T) | |||||||
| CC | CT | TT | CC | CT | TT | ||
| Gurol, 2011 [30] | 0 | 12 | 1 | 1 | 19 | 1 | < 0.001 |
| Pigossi, 2012 [18] | 37 | 38 | 11 | 82 | 76 | 19 | 0.824 |
| Saremi, 2021 [15] | 22 | 21 | 7 | 53 | 35 | 1 | 0.067 |
| IL-10 (−592 A > C) | |||||||
| AA | AC | CC | AA | AC | CC | ||
| Pigossi, 2012 [18] | 24 | 38 | 12 | 87 | 77 | 18 | 0.873 |
| Saremi, 2021 [15] | 8 | 26 | 16 | 1 | 35 | 53 | 0.067 |
| Genetic Model | First Author, Publication Year | Case | Control | Weight | Odds Ratio | ||
|---|---|---|---|---|---|---|---|
| Events | Total | Events | Total | M–H, Fixed, 95%CI | |||
| A vs. G | Campos, 2004 [27] | 2 | 56 | 6 | 76 | 3.3% | 0.43 [0.08, 2.23] |
| Cury, 2009 [28] | 19 | 98 | 12 | 82 | 7.0% | 1.40 [0.64, 3.09] | |
| Lu, 2009 [29] | 6 | 36 | 3 | 52 | 1.4% | 3.27 [0.76, 14.04] | |
| Gurol, 2011 [30] | 16 | 32 | 19 | 46 | 5.2% | 1.42 [0.57, 3.52] | |
| Jacobi-Gresser, 2013 [31] | 21 | 82 | 23 | 136 | 8.5% | 1.69 [0.87, 3.30] | |
| Rakic, 2015 [32] | 26 | 324 | 27 | 388 | 15.0% | 1.17 [0.67, 2.04] | |
| Broker, 2018 [34] | 26 | 360 | 36 | 324 | 23.3% | 0.62 [0.37, 1.06] | |
| He, 2020 [14] | 51 | 288 | 44 | 348 | 21.8% | 1.49 [0.96, 2.30] | |
| Saremi, 2021 [15] | 80 | 100 | 152 | 178 | 14.5% | 0.68 [0.36, 1.30] | |
| Subtotal (95%CI) | 1376 | 1630 | 100.0% | 1.12 [0.90, 1.39] | |||
| Total events | 247 | 322 | |||||
| Heterogeneity: Chi2 = 14.03, df = 8 (p = 0.08); I2 = 43% Test for overall effect: Z = 1.00 (p = 0.32) | |||||||
| AA vs. GG | Campos, 2004 [27] | 0 | 26 | 0 | 32 | Not estimable | |
| Cury, 2009 [28] | 0 | 12 | 0 | 23 | Not estimable | ||
| Lu, 2009 [29] | 4 | 38 | 2 | 33 | 7.9% | 1.82 [0.31, 10.66] | |
| Gurol, 2011 [30] | 1 | 2 | 0 | 4 | 0.8% | 9.00 [0.22, 362.48] | |
| Jacobi-Gresser, 2013 [31] | 2 | 24 | 2 | 49 | 5.0% | 2.14 [0.28, 16.17] | |
| Rakic, 2015 [32] | 3 | 160 | 3 | 168 | 11.8% | 1.05 [0.21, 5.28] | |
| Broker, 2018 [34] | 0 | 63 | 2 | 130 | 6.7% | 0.40 [0.02, 8.56] | |
| He, 2020 [14] | 20 | 123 | 16 | 162 | 47.6% | 1.77 [0.88, 3.58] | |
| Saremi, 2021 [15] | 34 | 38 | 67 | 71 | 20.2% | 0.51 [0.12, 2.15] | |
| Subtotal (95%CI) | 486 | 672 | 100.0% | 1.42 [0.85, 2.37] | |||
| Total events | 64 | 92 | |||||
| Heterogeneity: Chi2 = 4.30, df = 6 (p = 0.64); I2 = 0% Test for overall effect: Z = 1.33 (p = 0.18) | |||||||
| GA vs. GG | Campos, 2004 [27] | 2 | 28 | 6 | 38 | 6.7% | 0.41 [0.08, 2.21] |
| Cury, 2009 [28] | 11 | 45 | 8 | 39 | 9.2% | 1.25 [0.45, 3.52] | |
| Lu, 2009 [29] | 6 | 18 | 3 | 26 | 2.3% | 3.83 [0.81, 18.09] | |
| Gurol, 2011 [30] | 14 | 15 | 19 | 23 | 1.4% | 2.95 [0.30, 29.32] | |
| Jacobi-Gresser, 2013 [31] | 17 | 39 | 19 | 66 | 11.3% | 1.91 [0.84, 4.37] | |
| Rakic, 2015 [32] | 20 | 177 | 21 | 186 | 25.9% | 1.00 [0.52, 1.92] | |
| Broker, 2018 [34] | 16 | 79 | 32 | 160 | 24.0% | 1.02 [0.52, 1.99] | |
| He, 2020 [14] | 11 | 124 | 12 | 158 | 13.7% | 1.18 [0.50, 2.78] | |
| Saremi, 2021 [15] | 12 | 16 | 18 | 22 | 5.4% | 0.67 [0.14, 3.19] | |
| Subtotal (95% CI) | 541 | 718 | 100.0% | 1.19 [0.87, 1.63] | |||
| Total events | 109 | 138 | |||||
| Heterogeneity: Chi2 = 6.60, df = 8 (p = 0.58); I2 = 0% Test for overall effect: Z = 1.09 (p = 0.28) | |||||||
| AA + GA vs. GG | Campos, 2004 [27] | 2 | 28 | 6 | 38 | 5.6% | 0.41 [0.08, 2.21] |
| Cury, 2009 [28] | 15 | 49 | 10 | 41 | 11.0% | 1.37 [0.54, 3.49] | |
| Lu, 2009 [29] | 6 | 18 | 3 | 26 | 6.3% | 3.83 [0.81, 18.09] | |
| Gurol, 2011 [30] | 15 | 16 | 19 | 23 | 3.5% | 3.16 [0.32, 31.29] | |
| Jacobi-Gresser, 2013 [31] | 19 | 41 | 21 | 68 | 12.5% | 1.93 [0.87, 4.31] | |
| Rakic, 2015 [32] | 23 | 180 | 24 | 189 | 14.6% | 1.01 [0.55, 1.86] | |
| Petkovic-Curcin, 2017 [17] | 19 | 34 | 8 | 64 | 10.4% | 8.87 [3.25, 24.19] | |
| Broker, 2018 [34] | 16 | 79 | 34 | 162 | 14.0% | 0.96 [0.49, 1.86] | |
| He, 2020 [14] | 31 | 144 | 28 | 174 | 15.2% | 1.43 [0.81, 2.52] | |
| Saremi, 2021 [15] | 46 | 50 | 85 | 89 | 7.0% | 0.54 [0.13, 2.26] | |
| Subtotal (95%CI) | 639 | 874 | 100.0% | 1.53 [0.95, 2.45] | |||
| Total events | 192 | 238 | |||||
| Heterogeneity: Tau2 = 0.30; Chi2 = 21.81, df = 9 (p = 0.009); I2 = 59% Test for overall effect: Z = 1.75 (p = 0.08) | |||||||
| AA vs. GG + GA | Campos, 2004 [27] | 0 | 28 | 0 | 38 | Not estimable | |
| Cury, 2009 [28] | 0 | 18 | 0 | 26 | Not estimable | ||
| Lu, 2009 [29] | 4 | 49 | 2 | 41 | 5.5% | 1.73 [0.30, 9.98] | |
| Gurol, 2011 [30] | 1 | 16 | 0 | 23 | 1.0% | 4.55 [0.17, 118.99] | |
| Jacobi-Gresser, 2013 [31] | 2 | 41 | 2 | 68 | 4.0% | 1.69 [0.23, 12.50] | |
| Rakic, 2015 [32] | 3 | 180 | 3 | 189 | 7.9% | 1.05 [0.21, 5.28] | |
| Broker, 2018 [34] | 0 | 79 | 2 | 162 | 4.5% | 0.40 [0.02, 8.51] | |
| He, 2020 [14] | 20 | 144 | 16 | 174 | 34.4% | 1.59 [0.79, 3.20] | |
| Saremi, 2021 [15] | 34 | 50 | 67 | 89 | 42.6% | 0.70 [0.32, 1.50] | |
| Subtotal (95%CI) | 605 | 810 | 100.0% | 1.16 [0.74, 1.81] | |||
| Total events | 64 | 92 | |||||
| Heterogeneity: Chi2 = 3.98, df = 6 (p = 0.68); I2 = 0% Test for overall effect: Z = 0.64 (p = 0.52) | |||||||
| Genetic Model | First Author, Publication Year | Case | Control | Weight | Odds Ratio | ||
|---|---|---|---|---|---|---|---|
| Events | Total | Events | Total | M–H, Fixed, 95%CI | |||
| G vs. A | Gurol, 2011 [30] | 17 | 30 | 23 | 44 | 9.1% | 1.19 [0.47, 3.04] |
| Pigossi, 2012 [18] | 71 | 184 | 138 | 358 | 64.5% | 1.00 [0.70, 1.44] | |
| Ribeiro, 2017 [33] | 30 | 58 | 76 | 122 | 26.5% | 0.65 [0.34, 1.22] | |
| Subtotal (95%CI) | 272 | 524 | 100.0% | 0.93 [0.69, 1.25] | |||
| Total events | 118 | 237 | |||||
| Heterogeneity: Chi2 = 1.68, df = 2 (p = 0.43); I2 = 0% Test for overall effect: Z = 0.51 (p = 0.61) | |||||||
| GG vs. AA | Gurol, 2011 [30] | 4 | 6 | 4 | 7 | 6.2% | 1.50 [0.16, 14.42] |
| Pigossi, 2012 [18] | 15 | 51 | 24 | 89 | 62.3% | 1.13 [0.53, 2.42] | |
| Ribeiro, 2017 [33] | 7 | 13 | 26 | 37 | 31.5% | 0.49 [0.13, 1.81] | |
| Subtotal (95%CI) | 70 | 133 | 100.0% | 0.95 [0.51, 1.79] | |||
| Total events | 26 | 54 | |||||
| Heterogeneity: Chi2 = 1.33, df = 2 (p = 0.51); I2 = 0% Test for overall effect: Z = 0.15 (p = 0.88) | |||||||
| AG vs. AA | Gurol, 2011 [30] | 9 | 11 | 15 | 18 | 5.9% | 0.90 [0.13, 6.46] |
| Pigossi, 2012 [18] | 41 | 77 | 90 | 155 | 79.7% | 0.82 [0.47, 1.43] | |
| Ribeiro, 2017 [33] | 16 | 22 | 24 | 35 | 14.4% | 1.22 [0.38, 3.97] | |
| Subtotal (95% CI) | 110 | 208 | 100.0% | 0.88 [0.55, 1.43] | |||
| Total events | 66 | 129 | |||||
| Heterogeneity: Chi2 = 0.36, df = 2 (p = 0.84); I2 = 0% Test for overall effect: Z = 0.50 (p = 0.62) | |||||||
| GG + AG vs. AA | Gurol, 2011 [30] | 13 | 15 | 19 | 22 | 4.7% | 1.03 [0.15, 7.02] |
| Pigossi, 2012 [18] | 56 | 92 | 114 | 179 | 69.2% | 0.89 [0.53, 1.49] | |
| Petkovic-Curcin, 2017 [17] | 23 | 29 | 50 | 61 | 15.2% | 0.84 [0.28, 2.56] | |
| Ribeiro, 2017 [33] | 28 | 34 | 39 | 64 | 10.9% | 2.99 [1.08, 8.25] | |
| Subtotal (95%CI) | 170 | 326 | 100.0% | 1.12 [0.74, 1.68] | |||
| Total events | 120 | 222 | |||||
| Heterogeneity: Chi2 = 4.64, df = 3 (p = 0.20); I2 = 35% Test for overall effect: Z = 0.53 (p = 0.60) | |||||||
| GG vs. AA + AG | Gurol, 2011 [30] | 4 | 15 | 4 | 22 | 20.8% | 1.64 [0.34, 7.91] |
| Pigossi, 2012 [18] | 15 | 92 | 24 | 179 | 44.1% | 1.26 [0.62, 2.54] | |
| Ribeiro, 2017 [33] | 7 | 34 | 26 | 64 | 35.2% | 0.38 [0.14, 1.00] | |
| Subtotal (95%CI) | 141 | 265 | 100.0% | 0.87 [0.36, 2.11] | |||
| Total events | 26 | 54 | |||||
| Heterogeneity: Tau2 = 0.33; Chi2 = 4.50, df = 2 (p = 0.11); I2 = 56% Test for overall effect: Z = 0.31 (p = 0.76) | |||||||
| Genetic Model | First Author, Publication Year | Case | Control | Weight | Odds Ratio | ||
|---|---|---|---|---|---|---|---|
| Events | Total | Events | Total | M–H, Fixed, 95%CI | |||
| T vs. C | Gurol, 2011 [30] | 14 | 26 | 21 | 42 | 10.1% | 1.17 [0.44, 3.11] |
| Pigossi, 2012 [18] | 60 | 172 | 114 | 354 | 66.3% | 1.13 [0.77, 1.66] | |
| Saremi, 2021 [15] | 35 | 100 | 37 | 178 | 23.6% | 2.05 [1.19, 3.55] | |
| Subtotal (95%CI) | 298 | 574 | 100.0% | 1.35 [1.00, 1.82] | |||
| Total events | 109 | 172 | |||||
| Heterogeneity: Chi2 = 3.17, df = 2 (p = 0.20); I2 = 37% Test for overall effect: Z = 1.97 (p = 0.05) | |||||||
| TT vs. CC | Gurol, 2011 [30] | 1 | 1 | 1 | 2 | 16.3% | 3.00 [0.06, 151.19] |
| Pigossi, 2012 [18] | 11 | 48 | 19 | 101 | 51.2% | 1.28 [0.56, 2.97] | |
| Saremi, 2021 [15] | 7 | 29 | 1 | 54 | 32.5% | 16.86 [1.96, 145.27] | |
| Subtotal (95%CI) | 78 | 157 | 100.0% | 3.41 [0.52, 22.17] | |||
| Total events | 19 | 21 | |||||
| Heterogeneity: Tau2 = 1.60; Chi2 = 4.99, df = 2 (p = 0.08); I2 = 60% Test for overall effect: Z = 1.28 (p = 0.20) | |||||||
| CT vs. TT | Gurol, 2011 [30] | 12 | 12 | 19 | 20 | 1.6% | 1.92 [0.07, 51.03] |
| Pigossi, 2012 [18] | 38 | 75 | 76 | 158 | 66.2% | 1.11 [0.64, 1.92] | |
| Saremi, 2021 [15] | 21 | 43 | 35 | 88 | 32.2% | 1.45 [0.69, 3.01] | |
| Subtotal (95% CI) | 130 | 266 | 100.0% | 1.23 [0.80, 1.90] | |||
| Total events | 71 | 130 | |||||
| Heterogeneity: Chi2 = 0.40, df = 2 (p = 0.82); I2 = 0% Test for overall effect: Z = 0.93 (p = 0.35) | |||||||
| TT + CT vs. CC | Gurol, 2011 [30] | 13 | 13 | 20 | 21 | 1.5% | 1.98 [0.07, 52.16] |
| Pigossi, 2012 [18] | 49 | 86 | 95 | 177 | 70.0% | 1.14 [0.68, 1.92] | |
| Saremi, 2021 [15] | 29 | 50 | 36 | 89 | 28.5% | 2.03 [1.01, 4.11] | |
| Subtotal (95%CI) | 149 | 287 | 100.0% | 1.41 [0.93, 2.13] | |||
| Total events | 91 | 151 | |||||
| Heterogeneity: Chi2 = 1.71, df = 2 (p = 0.43); I2 = 0% Test for overall effect: Z = 1.63 (p = 0.10) | |||||||
| TT vs. CC + CT | Gurol, 2011 [30] | 1 | 13 | 1 | 21 | 20.5% | 1.67 [0.10, 29.18] |
| Pigossi, 2012 [18] | 11 | 86 | 19 | 177 | 50.6% | 1.22 [0.55, 2.69] | |
| Saremi, 2021 [15] | 7 | 50 | 1 | 89 | 28.9% | 14.33 [1.71, 120.16] | |
| Subtotal (95%CI) | 149 | 287 | 100.0% | 2.65 [0.53, 13.34] | |||
| Total events | 19 | 21 | |||||
| Heterogeneity: Tau2 = 1.18; Chi2 = 4.69, df = 2 (p = 0.10); I2 = 57% Test for overall effect: Z = 1.18 (p = 0.24) | |||||||
| Genetic Model | First Author, Publication Year | Case | Control | Weight | Odds Ratio | ||
|---|---|---|---|---|---|---|---|
| Events | Total | Events | Total | M–H, Random, 95%CI | |||
| C vs. A | Pigossi, 2012 [18] | 62 | 148 | 113 | 364 | 50.8% | 1.60 [1.08, 2.38] |
| Saremi, 2021 [15] | 58 | 100 | 141 | 178 | 49.2% | 0.36 [0.21, 0.62] | |
| Subtotal (95%CI) | 248 | 542 | 100.0% | 0.77 [0.18, 3.31] | |||
| Total events | 120 | 254 | |||||
| Heterogeneity: Tau2 = 1.05; Chi2 = 19.07, df = 1 (p < 0.0001); I2 = 95% Test for overall effect: Z = 0.35 (p = 0.73) | |||||||
| CC vs. AA | Pigossi, 2012 [18] | 12 | 36 | 18 | 105 | 52.7% | 2.42 [1.02, 5.70] |
| Saremi, 2021 [15] | 16 | 24 | 53 | 54 | 47.3% | 0.04 [0.00, 0.32] | |
| Subtotal (95%CI) | 60 | 159 | 100.0% | 0.34 [0.00, 23.53] | |||
| Total events | 28 | 71 | |||||
| Heterogeneity: Tau2 = 8.70; Chi2 = 13.45, df = 1 (p = 0.0002); I2 = 93% Test for overall effect: Z = 0.50 (p = 0.62) | |||||||
| AC vs. AA | Pigossi, 2012 [18] | 38 | 62 | 77 | 164 | 56.0% | 1.79 [0.99, 3.25] |
| Saremi, 2021 [15] | 26 | 34 | 35 | 36 | 44.0% | 0.09 [0.01, 0.79] | |
| Subtotal (95% CI) | 96 | 200 | 100.0% | 0.49 [0.03, 9.22] | |||
| Total events | 64 | 112 | |||||
| Heterogeneity: Tau2 = 3.93; Chi2 = 7.11, df = 1 (p = 0.008); I2 = 86% Test for overall effect: Z = 0.48 (p = 0.63) | |||||||
| CC + AC vs. AA | Pigossi, 2012 [18] | 50 | 74 | 95 | 182 | 54.3% | 1.91 [1.08, 3.36] |
| Saremi, 2021 [15] | 42 | 50 | 88 | 89 | 45.7% | 0.06 [0.01, 0.49] | |
| Subtotal (95%CI) | 124 | 271 | 100.0% | 0.39 [0.01, 12.59] | |||
| Total events | 92 | 183 | |||||
| Heterogeneity: Tau2 = 5.70; Chi2 = 10.16, df = 1 (p = 0.001); I2 = 90% Test for overall effect: Z = 0.53 (p = 0.60) | |||||||
| CC vs. AA + AC | Pigossi, 2012 [18] | 12 | 74 | 18 | 182 | 49.6% | 1.76 [0.80, 3.87] |
| Saremi, 2021 [15] | 16 | 50 | 53 | 89 | 50.4% | 0.32 [0.15, 0.66] | |
| Subtotal (95%CI) | 124 | 271 | 100.0% | 0.75 [0.14, 3.98] | |||
| Total events | 28 | 71 | |||||
| Heterogeneity: Tau2 = 1.31; Chi2 = 9.75, df = 1 (p = 0.002); I2 = 90% Test for overall effect: Z = 0.34 (p = 0.73) | |||||||
| Variable (N, N′) | A vs. G | AA vs. GG | GA vs. GG | AA + GA vs. GG | AA vs. GG + GA |
|---|---|---|---|---|---|
| OR (95%CI), p, I2 | OR (95%CI), p, I2 | OR (95%CI), p, I2 | OR (95%CI), p, I2 | OR (95%CI), p, I2 | |
| All (9, 10) | 1.12 (0.90, 1.39), 0.32, 43% | 1.42 (0.85, 2.37), 0.18, 0% | 1.19 (0.87, 1.63), 0.28, 0% | 1.53 (0.95, 2.45), 0.08, 59% | 1.16 (0.74, 1.81), 0.52, 0% |
| Ethnicity | |||||
| Caucasian (4,5) | 1.14 (0.82, 1.59), 0.44, 25% | 1.06 (0.43, 2.62), 0.89, 0% | 1.26 (0.79, 2.01), 0.34, 0% | 1.92 (0.76, 4.89), 0.17, 75% | 0.89 (0.47, 1.68), 0.72, 0% |
| Asian (2, 2) | 1.59 (1.05, 2.42), 0.03, 3% * | 1.77 (0.88, 3.58), 0.11 | 1.57 (0.75, 3.27), 0.23, 41% | 1.61 (0.95, 2.74), 0.08, 27% | 1.59 (0.79, 3.20), 0.19 |
| Mixed (3, 3) | 0.77 (0.51, 1.16), 0.21, 40% | 1.17 (0.29, 4.81), 0.83, 0% | 0.97 (0.57, 1.64), 0.91, 0% | 0.97 (0.59, 1.62), 0.92, 0% | 1.14 (0.28, 4.63), 0.86, 0% |
| Control source | |||||
| Hospital-based (6, 7) | 1.06 (0.79, 1.42), 0.68, 49% | 1.28 (0.50, 3.28), 0.61, 0% | 1.20 (0.84, 1.71), 0.32, 9% | 1.67 (0.89, 3.13), 0.11, 0.69% | 1.20 (0.47, 3.07), 0.70, 0% |
| Population-based (3, 3) | 1.20 (0.86, 1.68), 0.29, 50% | 1.48 (0.80, 2.74), 0.21, 39% | 1.17 (0.58, 2.36), 0.66, 0% | 1.33 (0.80, 2.21), 0.28, 6% | 1.14 (0.69, 1.90), 0.60, 37% |
| Disease form | |||||
| Peri-implantitis (4, 5) | 1.19 (0.90, 1.59), 0.22, 25% | 1.39 (0.80, 2.42), 0.25, 0% | 1.06 (0.68, 1.65), 0.81, 0% | 1.60 (0.77, 3.35), 0.21, 75% | 1.13 (0.71, 1.81), 0.60, 0% |
| Implant failure (4, 4) | 0.98 (0.53, 1.83), 0.96, 57% | 1.63 (0.41, 6.40), 0.48, 0% | 1.22 (0.76, 1.96), 0.41, 17% | 1.20 (0.75, 1.91), 0.44, 26% | 1.39 (0.36, 5.39), 0.63, 0% |
| Marginal bone loss (1, 1) | 3.27 (0.76, 14.04), 0.11 | - | 3.83 (0.81, 18.09), 0.09 | 3.83 (0.81, 18.09), 0.09 | - |
| Number of individuals | |||||
| >100 (5, 5) | 1.05 (0.71, 1.56), 0.81, 60% | 1.32 (0.76, 2.28), 0.32, 0% | 1.14 (0.80, 1.63), 0.46, 0% | 1.19 (0.87, 1.63), 0.28, 0% | 1.09 (0.68, 1.73), 0.73, 0% |
| ≤100 (4, 5) | 1.37 (0.82, 2.28), 0.23, 8% | 2.46 (0.51, 11.85), 0.26, 0% | 1.39 (0.70, 2.77), 0.34, 27% | 2.37 (0.80, 7.03), 0.12, 68% | 2.18 (0.47, 10.06), 0.32, 0% |
| Polymorphism (N, N′) | Allelic | Homozygous | Heterozygous | Recessive | Dominant |
|---|---|---|---|---|---|
| OR (95%CI), p, I2 | OR (95%CI), p, I2 | OR (95%CI), p, I2 | OR (95%CI), p, I2 | OR (95%CI), p, I2 | |
| TNF-α (−308 G > A) (6, 7) | 1.02 (0.62, 1.66), 0.95, 54% | 0.95 (0.39, 2.35), 0.92, 0% | 1.24 (0.82, 1.85), 0.31, 12% | 1.61 (0.78, 3.32), 0.20, 70% | 0.84 (0.45, 1.60), 0.60, 0% |
| IL-10 (−819 C > T) (2) | 1.47 (0.82, 2.64), 0.19, 67% | 3.84 (0.30, 48.54), 0.30, 80% | 1.22 (0.78, 1.89), 0.38, 0% | 1.40 (0.92, 2.12), 0.11, 40% | 3.43 (0.30, 38.86), 0.32, 79% |
| Variable | A vs. G | AA vs. GG | GA vs. GG | AA + GA vs. GG | AA vs. GG + GA | |
|---|---|---|---|---|---|---|
| Year of publication | R | 0.211 | 0.522 | 0.272 | 0.075 | 0.585 |
| Adjusted R2 | −0.092 | 0.127 | −0.058 | −0.119 | 0.210 | |
| p-value | 0.586 | 0.229 | 0.479 | 0.837 | 0.168 | |
| Number of individuals | R | 0.272 | 0.558 | 0.472 | 0.337 | 0.566 |
| Adjusted R2 | −0.058 | 0.173 | 0.112 | 0.003 | 0.185 | |
| p-value | 0.479 | 0.193 | 0.200 | 0.341 | 0.185 |
Publisher’s Note: MDPI stays neutral with regard to jurisdictional claims in published maps and institutional affiliations. |
© 2021 by the authors. Licensee MDPI, Basel, Switzerland. This article is an open access article distributed under the terms and conditions of the Creative Commons Attribution (CC BY) license (https://creativecommons.org/licenses/by/4.0/).
Share and Cite
Jamshidy, L.; Tadakamadla, S.K.; Choubsaz, P.; Sadeghi, M.; Tadakamadla, J. Association of IL-10 and TNF-α Polymorphisms with Dental Peri-Implant Disease Risk: A Meta-Analysis, Meta-Regression, and Trial Sequential Analysis. Int. J. Environ. Res. Public Health 2021, 18, 7697. https://doi.org/10.3390/ijerph18147697
Jamshidy L, Tadakamadla SK, Choubsaz P, Sadeghi M, Tadakamadla J. Association of IL-10 and TNF-α Polymorphisms with Dental Peri-Implant Disease Risk: A Meta-Analysis, Meta-Regression, and Trial Sequential Analysis. International Journal of Environmental Research and Public Health. 2021; 18(14):7697. https://doi.org/10.3390/ijerph18147697
Chicago/Turabian StyleJamshidy, Ladan, Santosh Kumar Tadakamadla, Parsia Choubsaz, Masoud Sadeghi, and Jyothi Tadakamadla. 2021. "Association of IL-10 and TNF-α Polymorphisms with Dental Peri-Implant Disease Risk: A Meta-Analysis, Meta-Regression, and Trial Sequential Analysis" International Journal of Environmental Research and Public Health 18, no. 14: 7697. https://doi.org/10.3390/ijerph18147697
APA StyleJamshidy, L., Tadakamadla, S. K., Choubsaz, P., Sadeghi, M., & Tadakamadla, J. (2021). Association of IL-10 and TNF-α Polymorphisms with Dental Peri-Implant Disease Risk: A Meta-Analysis, Meta-Regression, and Trial Sequential Analysis. International Journal of Environmental Research and Public Health, 18(14), 7697. https://doi.org/10.3390/ijerph18147697