
Identification of Groundwater Pollution Characteristics and Health Risk Assessment of a Landfill in a Low Permeability Area


Abstract
:1. Introduction
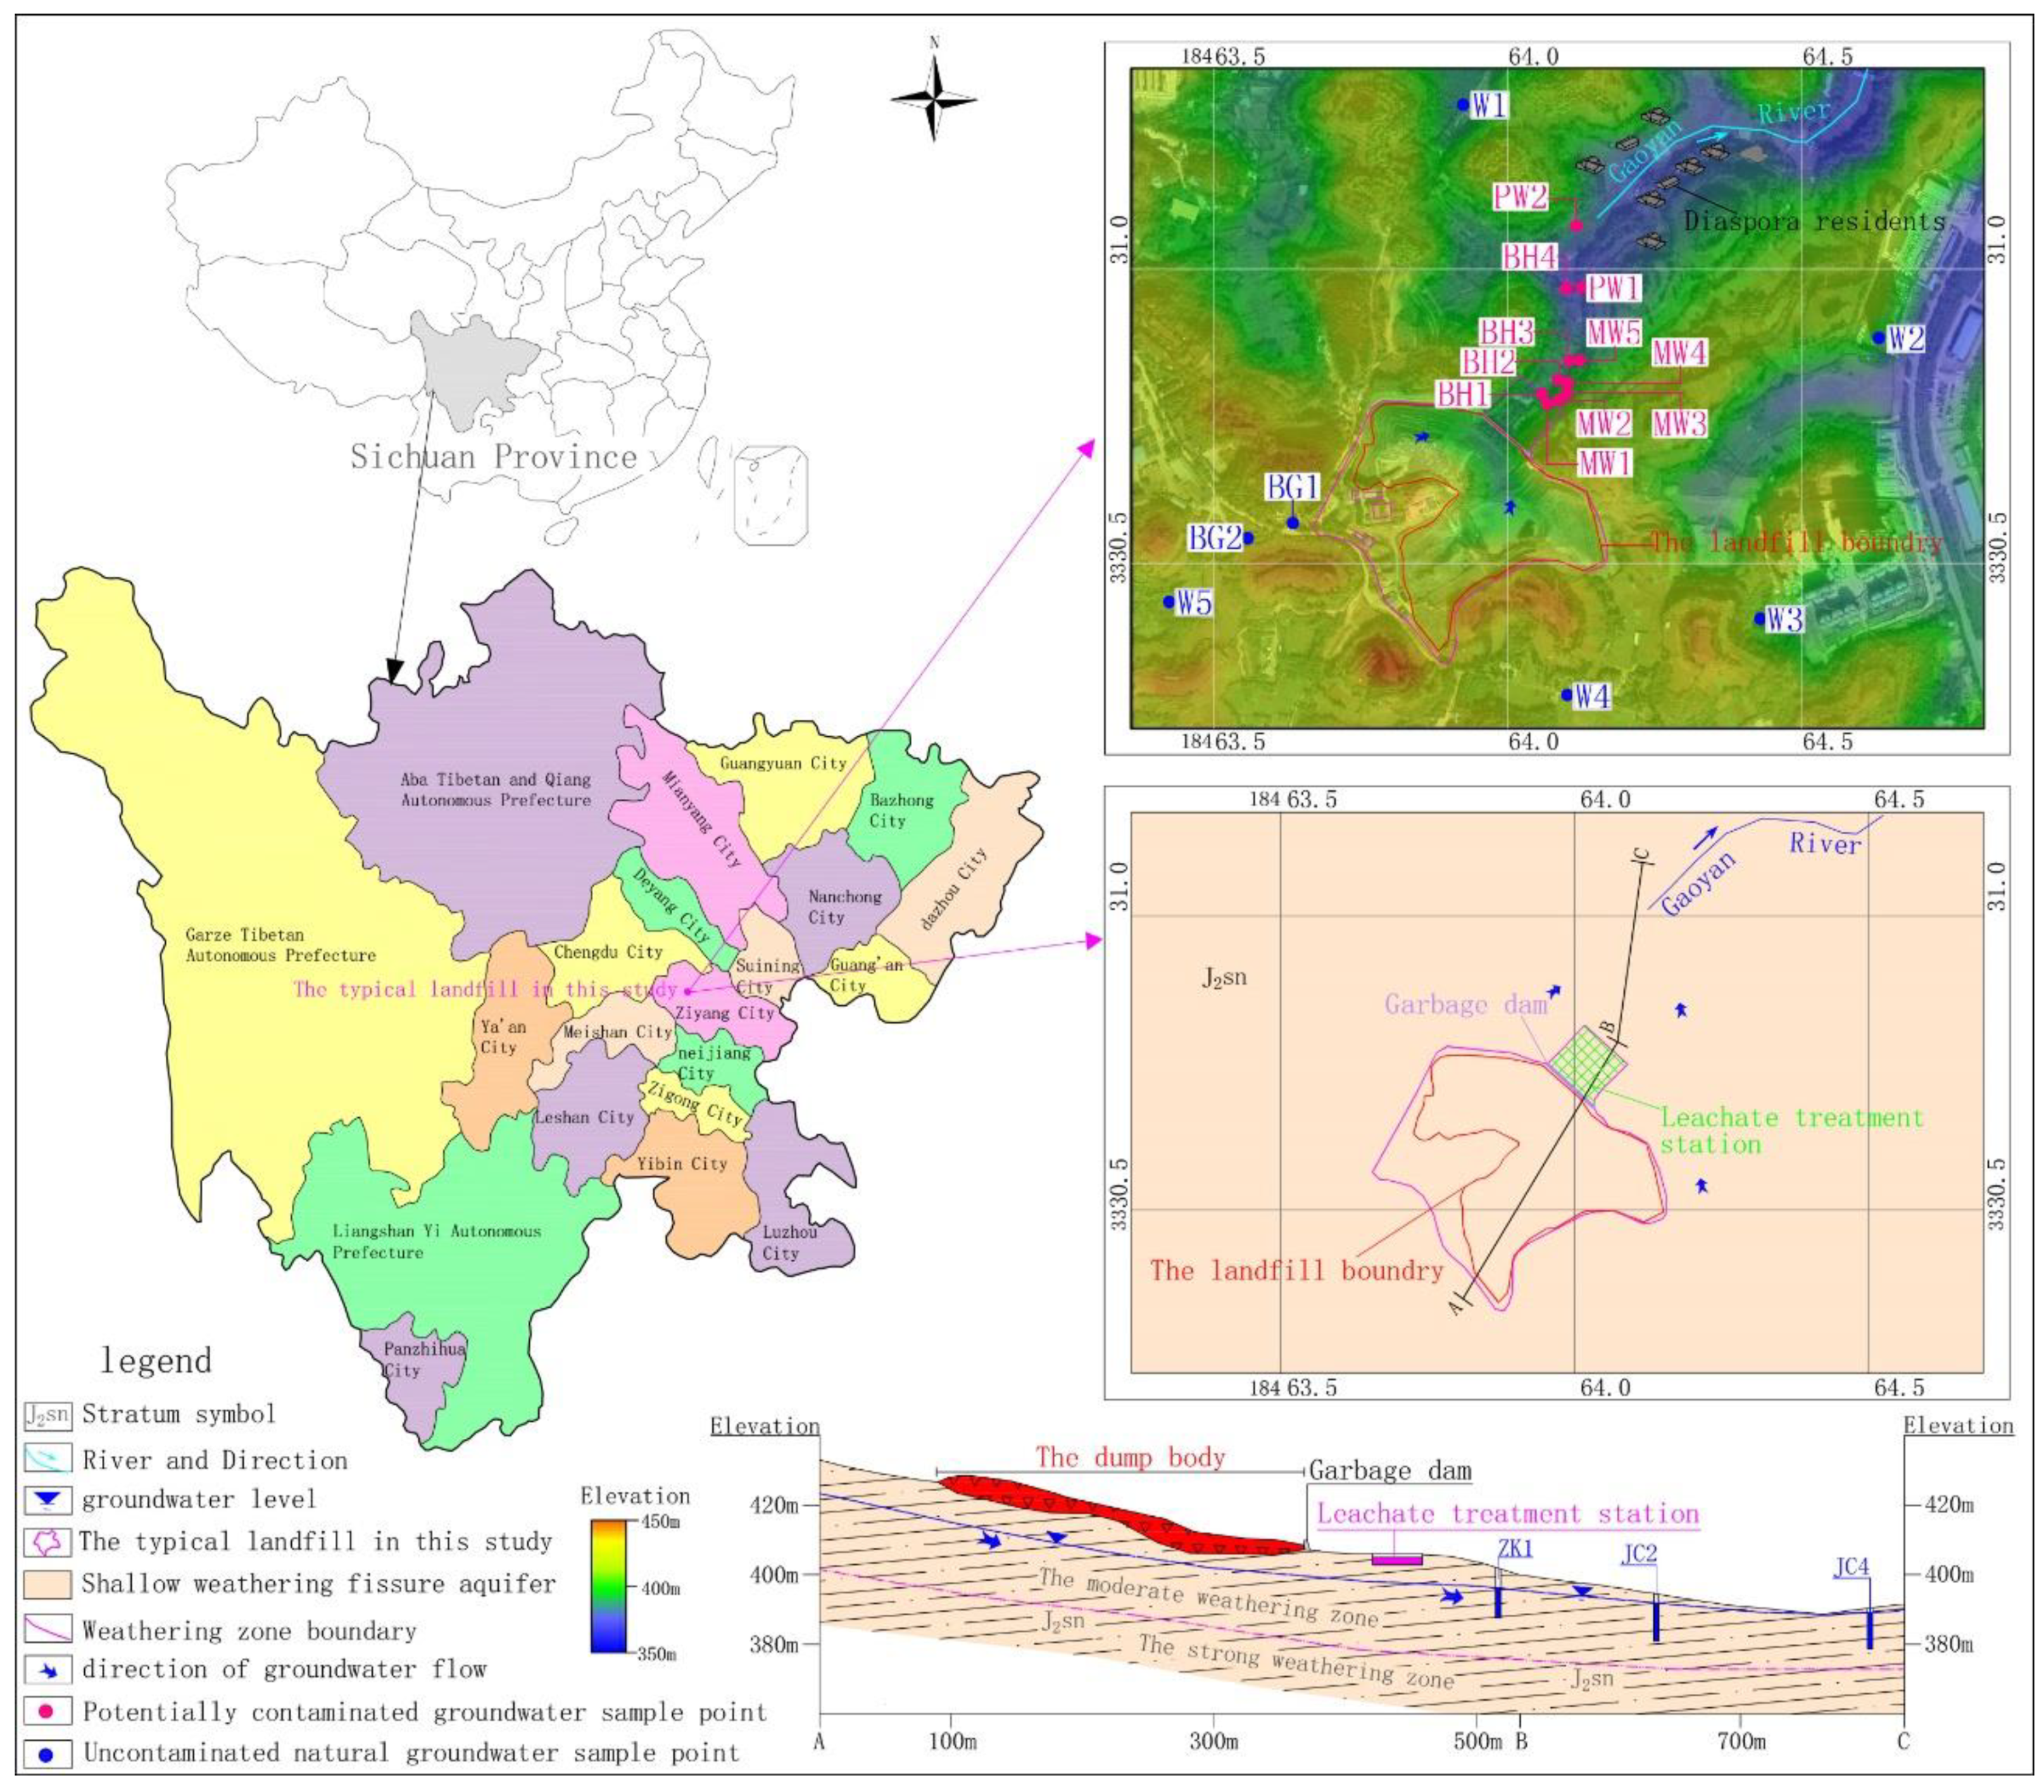
2. Study Area
2.1. Location and Meteorology
2.2. Hydrogeology
3. Materials and Methods
3.1. Sampling and Laboratory Analysis
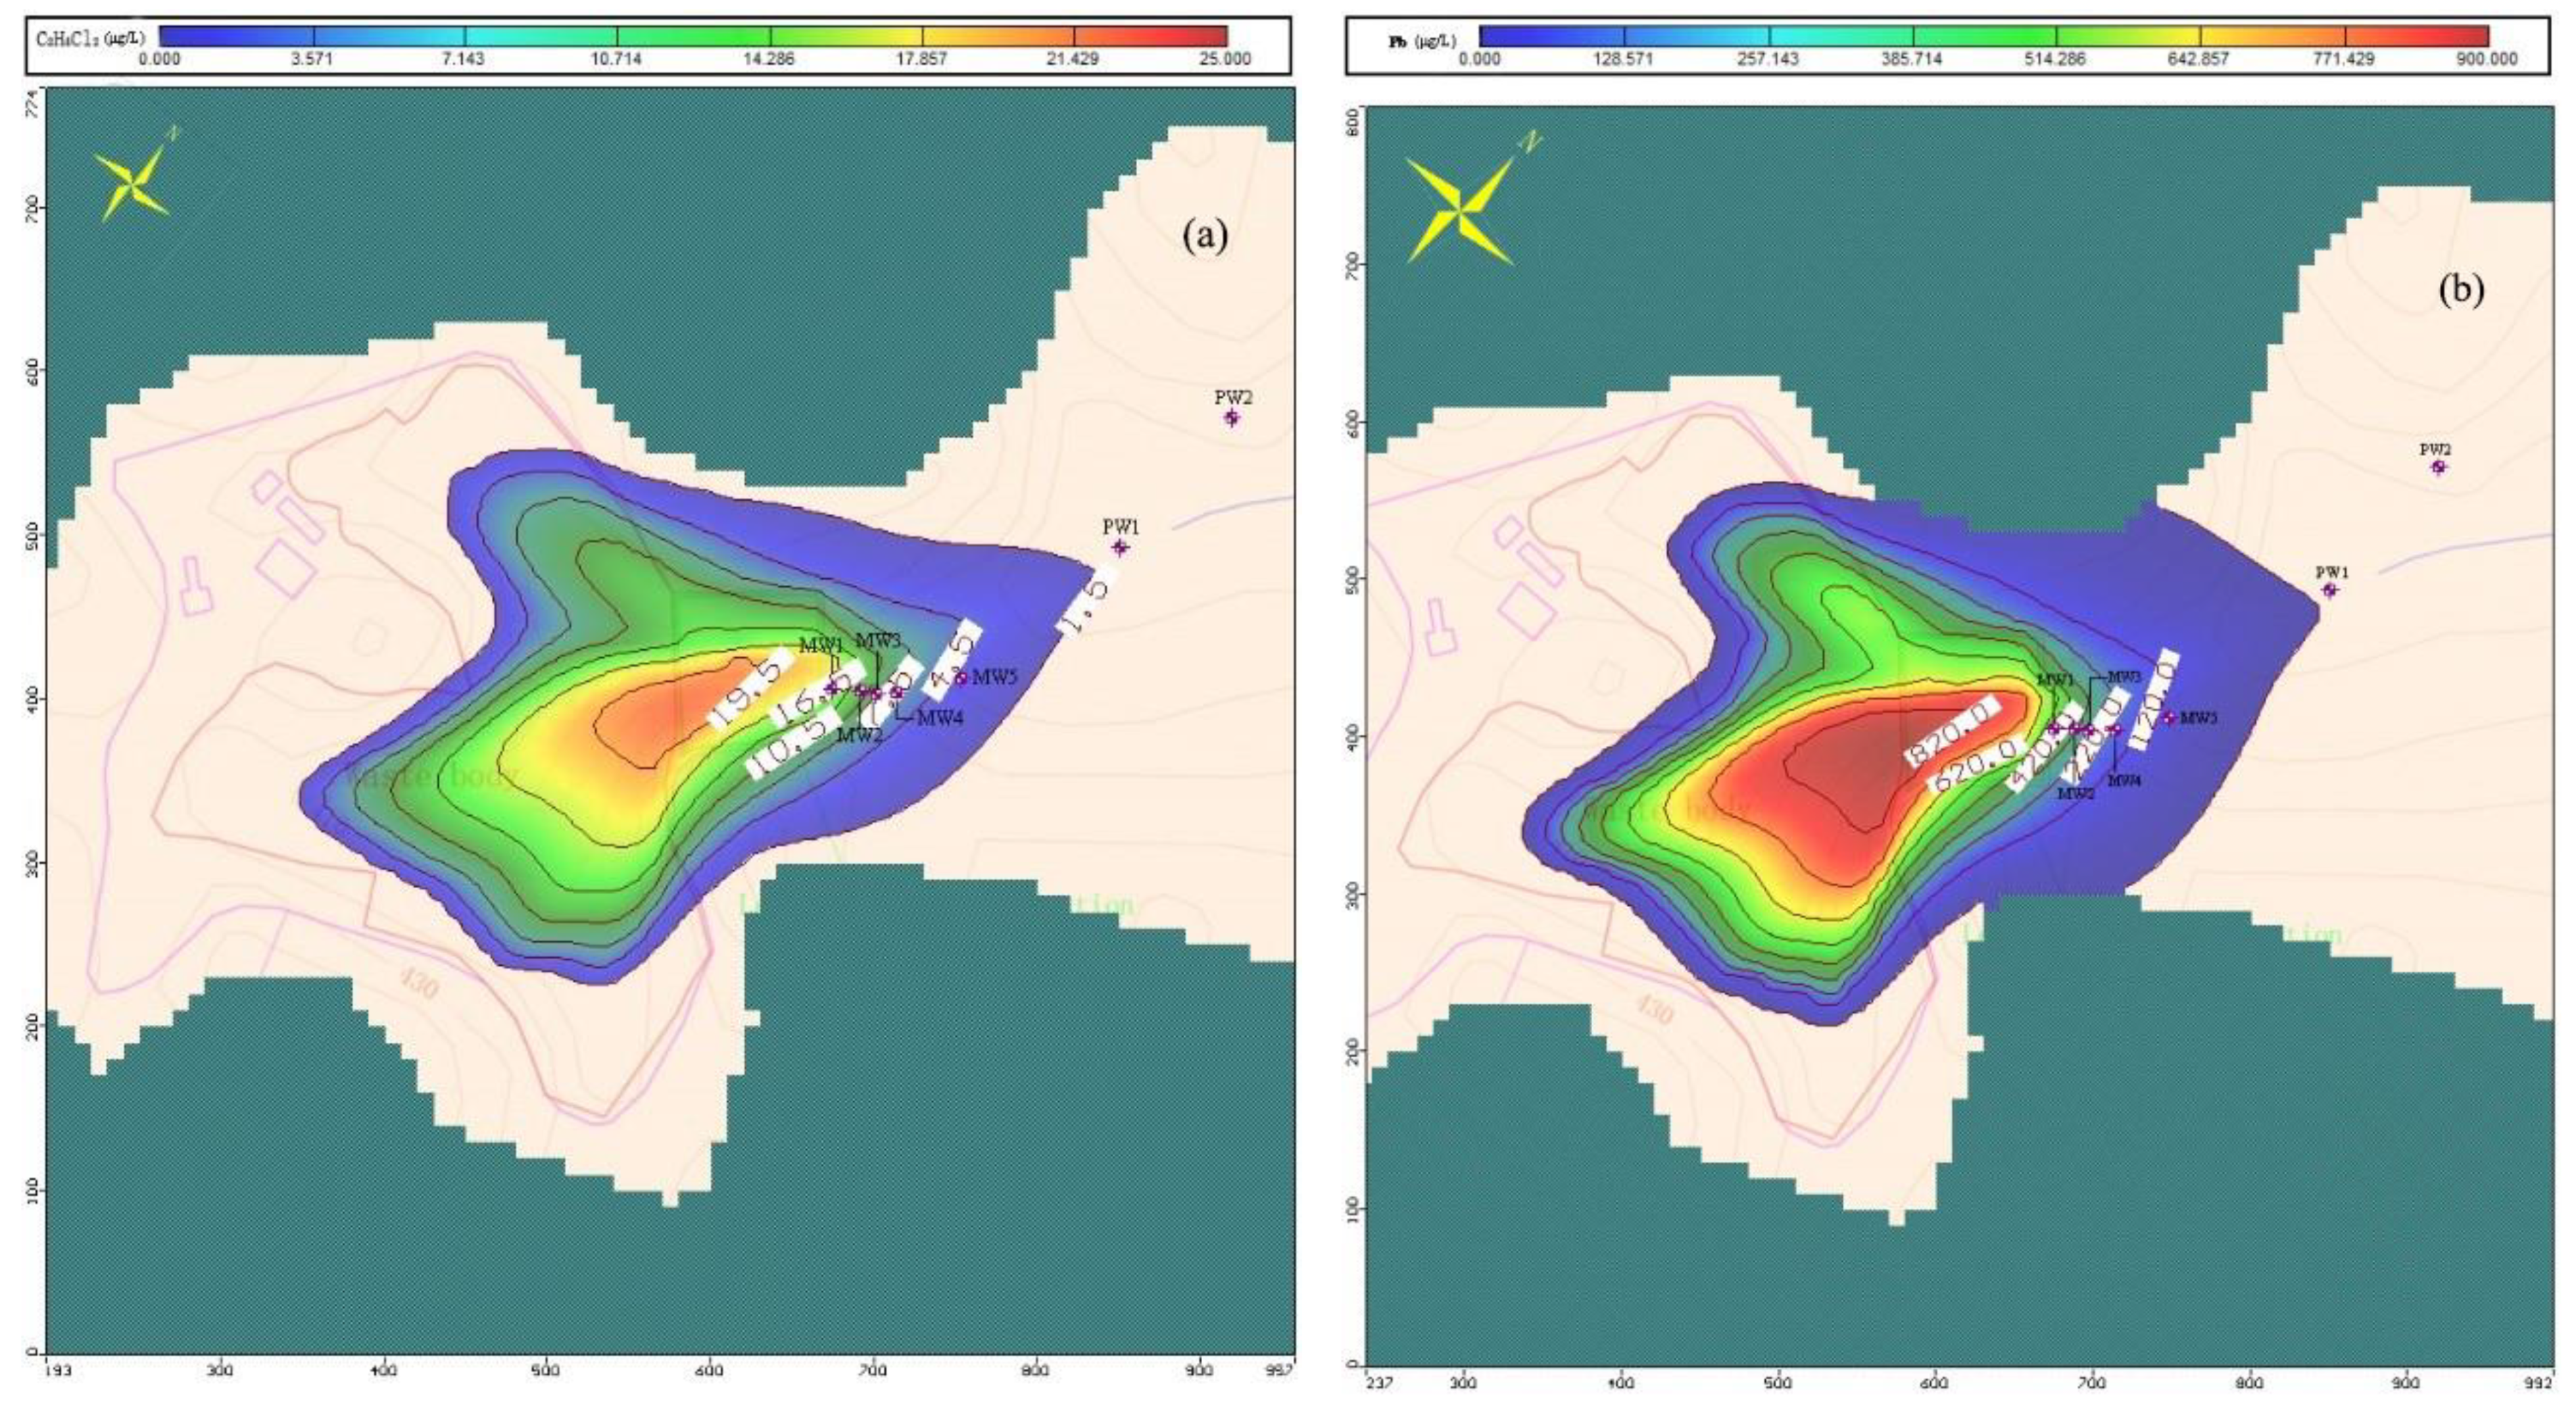
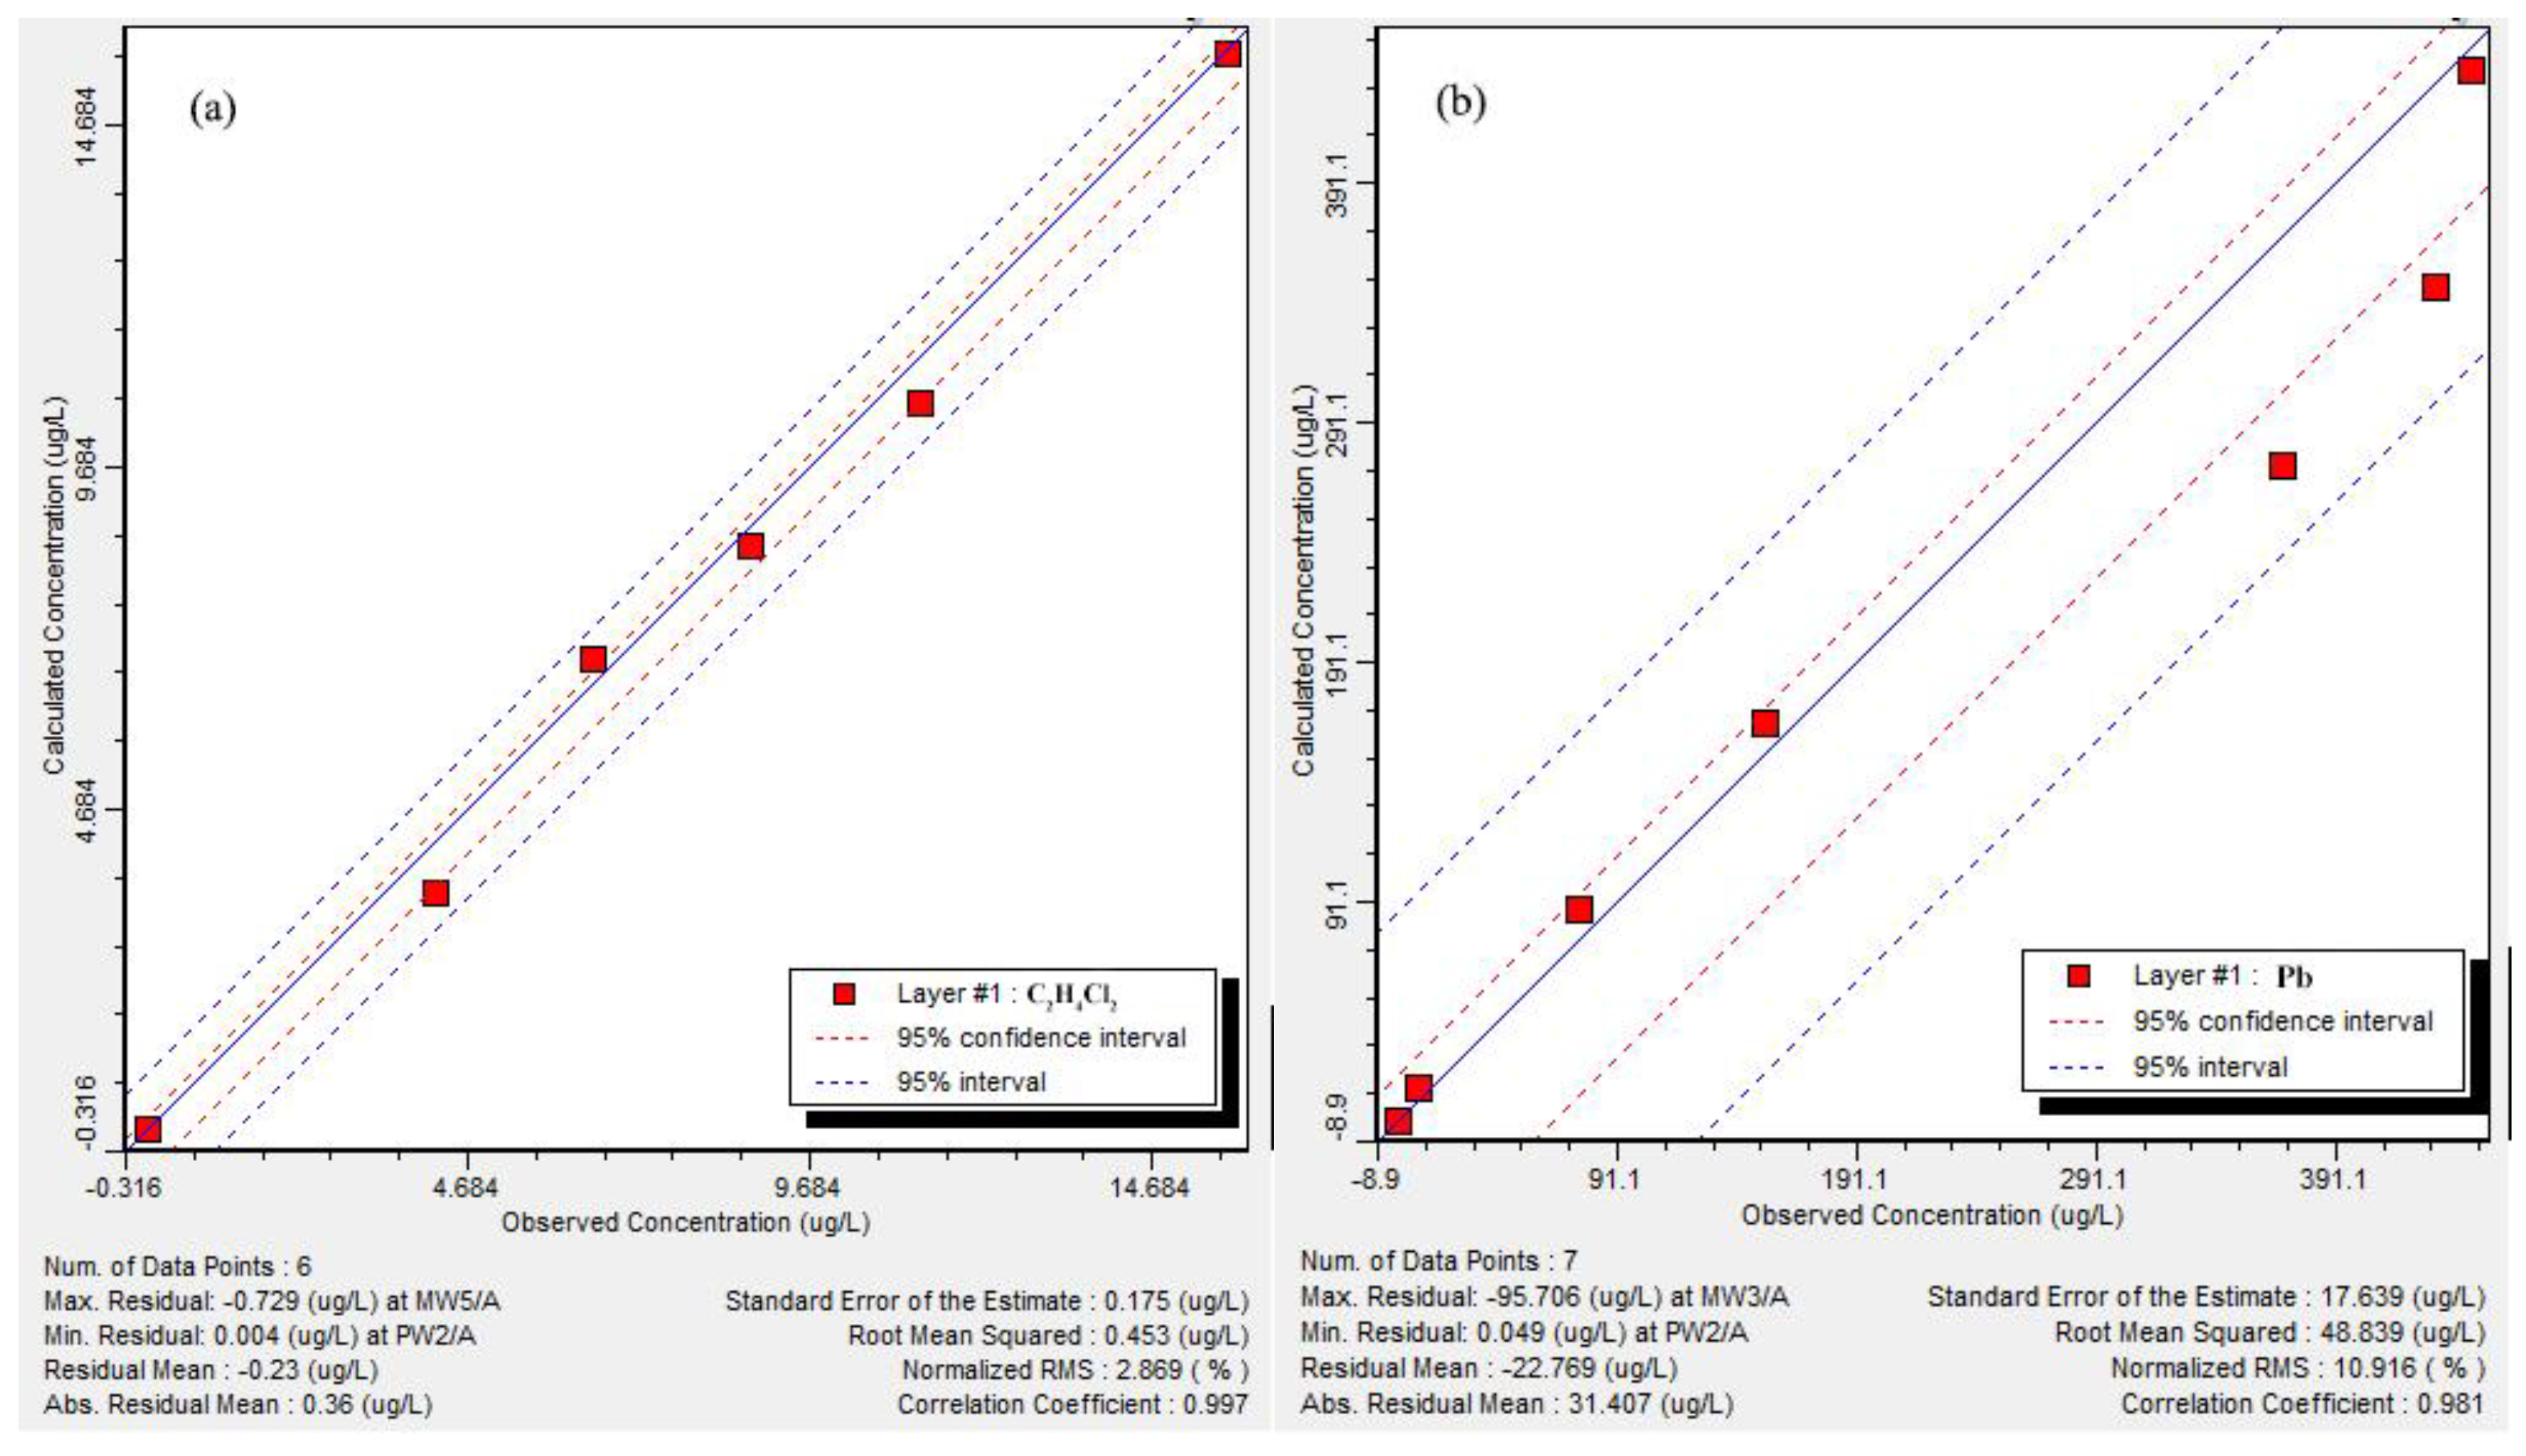
3.2. Simulation of Pollutants Spatial Distribution
3.3. Risk Assessment
4. Results
5. Discussion
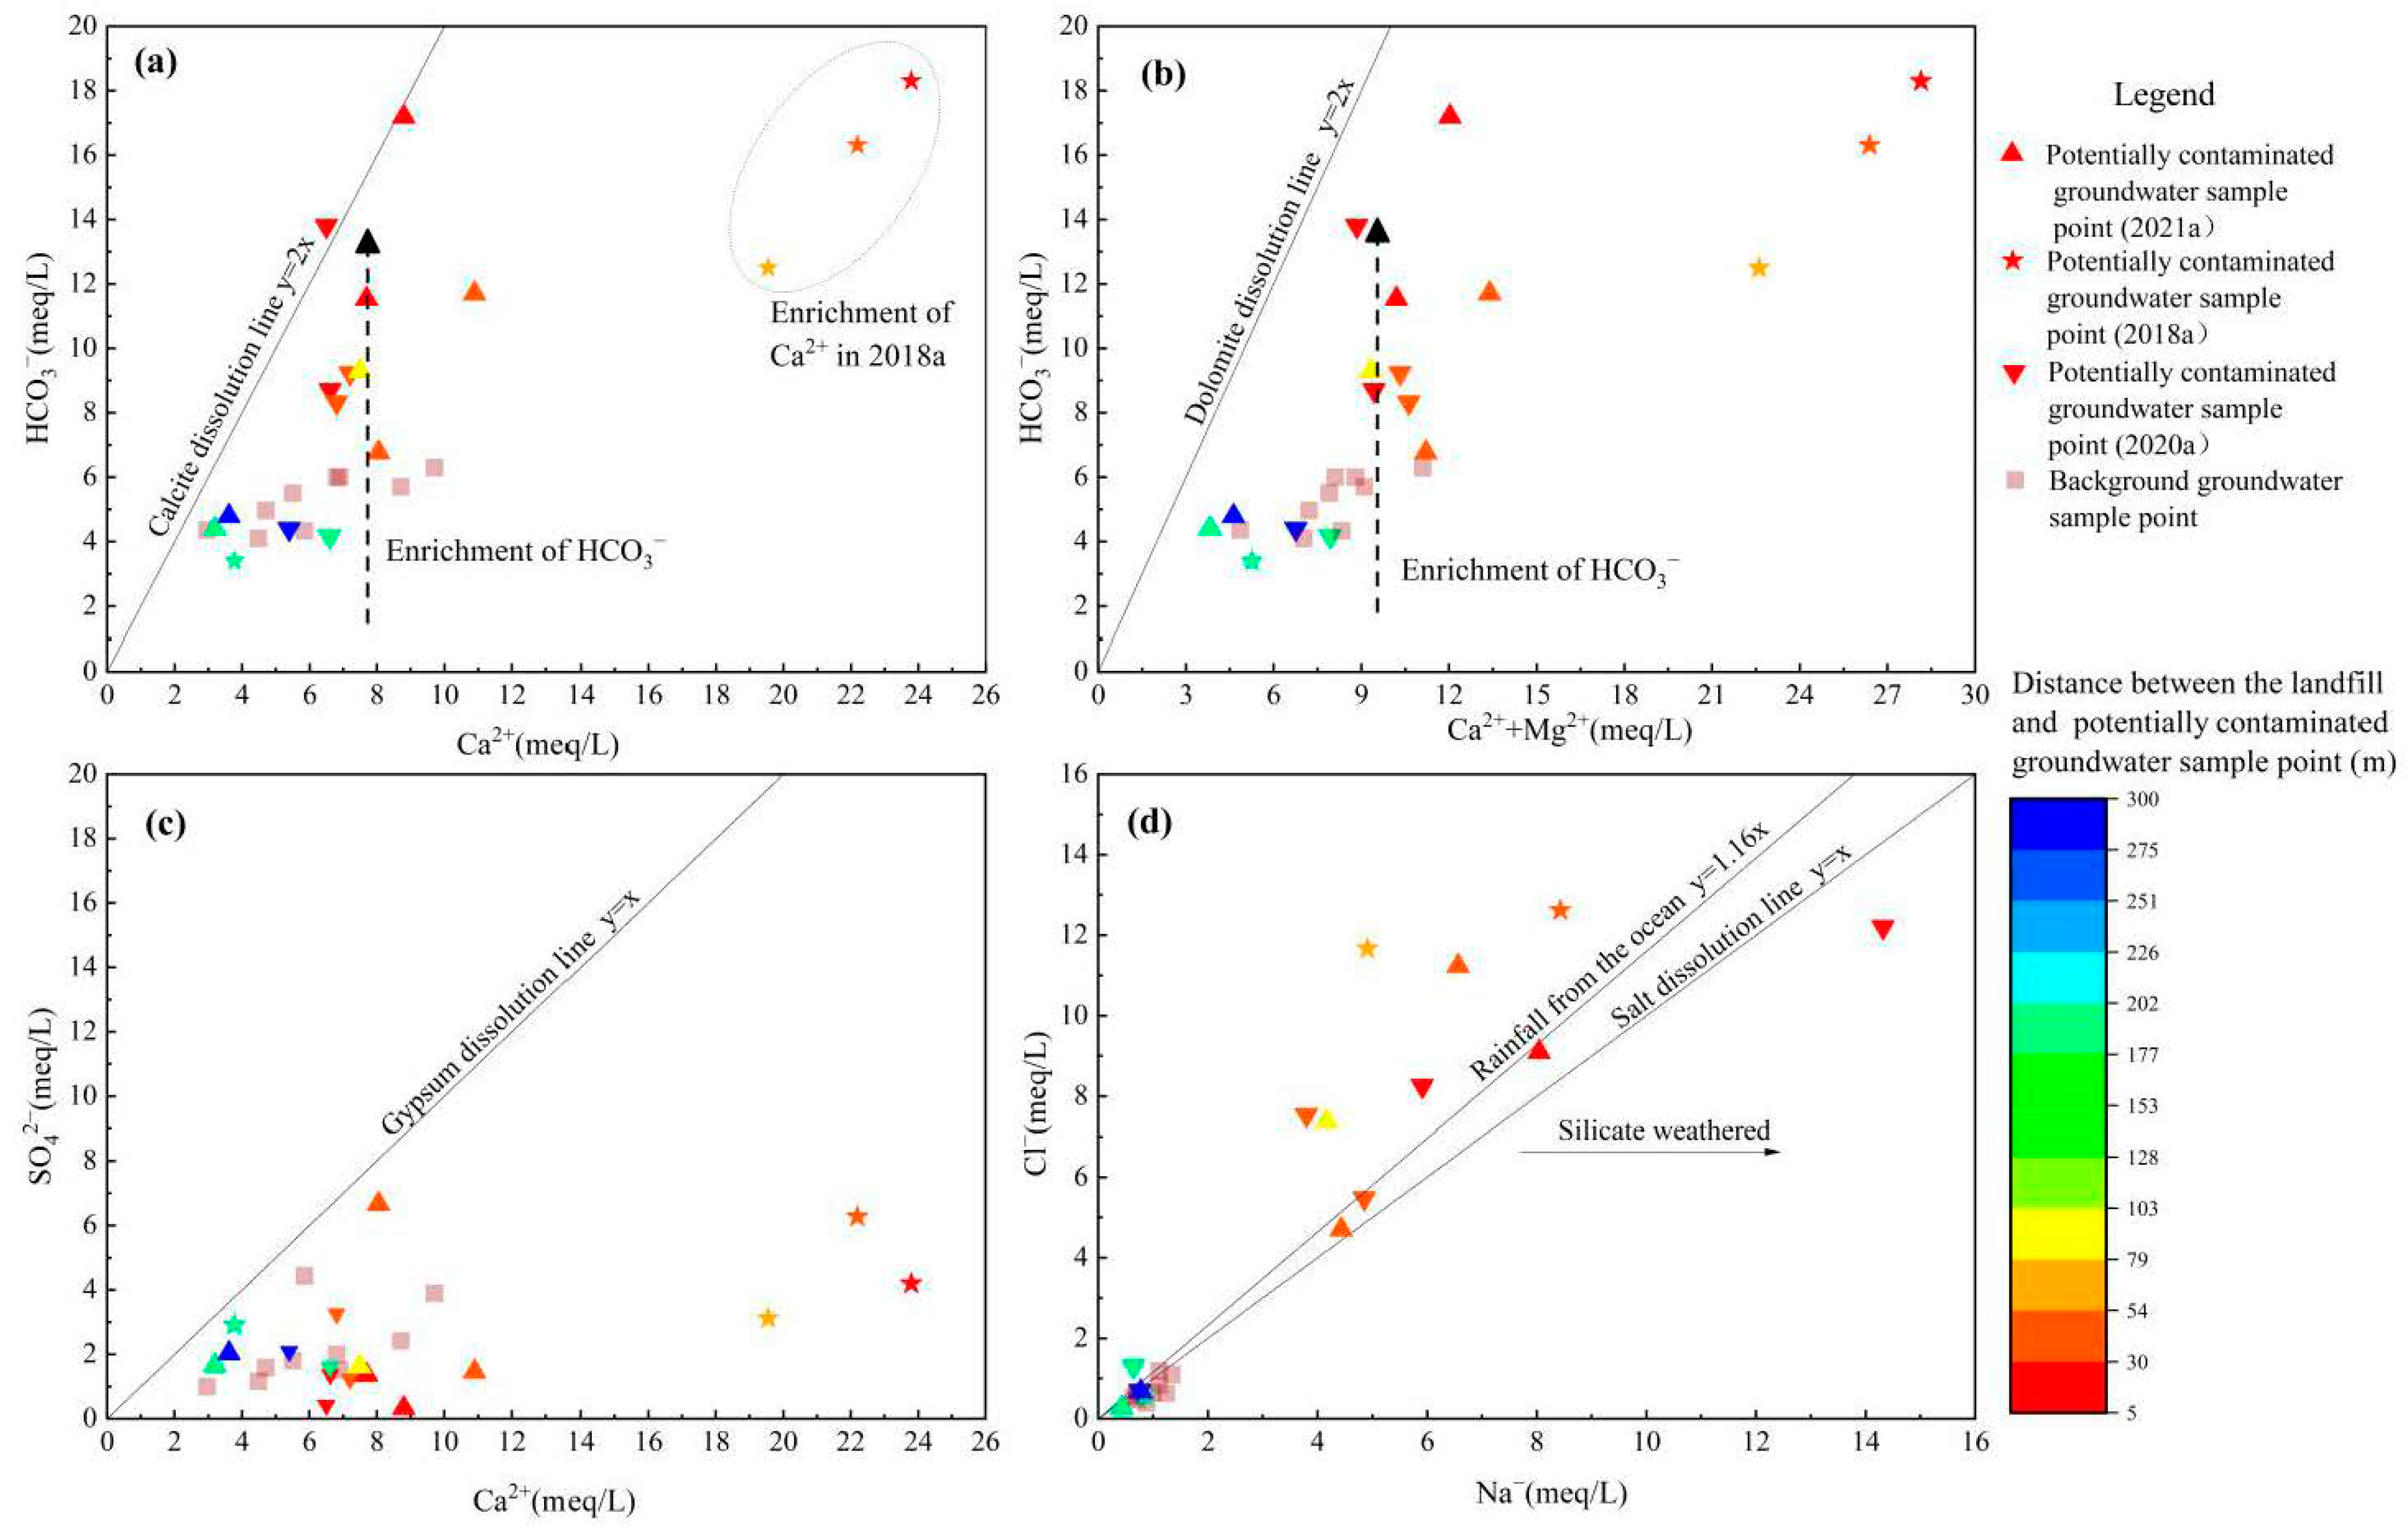
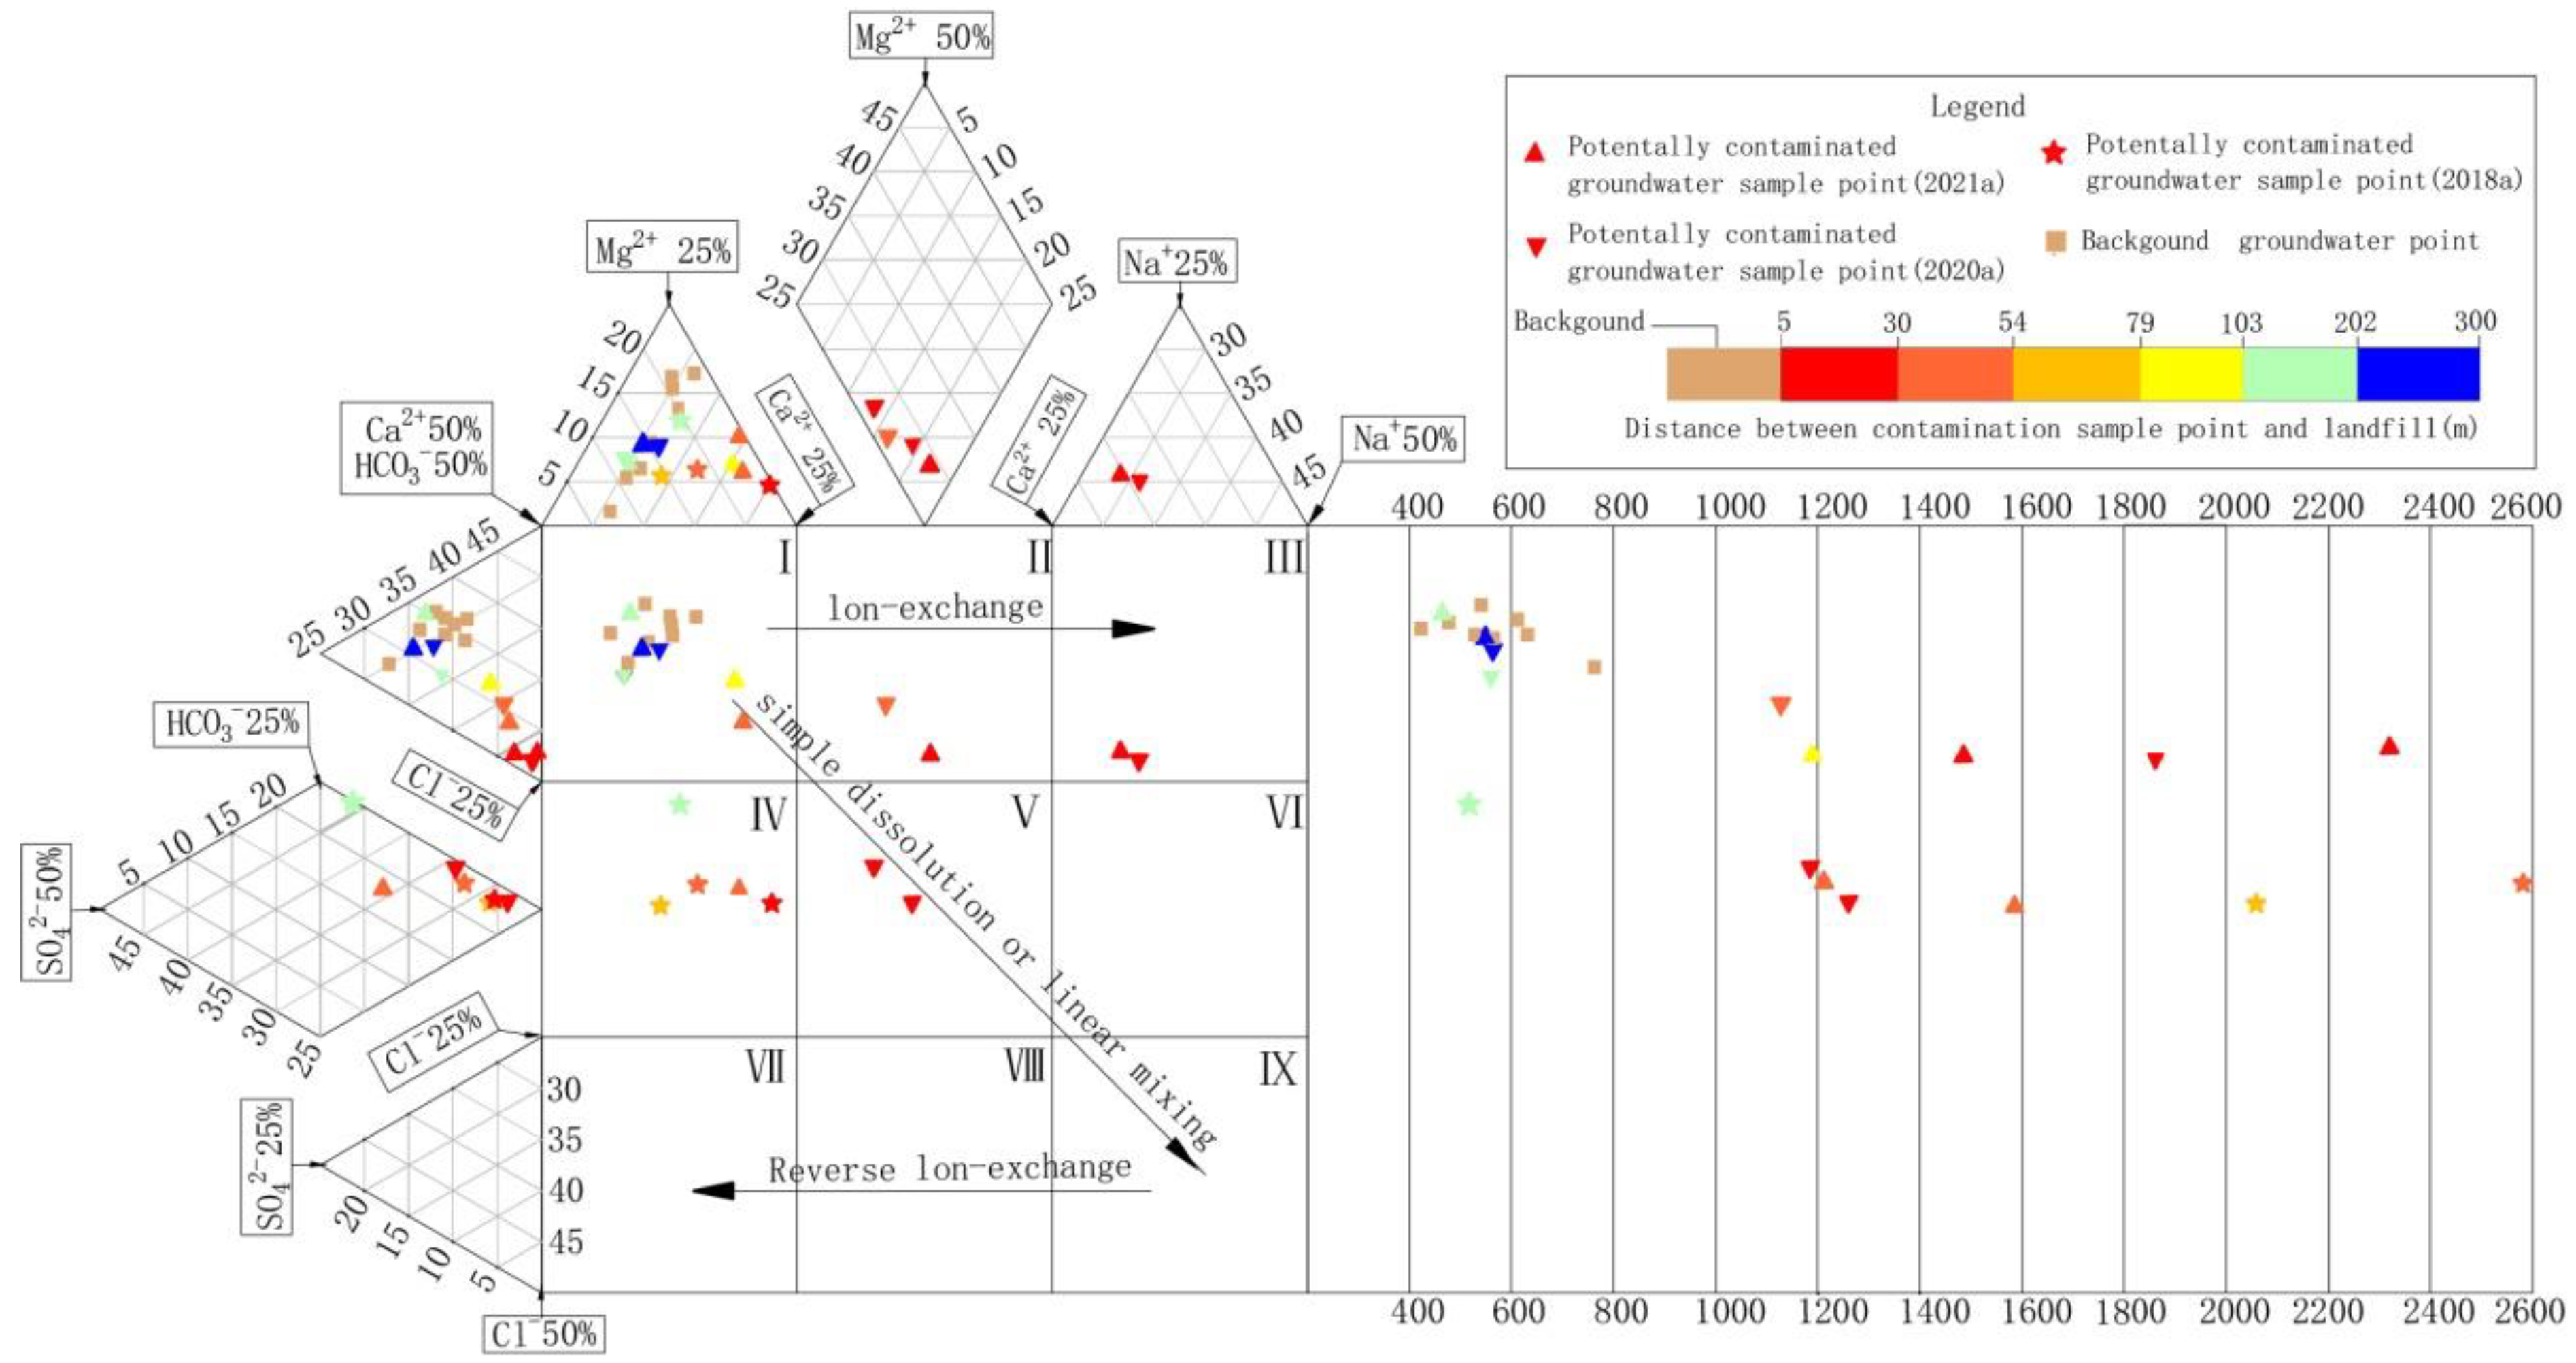
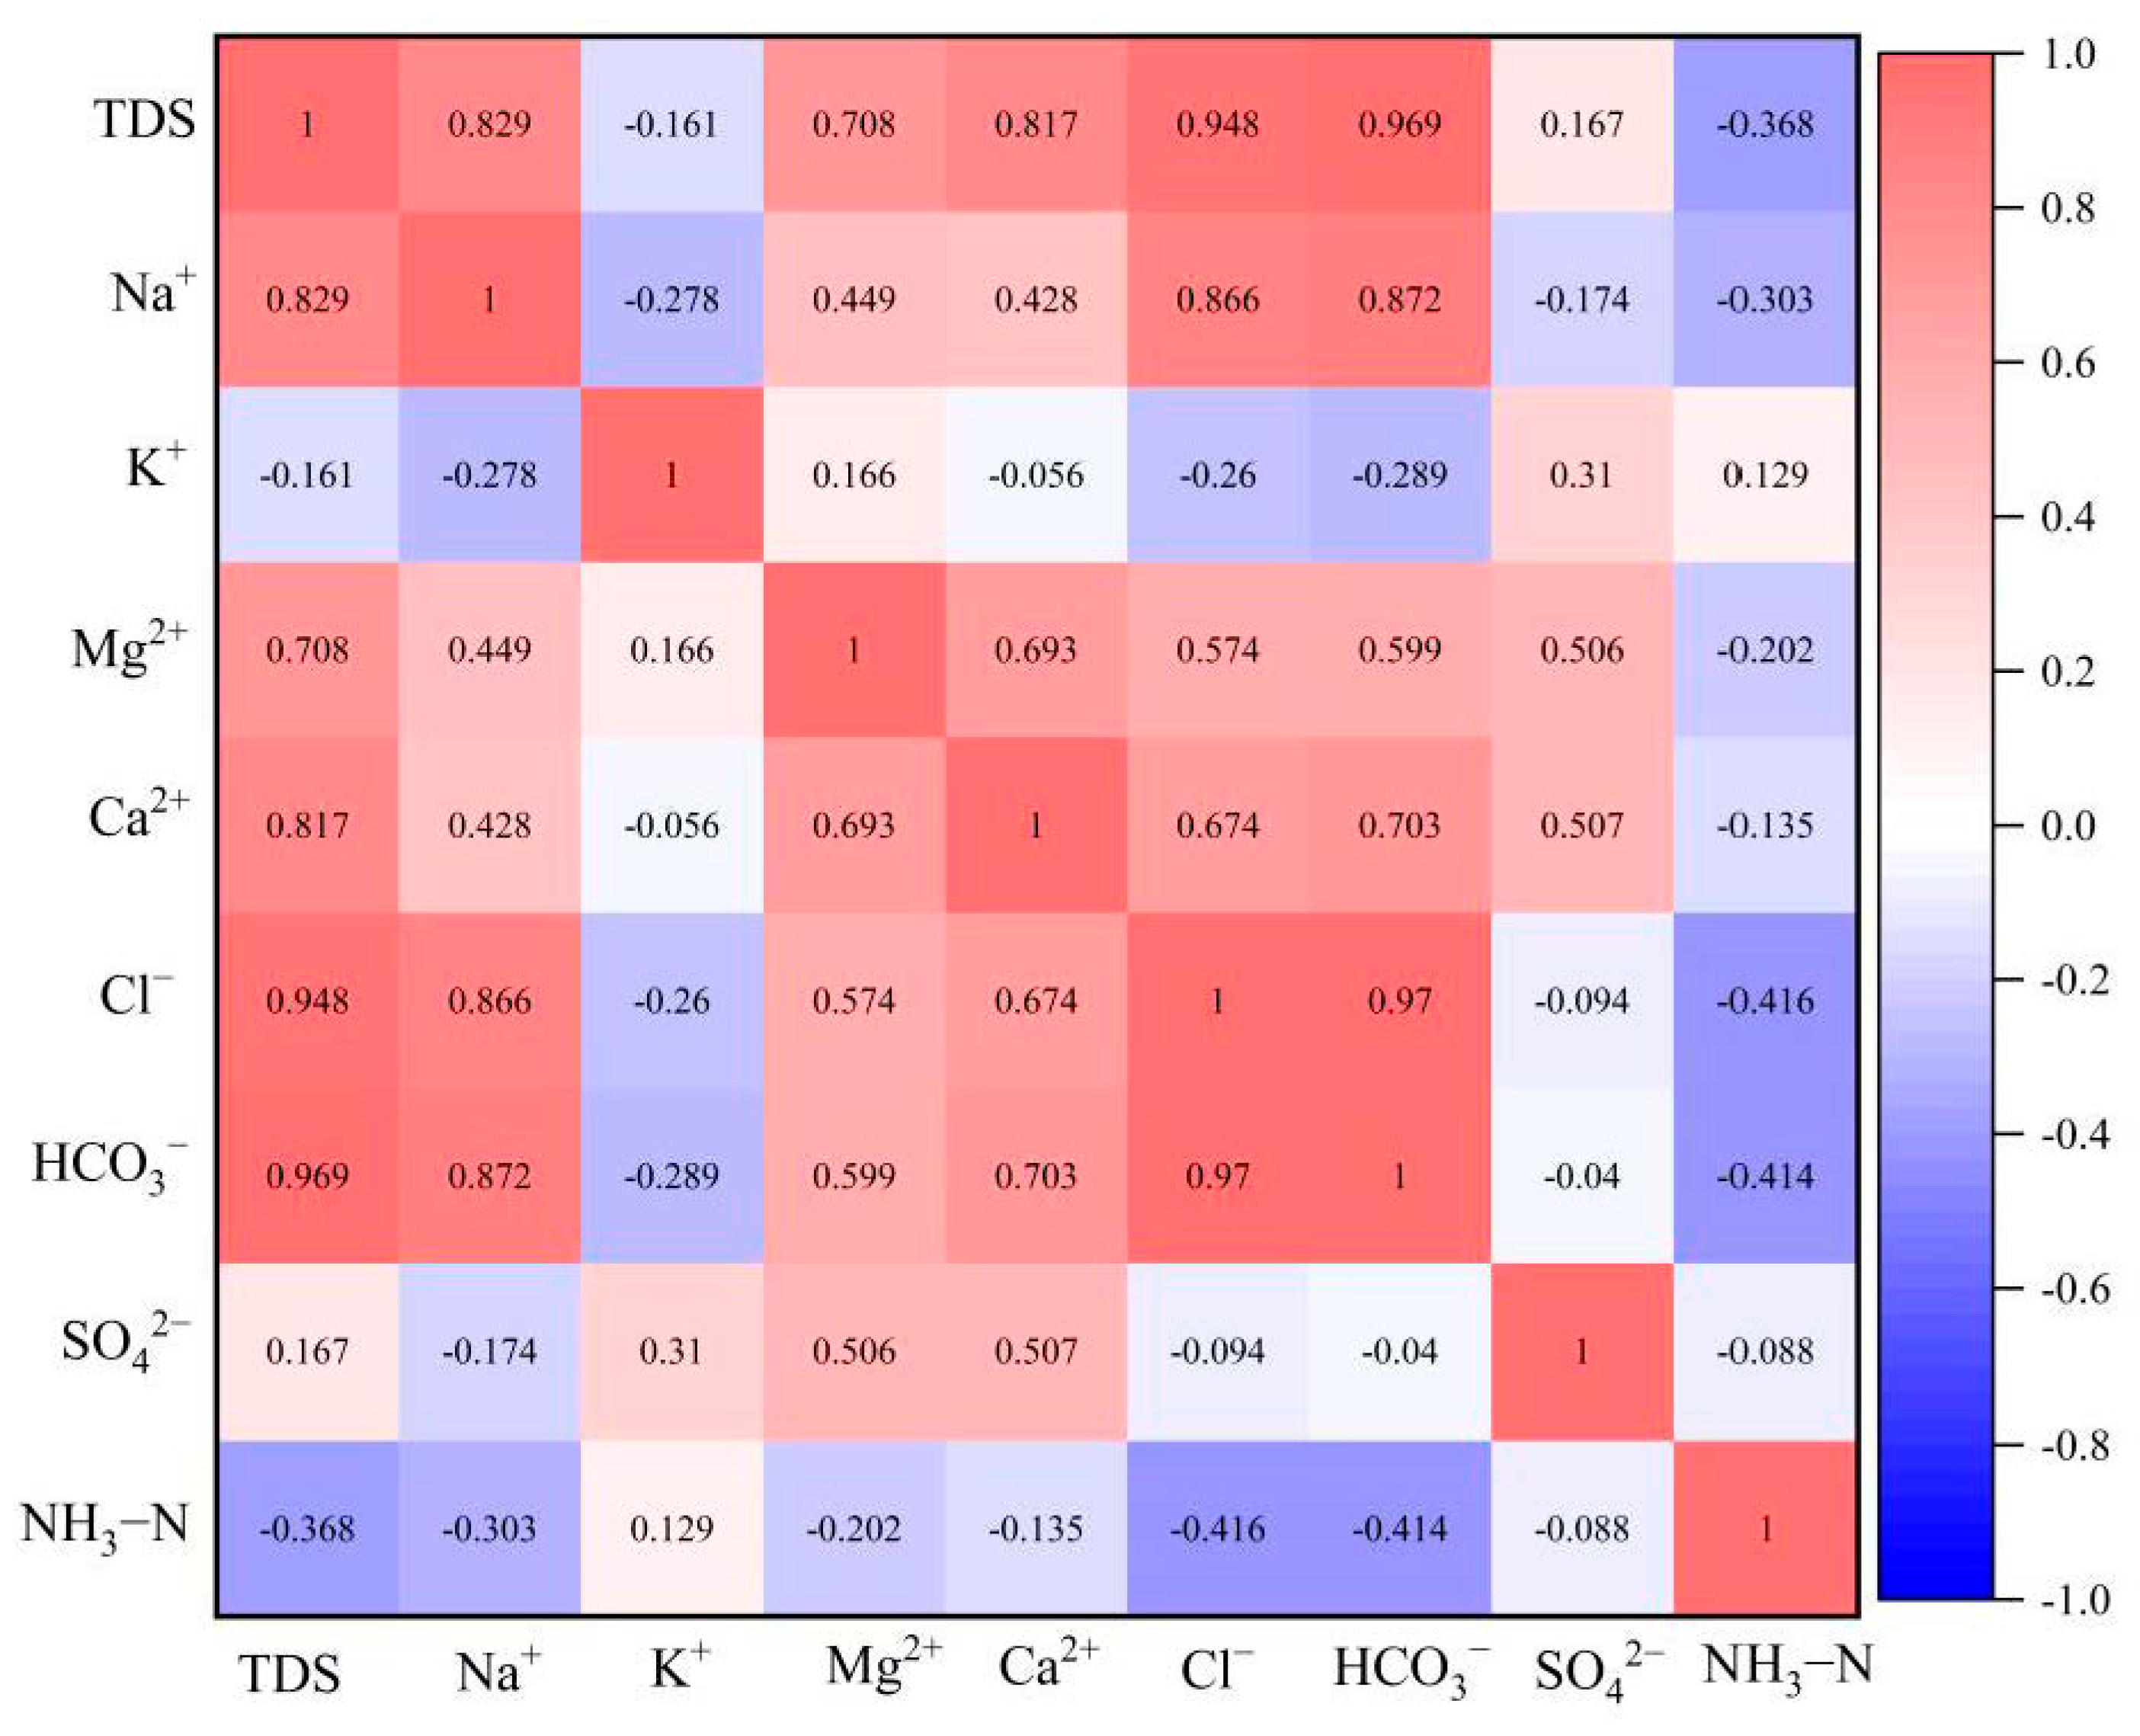
5.1. Hydrogeochemical Characteristics
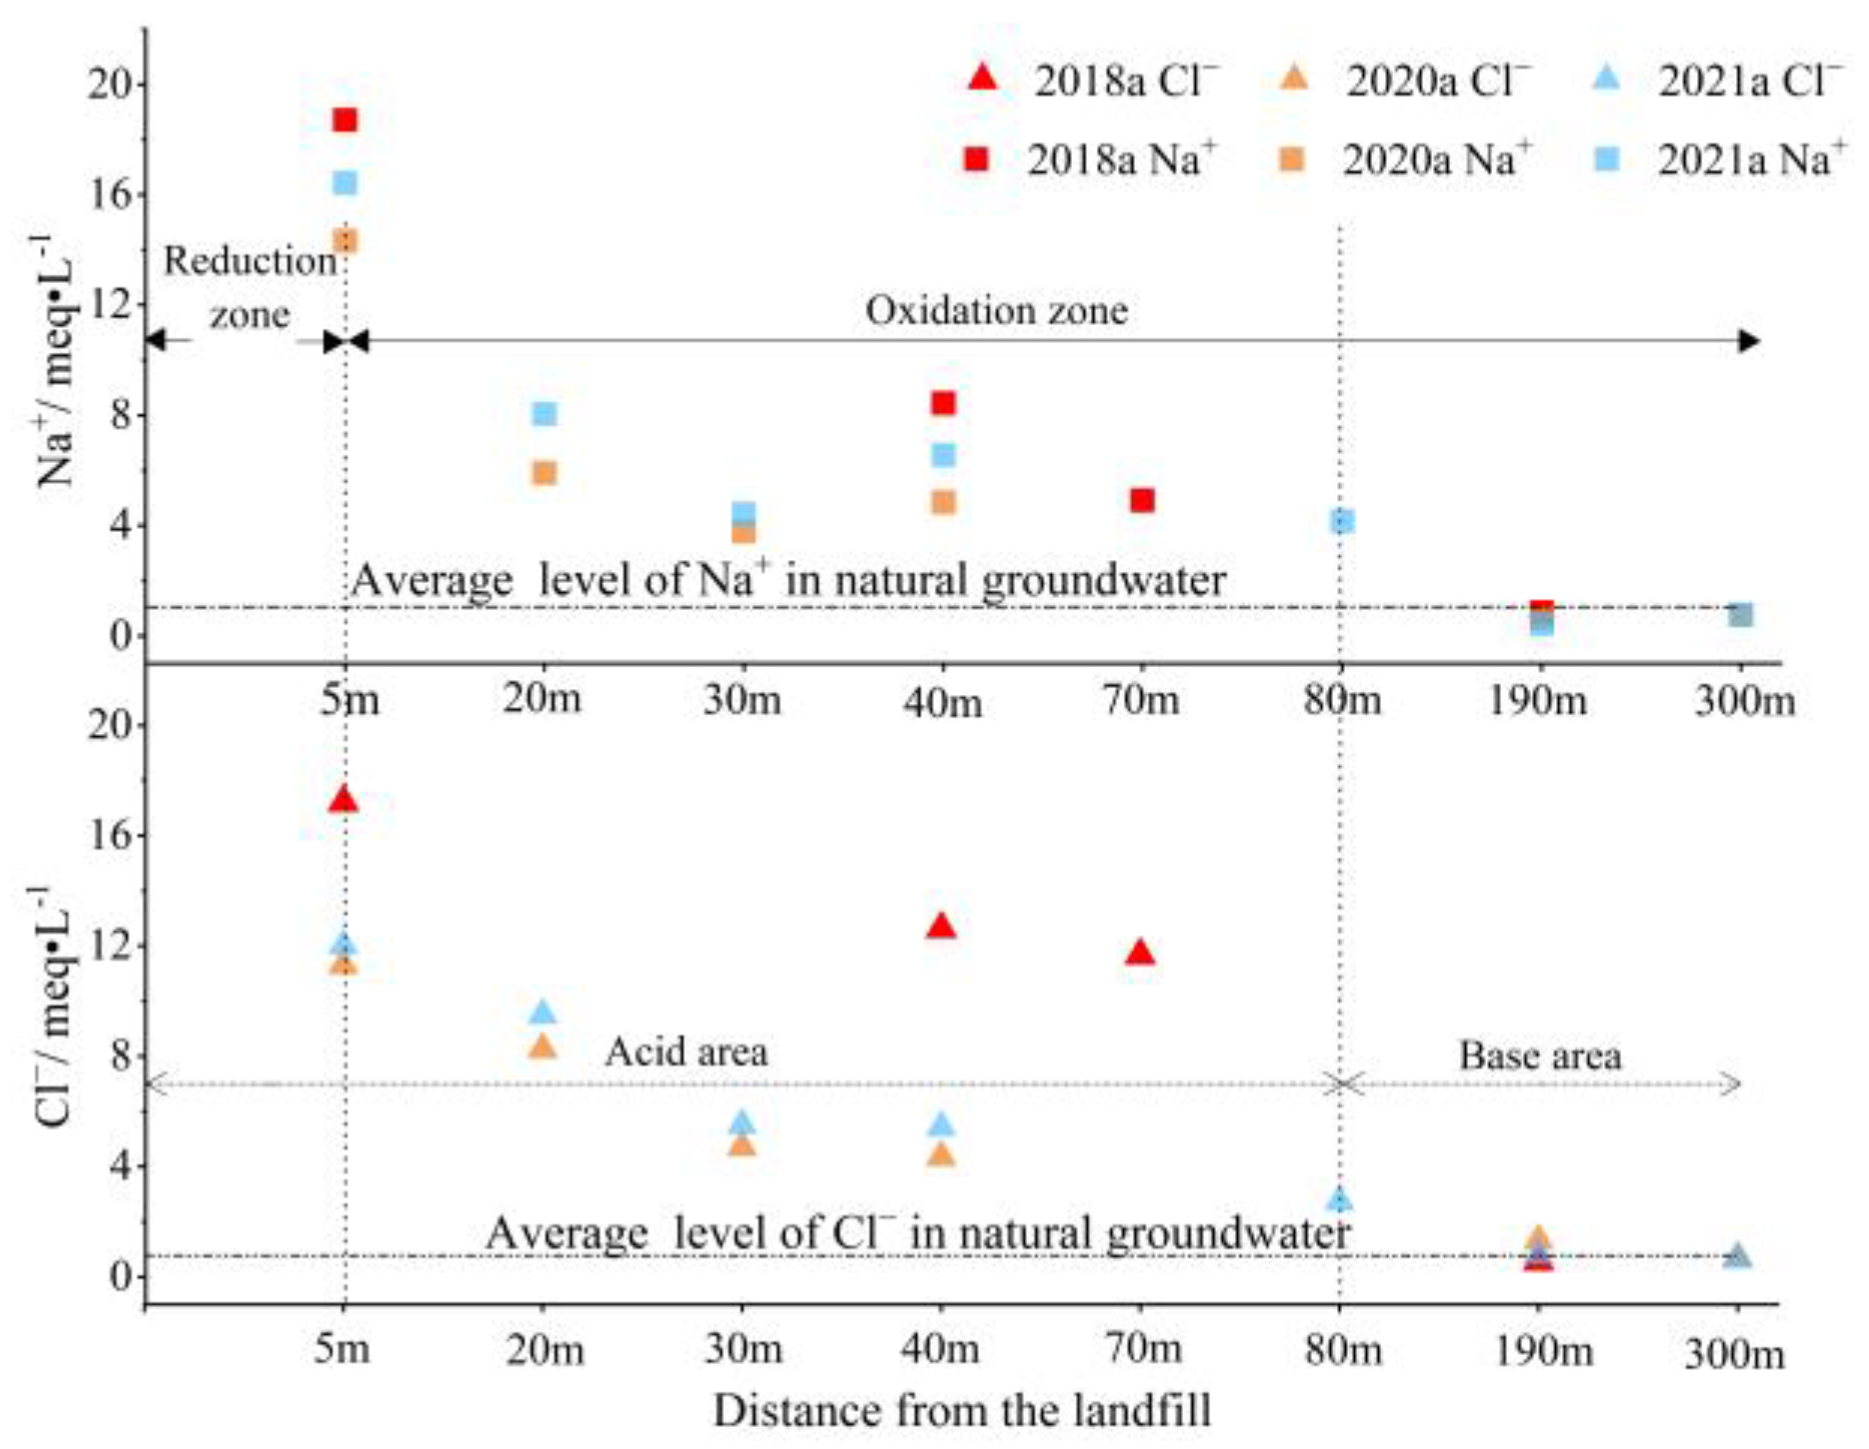
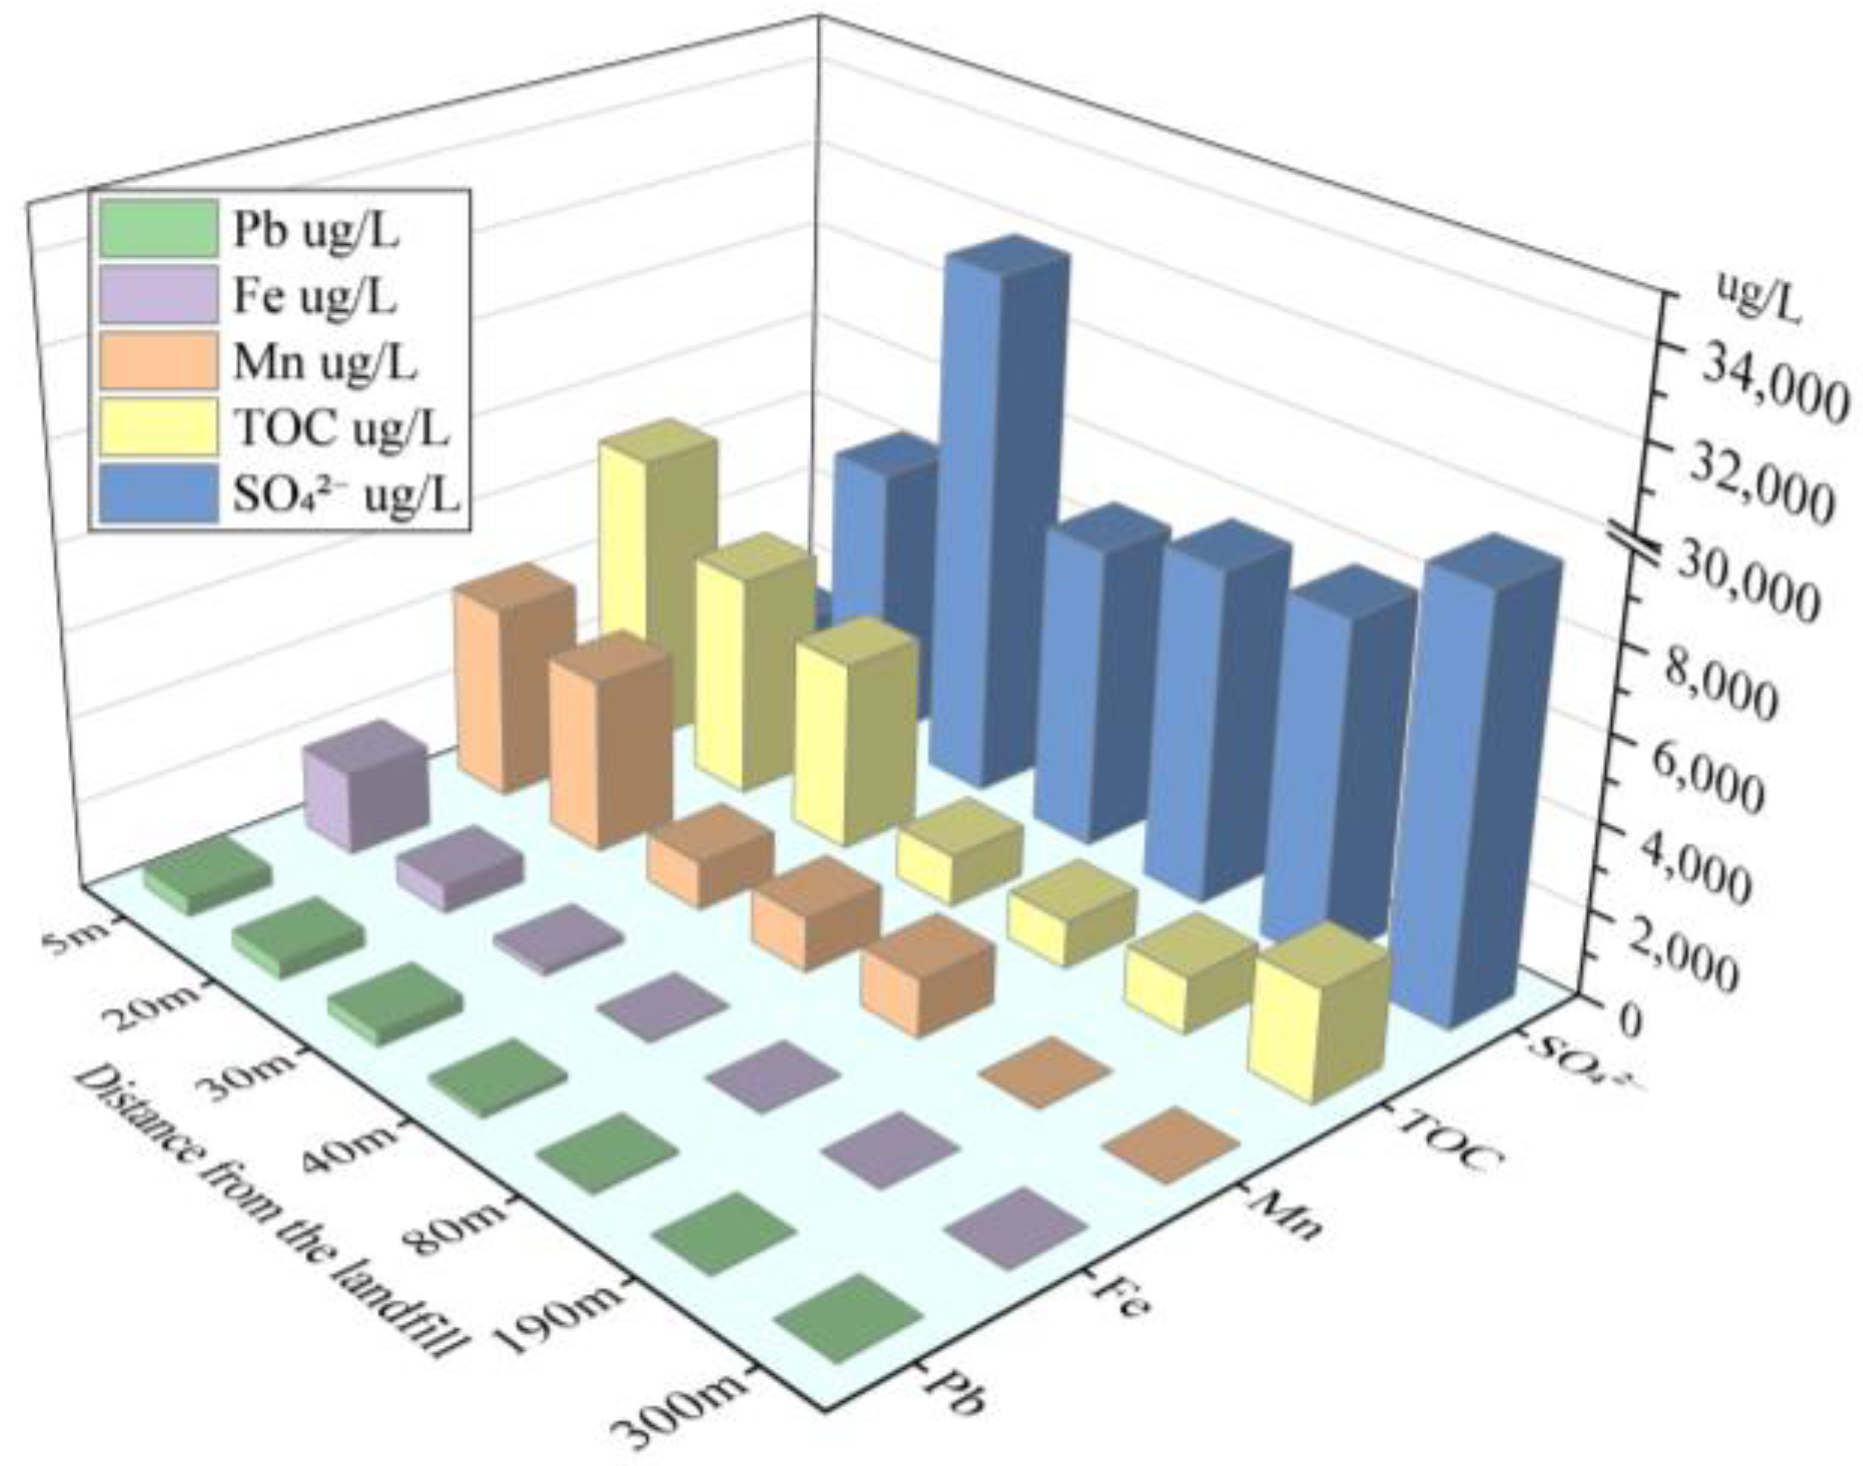
5.2. Groundwater Pollution Characteristics
5.3. Groundwater Health Risk Assessment
6. Conclusions
Author Contributions
Funding
Institutional Review Board Statement
Informed Consent Statement
Conflicts of Interest
References
- Eggen, T.; Moeder, M.; Arukwe, A. Municipal landfill leachates: A significant source for new and emerging pollutants. Sci. Total Environ. 2010, 408, 5147–5157. [Google Scholar] [CrossRef]
- Jain, P.; Powell, J.T.; Smith, J.L.; Townsend, T.G.; Tolaymat, T. Life-cycle inventory and impact evaluation of mining municipal solid waste landfills. Environ. Sci. Technol. 2014, 48, 2920–2927. [Google Scholar] [CrossRef]
- Xingran, H.; Bing, Y.; Zhiyong, H. Comparison of the characteristics of typical pollutants in the groundwater between sanitary and non-sanitary landfills in China. Acta Sci. Circumstantiae 2019, 39, 3025–3038. [Google Scholar]
- Ma, Z.Y.; Jiang, Y.C.; Ren, J.X.; Zhang, Y.; Feng, P.; Gao, Q.X.; Meng, D. Emission inventory of air pollutants for the harmless treatment of municipal solid waste. Environ. Sci. Technol. 2021, 42, 1333–1342. [Google Scholar]
- Bhalla, B. Effect of age and seasonal variations on leachate characteristics of municipal solid waste landfill. Int. Res. J. Eng. Technol. 2013, 02, 223–232. [Google Scholar]
- Yao, P. Perspectives on technology for landfill leachate treatment. Arab. J. Chem. 2013, 1–8. [Google Scholar] [CrossRef] [Green Version]
- Slack, R.J.; Gronow, J.; Voulvoulis, N. Household hazardous waste in municipal landfills: Contaminants in leachate. Sci. Total Environ. 2005, 337, 119–137. [Google Scholar] [CrossRef] [PubMed]
- Chen, Y.; Xie, H.; Zhang, C. Review on penetration of barriers by contaminants and technologies for groundwater and soil contamination control. Adv. Sci. Technol. Water Resour. 2016, 36, 1–10. [Google Scholar]
- Samadder, S.R.; Prabhakar, R.; Khan, D.; Kishan, D.; Chauhan, M.S. Analysis of the contaminants released from municipal solid waste landfill site: A case study. Sci. Total Environ. 2017, 580, 593–601. [Google Scholar] [CrossRef] [PubMed]
- Hussein, M.; Yoneda, K.; Mohd-Zaki, Z.; Amir, A.; Othman, N. Heavy metals in leachate, impacted soils and natural soils of different landfills in Malaysia: An alarming threat. Chemosphere 2021, 267, 1–19. [Google Scholar] [CrossRef]
- Koda, E.; Miszkowska, A.; Sieczka, A.; Osinski, P. Heavy metals contamination within restored landfill site in Poland. Environ. Geotech. 2020, 7, 512–521. [Google Scholar] [CrossRef]
- Propp, V.R.; De Silva, A.O.; Spencer, C.; Brown, S.J.; Catingan, S.D.; Smith, J.E.; Roy, J.W. Organic contaminants of emerging concern in leachate of historic municipal landfills. Environ. Pollut. 2021, 276, 12. [Google Scholar] [CrossRef]
- Wang, K.; Reguyal, F.; Zhuang, T. Risk assessment and investigation of landfill leachate as a source of emerging organic contaminants to the surrounding environment: A case study of the largest landfill in Jinan City, China. Environ. Sci. Pollut. Res. 2021, 28, 18368–18381. [Google Scholar] [CrossRef] [PubMed]
- Boateng, T.K.; Opoku, F.; Akoto, O. Heavy metal contamination assessment of groundwater quality: A case study of Oti landfill site, Kumasi. Appl. Water Sci. 2019, 9, 1–15. [Google Scholar] [CrossRef] [Green Version]
- Jabońska-Trypu, A.; Wydro, U.; Woejko, E.; Pietryczuk, A.; Butarewicz, A. Potential toxicity of leachate from the municipal landfill in view of the possibility of their migration to the environment through infiltration into groundwater. Environ. Geochem. Health 2021, 1–16. [Google Scholar] [CrossRef]
- Johar, P.; Singh, D.; Kumar, A. Spatial variations of heavy metal contamination and associated risks around an unplanned landfill site in India. Environ. Monit. Assess 2020, 192, 1–14. [Google Scholar] [CrossRef]
- Bharath, K.M.; Usha, N.; Vaikunth, R.; Kumar, R.P.; Ruthra, R.; Srinivasalu, S. Spatial distribution of microplastic concentration around landfill sites and its potential risk on groundwater. Chemosphere 2021, 277, 1–11. [Google Scholar]
- Pınar, K.; Aysun, S. A health risk assessment for exposure to trace metals via drinking water ingestion pathway. Int. J. Hyg. Environ. Health 2009, 212, 216–227. [Google Scholar]
- Wang, Y.; Li, L.; Qiu, Z.; Yang, K.; Han, Y.; Chai, F.; Li, P.; Wang, Y. Trace volatile compounds in the air of domestic waste landfill site: Identification, olfactory effect and cancer risk—ScienceDirect. Chemosphere 2021, 272, 1–14. [Google Scholar] [CrossRef]
- Xu, C.; Song, X.; Liu, Z.; Ding, X.; Chen, H.; Ding, D. Occurrence, source apportionment, plant bioaccumulation and human exposure of legacy and emerging per- and polyfluoroalkyl substances in soil and plant leaves near a landfill in China. Sci. Total Environ. 2021, 776, 1–11. [Google Scholar] [CrossRef]
- Houyun, S.; Xiaofeng, W.; Fengwei, G.; Heng, W.; Fengchao, J.; Zexin, H.; Duojie, L.; Jian, L.; Jing, Z. Genetic Type and Formation Mechanism of Strontium-rich Groundwater in the Upper and Middle Reaches of Luanhe River Basin. Acta Geosci. Sin. 2020, 41, 65–79. [Google Scholar]
- Semhi, K.; Abdalla, O.; Abri, R.A.; Hosni, T.A.; Clark, I.D. Strontium isotopes as a tool for estimation of groundwater recharge and aquifer connectivity. Groundw. Sustain. Dev. 2017, 4, 1–11. [Google Scholar] [CrossRef]
- Han, D.; Tong, X.; Currell, M.J.; Cao, G.; Jin, M.; Tong, C. Evaluation of the impact of an uncontrolled landfill on surrounding groundwater quality, Zhoukou, China. J. Geochem. Explor. 2014, 136, 24–39. [Google Scholar] [CrossRef]
- Kwang-Sik, L.; Kyung-Seok, K.; Young, K.E. Application of stable isotopes and dissolved ions for monitoring landfill leachate contamination. Environ. Geochem. Health 2020, 42, 1387–1399. [Google Scholar]
- Jun, X.; Lingqing, W.; Ningpan, C.; Ting, L.; Zhangdong, J.; Jorg, R. Groundwater hydrochemistry, source identification and pollution assessment in intensive industrial areas, eastern Chinese loess plateau. Environ. Pollut. 2021, 278, 1–13. [Google Scholar]
- Jianting, S.; Qianhong, L.; Yanrong, Z.; Yinjun, P.; Yulan, C. Shallow groundwater surrounding the Likeng landfill, Guangzhou, China—major ions and elements indicating the contamination sources. Water. Sci. Technol. 2016, 74, 2234–2244. [Google Scholar]
- Daniel, A.; Harald, K. Groundwater contamination from a municipal landfill: Effect of age, landfill closure, and season on groundwater chemistry. Sci. Total Environ. 2020, 737, 1–11. [Google Scholar]
- Rina, M.; Saheed, O.; Olusola, O. The Influence of Non-Engineered Municipal Landfills on Groundwater Chemistry and Quality in Bloemfontein, South Africa. Molecules 2020, 25, 5599. [Google Scholar]
- Bai, X.; Song, K.; Liu, J.; Mohamed, A.K.; Liu, D. Health Risk Assessment of Groundwater Contaminated by Oil Pollutants Based on Numerical Modeling. Int. J. Environ. Res. Public Health 2019, 16, 3245. [Google Scholar] [CrossRef] [PubMed] [Green Version]
- Chaudhary, R.; Nain, P.; Kumar, A. Temporal variation of leachate pollution index of Indian landfill sites and associated human health risk. Environ. Sci. Pollut. Res. 2021, 28, 28391–28406. [Google Scholar] [CrossRef] [PubMed]
- Tianyi, M.; Shuo, L.; Jie, S.; Feng, G.; Xiaofei, L.; Zhuo, W. Risk assessment of organic pollution in groundwater for a landfill in Jilin. Environ. Pollut. Control 2019, 41, 348–350. [Google Scholar]
- Li, Y.; Bi, Y.; Mi, W.; Xie, S.; Ji, L. Land-use change caused by anthropogenic activities increase fluoride and arsenic pollution in groundwater and human health risk. J. Hazard. Mater. 2021, 406, 1–9. [Google Scholar] [CrossRef]
- Long, X.; Liu, F.; Zhou, X.; Pi, J.; Yin, W.; Li, F.; Huang, S.; Ma, F. Estimation of spatial distribution and health risk by arsenic and heavy metals in shallow groundwater around Dongting Lake plain using GIS mapping. Chemosphere 2021, 269, 1–11. [Google Scholar] [CrossRef]
- Tanu, S.; Singh, B.B.; Inderpreet, K. Contamination of groundwater by potentially toxic elements in groundwater and potential risk to groundwater users in the Bathinda and Faridkot districts of Punjab, India. Environ. Earth Sci. 2021, 8, 1–15. [Google Scholar]
- Sheng, C.; Mo, X.; Ming, L.; Yanna, Y.; Sishuagn, H. Analysis on Hydrochemical Characteristics and Origin of the Main Ions of Shallow Groudwater in Redbed of Suining Area, Certral Sichuan Basin. Resour. Environ. Yangtze Basin 2020, 29, 220–230. [Google Scholar]
- US EPA. Exposure Factors Handbook: 2011 Edition; US EPA: Washington, DC, USA, 2011; Volume EPA/600/R-09/052F.
- Yang, W.; Lang, Y.H.; Bai, J.; Li, Z.Y. Quantitative evaluation of carcinogenic and non-carcinogenic potential for PAHs in coastal wetland soils of China. Ecol. Eng. 2015, 74, 117–124. [Google Scholar] [CrossRef]
- Dixon, W.; Chiswell, B. The use of hydrochemical sections to identify recharge areas and saline intrusions in alluvial aquifers, southeast Queensland, Australia. J. Hydrol. 1992, 135, 259–274. [Google Scholar] [CrossRef]
- Meybeck, M. Global Occurrence of Major Elements in Rivers—ScienceDirect. Treatise Geochem. 2003, 5, 207–223. [Google Scholar]
- Magaritz, M.; Nadler, A.; Koyumdjisky, H.; Dan, J. The use of Na/Cl ratios to trace solute sources in a semiarid zone. Water Resour. Res. 1981, 17, 602–608. [Google Scholar] [CrossRef]
- Qin, T.; Tang, Q.; Zhang, Q.; Yang, P. Chemical ions source analysis and stable iso-tope implications of different water bodies in large karst underground river system: A case study of Poxin groundwater basin in Guangxi. Geol. China 2019, 46, 302–315. [Google Scholar]
- Xinghai, C. Composition analysis and genesis explanation of red bed in Sichuan. Geotech. Eng. Undergr. Eng. 2009, 29, 157–158. [Google Scholar]
- Appelo, C.A.J.; Postma, D. Geochemistry, Groundwater and Pollution, 2nd ed.; AA Balkema Publishers: Rotterdam, The Netherlands, 2005. [Google Scholar]
- Lee, S.W.; Im, J.D.; Dispirito, A.A.; Bodrossy, L.; Barcelona, M.J.; Semrau, J.D. Effect of Nutrient and Selective Inhibitor Amendments on Methane Oxidation, Nitrous Oxide Production, and Key Gene Presence and Expression in Landfill Cover Soils: Characterization of the Role of Methanotrophs, Nitrifiers, and Denitrifiers. Environ. Microbiol. 2009, 85, 389–403. [Google Scholar] [CrossRef] [PubMed]
- Hossain, M.S.; Haque, M.A.; Hoyos, L.R. Dynamic Properties of Municipal Solid Waste in Bioreactor Landfills with Degradation. Geotech. Geol. Eng. 2010, 28, 391–403. [Google Scholar] [CrossRef]
- Aharoni, I.; Siebner, H.; Dahan, O. Application of vadose-zone monitoring system for real-time characterization of leachate percolation in and under a municipal landfill. Waste Manag. 2017, 67, 203–213. [Google Scholar] [CrossRef] [PubMed]
- Al-Bassam, A.M.; Khalil, A.R. DurovPwin: A new version to plot the expanded Durov diagram for hydro-chemical data analysis. Comput. Geosci. 2012, 42, 1–6. [Google Scholar] [CrossRef]
- Lloyd, J.W. The hydrochemistry of the aquifers of North-Eastern Jordan. J. Hydrol. 1965, 3, 319–330. [Google Scholar] [CrossRef]
- Xiaozong, R.; Min, L.; Yingzhen, Z.; Zhiming, H.; Bingqi, Z. Plotting Durov Diagram based on Matlab. Arid Land Geogr. 2018, 41, 744–750. [Google Scholar]
- Jurgens, B.C.; Mcmahon, P.B.; Chapelle, F.H.; Eberts, S.M. An Excel Workbook for Identifying Redox Processes in Ground Water; U.S. Geological Survey: Reston, VA, USA, 2009.
- Saito, T.; Spadini, L.; Saito, H.; Martins, J.M.F.; Oxarango, L.; Takemura, T.; Hamamoto, S.; Moldrup, P.; Kawamoto, K.; Komatsu, T. Characterization and comparison of groundwater quality and redox conditions in the Arakawa Lowland and Musashino Upland, southern Kanto Plain of the Tokyo Metropolitan area, Japan—ScienceDirect. Sci. Total Environ. 2020, 722, 1–10. [Google Scholar] [CrossRef] [PubMed]
- Bjerg, P.L.; Ruegge, K.; Pedersen, J.K.; Christensen, T.H. Distribution of redox-sensitive groundwater quality parameters downgradient of a landfill (Grindsted, Denmark). EST 1995, 29, 1387–1394. [Google Scholar] [CrossRef]
- Ziyang, L.; Youcai, Z.; Tao, Y.; Yu, S.; Huili, C.; Nanwen, Z.; Renhu, H. Natural attenuation and characterization of contaminants composition in landfill leachate under different disposing ages. Sci. Total Environ. 2009, 407, 1–7. [Google Scholar] [CrossRef]
- Chapelle, F.H. Ground-Water Microbiology and Geochemistry; Wiley: New York, NY, USA, 2000. [Google Scholar]
- Horst, A.; Mahlknecht, J.; López-Zavala, M.A.; Mayer, B. The origin of salinity and sulphate contamination of groundwater in the Colima State, Mexico, constrained by stable isotopes. Environ. Earth Sci. 2011, 64, 1931–1941. [Google Scholar] [CrossRef]
- Stumm, W.; Morgan, J.J. Aquatic Chemistry: Chemical Equilibria and Rates in Natural Waters; Wiley: New York, NY, USA, 1996. [Google Scholar]
- Bjerg, P.L.; Albrechtsen, H.J.; Kjeldsen, P.; Christensen, T.H.; Cozzarelli, I.M. The Groundwater Geochemistry of Waste Disposal Facilities. Treatise Geochem. 2003, 9, 579–612. [Google Scholar]
- Al-Yaqout, A.F.; Hamoda, M.F. Evaluation of landfill leachate in arid climate-a case study. Environ. Int. 2004, 29, 593–600. [Google Scholar] [CrossRef]
- US EPA. Integrated Risk Information System. Available online: https://www.epa.gov/iris (accessed on 18 June 2021).
- Texas. Texas Risk Reduction Program. Available online: http://www.tceq.texas.gov/remediation/trrp/trrp-pcls.html (accessed on 17 June 2021).
- Song, K.; Yang, G.; Wang, F.; Liu, J.; Liu, D. Application of Geophysical and Hydrogeochemical Methods to the Protection of Drinking Groundwater in Karst Regions. Int. J. Environ. Res. Public Health 2020, 17, 3627. [Google Scholar] [CrossRef]
- Song, K.; Ren, X.; Mohamed, A.K.; Liu, J.; Wang, F. Research on drinking-groundwater source safety management based on numerical simulation. Sci. Rep. 2020, 10, 1–17. [Google Scholar] [CrossRef]


| No. | Monitoring Factors | Groundwater | ||
|---|---|---|---|---|
| Detection Method | Instrument | Minimum Detectable Value | ||
| 1 | pH | Portable PH meter | - | - |
| 2 | TDS | Weighing method | - | 5 mg/L |
| 3 | CODMn | Alkaline potassium permanganate oxidation method | - | 0.5 mg/L |
| 4 | Total hard | EDTA tltrimetric method | - | 5 mg/L |
| 5 | NH4+ | Salicylic Acid Spectrophotometry | UV-Vis-TU-1901 | 0.01 mg/L |
| 6 | TOC | Non-dispersive infrared absorption method | MHY-26359 | 0.1 mg/L |
| 7 | DO | Point-of-care Testing | BDO-200A Dissolved Oxygen Meter | - |
| 8 | Cl− | Ion chromatography | IC-1.925.0020 | 0.007 mg/L |
| 9 | SO42− | 0.018 mg/L | ||
| 10 | F− | 0.006 mg/L | ||
| 11 | NO3− | 0.016 mg/L | ||
| 12 | NO2− | 0.016 mg/L | ||
| 13 | HCO3− | Acid-base indicator titration | - | 0.19 mg/L |
| 14 | CO32− | 0.19 mg/L | ||
| 15 | Na+ | Inductively coupled plasma-mass spectrometry | ICP-MS-7800 | 6.36 μg/L |
| 16 | K+ | 4.5 μg/L | ||
| 17 | Ca2+ | 6.61 μg/L | ||
| 18 | Mg2+ | 1.94 μg/L | ||
| 19 | Mn | 0.12 μg/L | ||
| 20 | Cd | 0.05 μg/L | ||
| 21 | Fe | 0.82 μg/L | ||
| 22 | Pb | 0.09 μg/L | ||
| 23 | As | 0.12 μg/L | ||
| 24 | Hg | 0.04 μg/L | ||
| 25 | Cu | 0.08 μg/L | ||
| 26 | Zn | 0.67 μg/L | ||
| 27 | VOCs | Purge and Trap-GC-MS | P&T-GC/MS-8860/5977B | VOCs include 57 factors. The minimum detectable value of epichlorohydrin is 5 μg/L. The minimum detectable values of other pollutants are between 0.2 and 2.2 μg/L. |
| 28 | SVOCs | GC-MS | GC/MS-7890B/5977B | SVOCs include 58 factors. The minimum detectable values of 3,3-dichlorobenzidine,4-chloroaniline, dimethoate and 2-methyl-4,6-dinitrophenol are 16 μg/L, 20 μg/L, 20 μg/L and 24 μg/L respectively. The minimum detectable values of parathion-methyl, 2,4-dinitrophenol, 2-nitroaniline, 3-nitroaniline and malathion are between 40 and 50 μg/L. The minimum detectable values of other pollutants are between 0.2 and 10 μg/L. |
| Layering | Average Annual Rainfall | Rainfall Infiltration Coefficient | Total Porosity | Specific Yield | Hydraulic Conductivity | Longitudinal Dispersion | Transverse Dispersion | |
|---|---|---|---|---|---|---|---|---|
| Kx,Ky | Kz | |||||||
| First layer | 961.3 mm | 0.12 | 0.15 | 0.1 | 0.65 m/day | 0.14 m/day | 1.54 m | 0.15 m |
| Second layer | - | - | 0.08 | - | 0.08 m/day | 0.03 m/day | - | |
| Symbol | Name | Unit | Recommended Values (Adult) | Symbol | Name | Unit | Recommended Values (Adult) |
|---|---|---|---|---|---|---|---|
| Cw | Concentration of i in groundwater | mg/(L/day) | Measured value | ED | Total years of exposure | a | 40~70 |
| IR | Daily water consumption | L/day | 3.53 | BW | weight | kg | 67.3 |
| EF | Exposure frequency number of days exposed in a year | day/a | 365 | AT | Average exposure time | d | 10,950–25,550 |
| Number | Monitoring Factors | Unit | Uncontaminated Natural Groundwater | Potentially Contaminated Groundwater | Leachate | Standard Value | |||||||||||
|---|---|---|---|---|---|---|---|---|---|---|---|---|---|---|---|---|---|
| Number of Samples | Average. | Min | Max | Median | Over Standard Rate | Number of Samples | Average. | Min | Max | Median | Over Standard Rate | Min | Max | ||||
| 1 | pH | - | 9 | 7.3 | 7.1 | 7.6 | 7.3 | 0.0% | 17 | 7.00 | 6.51 | 7.91 | 6.83 | 0.0% | 8.23 | 8.35 | 6.5–8.5 |
| 2 | Total hard | mg/L | 9 | 405 | 336 | 555 | 384 | 23.5% | 17 | 592 | 191 | 1412 | 513 | 70.6% | 198 | 579 | 450 |
| 3 | TDS | mg/L | 9 | 560 | 428 | 757 | 544 | 0.0% | 17 | 1385 | 459 | 2947 | 1248 | 70.6% | 15,635 | 17,095 | 1000 |
| 4 | Na+ | mg/L | 9 | 22.2 | 14.9 | 30.9 | 22.9 | 0.0% | 17 | 141 | 10 | 430 | 112 | 17.6% | 1980 | 1990 | 200 |
| 5 | K+ | mg/L | 9 | 2.1 | 1.0 | 5.5 | 1.8 | - | 17 | 2.0 | 0.6 | 4.3 | 1.7 | - | 1370.5 | 1740.2 | - |
| 6 | Ca2+ | mg/L | 9 | 124.4 | 59.2 | 194.0 | 123.0 | - | 17 | 189 | 76 | 476 | 145 | - | 24 | 61 | - |
| 7 | Mg2+ | mg/L | 9 | 21.8 | 4.9 | 31.0 | 23.1 | - | 17 | 31 | 8 | 53 | 30 | - | 36 | 105 | - |
| 8 | Cl− | mg/L | 9 | 25.5 | 13.9 | 42.1 | 21.7 | 0.0% | 17 | 228 | 20 | 611 | 192 | 41.2% | 2561 | 3030 | 250 |
| 9 | SO42− | mg/L | 9 | 92.2 | 48.2 | 187.0 | 81.2 | 0.0% | 17 | 117.5 | 16.1 | 320.0 | 79.3 | 11.7% | 50.2 | 171.8 | 250 |
| 10 | HCO3− | mg/L | 9 | 327.4 | 250.0 | 384.0 | 342.0 | - | 17 | 591 | 207 | 1116 | 563 | - | 3560 | 4230 | - |
| 11 | NH4+ | mg/L | 9 | 0.0 | 0.0 | 0.2 | 0.0 | 0.0% | 17 | 0.1 | 0 | 0.3 | 0.1 | 0.0% | 872.4 | 1090.1 | 0.5 |
| 12 | NO2− | mg/L | 9 | 0.0 | 0.0 | 0.10 | 0.0 | 0.0% | 17 | 0.006 | 0.000 | 0.036 | 0.000 | 0.0% | 0.000 | 0.345 | 1 |
| 13 | NO3− | mg/L | 9 | 9.1 | 5.5 | 15.4 | 8.3 | 0.0% | 17 | 8.649 | 0.070 | 66.800 | 0.880 | 11.7% | 4.532 | 7.819 | 20 |
| 14 | CODMn | mg/L | 9 | 0.7 | 0.0 | 1.1 | 0.8 | 0.0% | 17 | 5.1 | 0.0 | 14.5 | 4.6 | 58.8% | 1163.3 | 1180.5 | 3 |
| 15 | F | mg/L | 9 | 0.5 | 0.4 | 0.6 | 0.4 | 0.0% | 17 | 0.318 | 0.240 | 0.650 | 0.280 | 0.0% | 1.6 | 3.5 | 1 |
| 16 | DO | mg/L | 2 | 5.11 | 5.01 | 5.23 | - | - | 13 | 3.02 | 0.78 | 4.89 | 3.01 | - | 0.00 | 0.00 | - |
| 17 | TOC | mg/L | 2 | 0.90 | 0.6 | 1.2 | - | - | 13 | 3.3 | 1.1 | 7.2 | 2.6 | - | 1150.0 | 1453.8 | - |
| 18 | Mn | µg/L | 9 | 0 | 0 | 0 | 0 | 0.0% | 17 | 1832.3 | 0.8 | 4835.4 | 1324.6 | 82.3% | 1140.2 | 2900.5 | 100 |
| 19 | Fe | µg/L | 9 | 0 | 0 | 0 | 0 | 0.0% | 17 | 477.5 | 2.8 | 2568.3 | 58.3 | 35.3% | 2358.4 | 4752.7 | 300 |
| 20 | Pb | µg/L | 9 | 0 | 0 | 0 | 0 | 0.0% | 17 | 222.1 | 0.0 | 525.3 | 153.2 | 64.7% | 242.3 | 631.5 | 10 |
| 24 | Dichloroethane | µg/L | 2 | 0 | 0 | 0 | - | 0.0% | 13 | 5.5 | 0.0 | 15.8 | 4.2 | 0% | 45.7 | 46.2 | 20 |
| 25 | Chlorobenzene | µg/L | 2 | 0 | 0 | 0 | - | 0.0% | 13 | 1.5 | 0.0 | 7.4 | 0.0 | 0% | 15.7 | 18.2 | 300 |
| 26 | Chloroform | µg/L | 2 | 0 | 0 | 0 | - | 0.0% | 13 | 1.0 | 0.0 | 4.3 | 0.0 | 0% | 10.9 | 11.7 | 60 |
| Pollutants | Unit | Mn | Pb | Chlorobenzene | Dichloroethane | Chloroform |
|---|---|---|---|---|---|---|
| SF | kg·d/mg | 1.4 × 10⁻¹ | 3.5 × 10⁻³ | 2.0 × 10⁻² | 2.0 × 10⁻¹ | 1.0 × 10⁻² |
| RfD | mg/(kg·d) | - | - | - | 5.7 × 10⁻³ | 3.1 × 10⁻² |
Publisher’s Note: MDPI stays neutral with regard to jurisdictional claims in published maps and institutional affiliations. |
© 2021 by the authors. Licensee MDPI, Basel, Switzerland. This article is an open access article distributed under the terms and conditions of the Creative Commons Attribution (CC BY) license (https://creativecommons.org/licenses/by/4.0/).
Share and Cite
Wang, F.; Song, K.; He, X.; Peng, Y.; Liu, D.; Liu, J. Identification of Groundwater Pollution Characteristics and Health Risk Assessment of a Landfill in a Low Permeability Area. Int. J. Environ. Res. Public Health 2021, 18, 7690. https://doi.org/10.3390/ijerph18147690
Wang F, Song K, He X, Peng Y, Liu D, Liu J. Identification of Groundwater Pollution Characteristics and Health Risk Assessment of a Landfill in a Low Permeability Area. International Journal of Environmental Research and Public Health. 2021; 18(14):7690. https://doi.org/10.3390/ijerph18147690
Chicago/Turabian StyleWang, Fei, Kai Song, Xuelian He, Yue Peng, Dan Liu, and Jian Liu. 2021. "Identification of Groundwater Pollution Characteristics and Health Risk Assessment of a Landfill in a Low Permeability Area" International Journal of Environmental Research and Public Health 18, no. 14: 7690. https://doi.org/10.3390/ijerph18147690
APA StyleWang, F., Song, K., He, X., Peng, Y., Liu, D., & Liu, J. (2021). Identification of Groundwater Pollution Characteristics and Health Risk Assessment of a Landfill in a Low Permeability Area. International Journal of Environmental Research and Public Health, 18(14), 7690. https://doi.org/10.3390/ijerph18147690