
Mercury and Prenatal Growth: A Systematic Review

 , , ,
, , ,
Abstract
:1. Introduction
2. Materials and Methods
2.1. Protocol and Study Design
2.2. Search Strategy
- (1)
- Pregnancy and early childhood;
- (2)
- Mercury;
- (3)
- Foetal growth.
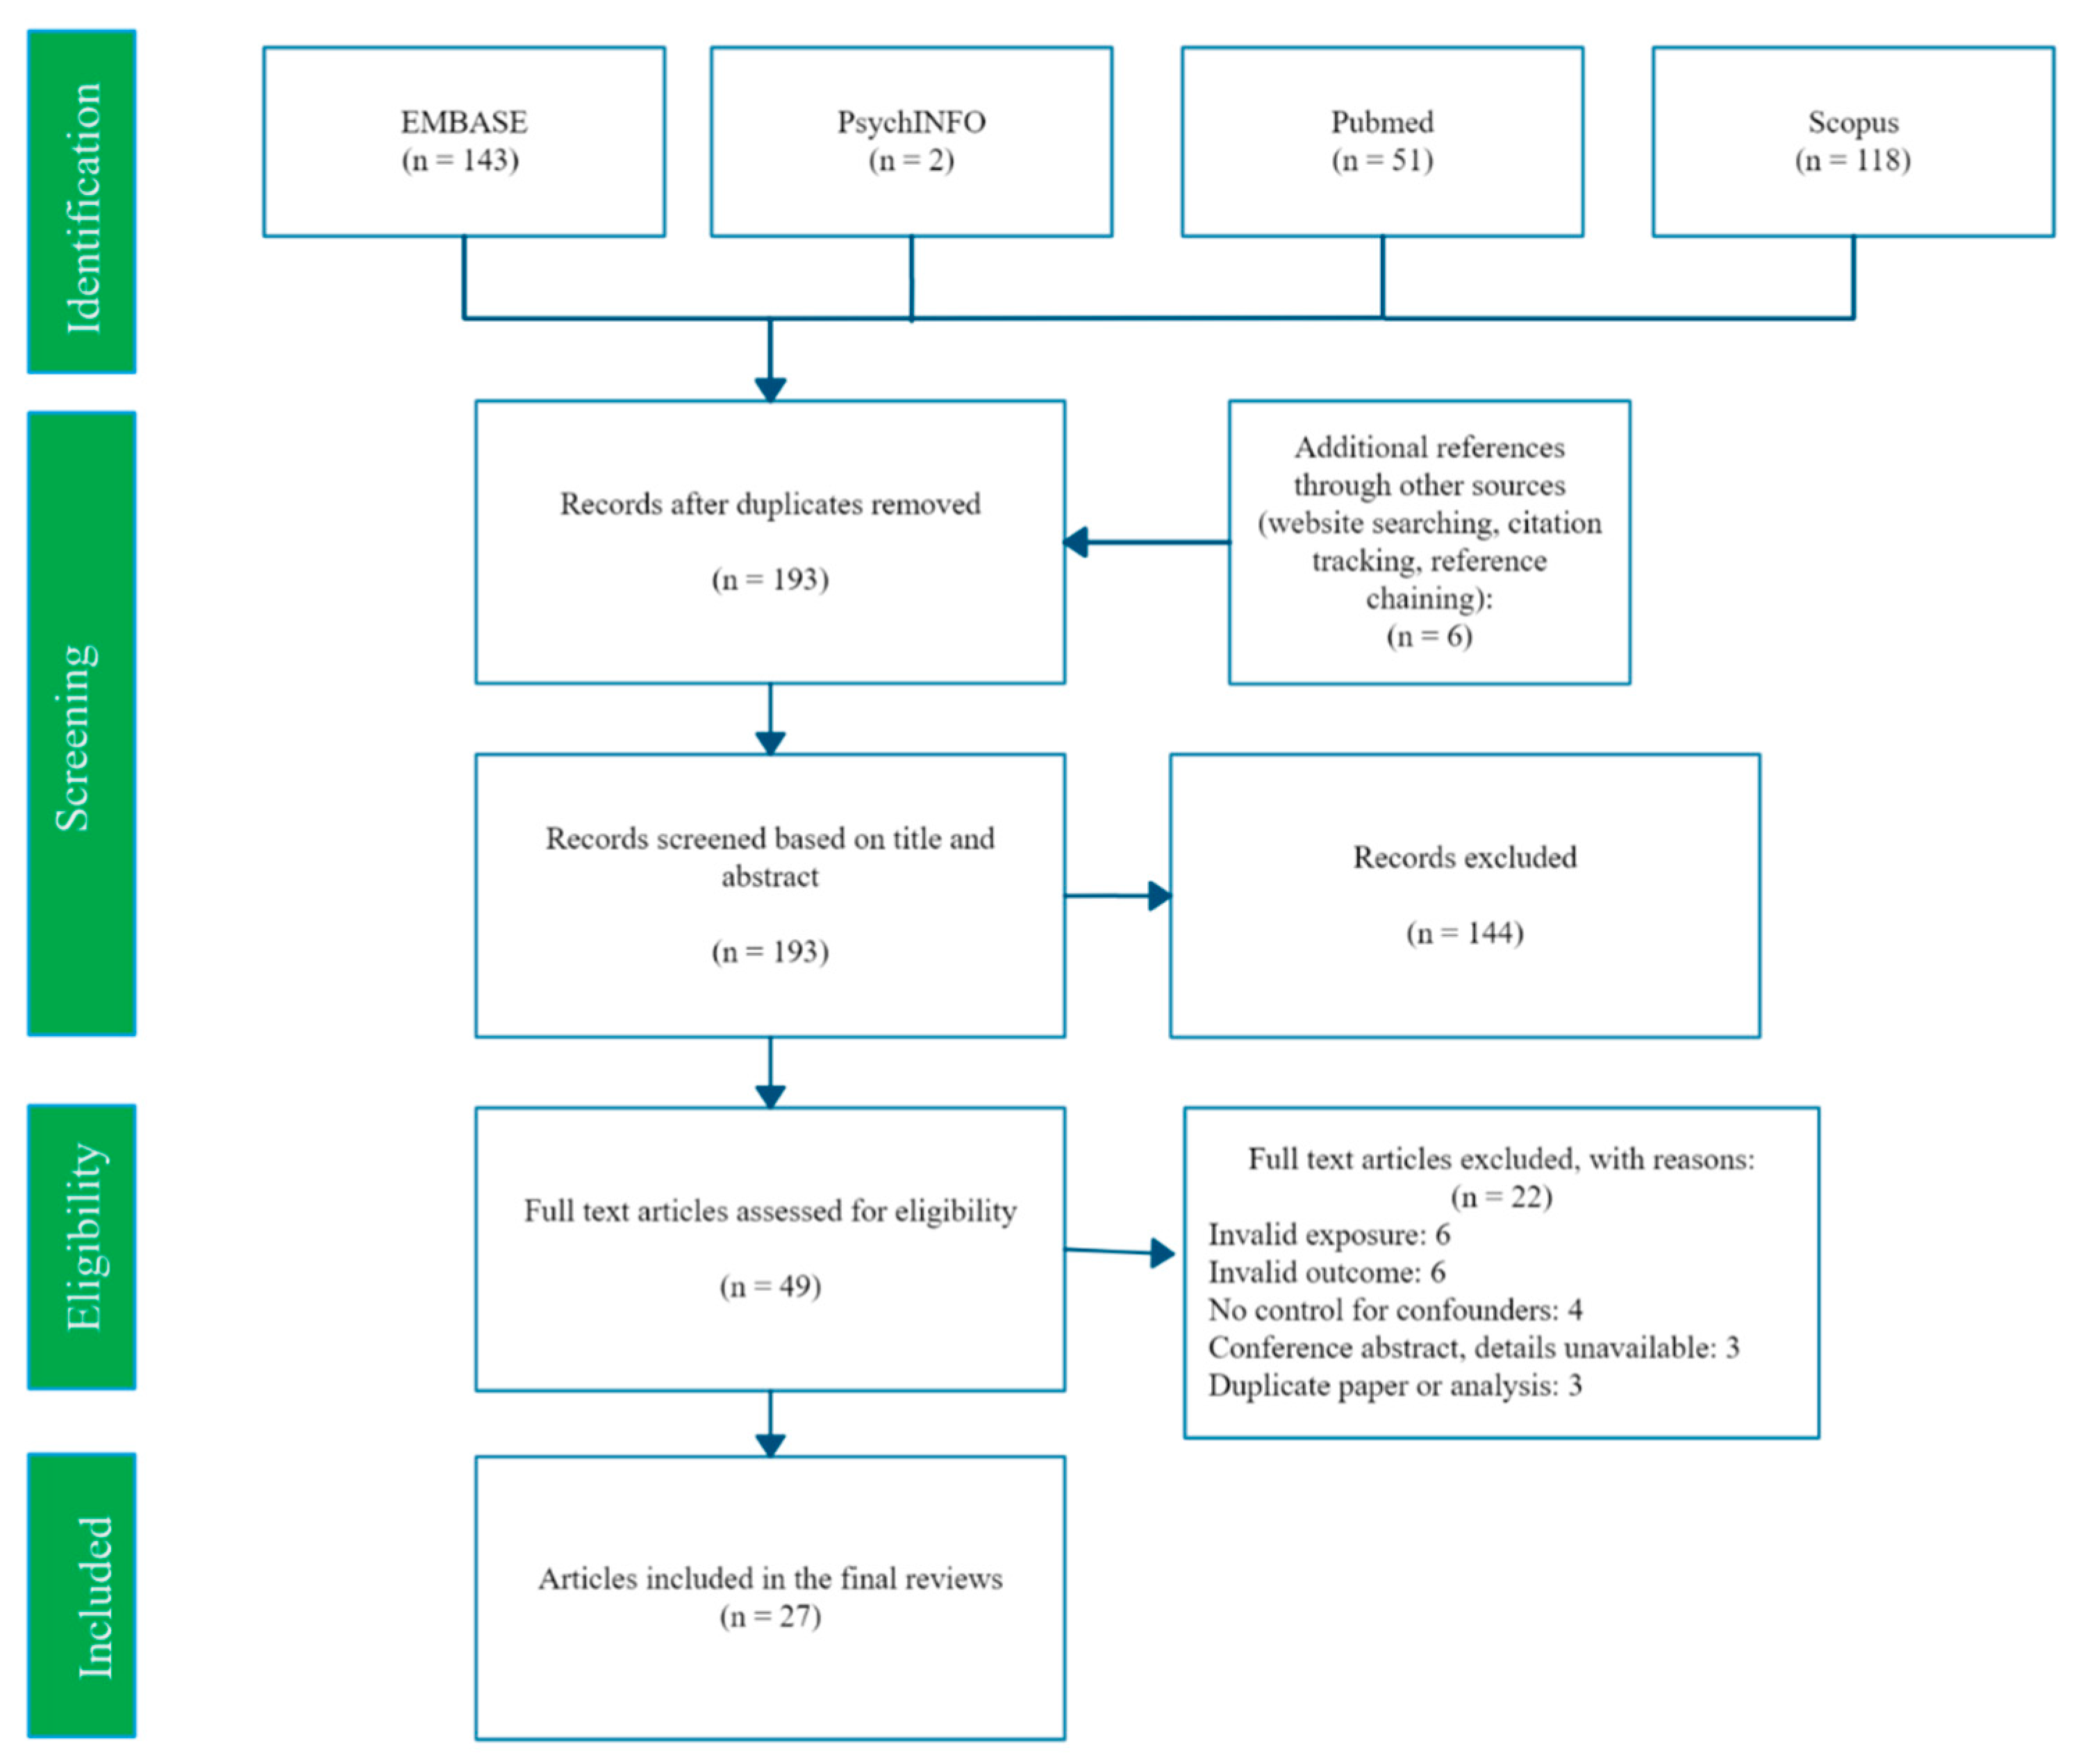
2.3. Study Selection
2.4. Data Extraction and Quality Assessment
2.5. Evidence Synthesis
3. Results
3.1. Summary
- (1)
- Summary of all results.
- (2)
- Results from circulating blood (whole, serum, or erythrocyte) and urine mercury concentrations.
- (3)
- Results from umbilical cord blood or tissue and neonatal hair samples.
- (4)
- Results from placental tissue and maternal hair samples taken at birth.
- (5)
- Results compared by study quality and study design, and an overall conclusion.
3.2. Review
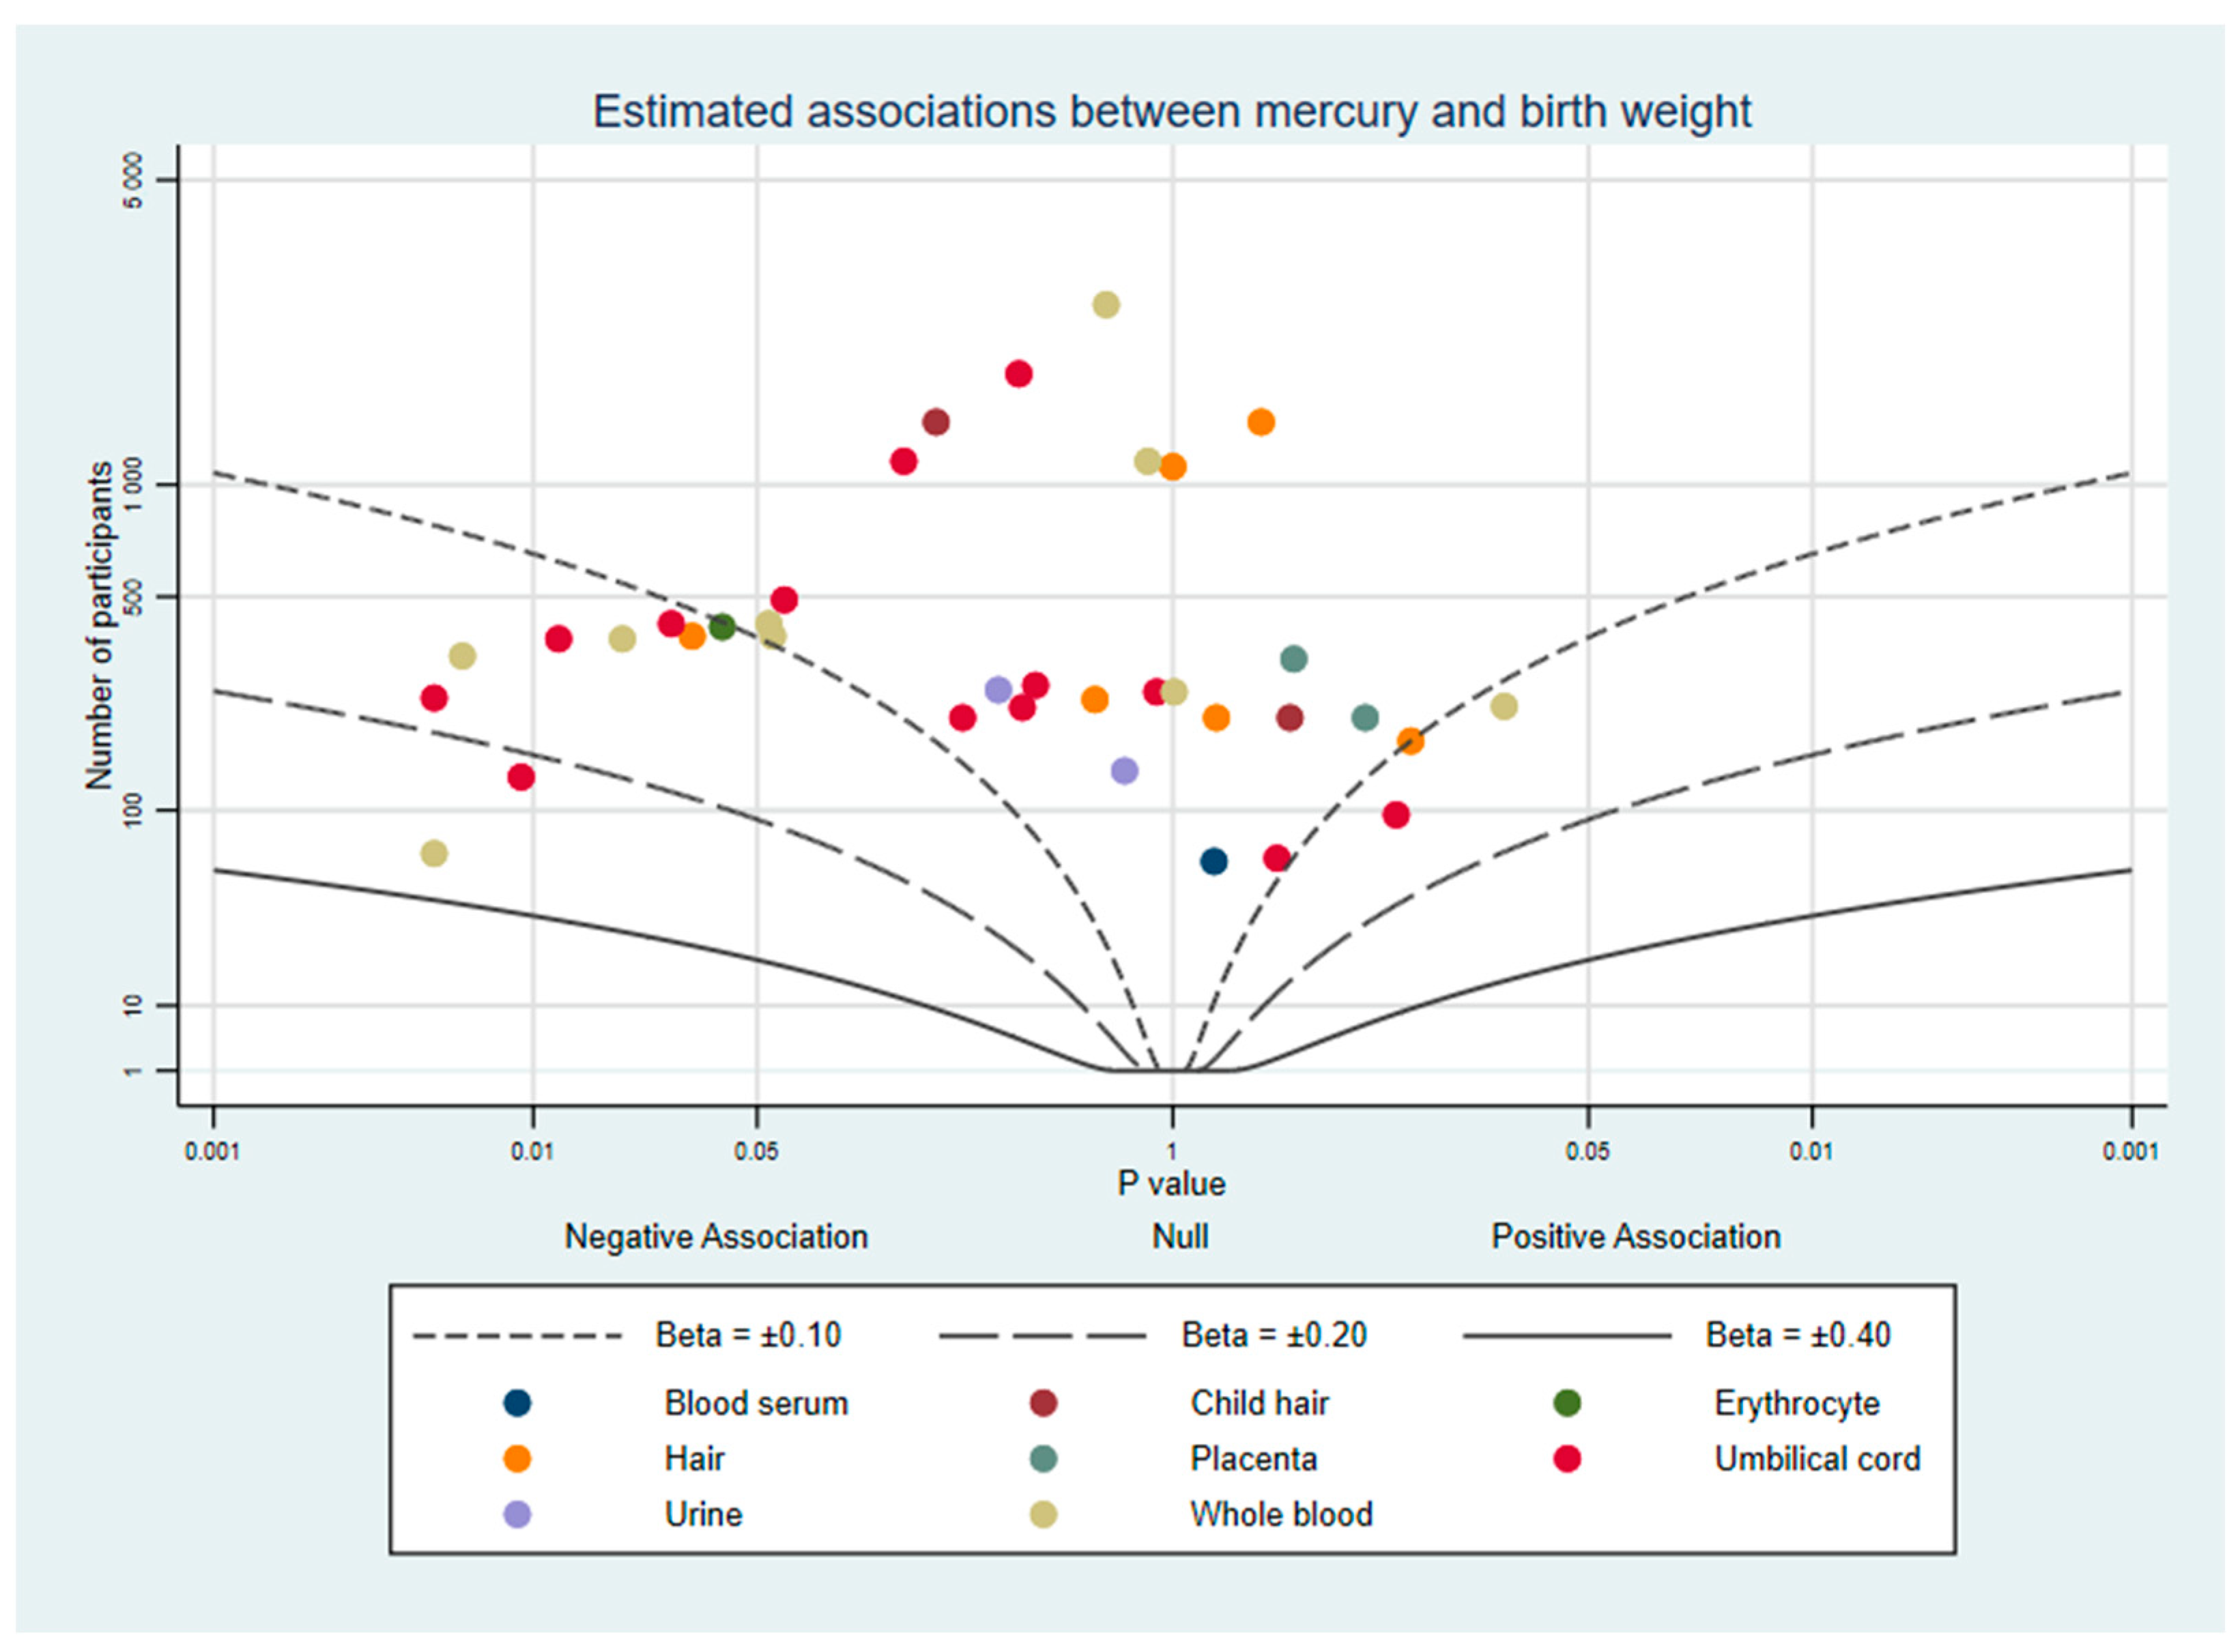
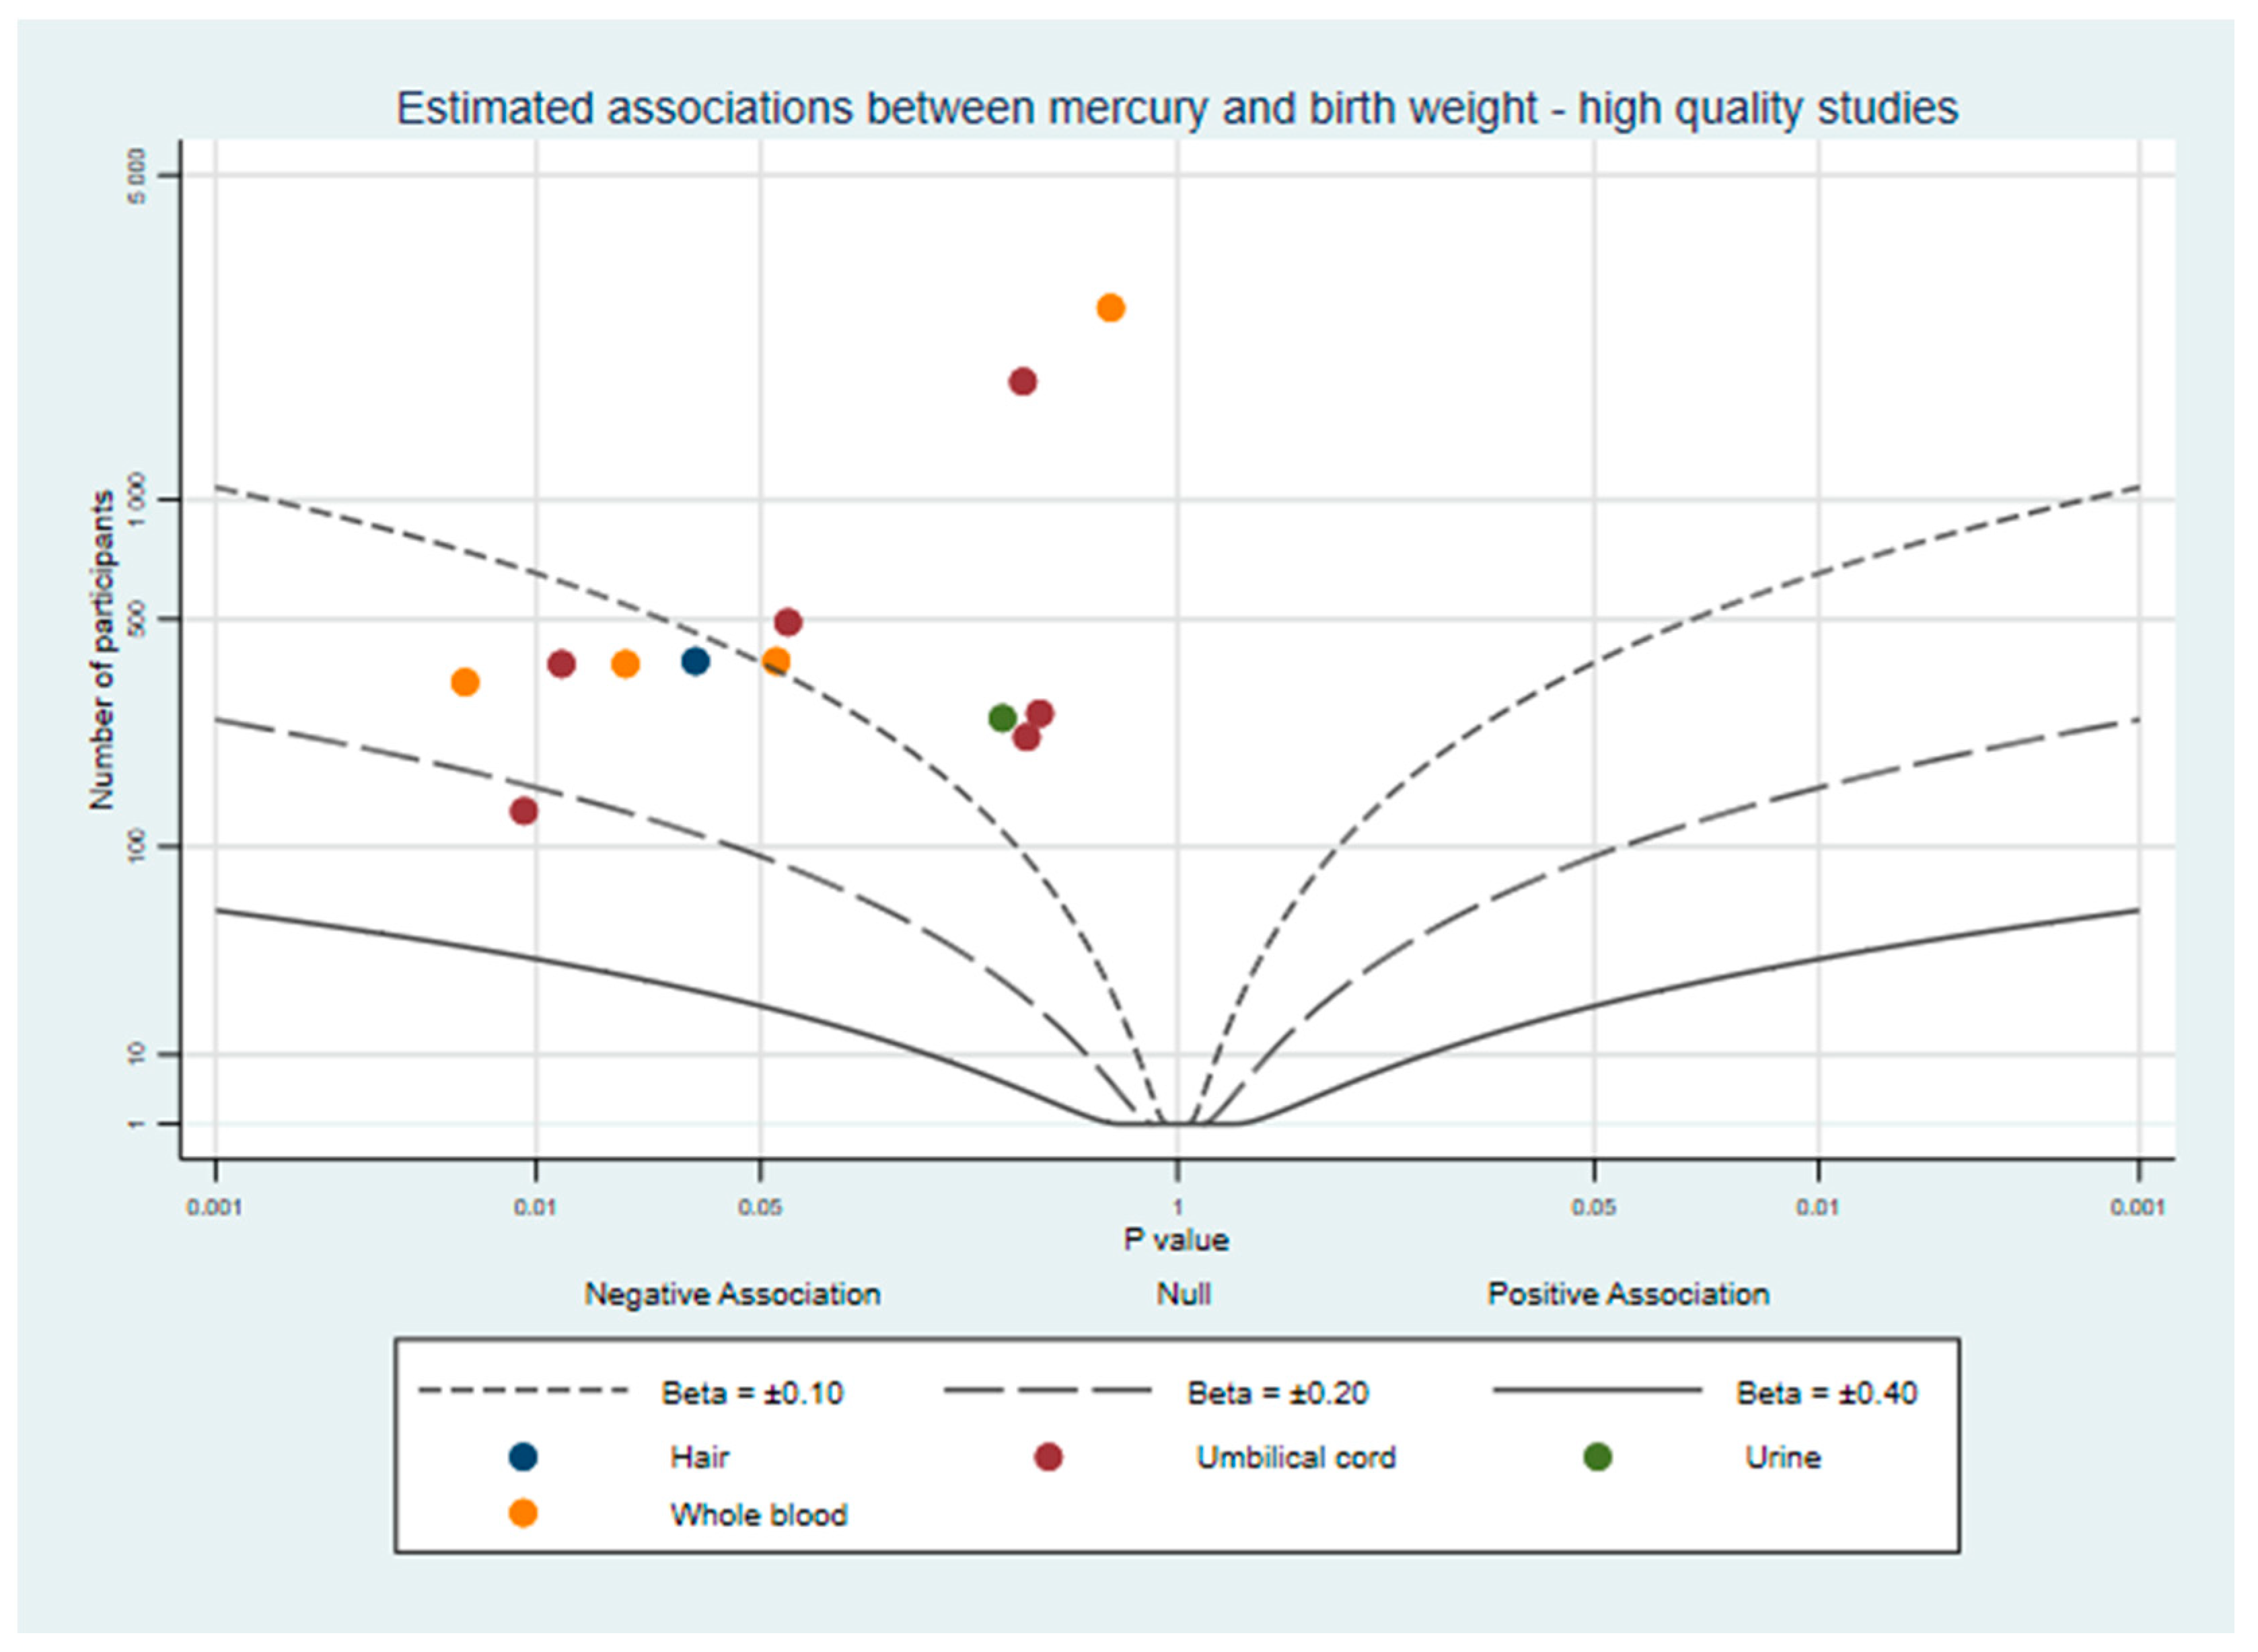
3.2.1. Birth Weight
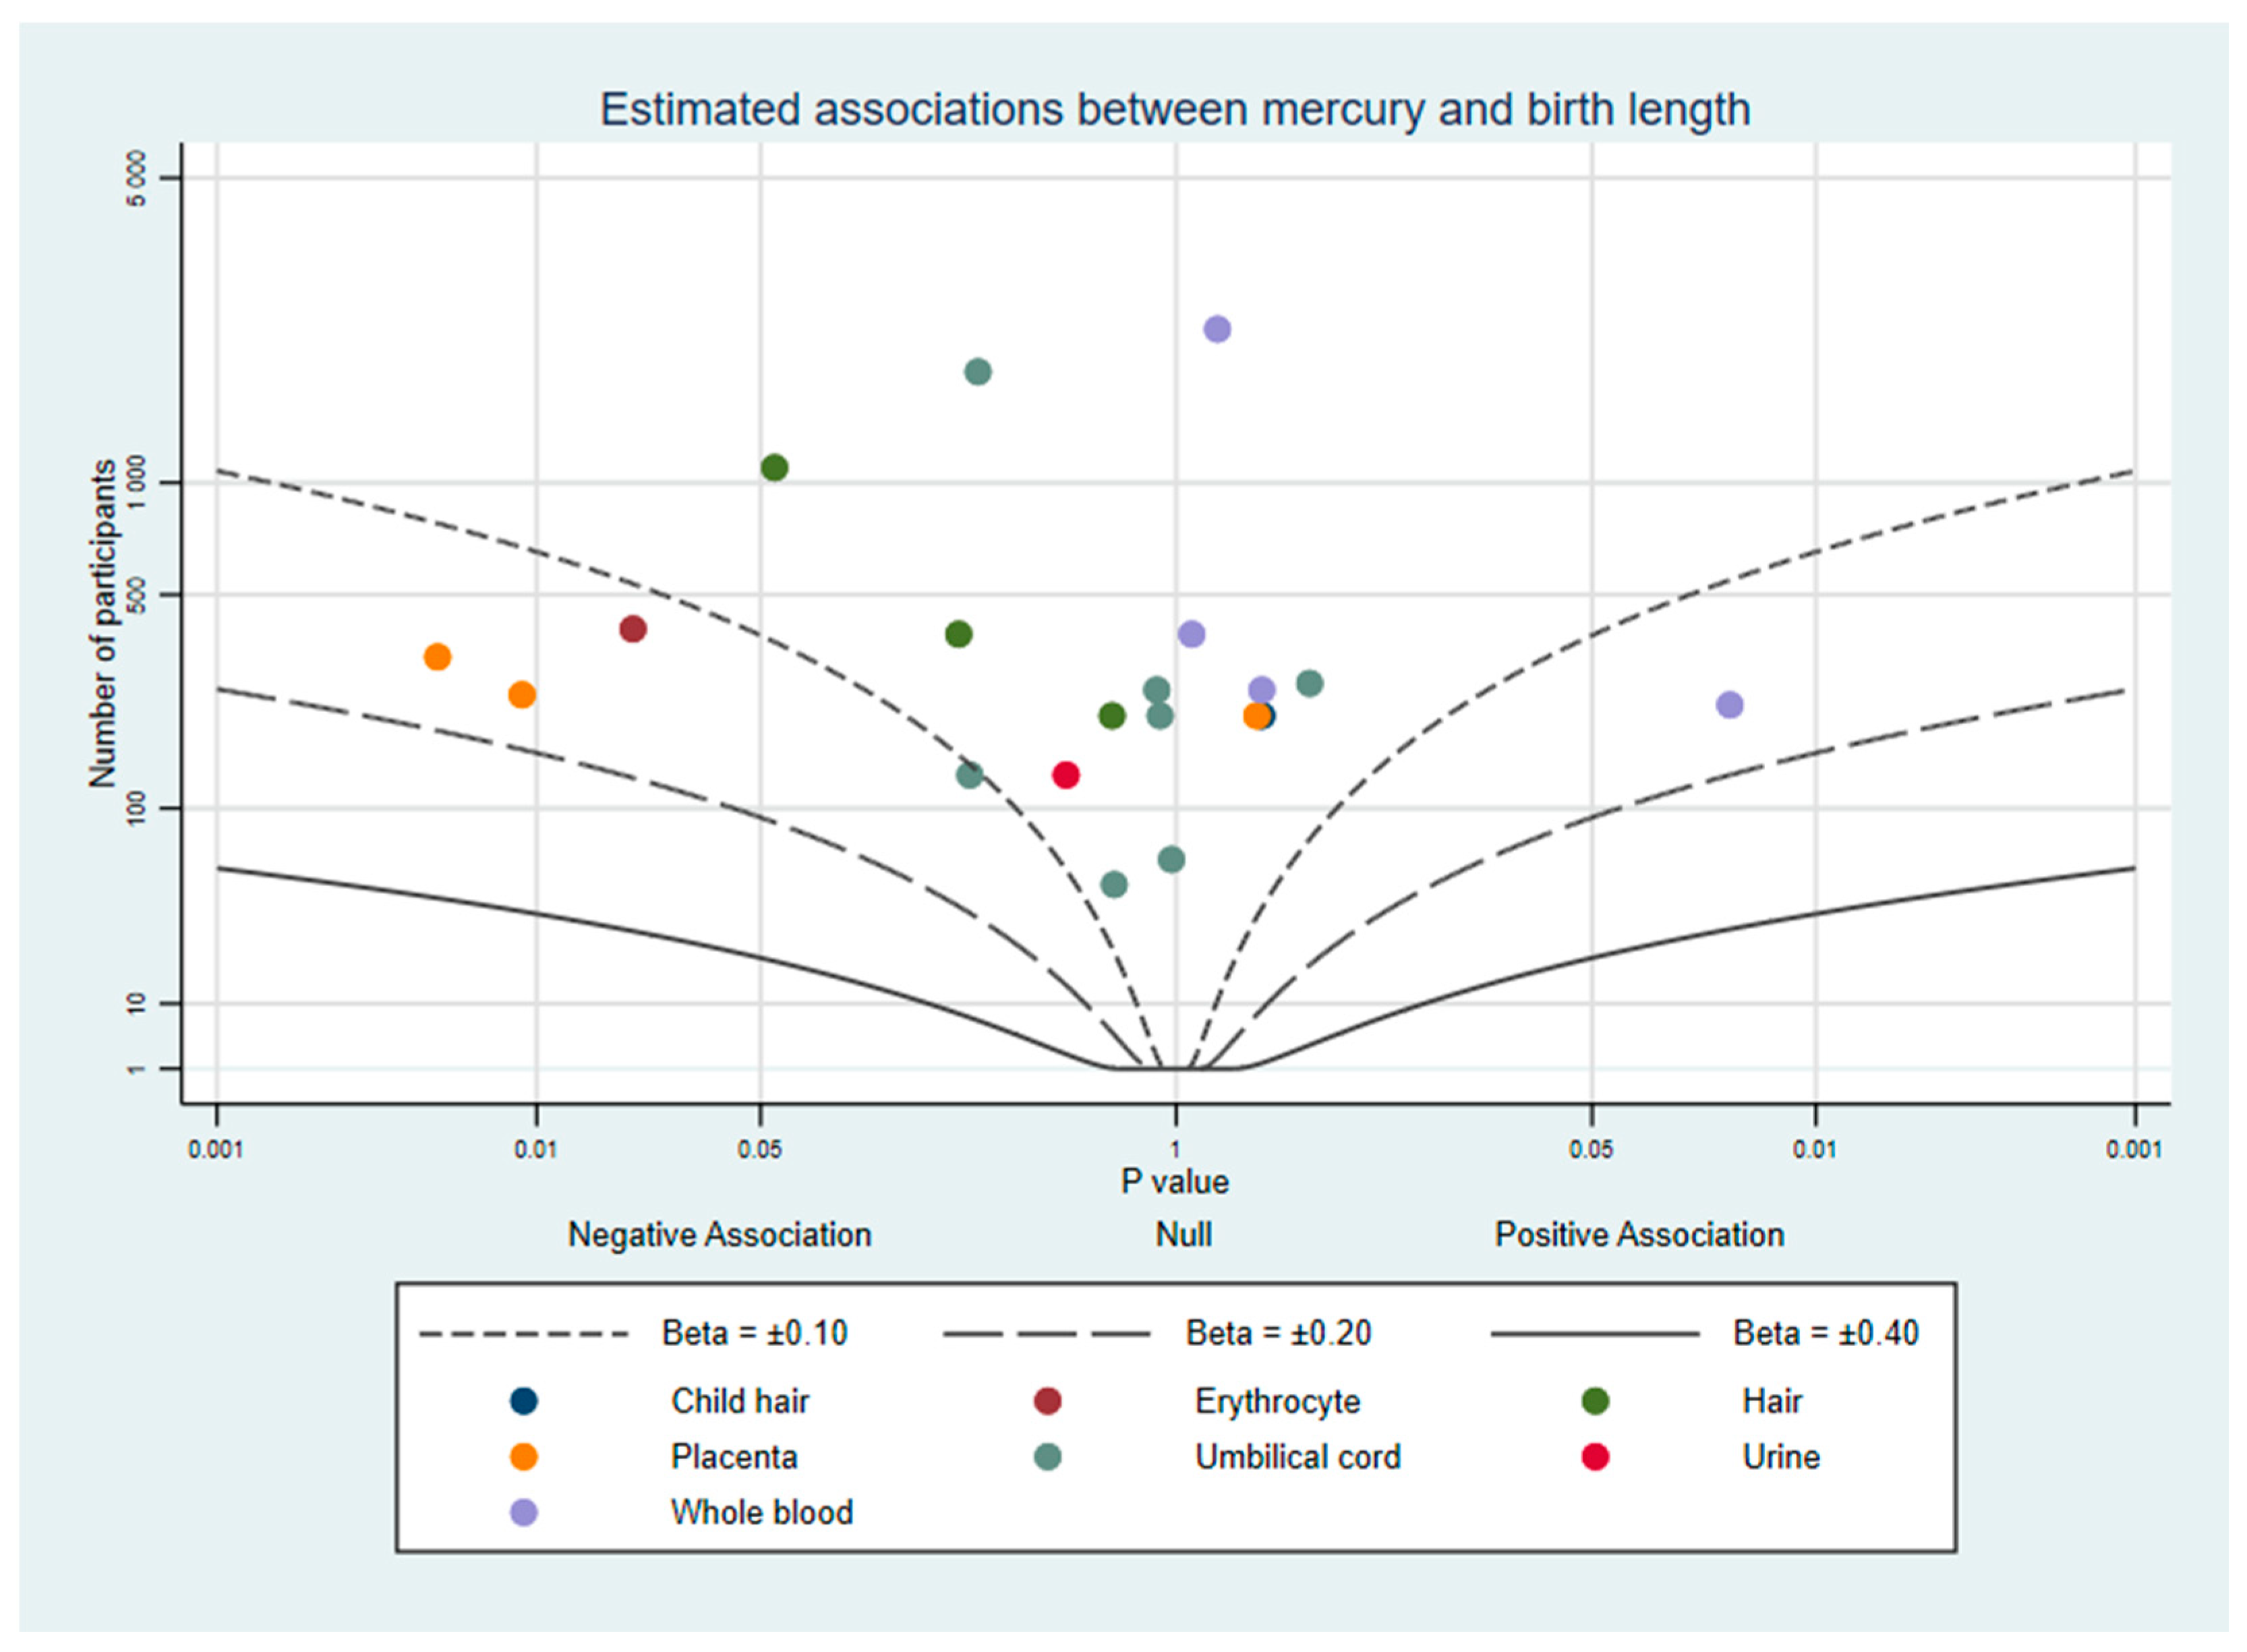
3.2.2. Birth Length
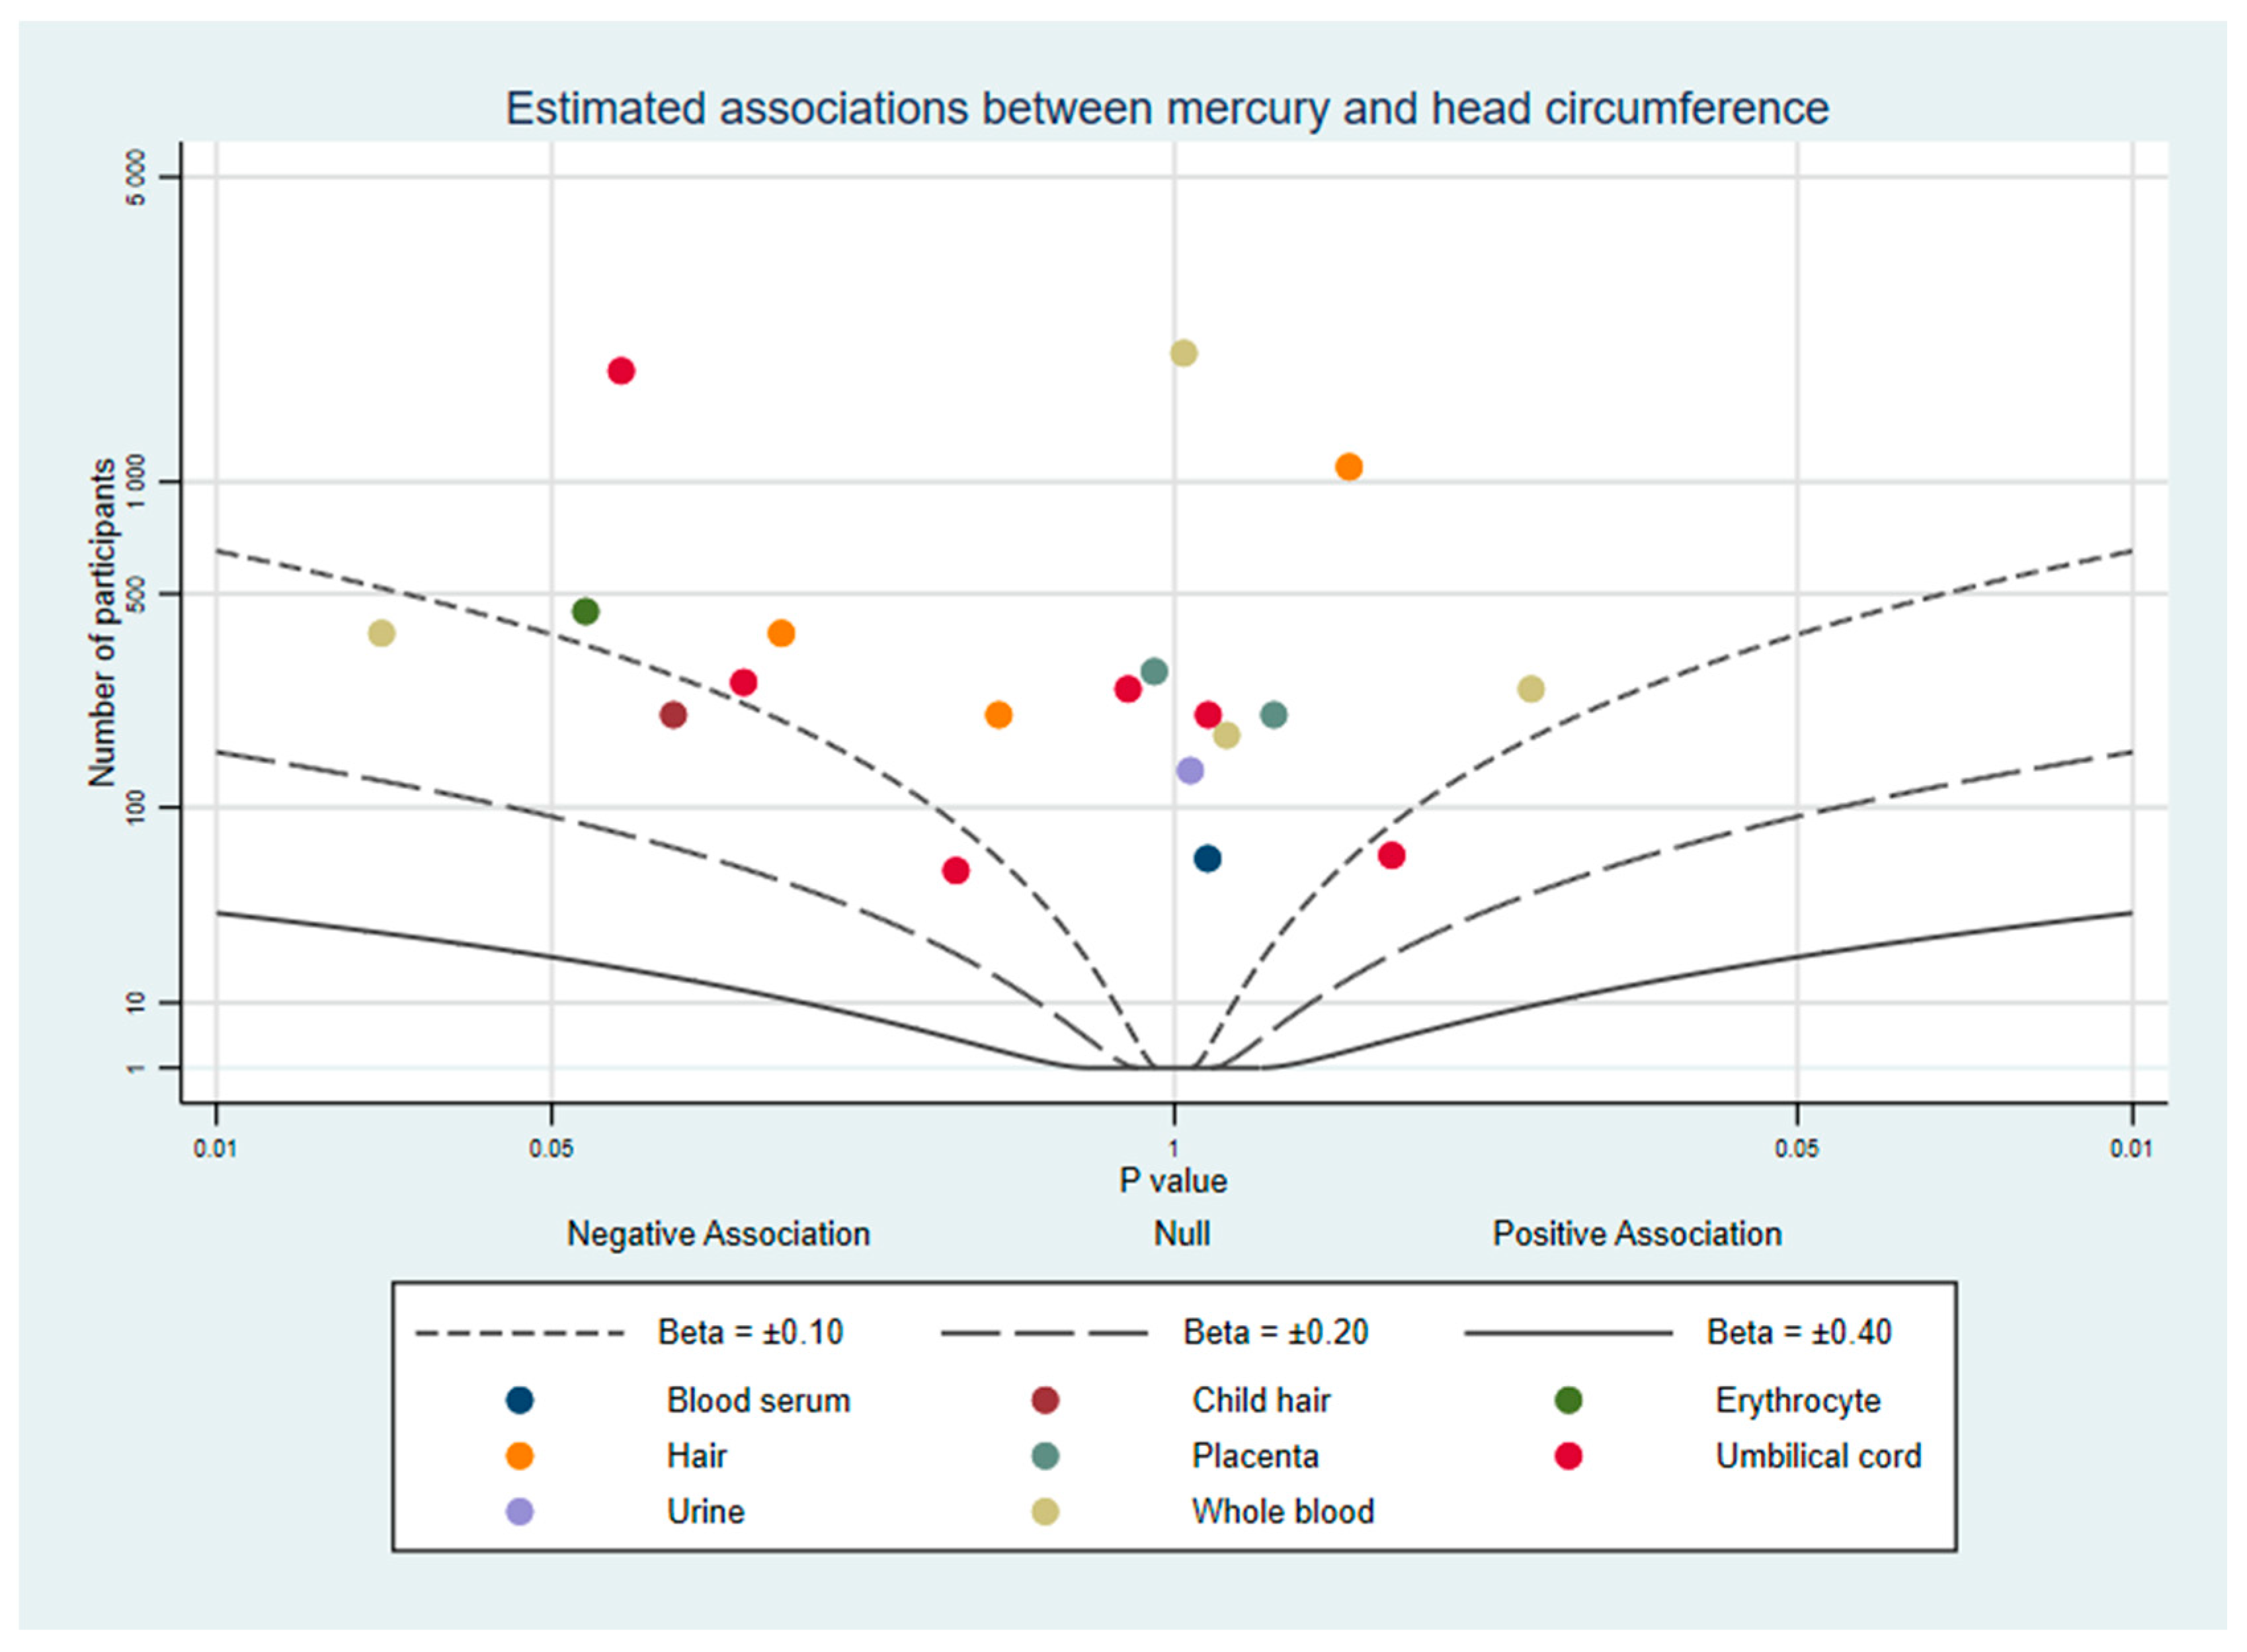
3.2.3. Head Circumference
4. Discussion
5. Conclusions
Supplementary Materials
Author Contributions
Funding
Data Availability Statement
Conflicts of Interest
Appendix A. Characteristics of Included Studies

| Study (Year) | Reference | Country | Study Design | Sampled Matrix | Timing of Exposure | Outcome | Sample Size 1 | Quality Assessment Criteria 2 |
|---|---|---|---|---|---|---|---|---|
| Baldewsingh et al. (2020) | [26] | Suriname | Prospective | Hair | 27 weeks gestation | Birth weight | 178 | 12 |
| Bashore et al. (2014) | [27] | USA | Prospective | Umbilical cord Urine | At delivery 6–9 months gestation | Birth weight Birth length Head circumference | 64–140 | 14 |
| Bloom et al. (2015) | [28] | USA | Prospective | Whole blood | Pre-pregnancy | Birth weight Birth length Head circumference | 182–232 | 13 |
| Ding et al. (2013) | [29] | China | Prospective | Umbilical cordWhole blood | At delivery Upon admission for delivery | Birth weight Birth length Head circumference | 258 | 13 |
| Eguchi et al. (2019) | [30] | Japan | Prospective | Blood serum | 32 weeks gestation | Birth weight Head circumference | 62 | 10 |
| Gustin et al. (2020) | [48] | Sweden | Prospective | Erythrocyte | 28 weeks gestation | Birth weight Birth length Head circumference | 101–444 | 12 |
| Howe et al. (2020) | [35] | USA | Prospective | Urine | 13 weeks gestation | Birth weight | 262 | 13 |
| Kim et al. (2017) | [36] | South Korea, Taiwan | Prospective | Umbilical cordWhole blood | At delivery 28–42 weeks gestation | Birth weight | 1147 | 10 |
| Lee et al. (2010) | [37] | South Korea | Prospective | Umbilical cordWhole blood | At delivery 12–20 and 28–42 weeks gestation | Birth weight | 417 | 12 |
| Taylor et al. (2016) | [41] | United Kingdom | Prospective | Whole blood | 11 weeks gestation | Birth weight Birth length Head circumference | 2345–2693 | 13 |
| Vigeh et al. (2018) | [49] | Japan | Prospective | Whole blood | First trimester | Birthweight | 334 | 16 |
| Al-Saleh et al. (2014) | [45] | Saudi Arabia | Cross-sectional | Placenta Umbilical cord | At delivery | Birth weight Birth length Head circumference | 247–249 | 10 |
| Arinola et al. (2018) | [46] | Nigeria | Cross-sectional | Whole blood | At delivery | Birth weight | 67 | 8 |
| Foldspang and Hansen (1990) | [47] | Greenland | Cross-sectional | Umbilical cord Whole blood | At delivery | Birth weight | 376 | 13 |
| Freire et al. (2019) | [31] | Spain | Cross-sectional | Placenta | At delivery | Birth weight Birth length Head circumference | 293–327 | 12 |
| Govarts et al. (2016) | [25] | Belgium | Cross-sectional | Hair | At delivery | Birth weight | 244 | 11 |
| Grandjean et al. (2001) | [32] | Faroe Islands | Cross-sectional | Umbilical cord | At delivery | Birth weight | 182 | 10 |
| Guo et al. (2013) | [33] | China | Cross-sectional | Child hair Hair Placenta Umbilical cord | At delivery | Birth weight Birth length Head circumference | 213 | 13 |
| Marques et al. (2013) | [38] | Brazil | Cross-sectional | Child hair Hair | At delivery | Birth weight | 1433 | 12 |
| Murcia et al. (2016) | [24] | Spain | Cross-sectional | Umbilical cord | At delivery | Birth weight Birth length Head circumference | 1869 | 13 |
| Rahbar et al. (2015) | [39] | Jamaica | Cross-sectional | Umbilical cord | At delivery | Birth weight Birth length Head circumference | 48–96 | 9 |
| Ramón et al. (2009) | [25] | Spain | Cross-sectional | Umbilical cord | At delivery | Birth weight Birth length | 132–144 | 12 |
| Tatsuta et al. (2017) | [40] | Japan | Cross-sectional | Umbilical cord | At delivery | Birthweight | 489 | 14 |
| Wells et al. (2016) | [43] | USA | Cross-sectional | Umbilical cord | At delivery | Birth weight Birth length Head circumference | 271 | 14 |
| van Wijngaarden et al. (2014) | [42] | Republic of Seychelles | Cross-sectional | Hair | At delivery | Birthweight | 230 | 12 |
| Yeates et al. (2020) | [44] | Republic of Seychelles | Cross-sectional | Hair | At delivery | Birth weight Birth length Head circumference | 1091–1111 | 11 |
| Hong (2017) | [34] | China | Cross-sectional (Doctoral dissertation) | Hair Whole blood | At delivery | Birth weight Birth length Head circumference | 383 | 13 |
Appendix B. Mercury Matrices
References
- Camerota, M.; Bollen, K.A. Birth Weight, Birth Length, and Gestational Age as Indicators of Favorable Fetal Growth Conditions in a US Sample. PLoS ONE 2016, 11, e0153800. [Google Scholar] [CrossRef]
- Blencowe, H.; Krasevec, J.; de Onis, M.; Black, R.E.; An, X.; Stevens, G.A.; Borghi, E.; Hayashi, C.; Estevez, D.; Cegolon, L.; et al. National, regional, and worldwide estimates of low birthweight in 2015, with trends from 2000: A systematic analysis. Lancet Glob. Health 2019, 7, e849–e860. [Google Scholar] [CrossRef] [Green Version]
- World Health Organization. Comprehensive Implementation Plan on Maternal, Infant and Young Child Nutrition. Available online: https://www.who.int/nutrition/publications/CIP_document/en/ (accessed on 20 March 2021).
- Katz, J.; Lee, A.C.; Kozuki, N.; Lawn, J.E.; Cousens, S.; Blencowe, H.; Ezzati, M.; Bhutta, Z.A.; Marchant, T.; Willey, B.A.; et al. Mortality risk in preterm and small-for-gestational-age infants in low-income and middle-income countries: A pooled country analysis. Lancet 2013, 382, 417–425. [Google Scholar] [CrossRef] [Green Version]
- Hack, M.; Klein, N.K.; Taylor, H.G. Long-term developmental outcomes of low birth weight infants. Future Child. 1995, 5, 176–196. [Google Scholar] [CrossRef]
- Negrato, C.A.; Gomes, M.B. Low birth weight: Causes and consequences. Diabetol. Metab. Syndr. 2013, 5, 49. [Google Scholar] [CrossRef] [Green Version]
- Wang, H.; Bhutta, Z.A.; Coates, M.M.; Coggeshall, M.; Dandona, L.; Diallo, K.; Franca, E.B.; Fraser, M.; Fullman, N.; Gething, P.W.; et al. Global, regional, national, and selected subnational levels of stillbirths, neonatal, infant, and under-5 mortality, 1980–2015: A systematic analysis for the Global Burden of Disease Study 2015. Lancet 2016, 388, 1725–1774. [Google Scholar] [CrossRef] [Green Version]
- Kwon, E.J.; Kim, Y.J. What is fetal programming? A lifetime health is under the control of in utero health. Obstet. Gynecol. Sci. 2017, 60, 506–519. [Google Scholar] [CrossRef]
- Shapira, N. Prenatal Nutrition: A Critical Window of Opportunity for Mother and Child. Women’s Health 2008, 4, 639–656. [Google Scholar] [CrossRef] [PubMed] [Green Version]
- Taylor, C.M.; Emmett, P.M.; Emond, A.M.; Golding, J. A review of guidance on fish consumption in pregnancy: Is it fit for purpose? Public Health Nutr. 2018, 21, 2149–2159. [Google Scholar] [CrossRef] [Green Version]
- Bose-O’Reilly, S.; McCarty, K.M.; Steckling, N.; Lettmeier, B. Mercury exposure and children’s health. Curr. Probl. Pediatr. Adolesc. Health Care 2010, 40, 186–215. [Google Scholar] [CrossRef] [PubMed] [Green Version]
- World Health Organization. Elemental Mercury and Inorganic Mercury Compounds: Human Health Aspects. Available online: https://apps.who.int/iris/handle/10665/42607 (accessed on 20 March 2021).
- Driscoll, C.T.; Mason, R.P.; Chan, H.M.; Jacob, D.J.; Pirrone, N. Mercury as a Global Pollutant: Sources, Pathways, and Effects. Environ. Sci. Technol. 2013, 47, 4967–4983. [Google Scholar] [CrossRef]
- Oliveira, C.S.; Nogara, P.A.; Ardisson-Araújo, D.M.P.; Aschner, M.; Rocha, J.B.T.; Dórea, J.G. Neurodevelopmental Effects of Mercury. Advances in Neurotoxicology 2018, 2, 27–86. [Google Scholar] [CrossRef]
- Lehnherr, I.; St. Louis, V.L.; Hintelmann, H.; Kirk, J.L. Methylation of inorganic mercury in polar marine waters. Nat. Geosci. 2011, 4, 298–302. [Google Scholar] [CrossRef]
- Environmental Protection Agency. Mercury in Consumer Products. Available online: https://www.epa.gov/mercury/mercury-consumer-products (accessed on 20 March 2021).
- Bernhoft, R.A. Mercury toxicity and treatment: A review of the literature. J. Environ. Public Health 2012, 2012, 460508. [Google Scholar] [CrossRef]
- Broussard, L.; Hammett-Stabler, C.; Winecker, R.; Ropero-Miller, J. The Toxicology of Mercury. Lab. Med. 2002, 33, 614–625. [Google Scholar] [CrossRef]
- Quality Assessment Tool for Observational Cohort and Cross-Sectional Studies. Available online: https://www.nhlbi.nih.gov/health-topics/study-quality-assessment-tools (accessed on 10 March 2021).
- Lederer, D.J.; Bell, S.C.; Branson, R.D.; Chalmers, J.D.; Marshall, R.; Maslove, D.M.; Ost, D.E.; Punjabi, N.M.; Schatz, M.; Smyth, A.R.; et al. Control of Confounding and Reporting of Results in Causal Inference Studies. Guidance for Authors from Editors of Respiratory, Sleep, and Critical Care Journals. Ann. Am. Thorac. Soc. 2018, 16, 22–28. [Google Scholar] [CrossRef] [PubMed] [Green Version]
- Harrison, S.; Jones, H.E.; Martin, R.M.; Lewis, S.J.; Higgins, J.P.T. The albatross plot: A novel graphical tool for presenting results of diversely reported studies in a systematic review. Res. Synth. Methods 2017, 8, 281–289. [Google Scholar] [CrossRef] [Green Version]
- Altman, D.G.; Bland, J.M. How to obtain the P value from a confidence interval. BMJ 2011, 343, d2304. [Google Scholar] [CrossRef] [Green Version]
- Govarts, E.; Remy, S.; Bruckers, L.; Den Hond, E.; Sioen, I.; Nelen, V.; Baeyens, W.; Nawrot, T.S.; Loots, I.; Van Larebeke, N.; et al. Combined Effects of Prenatal Exposures to Environmental Chemicals on Birth Weight. Int. J. Environ. Res. Public Health 2016, 13, 495. [Google Scholar] [CrossRef] [Green Version]
- Murcia, M.; Ballester, F.; Enning, A.M.; Iñiguez, C.; Valvi, D.; Basterrechea, M.; Rebagliato, M.; Vioque, J.; Maruri, M.; Tardon, A.; et al. Prenatal mercury exposure and birth outcomes. Environ. Res. 2016, 151, 11–20. [Google Scholar] [CrossRef]
- Ramón, R.; Ballester, F.; Aguinagalde, X.; Amurrio, A.; Vioque, J.; Lacasaña, M.; Rebagliato, M.; Murcia, M.; Iñiguez, C. Fish consumption during pregnancy, prenatal mercury exposure, and anthropometric measures at birth in a prospective mother-infant cohort study in Spain. Am. J. Clin. Nutr. 2009, 90, 1047–1055. [Google Scholar] [CrossRef] [Green Version]
- Baldewsingh, G.; Wickliffe, J.; van Eer, E.; Shankar, A.; Hindori-Mohangoo, A.; Harville, E.; Covert, H.; Shi, L.; Lichtveld, M.; Zijlmans, W. Prenatal Mercury Exposure in Pregnant Women from Suriname’s Interior and Its Effects on Birth Outcomes. Int. J. Environ. Res. Public Health 2020, 17, 4032. [Google Scholar] [CrossRef]
- Bashore, C.; Geer, L.; He, X.; Puett, R.; Parsons, P.; Palmer, C.; Steuerwald, A.; Abulafia, O.; Dalloul, M.; Sapkota, A. Maternal Mercury Exposure, Season of Conception and Adverse Birth Outcomes in an Urban Immigrant Community in Brooklyn, New York, USA. Int. J. Environ. Res. Public Health 2014, 11, 8414–8442. [Google Scholar] [CrossRef] [PubMed] [Green Version]
- Bloom, M.S.; Buck Louis, G.M.; Sundaram, R.; Maisog, J.M.; Steuerwald, A.J.; Parsons, P.J. Birth outcomes and background exposures to select elements, the Longitudinal Investigation of Fertility and the Environment (LIFE). Environ. Res. 2015, 138, 118–129. [Google Scholar] [CrossRef] [PubMed] [Green Version]
- Ding, G.; Cui, C.; Chen, L.; Gao, Y.; Zhou, Y.; Shi, R.; Tian, Y. Prenatal low-level mercury exposure and neonatal anthropometry in rural northern China. Chemosphere 2013, 92, 1085–1089. [Google Scholar] [CrossRef]
- Eguchi, A.; Yanase, K.; Yamamoto, M.; Sakurai, K.; Watanabe, M.; Todaka, E.; Mori, C. The relationship of maternal PCB, toxic, and essential trace element exposure levels with birth weight and head circumference in Chiba, Japan. Environ. Sci. Pollut. Res. Int. 2019, 26, 15677–15684. [Google Scholar] [CrossRef]
- Freire, C.; Amaya, E.; Gil, F.; Murcia, M.; Llop, S.; Casas, M.; Vrijheid, M.; Lertxundi, A.; Irizar, A.; Fernández-Tardón, G.; et al. Placental metal concentrations and birth outcomes: The Environment and Childhood (INMA) project. Int. J. Hyg. Environ. Health 2019, 222, 468–478. [Google Scholar] [CrossRef] [PubMed]
- Grandjean, P.; Bjerve, K.S.; Weihe, P.; Steuerwald, U. Birthweight in a fishing community: Significance of essential fatty acids and marine food contaminants. Int. J. Epidemiol. 2001, 30, 1272–1278. [Google Scholar] [CrossRef] [PubMed] [Green Version]
- Guo, B.-Q.; Cai, S.-Z.; Guo, J.-L.; Xu, J.; Wu, W.; Li, H.; Zhou, X.; Kim, D.-S.; Yan, C.-H.; Lü, H.-D. Levels of prenatal mercury exposure and their relationships to neonatal anthropometry in Wujiang City, China. Environ. Pollut. 2013, 182, 184–189. [Google Scholar] [CrossRef] [PubMed]
- Hong, C. Prenatal Methylmercury Exposure through Rice Consumption in Rural China. (Doctoral Dissertation, 2017). Available online: https://scholarcommons.sc.edu/etd/4006 (accessed on 10 March 2021).
- Howe, C.G.; Henn, B.C.; Eckel, S.P.; Farzan, S.F.; Grubbs, B.H.; Chavez, T.A.; Hodes, T.L.; Faham, D.; Al-Marayati, L.; Lerner, D.; et al. Prenatal Metal Mixtures and Birth Weight for Gestational Age in a Predominately Lower-Income Hispanic Pregnancy Cohort in Los Angeles. Environ. Health Perspect. 2020, 128, 117001. [Google Scholar] [CrossRef] [PubMed]
- Kim, B.M.; Chen, M.H.; Chen, P.C.; Park, H.; Ha, M.; Kim, Y.; Hong, Y.C.; Kim, Y.J.; Ha, E.H. Path analysis of prenatal mercury levels and birth weights in Korean and Taiwanese birth cohorts. Sci. Total Environ 2017, 605–606, 1003–1010. [Google Scholar] [CrossRef]
- Lee, B.-E.; Hong, Y.-C.; Park, H.; Ha, M.; Koo, B.S.; Chang, N.; Roh, Y.-M.; Kim, B.-N.; Kim, Y.-J.; Kim, B.-M.; et al. Interaction between GSTM1/GSTT1 polymorphism and blood mercury on birth weight. Environ. Health Perspect. 2010, 118, 437–443. [Google Scholar] [CrossRef] [Green Version]
- Marques, R.C.; Bernardi, J.V.E.; Dórea, J.G.; Brandão, K.G.; Bueno, L.; Leão, R.S.; Malm, O. Fish consumption during pregnancy, mercury transfer, and birth weight along the Madeira River Basin in Amazonia. Int. J. Environ. Res. Public Health 2013, 10, 2150–2163. [Google Scholar] [CrossRef] [PubMed] [Green Version]
- Rahbar, M.H.; Samms-Vaughan, M.; Dickerson, A.S.; Hessabi, M.; Bressler, J.; Desai, C.C.; Shakespeare-Pellington, S.; Reece, J.A.; Morgan, R.; Loveland, K.A.; et al. Concentration of lead, mercury, cadmium, aluminum, arsenic and manganese in umbilical cord blood of Jamaican newborns. Int. J. Environ. Res. Public Health 2015, 12, 4481–4501. [Google Scholar] [CrossRef]
- Tatsuta, N.; Kurokawa, N.; Nakai, K.; Suzuki, K.; Iwai-Shimada, M.; Murata, K.; Satoh, H. Effects of intrauterine exposures to polychlorinated biphenyls, methylmercury, and lead on birth weight in Japanese male and female newborns. Environ. Health Prev. Med. 2017, 22, 39. [Google Scholar] [CrossRef] [PubMed] [Green Version]
- Taylor, C.M.; Golding, J.; Emond, A.M. Blood mercury levels and fish consumption in pregnancy: Risks and benefits for birth outcomes in a prospective observational birth cohort. Int. J. Hyg. Environ. Health 2016, 219, 513–520. [Google Scholar] [CrossRef] [PubMed] [Green Version]
- van Wijngaarden, E.; Harrington, D.; Kobrosly, R.; Thurston, S.W.; O’Hara, T.; McSorley, E.M.; Myers, G.J.; Watson, G.E.; Shamlaye, C.F.; Strain, J.J.; et al. Prenatal exposure to methylmercury and LCPUFA in relation to birth weight. Ann. Epidemiol. 2014, 24, 273–278. [Google Scholar] [CrossRef] [Green Version]
- Wells, E.M.; Herbstman, J.B.; Lin, Y.H.; Jarrett, J.; Verdon, C.P.; Ward, C.; Caldwell, K.L.; Hibbeln, J.R.; Witter, F.R.; Halden, R.U.; et al. Cord Blood Methylmercury and Fetal Growth Outcomes in Baltimore Newborns: Potential Confounding and Effect Modification by Omega-3 Fatty Acids, Selenium, and Sex. Environ. Health Perspect. 2016, 124, 373–379. [Google Scholar] [CrossRef] [Green Version]
- Yeates, A.J.; Zavez, A.; Thurston, S.W.; McSorley, E.M.; Mulhern, M.S.; Alhamdow, A.; Engström, K.; Wahlberg, K.; Strain, J.J.; Watson, G.E.; et al. Maternal Long-Chain Polyunsaturated Fatty Acid Status, Methylmercury Exposure, and Birth Outcomes in a High-Fish-Eating Mother-Child Cohort. J. Nutr. 2020, 150, 1749–1756. [Google Scholar] [CrossRef]
- Al-Saleh, I.; Al-Rouqi, R.; Obsum, C.A.; Shinwari, N.; Mashhour, A.; Billedo, G.; Al-Sarraj, Y.; Rabbah, A. Mercury (Hg) and oxidative stress status in healthy mothers and its effect on birth anthropometric measures. Int. J. Hyg. Environ. Health 2014, 217, 567–585. [Google Scholar] [CrossRef] [PubMed]
- Arinola, G.O.; Dutta, A.; Oluwole, O.; Olopade, C.O. Household Air Pollution, Levels of Micronutrients and Heavy Metals in Cord and Maternal Blood, and Pregnancy Outcomes. Int. J. Environ. Res. Public Health 2018, 15, 2891. [Google Scholar] [CrossRef] [Green Version]
- Foldspang, A.; Hansen, J.C. Dietary intake of methylmercury as a correlate of gestational length and birth weight among newborns in Greenland. Am. J. Epidemiol. 1990, 132, 310–317. [Google Scholar] [CrossRef] [PubMed]
- Gustin, K.; Barman, M.; Stråvik, M.; Levi, M.; Englund-Ögge, L.; Murray, F.; Jacobsson, B.; Sandberg, A.S.; Sandin, A.; Wold, A.E.; et al. Low-level maternal exposure to cadmium, lead, and mercury and birth outcomes in a Swedish prospective birth-cohort. Environ. Pollut. 2020, 265, 114986. [Google Scholar] [CrossRef] [PubMed]
- Vigeh, M.; Nishioka, E.; Ohtani, K.; Omori, Y.; Matsukawa, T.; Koda, S.; Yokoyama, K. Prenatal mercury exposure and birth weight. Reprod. Toxicol. 2018, 76, 78–83. [Google Scholar] [CrossRef] [PubMed]
- Nagpal, N.; Bettiol, S.S.; Isham, A.; Hoang, H.; Crocombe, L.A. A Review of Mercury Exposure and Health of Dental Personnel. Saf. Health Work 2017, 8, 1–10. [Google Scholar] [CrossRef] [PubMed] [Green Version]
- World Health Organization. Guidance for Identifying Populations at Risk from Mercury Exposure. Available online: https://www.who.int/foodsafety/publications/risk-mercury-exposure/en/ (accessed on 1 June 2020).
- Næss, S.; Kjellevold, M.; Dahl, L.; Nerhus, I.; Midtbø, L.K.; Bank, M.S.; Rasinger, J.D.; Markhus, M.W. Effects of seafood consumption on mercury exposure in Norwegian pregnant women: A randomized controlled trial. Environ. Int. 2020, 141, 105759. [Google Scholar] [CrossRef]
- Moon, S.-W.; Gwak, J.-I.; Park, Y.-H. The Effect of Smoking and Second-Hand Smoking on the Concentration of Mercury, Lead and Cadmium in the Blood: Based on the Fifth Korea National Health and Nutrition Examination Survey. Korean J. Fam. Pract. 2016, 6, 44–48. [Google Scholar] [CrossRef]
- CDC. Environmental Exposures: Mercury. Available online: https://www.cdc.gov/breastfeeding/breastfeeding-special-circumstances/environmental-exposures/mercury.htm (accessed on 28 March 2021).
- NHS. Foods to Avoid in Pregnancy. Available online: https://www.nhs.uk/pregnancy/keeping-well/foods-to-avoid/ (accessed on 28 March 2021).
- Oken, E.; Kleinman, K.P.; Berland, W.E.; Simon, S.R.; Rich-Edwards, J.W.; Gillman, M.W. Decline in fish consumption among pregnant women after a national mercury advisory. Obstet. Gynecol. 2003, 102, 346–351. [Google Scholar] [CrossRef]
- Al-Tikriti, K.; Al-Mufti, A.W. An outbreak of organomercury poisoning among Iraqi farmers. Bull. World Health Organ. 1976, 53, 15–21. [Google Scholar]
- James, A.K.; Nehzati, S.; Dolgova, N.V.; Sokaras, D.; Kroll, T.; Eto, K.; O’Donoghue, J.L.; Watson, G.E.; Myers, G.J.; Krone, P.H.; et al. Rethinking the Minamata Tragedy: What Mercury Species Was Really Responsible? Environ. Sci. Technol. 2020, 54, 2726–2733. [Google Scholar] [CrossRef]
- Skerfving, S.B.; Copplestone, J.F. Poisoning caused by the consumption of organomercury-dressed seed in Iraq. Bull. World Health Organ. 1976, 54, 101–112. [Google Scholar]
- Harada, M. Minamata Disease: Methylmercury Poisoning in Japan Caused by Environmental Pollution. Crit. Rev. Toxicol. 1995, 25, 1–24. [Google Scholar] [CrossRef]
- Branco, V.; Caito, S.; Farina, M.; Teixeira da Rocha, J.; Aschner, M.; Carvalho, C. Biomarkers of mercury toxicity: Past, present, and future trends. J. Toxicol. Environ. Health B Crit. Rev. 2017, 20, 119–154. [Google Scholar] [CrossRef] [PubMed]
- Castro, N.S.S.; Lima, M.O. Hair as a Biomarker of Long Term Mercury Exposure in Brazilian Amazon: A Systematic Review. Int. J. Environ. Res. Public Health 2018, 15, 500. [Google Scholar] [CrossRef] [PubMed] [Green Version]
- Singh, N.; Gupta, V.K.; Kumar, A.; Sharma, B. Synergistic Effects of Heavy Metals and Pesticides in Living Systems. Front. Chem. 2017, 5, 70. [Google Scholar] [CrossRef] [PubMed]
- Dang, F.; Wang, W.X. Antagonistic interaction of mercury and selenium in a marine fish is dependent on their chemical species. Environ. Sci. Technol. 2011, 45, 3116–3122. [Google Scholar] [CrossRef] [PubMed]
- Ye, B.-J.; Kim, B.-G.; Jeon, M.-J.; Kim, S.-Y.; Kim, H.-C.; Jang, T.-W.; Chae, H.-J.; Choi, W.-J.; Ha, M.-N.; Hong, Y.-S. Evaluation of mercury exposure level, clinical diagnosis and treatment for mercury intoxication. Ann. Occup. Environ. Med. 2016, 28, 1–8. [Google Scholar] [CrossRef] [PubMed] [Green Version]
- Lindstedt, G.; Gottberg, I.; Holmgren, B.; Jonsson, T.; Karlsson, G. Individual mercury exposure of chloralkali workers and its relation to blood and urinary mercury levels. Scand. J. Work Environ. Health 1979, 5, 59–69. [Google Scholar] [CrossRef] [Green Version]
- Grandjean, P.; Budtz-Jørgensen, E.; Jørgensen, P.J.; Weihe, P. Umbilical Cord Mercury Concentration as Biomarker of Prenatal Exposure to Methylmercury. Environ. Health Perspect. 2005, 113, 905–908. [Google Scholar] [CrossRef] [Green Version]
- Tong, M.; Yu, J.; Liu, M.; Li, Z.; Wang, L.; Yin, C.; Ren, A.; Chen, L.; Jin, L. Total mercury concentration in placental tissue, a good biomarker of prenatal mercury exposure, is associated with risk for neural tube defects in offspring. Environ. Int. 2021, 150, 106425. [Google Scholar] [CrossRef]
- Czajkowska, M.; Chrobaczynska, M.; Suprewicz, K.; Ciaglo, A.; Stawarz, R.; Formicki, G.; Skalba, P. Accumulation of mercury in placenta and amnion of women from Upper Silesian Region—Poland. In Proceedings of the 15th International Conference on Heavy Metals in the Environment, Gdansk, Poland, 19–23 September 2010; Żaneta, B., Beyer, A., Klimaszewska, K., Namieśnik, J., Tobiszewski, M., Rutkiewicz, I., Eds.; Gdansk University of Technology: Gdansk, Poland, 2010; pp. 547–550. [Google Scholar]


| Include | Exclude |
|---|---|
| 1. Study of total mercury, inorganic, organic, and/or methylmercury compounds. | 1. Studies other compounds including ethylmercury. |
| 2. Measures mercury in pregnant women, new-born infants. | 2. Measures mercury in other populations. |
| 3. Measures mercury concentrations in biological matrices: blood (whole, erythrocyte, plasma, serum), urine, cord blood/tissue, placenta, and/or hair. | 3. Uses any other measure of mercury exposure. |
| 5. Reports association between mercury and either birthweight, birth length, and/or birth head circumference. | 5. Does not report associations between mercury and specified outcomes. |
| 6. Study reports results from multivariable analysis methods. | 6. Study reports results only from univariable methods such as correlations or t-tests. |
| 7. Study of humans. | 7. Animal or cellular study. |
| Study Design | n | Outcome | n |
| Cross-sectional | 16 | Birth weight | 27 |
| Prospective | 11 | Birth length | 14 |
| Head circumference | 14 | ||
| Country | n | n | |
| Belgium | 1 | Saudi Arabia | 1 |
| Brazil | 1 | South Korea | 2 |
| China | 3 | Spain | 3 |
| Faroe Islands | 1 | Suriname | 1 |
| Greenland | 1 | Sweden | 1 |
| Jamaica | 1 | Taiwan | 1 |
| Japan | 3 | United Kingdom | 1 |
| Nigeria | 1 | USA | 4 |
| Republic of Seychelles | 2 | ||
| Sampled Matrix | n | Mercury Analysis Method | n |
| Maternal whole blood | 9 | Atomic absorption spectroscopy (AAS) | 10 |
| Maternal blood serum | 1 | Cold vapor atomic absorption spectrometry (CVAAS) | 6 |
| Maternal erythrocyte | 1 | Cold vapor atomic fluorescence spectroscopy (CV-AFS) | 1 |
| Maternal hair | 6 | Headspace gas chromatography atomic fluorescence spectrometry (HG-GC-AFS) | 1 |
| Maternal urine | 2 | Inductively coupled plasma mass spectrometry (ICP-MS) | 9 |
| Umbilical cord (blood or tissue) | 13 | Not stated | 1 |
| Placenta | 3 | ||
| Child hair | 2 |
Publisher’s Note: MDPI stays neutral with regard to jurisdictional claims in published maps and institutional affiliations. |
© 2021 by the authors. Licensee MDPI, Basel, Switzerland. This article is an open access article distributed under the terms and conditions of the Creative Commons Attribution (CC BY) license (https://creativecommons.org/licenses/by/4.0/).
Share and Cite
Dack, K.; Fell, M.; Taylor, C.M.; Havdahl, A.; Lewis, S.J. Mercury and Prenatal Growth: A Systematic Review. Int. J. Environ. Res. Public Health 2021, 18, 7140. https://doi.org/10.3390/ijerph18137140
Dack K, Fell M, Taylor CM, Havdahl A, Lewis SJ. Mercury and Prenatal Growth: A Systematic Review. International Journal of Environmental Research and Public Health. 2021; 18(13):7140. https://doi.org/10.3390/ijerph18137140
Chicago/Turabian StyleDack, Kyle, Matthew Fell, Caroline M. Taylor, Alexandra Havdahl, and Sarah J. Lewis. 2021. "Mercury and Prenatal Growth: A Systematic Review" International Journal of Environmental Research and Public Health 18, no. 13: 7140. https://doi.org/10.3390/ijerph18137140
APA StyleDack, K., Fell, M., Taylor, C. M., Havdahl, A., & Lewis, S. J. (2021). Mercury and Prenatal Growth: A Systematic Review. International Journal of Environmental Research and Public Health, 18(13), 7140. https://doi.org/10.3390/ijerph18137140