Article

Predicting Spatial Patterns of Sindbis Virus (SINV) Infection Risk in Finland Using Vector, Host and Environmental Data

1
Department of Geosciences and Geography, University of Helsinki, P.O. Box 64, FI-00014 Helsinki, Finland
2
Department of Virology, University of Helsinki, Haartmaninkatu 3, P.O. Box 21, FI-00014 Helsinki, Finland
3
Department of Veterinary Biosciences, University of Helsinki, Agnes Sjöberginkatu 2, P.O. Box 66, FI-00014 Helsinki, Finland
4
Department of Life Sciences, Natural History Museum, Cromwell Road, London SW5 7BD, UK
5
AVIA-GIS, Risschotlei 33, 2980 Zoersel, Belgium
6
Natural Resources Institute Finland (LUKE), P.O. Box 2, FI-00791 Helsinki, Finland
7
Department of Health Security, Finnish Institute for Health and Welfare, P.O. Box 30, FI-00271 Helsinki, Finland
8
Finnish Meteorological Institute, P.O. Box 503, FI-00101 Helsinki, Finland
9
Helsinki Institute of Sustainability Science, University of Helsinki, P.O. Box 4, FI-00014 Helsinki, Finland
10
Institute for Atmospheric and Earth System Research, University of Helsinki, P.O. Box 64, FI-00014 Helsinki, Finland
11
Virology and Immunology, Diagnostic Center, HUSLAB, Helsinki University Hospital, P.O. Box 400, FI-00029 Helsinki, Finland
*
Author to whom correspondence should be addressed.
Int. J. Environ. Res. Public Health 2021, 18(13), 7064; https://doi.org/10.3390/ijerph18137064
Submission received: 26 May 2021 / Revised: 27 June 2021 / Accepted: 28 June 2021 / Published: 1 July 2021

Abstract

:
Pogosta disease is a mosquito-borne infection, caused by Sindbis virus (SINV), which causes epidemics of febrile rash and arthritis in Northern Europe and South Africa. Resident grouse and migratory birds play a significant role as amplifying hosts and various mosquito species, including Aedes cinereus, Culex pipiens, Cx. torrentium and Culiseta morsitans are documented vectors. As specific treatments are not available for SINV infections, and joint symptoms may persist, the public health burden is considerable in endemic areas. To predict the environmental suitability for SINV infections in Finland, we applied a suite of geospatial and statistical modeling techniques to disease occurrence data. Using an ensemble approach, we first produced environmental suitability maps for potential SINV vectors in Finland. These suitability maps were then combined with grouse densities and environmental data to identify the influential determinants for SINV infections and to predict the risk of Pogosta disease in Finnish municipalities. Our predictions suggest that both the environmental suitability for vectors and the high risk of Pogosta disease are focused in geographically restricted areas. This provides evidence that the presence of both SINV vector species and grouse densities can predict the occurrence of the disease. The results support material for public-health officials when determining area-specific recommendations and deliver information to health care personnel to raise awareness of the disease among physicians.

1. Introduction

Mosquito-borne viruses are responsible for many notable human diseases worldwide and their transmission is a result of complex interactions between climate, vectors, vertebrate hosts and human behaviour [1,2]. Spatial analysis and statistical modeling approaches are commonly used to understand these interactions and their implications for the spread of vector-borne diseases [3,4,5,6]. While high and low temperature extremes are increasing, winter, in particular, may offer favourable conditions for the spread of exotic vector-borne diseases. Endemic mosquito-borne pathogens including Sindbis virus (SINV) are already circulating in northern Europe [7]. Sindbis virus circulates within an enzootic transmission cycle involving mosquito vectors and avian hosts, but it is transmitted to humans via bridge vector species in epidemic transmission events [8]. Spatial modeling approaches can predict vector distributions and infectious disease risks, and therefore may provide strategies for more efficient resource allocation regarding targeted surveillance, prevention, and control [9,10].
Mosquito-transmitted SINV is a member of the Western equine encephalitis antigenic complex of alphaviruses that was originally isolated from Culex pipiens Linneaus and/or Culex univittatus Theobald collected in Sindbis village, Nile Delta (Egypt) in 1952 [11,12]. Pogosta disease also known as Sindbis fever, Ockelbo disease in Sweden, and Karelian fever in Russian Karelia, is the result of SINV infection in humans. It manifests with fever, rash, headache, myalgia, arthralgia, nausea, conjunctivitis and pharyngitis. After the acute phase, long-lasting joint pain and tendon insertions occur in 25% of infected individuals [13,14,15,16]. The incubation period for SINV is 5–7 days before the onset of symptoms with IgM and IgG antibodies are detectable within 8 and 11 days since onset, respectively, resulting a time lag of 2–3 weeks from transmission to serological diagnosis [15,17]. As no vaccine or specific etiologic treatment is available, clinical care is strictly symptomatic [17]. Infections are notifiable in Australia and some European, Asian and African countries [18], but despite widespread circulation of SINV in Australasia and Africa, human outbreaks are associated only with SINV genotype I (SINV-I), and have only been documented in Northern Europe and South Africa [19,20,21]. In Finland, tularemia and Pogosta disease are the two most common mosquito-borne diseases [22]. Pogosta disease cases are recorded annually, and the estimated seroprevalence of SINV was 5.2% between 1995–2003. A disease epidemic has been seen approximately every seven years, where hundreds or even thousands of patients are infected, until 2009, when an anticipated outbreak did not occur [23,24]. The majority of clinical cases in Northern Europe occur in August and September [25], coinciding with the temporal distribution of the bridge vectors Aedes cinereus Meigen, and Culex pipiens Linnaeus [8]. However, there is no national public health surveillance for SINV in mosquitoes in Finland. Aedes cinereus and Culex pipiens are abundant during the late summer and early autumn in Finland, a time when the relative humidity increases throughout the country.
Sindbis virus mainly circulates in enzootic cycles between birds, which act as amplifying hosts, including both resident grouse (Galliformes) and migratory birds, mainly passerines, such as thrushes (Turdidae) [21,23,26]. Ornithophilic mosquitoes, Culex pipiens, Cx. torrentium Martini and Culiseta morsitans Theobald maintain the virus in these cycles [26,27]. In addition, Aedes cinereus and Culex pipiens are bridge vectors, which transmit the virus from birds to humans [13,28,29,30]. In recent studies, SINV-I has also been detected in or isolated from Ochlerotatus species [31,32,33], which would implicate their potential as additional bridge vectors. Females, which are zoophilic and anthropophilic, are morphologically identical to Ae. geminus Peus, whose role in transmission cycles is poorly understood. While both Cx. pipiens and Cx. torrentium are ornithophilic, Cx. pipiens is also known to occasionally bite humans. In contrast, Cx. torrentium has been reported to not bite humans, even in a laboratory setting [34]. Culiseta morsitans adults are ornithophilic, but have occasionally been observed to bite reptiles, small mammals and humans [34]. The overwintering mechanisms of SINV in bird hosts are largely unknown. Most of the studies have detected SINV in mosquitoes, but some experimental vector-competence work has been done on Culex pipiens and Cx. torrentium [35]. Although a mosquito could have picked up the virus in its blood meal, and the virus from that blood meal could be detected, this is usually considered in virus studies and the blood-fed individuals are sorted separately from the rest of the specimens for processing and analysis. In Sweden, SINV has also been detected in hibernating, on-blood fed Cx. pipiens mosquitoes, suggesting that the virus also overwinters in this vector species, which may be important mechanism for virus survival and persistence in nature [36].
Climate plays an important role in the transmission of vector-borne diseases, since arthropods, including mosquitoes, are sensitive to changes in environmental conditions. Weather, climate change and the environment influence the habitat suitability, vector activity and the rate of vector development [13,37,38,39]. The replication of pathogens within vectors occurs faster at warm temperatures [40]. Temperature and precipitation patterns also influence vector densities [41,42]. Generally, warm temperatures and increased rainfall positively affect vector densities but extreme high temperatures combined with decreased rainfall may reduce mosquito populations [43]. The duration of vector development is also influenced by the thickness of snow cover, especially in the spring [44]. Outbreaks of Pogosta disease have been strongly concentrated in primarily eastern and central regions in Finland with dense forest cover and abundant lakes (Figure 1a), implying a good potential for predicting and understanding the drivers of the observed spatial pattern. In an earlier study, snow depth, air temperature in May–July and the proportion of regulated lakes have been found to influence the number of SINV infections [21,45]. Despite these observations, the presence or abundance of known vector and host species have not been studied to determine their effects on the risk of human Pogosta disease infections in Finland.
In this study, we apply spatial analysis—in particular geographic information system (GIS) and species distribution modeling (SDM) techniques—to better understand how biotic and environmental drivers contribute to the distinct distribution of the Pogosta disease risk in Finland. More specifically, the objectives of this study were to (1) predict the environmental suitability and spatial distribution of vectors known to transmit SINV, (2) to use the resulting predictions together with host and environmental data to estimate the risk of Pogosta disease across Finland, and (3) to identify the most influential predictors driving the spatial patterns of this risk.

2. Materials and Methods

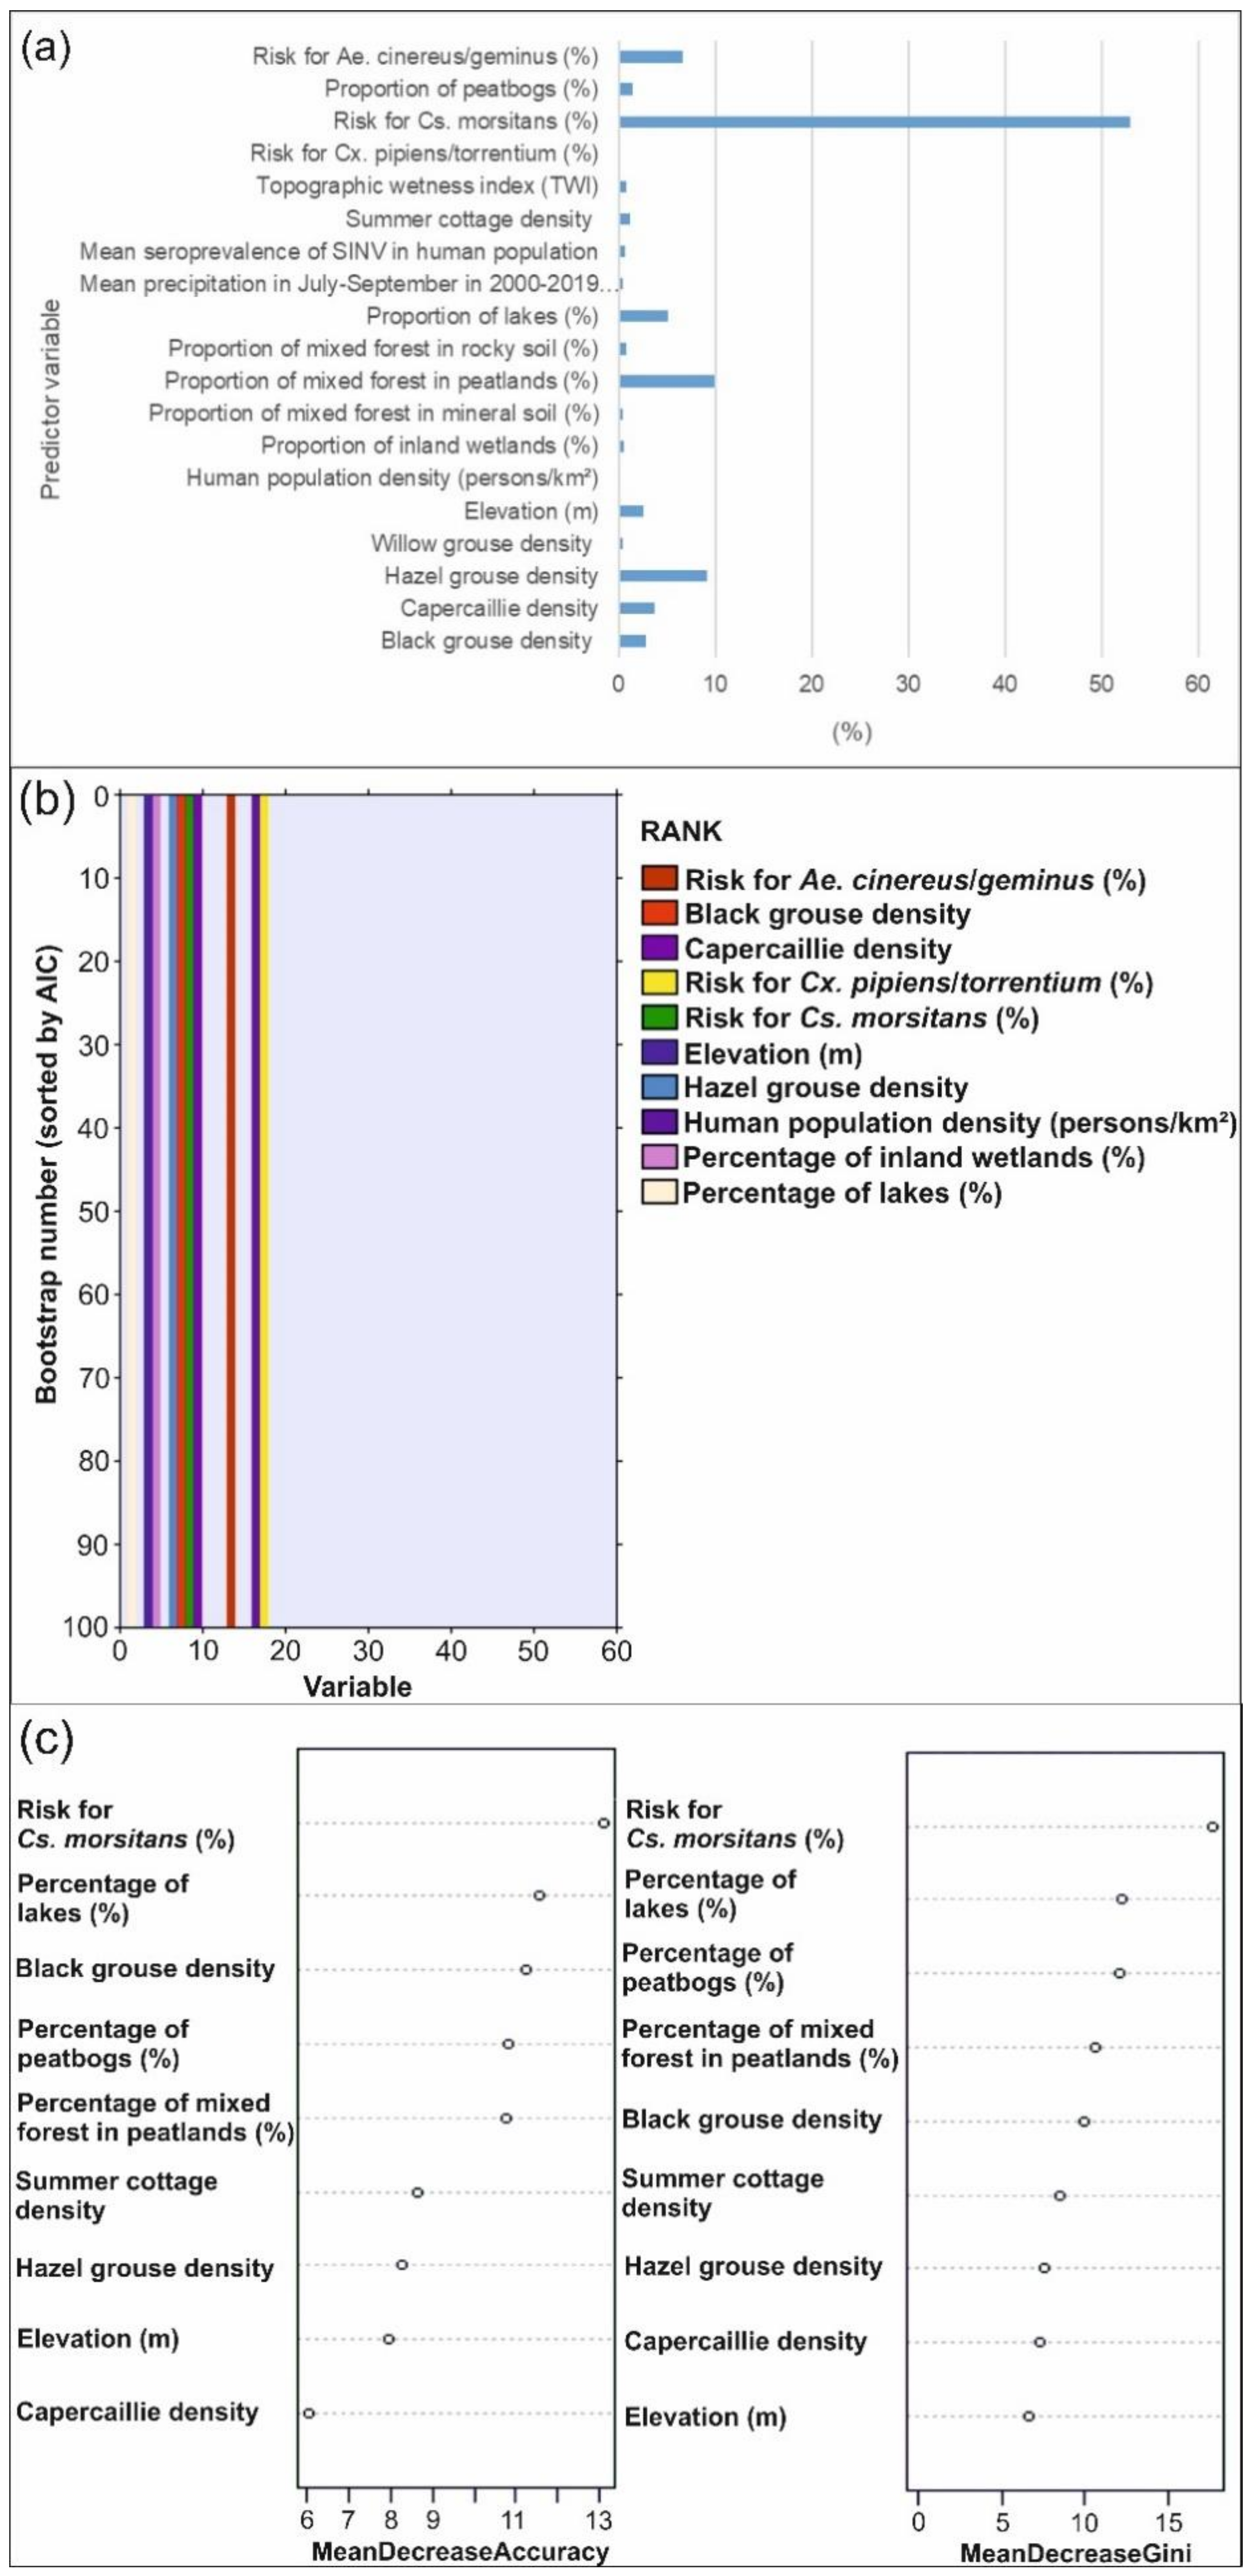
2.1. Pogosta Disease Data

Finland (59°50′ N, 20°38′ E, 70°09′ N, 31°30′ E), located in Northern Europe between Sweden and Russia (Figure 1a,b), is subdivided at various administrative levels following the Nomenclature of Territorial Units for Statistics (NUTS) system. Patient data was obtained from the National Infectious Diseases Register [22], which included serologically confirmed Pogosta disease cases (n = 1825) by municipality of residence from 2000–2019 (Figure 1a). Data on laboratory-confirmed SINV infections is collected routinely through the NIDR. By law, Finnish laboratories are expected to notify findings of a number of microbes specified in the Finnish Communicable Disease Act and Decree, including Sindbis virus infection. A laboratory notification contains the following: identification information, place of treatment, place of residence, specimen collection date, findings, laboratory method, and reporting laboratory [22].
An average of 91 cases were reported annually (varying from 8 to 597) with an incidence of 1.7/100,000. We calculated the incidences for each municipality per 1000 inhabitants between 2000–2019 and calculated the average incidence of all municipalities (0.48/1000) over a 20-year period (Figure 1b). Municipalities with incidence rates above 0.48 were set as a threshold for ‘presence’ municipalities (n = 97), and the rest were considered as ‘absence’ municipalities (n = 213; Figure 1b).
While cases of Pogosta disease were detected annually, outbreaks, defined in this study as annual occurrence of over 100 cases, were reported in 2000, 2002, 2003, 2009, 2012 and 2013 (Figure 1c). Although no outbreaks occurred after 2013, 72 cases were registered in 2018. Most diagnoses were made and notified in September (on average 48 annual cases over the study period), but many were also notified in August and October (30 and 9 on average, respectively; Figure 1d). During the winter and summer months (excluding August), the number of cases remained low.

2.2. Data of Potential SINV Vectors

Mosquito presence data were collected in Finland in 2009 [46], and presence/absence data between 2012–2018 [47]; these were combined for potential SINV vectors. Due to the lack of reliable identification methods to distinguish adult females of Cx. pipiens from Cx. torrentium, and Ae. cinereus from Ae. geminus, data were combined to Cx. pipiens/torrentium and Ae. cinereus/geminus. Presence data were considered as the actual locations of a given species, and absence data were randomly selected from the more than 900 possible locations where collections were made but the species of interest to this study were not found. Altogether, there were 116 presence locations for Cs. morsitans, 144 for Cx. pipiens/torrentium and 180 for Ae. cinereus/geminus. The number of absences was equally weighted to the presences as recommended to build reliable species distribution models [48].

2.3. SINV Host Species Data

As SINV is known to circulate in both resident Galliformes and migratory birds, we employed grouse abundance data from the Wildlife Triangle Census, coordinated by the Natural Resources Institute Finland (LUKE). Birds are monitored by voluntary hunters in late July and early August along 12 km–long triangle-shaped line transects [49]. The transects are walked in three-man chains, with the aim to flush all birds from a 60 m wide belt, enabling the calculation of absolute density estimates (individuals/km2). Grouse data were compiled by first calculating the average annual densities of willow grouse (Lagopus lagopus Linnaeus), black grouse (Lyrurus tetrix Linnaeus), capercaillie (Tetrao urogallus Linnaeus) and hazel grouse (Tetrastes bonasia Linnaeus) in Finnish municipalities between 2000–2019. For each municipality, all triangles within a 100-km radius from the geographical center of the municipality were included. Annual average densities were further averaged across all years to create one average figure per municipality, for the spatial analysis.

2.4. Environmental and Other Predictors
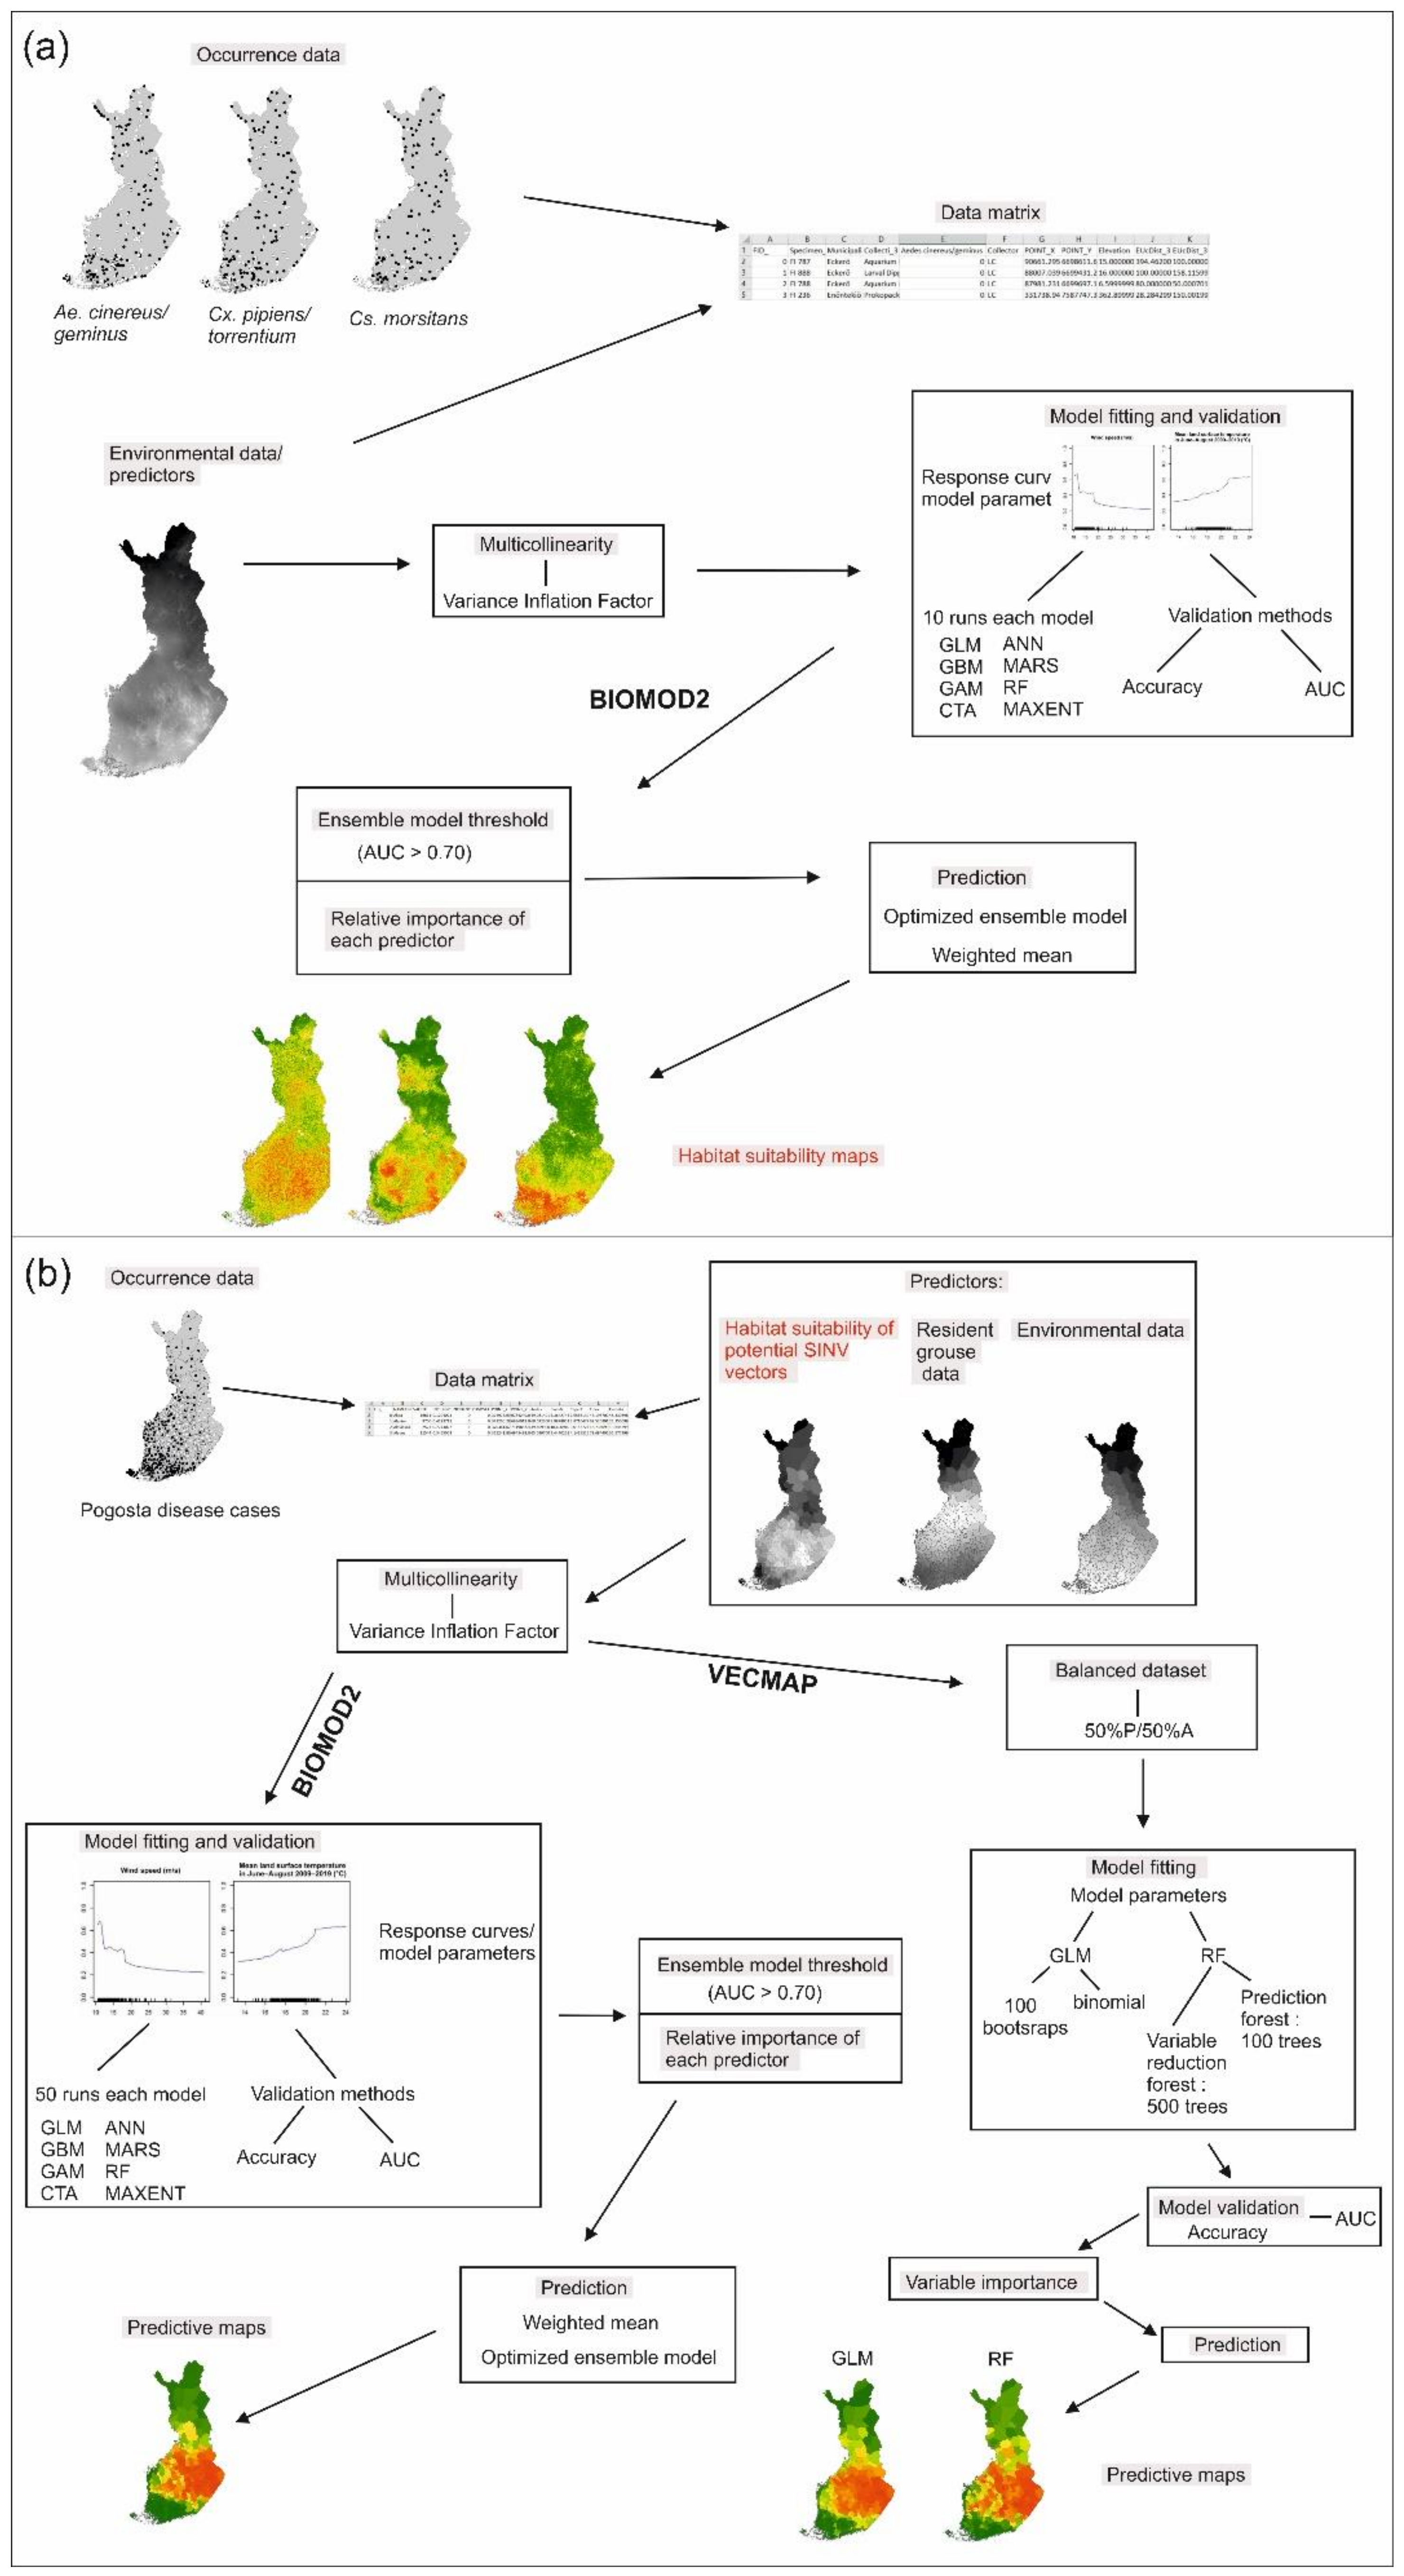
Environmental and other predictors were selected based on factors which are known to influence the distributions of vectors and SINV infections [8,21,23,34]. Environmental data for Finland were obtained from various sources and included interpolated data, data directly obtained from satellite imagery or data derived from GIS layers or satellite imagery. Details of the predictor data are provided in Table 1. Altogether, the vector dataset included 31 predictors, and the Pogosta disease dataset included 33 predictors before running a multicollinearity analysis (Section 2.5).

2.5. Data Analysis

We used the biomod2 platform in R [60] and VECMAP software to create species distribution models in order to identify areas with suitable habitat conditions for potential SINV vectors and human SINV infections [61,62,63]. All geospatial datasets, including environmental and other data, were processed in ESRI ArcGIS (version 10.3.1) (ESRI, Redlands, CA, USA), and were set to the same spatial extent, geographic coordinate system (EUREF FIN TM35FIN, epsg:3067) and resolution (1 km × 1 km). To model vector distributions, the dataset comprised potential vectors’ presence/absence data, and climatic and environmental predictors. The dataset compiled to model for Pogosta disease included the presence/absence data of Pogosta disease by municipality, and outputs of the vector models, host density data, and environmental data. As Pogosta disease data was obtained per municipality, the zonal mean values of predictor data per municipality were calculated. Multicollinearity of the variables was investigated using Variance Inflation Factors (VIFs) as implemented in R package usdm [64,65]. The VIFs of the predictors were calculated and correlated variables were excluded in a stepwise procedure using a commonly applied threshold value of 5 [66]. The resulting dataset included 21 predictors in the SINV vector modeling (Table 2a), and 19 predictors in the Pogosta disease modeling (Table 2b).
The workflow to analyse (a) potential SINV vectors and (b) Pogosta disease is presented in Figure 2a,b. We first applied the ensemble approach, which combines predictions across different modeling methods, in the biomod2 package (version 3.4.6) [62] in R to model the distribution of SINV vectors and Pogosta disease risk in Finland. The following eight predictive modeling techniques were employed: generalized linear models (GLM) [67], generalized additive models (GAM) [68], classification tree analysis (CTA) [69], artificial neural networks (ANN) [70], multivariate adaptive regression splines (MARS) [71], generalized boosting models (GBM) [72], random forest (RF) [73], and maximum entropy (MAXENT) [74]. Flexible discriminant analysis (FDA) and surface range envelope (SRE) were excluded due to generally poor predictive performance [75,76,77]. Models were mostly run using the default settings of biomod2 with the following exception: we used the function GAM in mgcv package, with k = 3 as the basis dimension for the thin plate smoothing terms [78]. We used a cross-validation technique where we split the dataset into two subsets, one to calibrate the models (70%) and another to evaluate the models (30%). We repeated the calibration and evaluation sets 10 times (80 model evaluation runs in total) for vector modeling, and 50 times (400 model evaluation runs in total) for Pogosta disease modeling [79]. The area under the receiver operating characteristic (AUC) value was used to assess the model performance in the analyses; scores range from 0 to 1, with 0.5 being the threshold for predictions better than random [80,81]. Sensitivity (the proportion of observed presences) and specificity (the proportion of observed absences) were calculated to quantify the omission errors [80]. Standardized values for relative contribution of the predictors were extracted from the biomod2 output and compared to assess the most powerful variables. Partial dependency plots were generated to show the predictors’ estimated effects on the species and disease distributions. To reduce the uncertainty related to the choice of a single modeling technique, we built ensemble predictions using the weighted mean method. This approach produces the ensemble prediction by averaging predictions across the best-performing individual models (0.7 < AUC < 1.0) and weights them based on their cross-validation performance. Predictions based on weighted mean ensemble models were used as an input for habitat suitability maps of SINV vectors and the Pogosta disease risk map.
Second, we used VECMAP (version 2.2.2.4503) [63] software in order to test the consistency of the results. In VECMAP, we used GLM and RF models to estimate the disease risk. GLM and RF models were processed using the default settings of VECMAP. In the GLM model, 100 repetitions of bootstrap resampling were run for both presence and absence datasets. The top 10 ranked variables were selected based on the best performing model number in terms of the Akaike information criterion (AIC). In the RF model, variable reduction forest was run with 500 trees and prediction forest with 100 trees. Variable contribution in RF was measured with a mean decrease in accuracy and a mean decrease in Gini. The model performance was assessed as described above when using the biomod2 package. Prediction maps were first created by using R or VECMAP, and afterwards modified in ArcGIS.

3. Results

3.1. Modeling of SINV Mosquito Vector Distributions

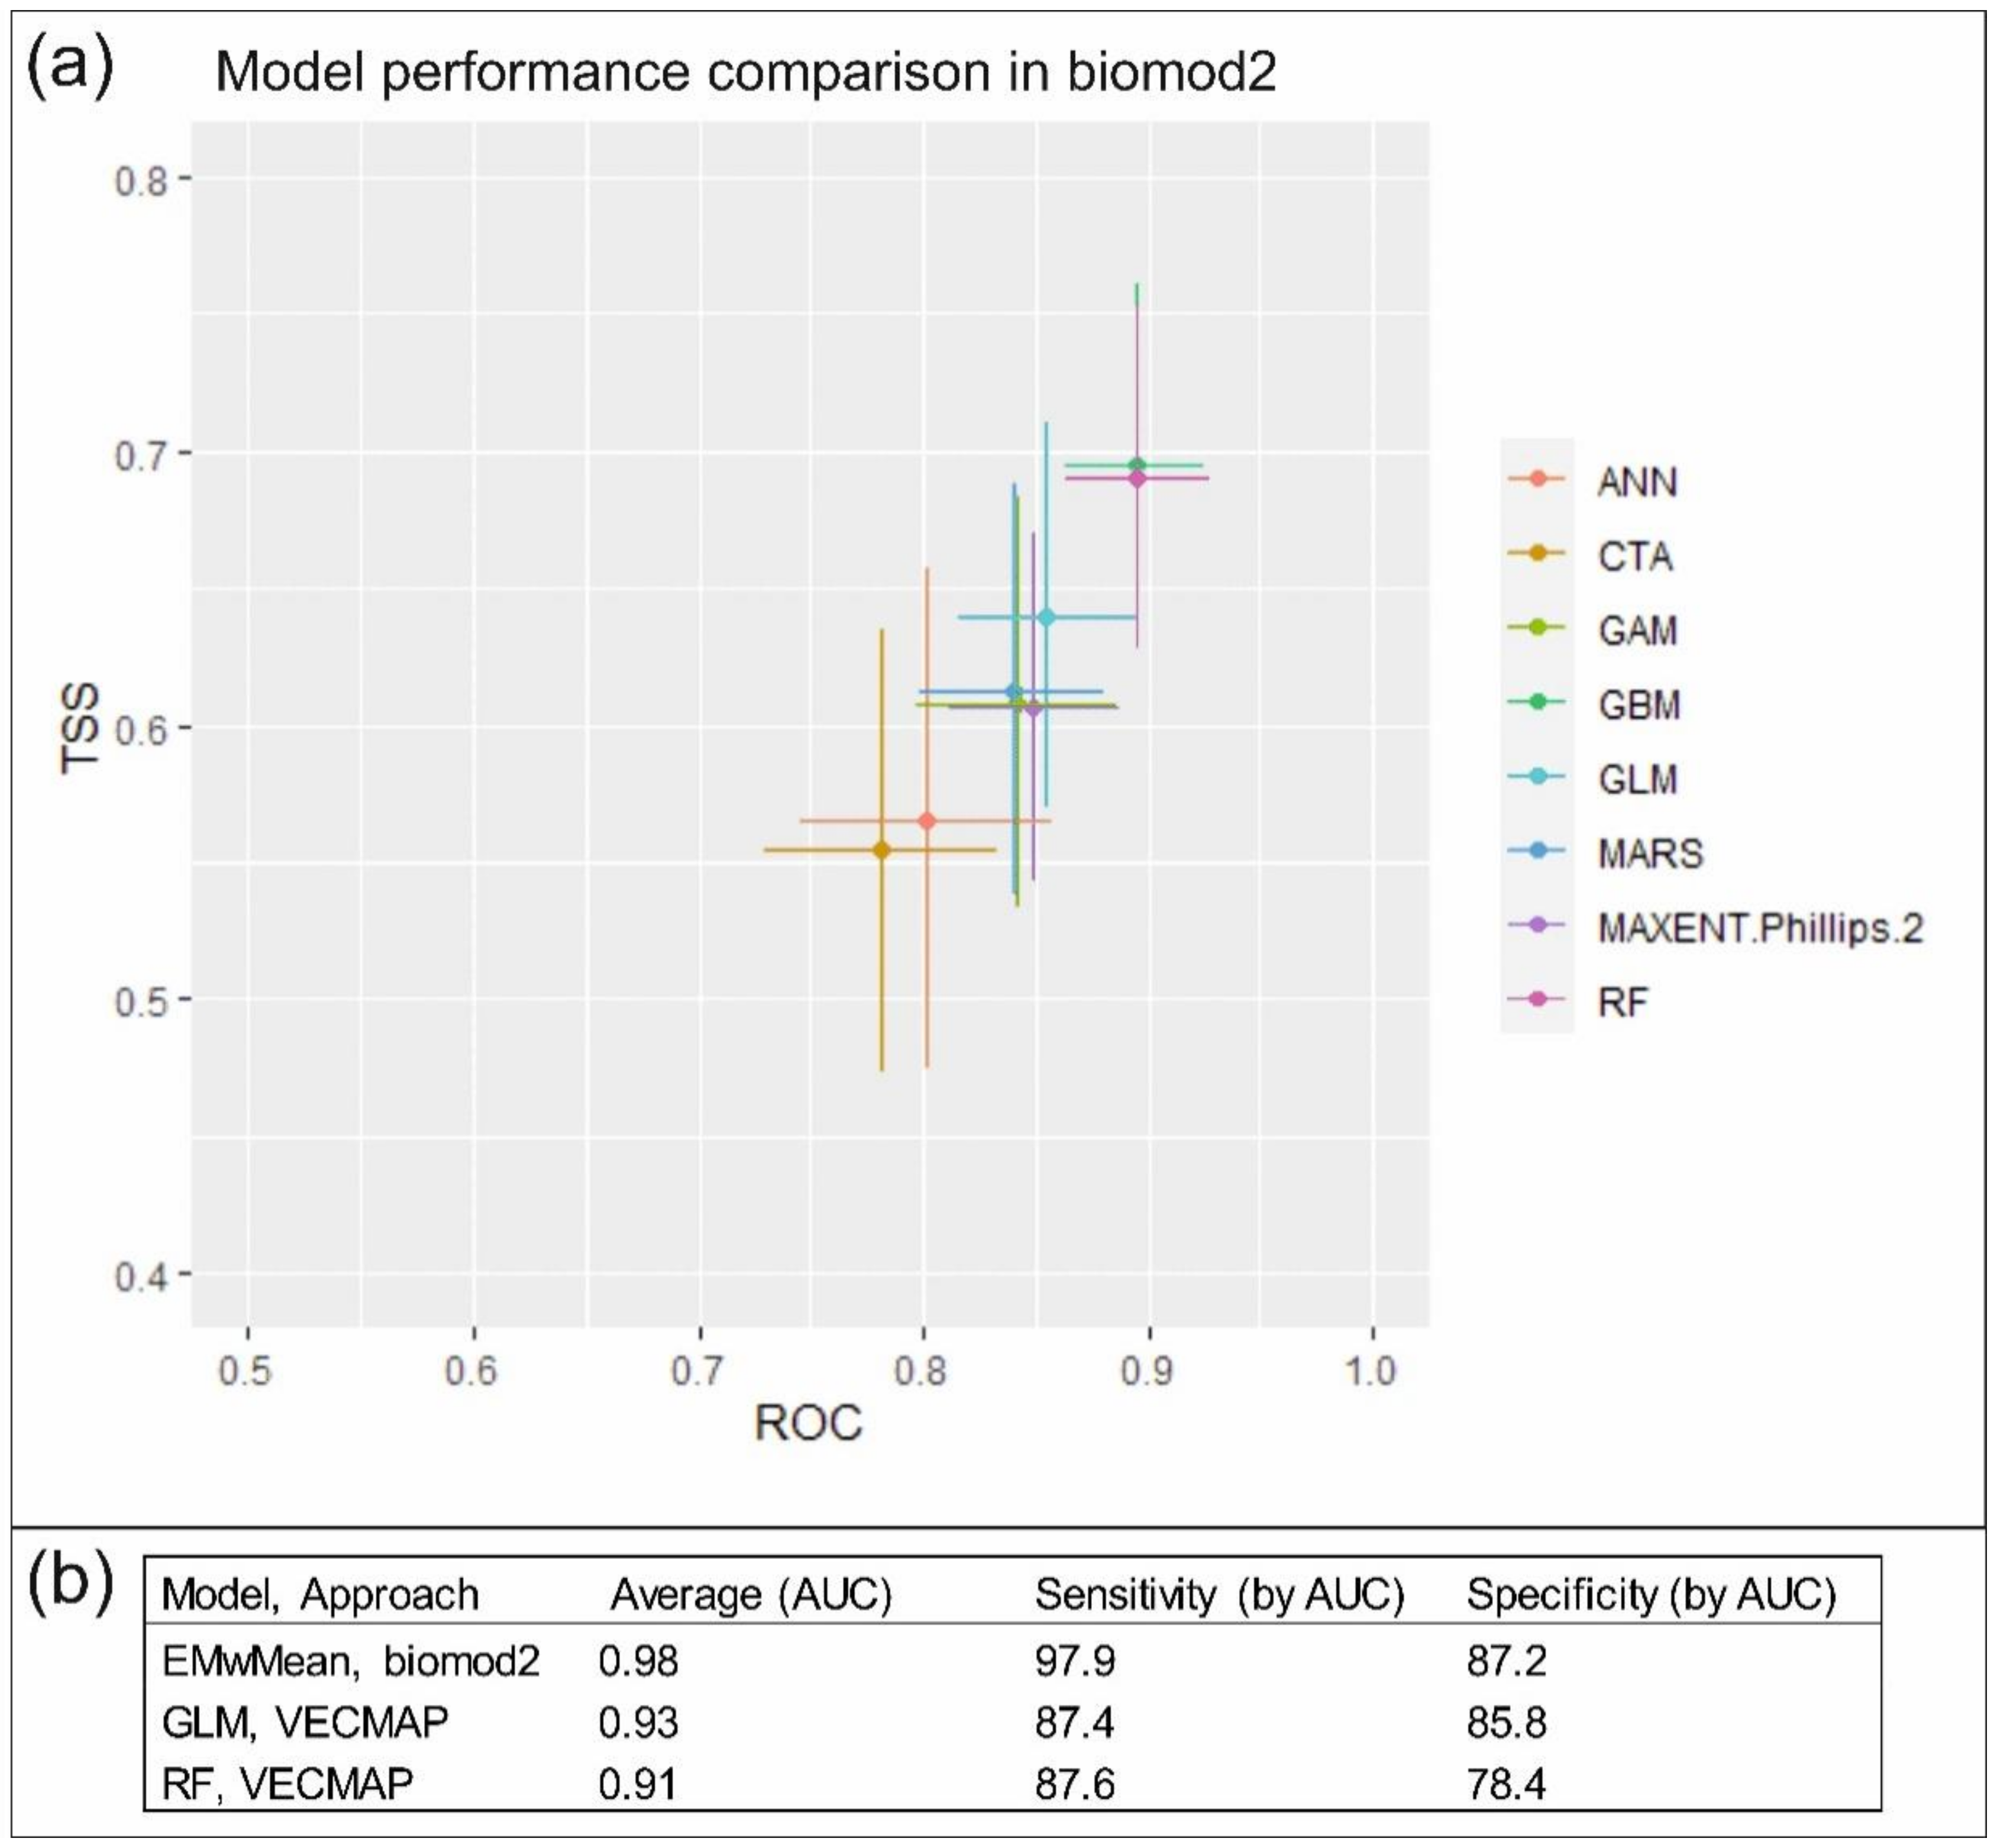
3.1.1. Predictive Performance

From 80 model runs for Ae. cinereus/geminus, the GAM, GBM, MARS and RF models provided AUC values higher than the reliability threshold 0.70, but below 0.75, and comprised the final ensemble model. Similarly, for Cx. pipiens/torrentium, the GAM, GBM, CTA, MARS and RF models resulted in AUC values above 0.70, but below 0.78. All models resulted in high AUC values (0.71–0.90) for Cs. morsitans suggesting fair to good predictive power. Sensitivity and specificity rates (by AUC) for estimating the distribution of potential vectors based on weighted mean ensemble model resulted in rates above 85.0%. To estimate Ae. cinereus/geminus and Cs. morsitans distributions, a better ability to identify suitable environments (sensitivity 93.4% and 96.6%) than unsuitable environments (specificity 88.6% and 87.5%) was presented. In contrast, when estimating Cx. pipiens/torrentium distributions, the ensemble model better identified unsuitable environments (sensitivity = 89.5%, specificity = 93.3%).

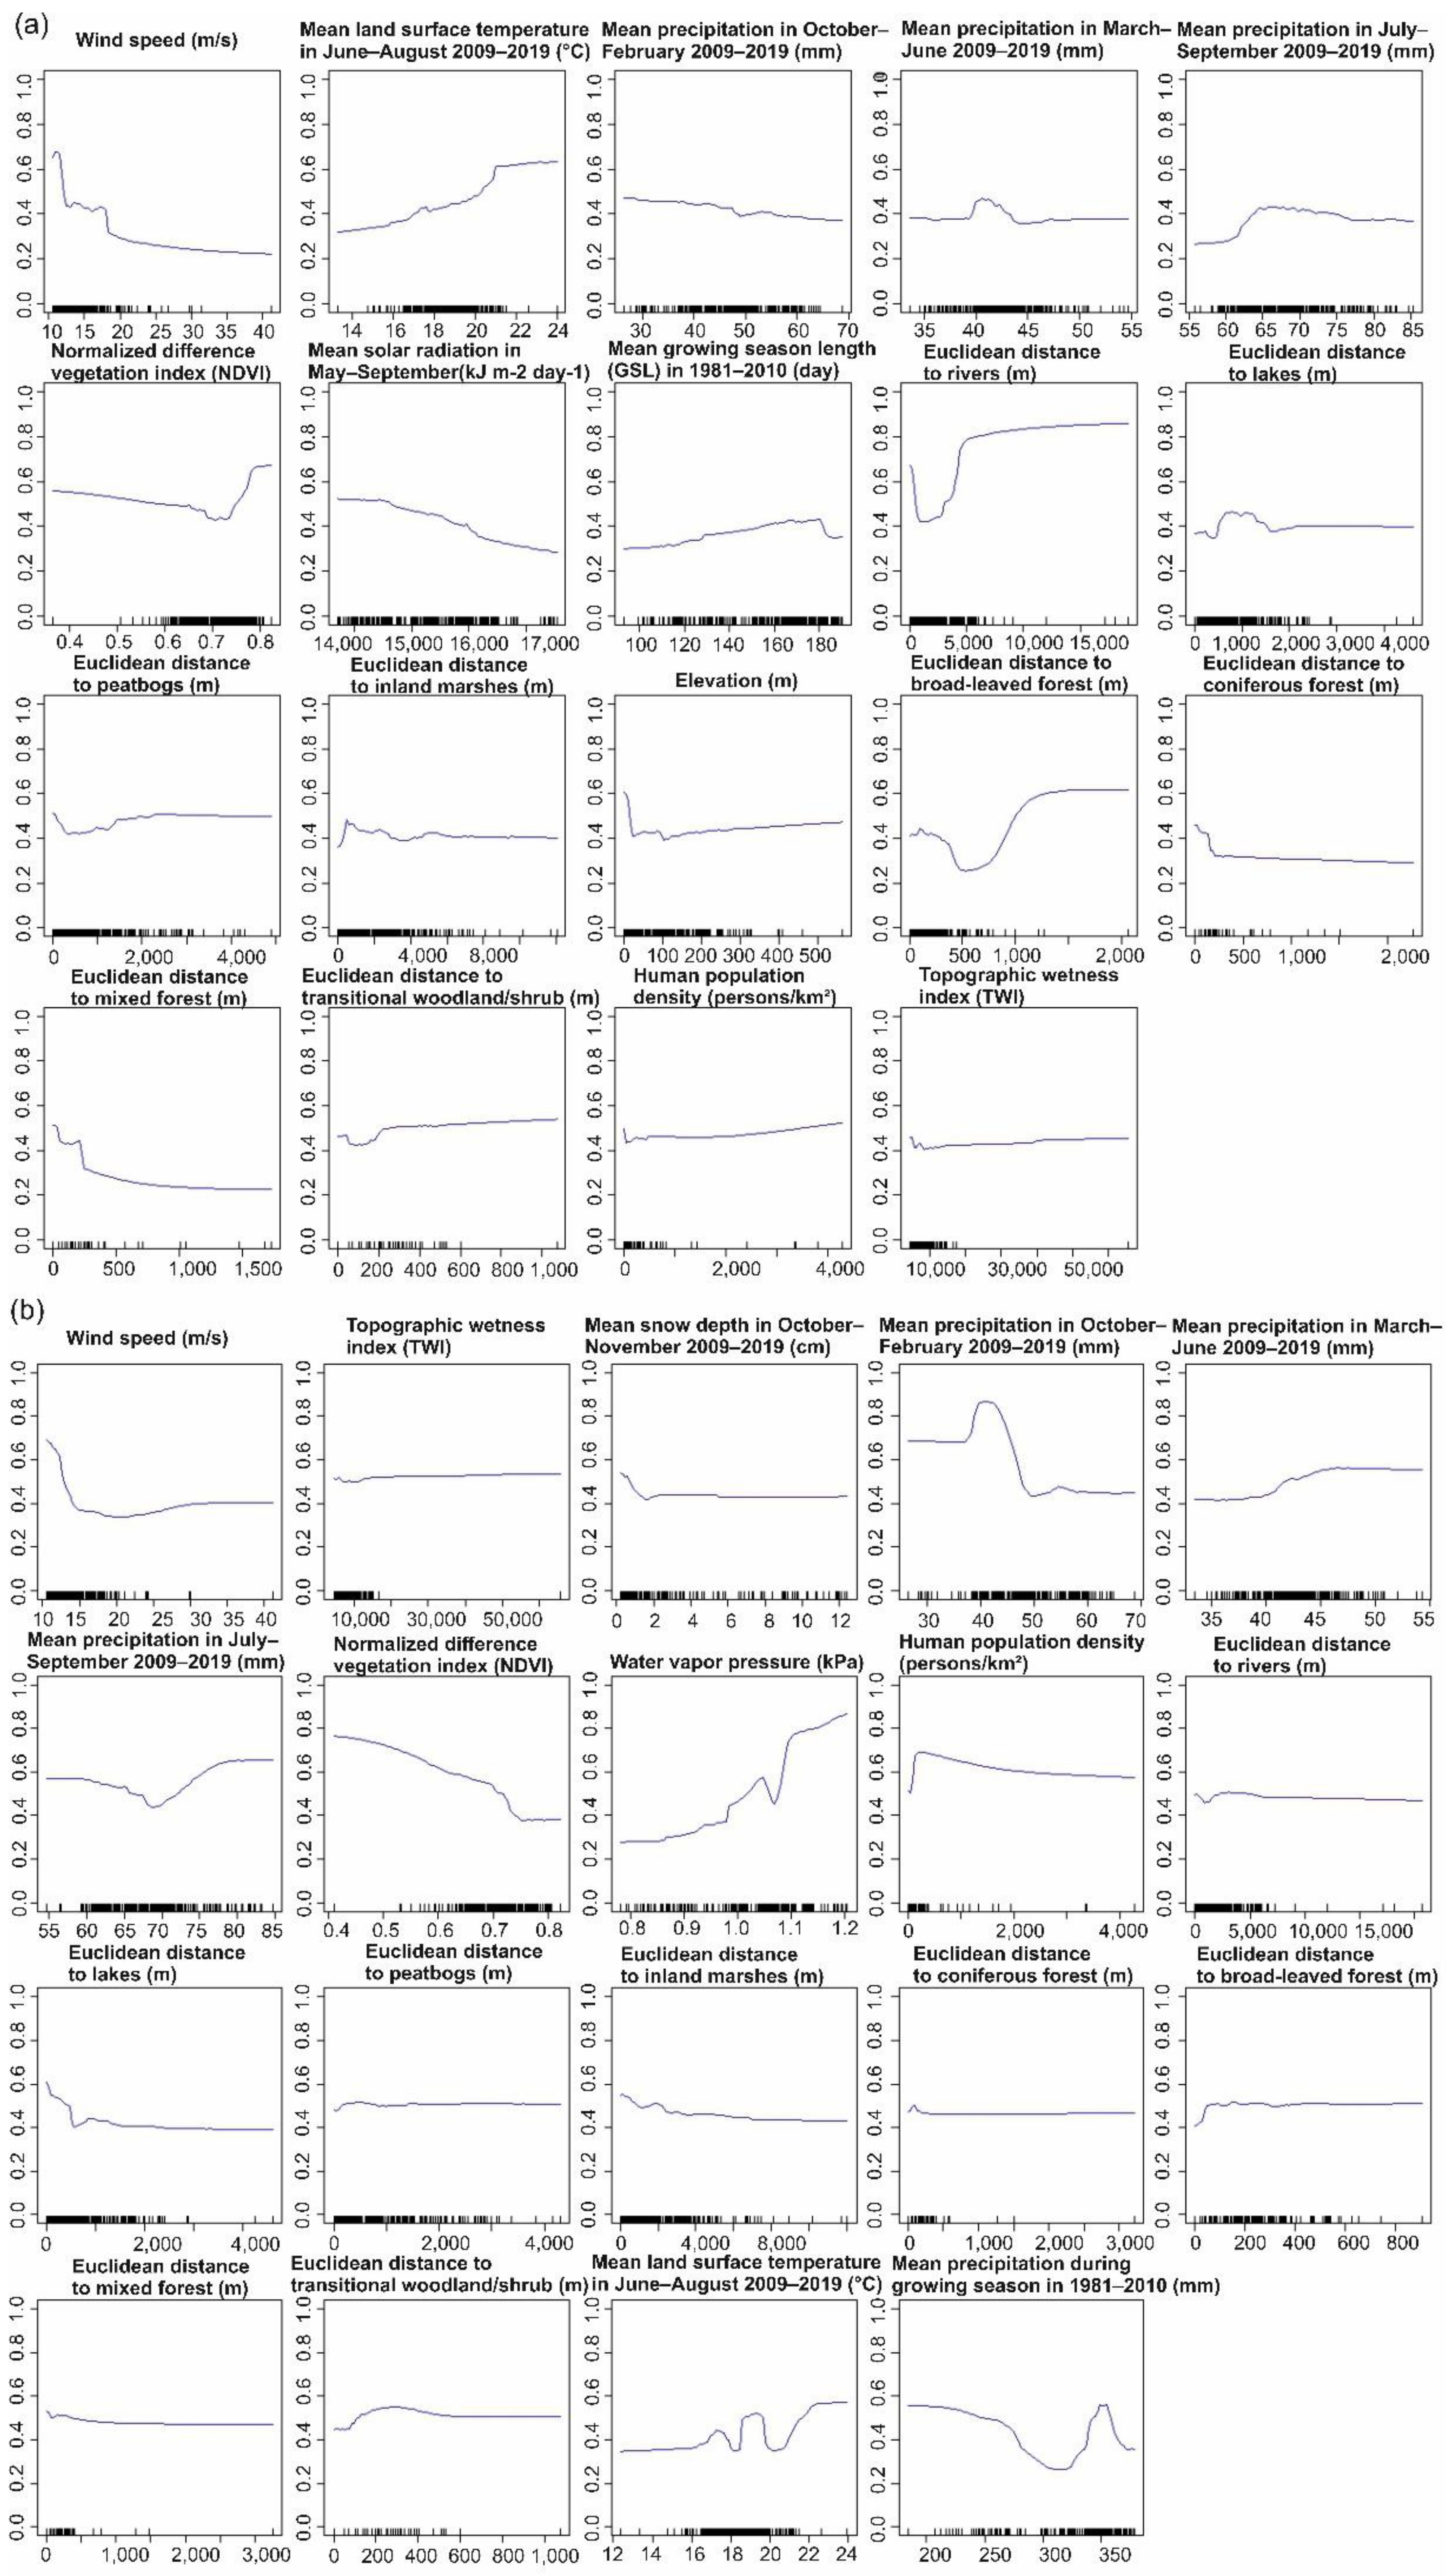
3.1.2. Predictor Contributions to the Distribution of SINV Vectors

The relative contribution of influential predictors (%) based on the weighted mean ensemble model varied between mosquito species (Figure A1 in Appendix A). The predictions for Ae. cinereus/geminus with the highest relative contribution were the Euclidean distance to river (21%), wind speed (17%), mean land surface temperature in June–August (11%), mean solar radiation in May–September (9%) and normalized difference vegetation index (NDVI) (7%). For Cx. pipiens/torrentium, mean water vapor pressure (29%), mean precipitation in October–February (23%), wind speed (15%), mean precipitation during growing season (9%), NDVI (5%) and human population density (4%) were the most important predictors. Mean solar radiation in May–September (53%), mean growing season length (GLS) (15%), mean precipitation in October–February (11%) and the Euclidean distance to coniferous forest (5%) had the highest contribution when predicting Cs. morsitans distributions.
Partial dependency plots for each vector species are shown in Figure A2a–c. High mean temperatures in June–August during 2000–2019, high NDVI and a long growing season in a municipality indicated high probability of Ae. cinereus/geminus presence (Figure A2a). Low wind speed, low solar radiation in May–September and short distances to coniferous and mixed forest in the locations were associated with the high probability of an occurrence of Ae. cinereus/geminus (Figure A2a). High water vapor pressure and high land surface temperatures in June–August were positively correlated with the probability of Cx. pipiens/torrentium occurrence (Figure A2b). The probability of Cx. pipiens/torrentium occurrence was also high in locations with low wind speed and sparse vegetation. A long growing season, high precipitation in March–June and high solar radiation in May–September positively influenced Cs. morsitans presence (Figure A2c). However, high mean precipitation in July–September and October–February, long distances to coniferous forests and mixed forests indicated a lower probability for Cs. morsitans to occur.

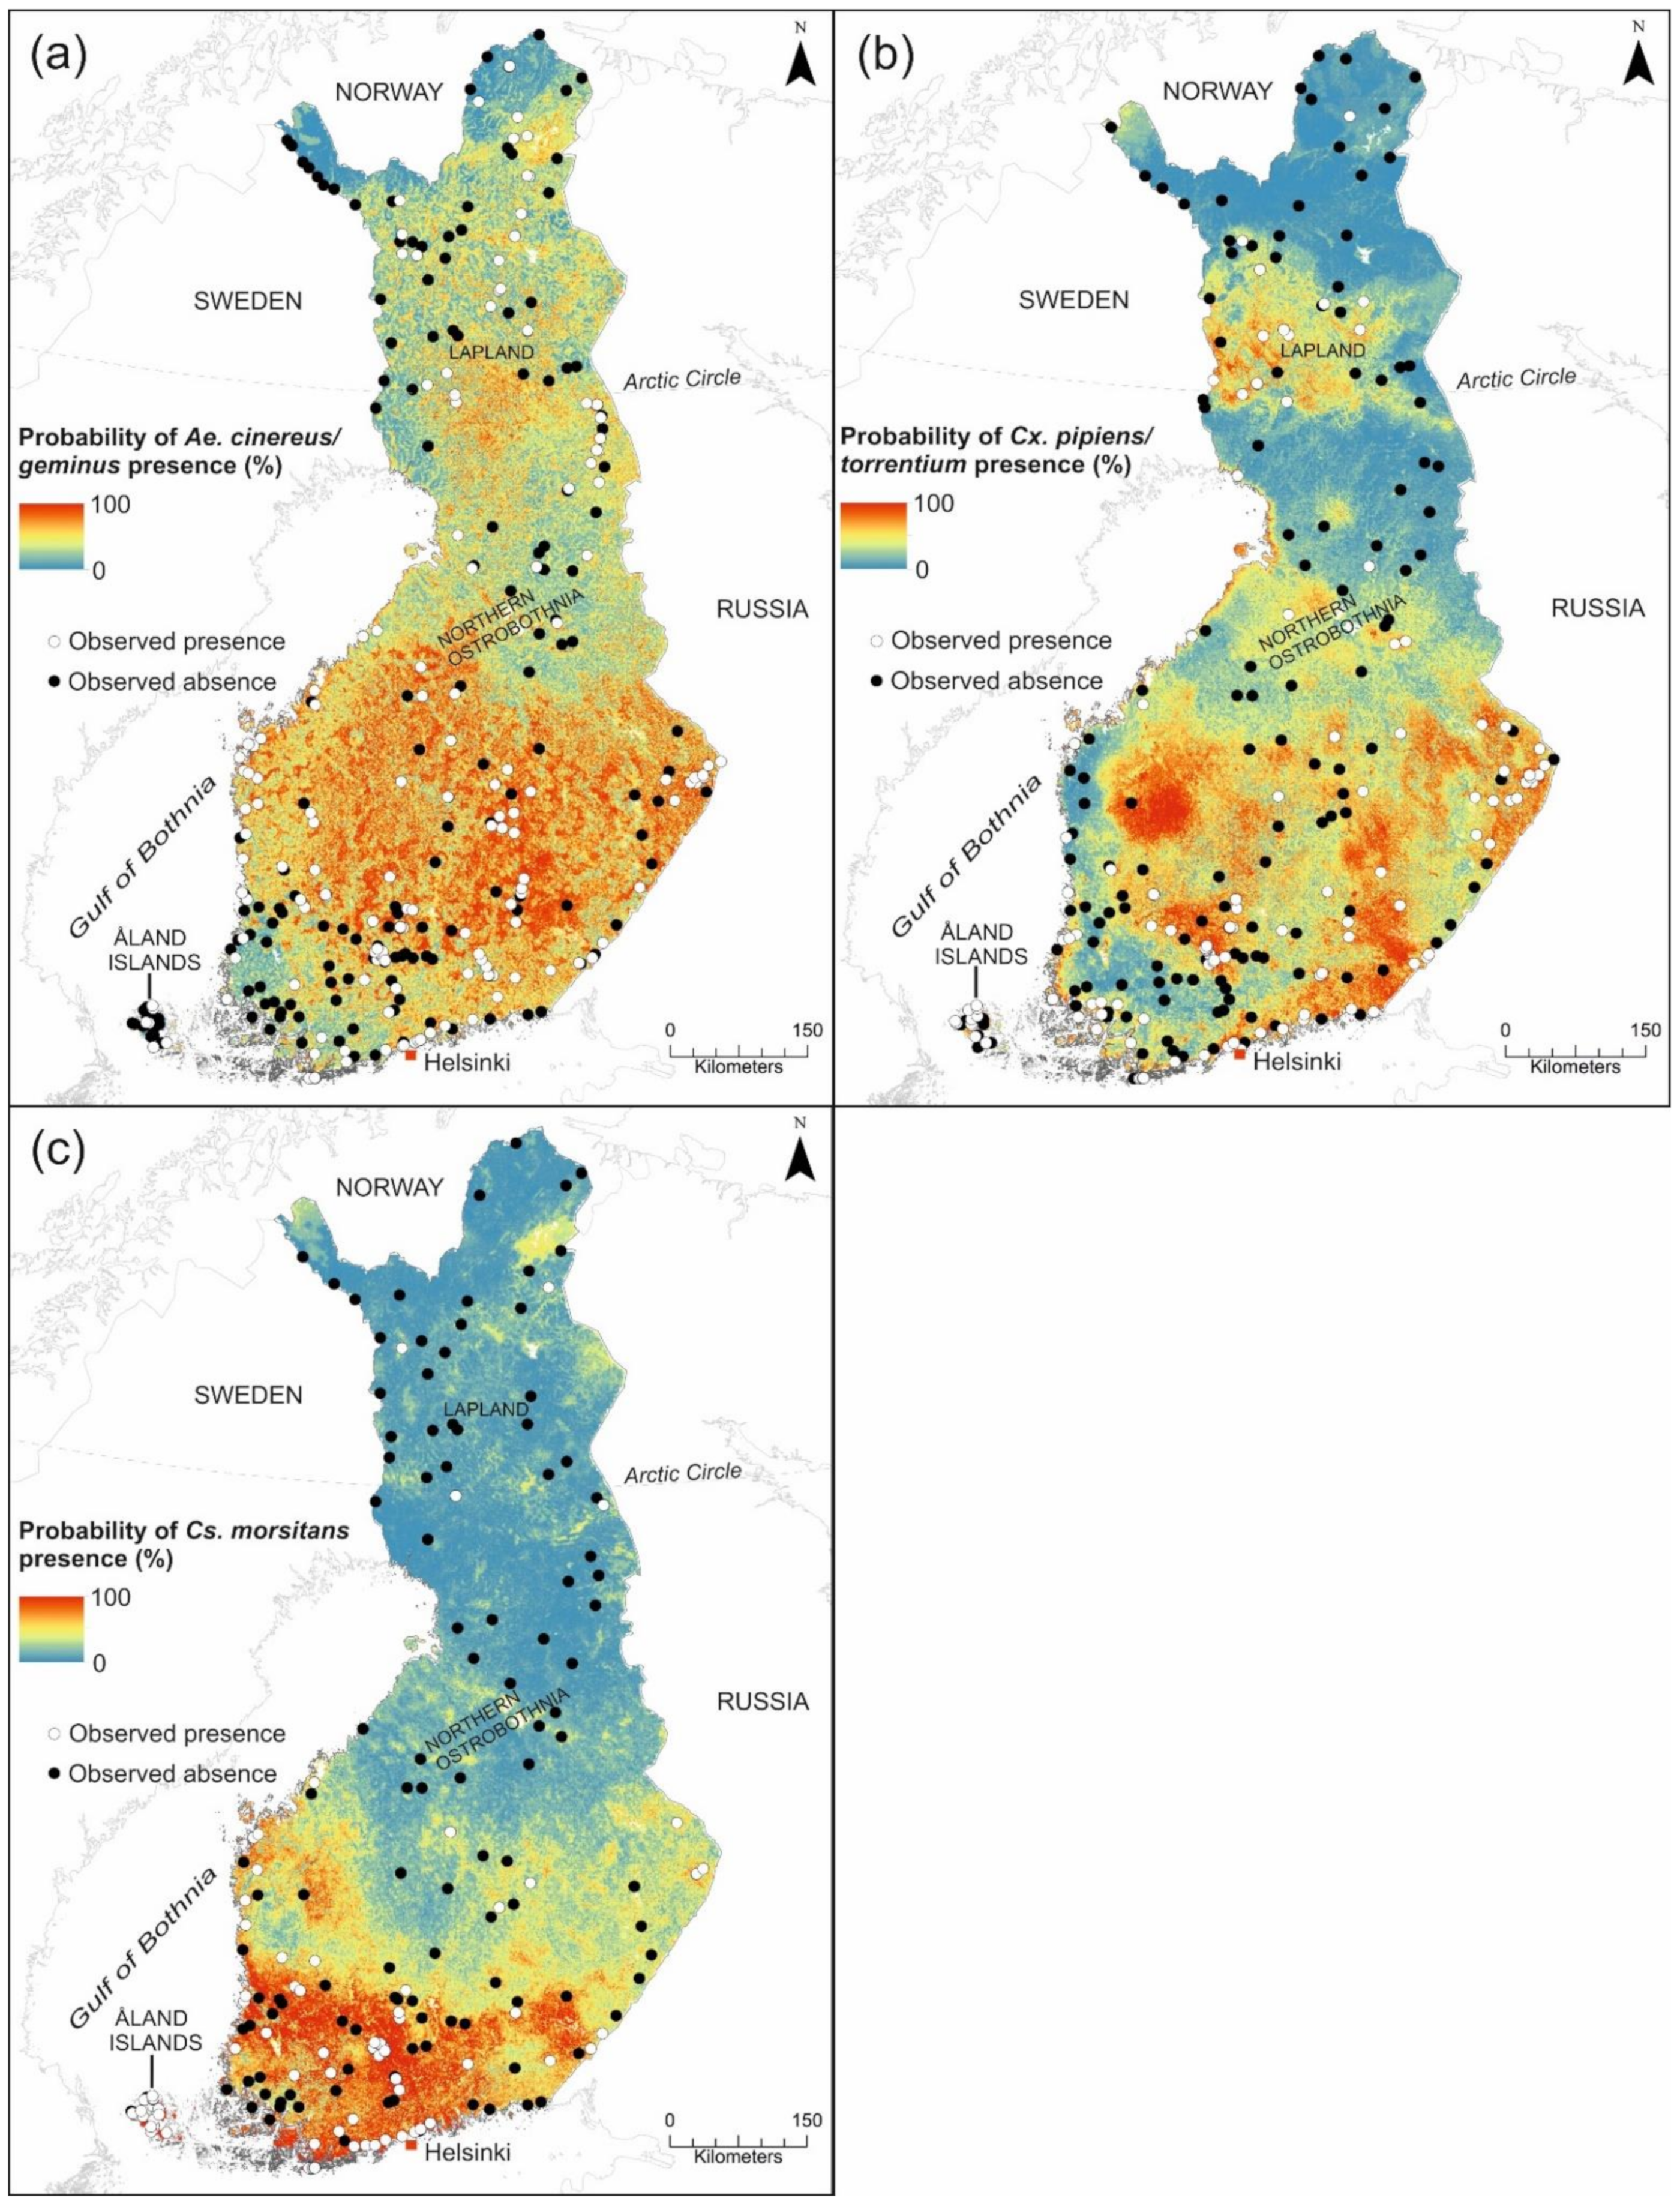
3.1.3. Prediction Maps for SINV Vectors

Suitability maps for potential SINV vectors are shown in Figure 3a–c. In this study, low probability of presence/risk is interpreted as 0–30%, moderate probability/risk as 31–60%, and high probability/risk as 61–100%. The areas with high probability for Ae. cinereus/geminus to occur were located in central, eastern and western Finland (Figure 4a). The probability of Ae. cinereus/geminus presence was also high in Lapland, excluding the northernmost Lapland (0–30%). The areas with moderate probability of Ae. cinereus/geminus presence were predicted to occur throughout Finland (30–70%). Southwestern Finland, including the majority of the Åland Islands, was predicted to have low probability for Ae. cinereus/geminus presence. High probability for Cx. pipiens/torrentium presence was found in central Lapland and most of southern and central Finland, including the Åland Islands and the coastal areas (Figure 3b). In contrast, eastern Northern Ostrobothnia, southern and northern Lapland, and a narrow area in western Finland, were estimated to have a low probability for Cx. pipiens/torrentium occurrence. High suitability for Cs. morsitans was estimated across southern Finland, including coastal areas, the Åland Islands, and sporadic areas in western and eastern Finland (Figure 3c). Most of central and northern Finland was estimated to have a low probability for Cs. morsitans presence, however, excluding sporadic regions with a moderate suitability.

3.2. Pogosta Disease Modeling

3.2.1. Predictive Performance

Model performances of the eight modeling approaches and weighted mean ensemble model (biomod2), as well as the generalized linear model (GLM) and random forest (RF) model (VECMAP), are presented in Figure 4. In the biomod2 package, all models provided reasonable estimates (AUC > 0.70) for the distribution of SINV infections resulting in a minimum mean AUC of 0.78 over 50 model runs (0.78 < mean AUC < 0.90). RF and GBM models were the best performing models in biomod2 (0.89 < mean AUC < 0.90, respectively). The weighted mean ensemble model (biomod2), produced by the best-performing model algorithms, yielded the mean AUC of 0.98 with good sensitivity and specificity rates (Figure 4b). In VECMAP, the GLM model resulted in a mean AUC of 0.93 over 100 bootstrap resampling events and a RF model mean AUC of 0.91.

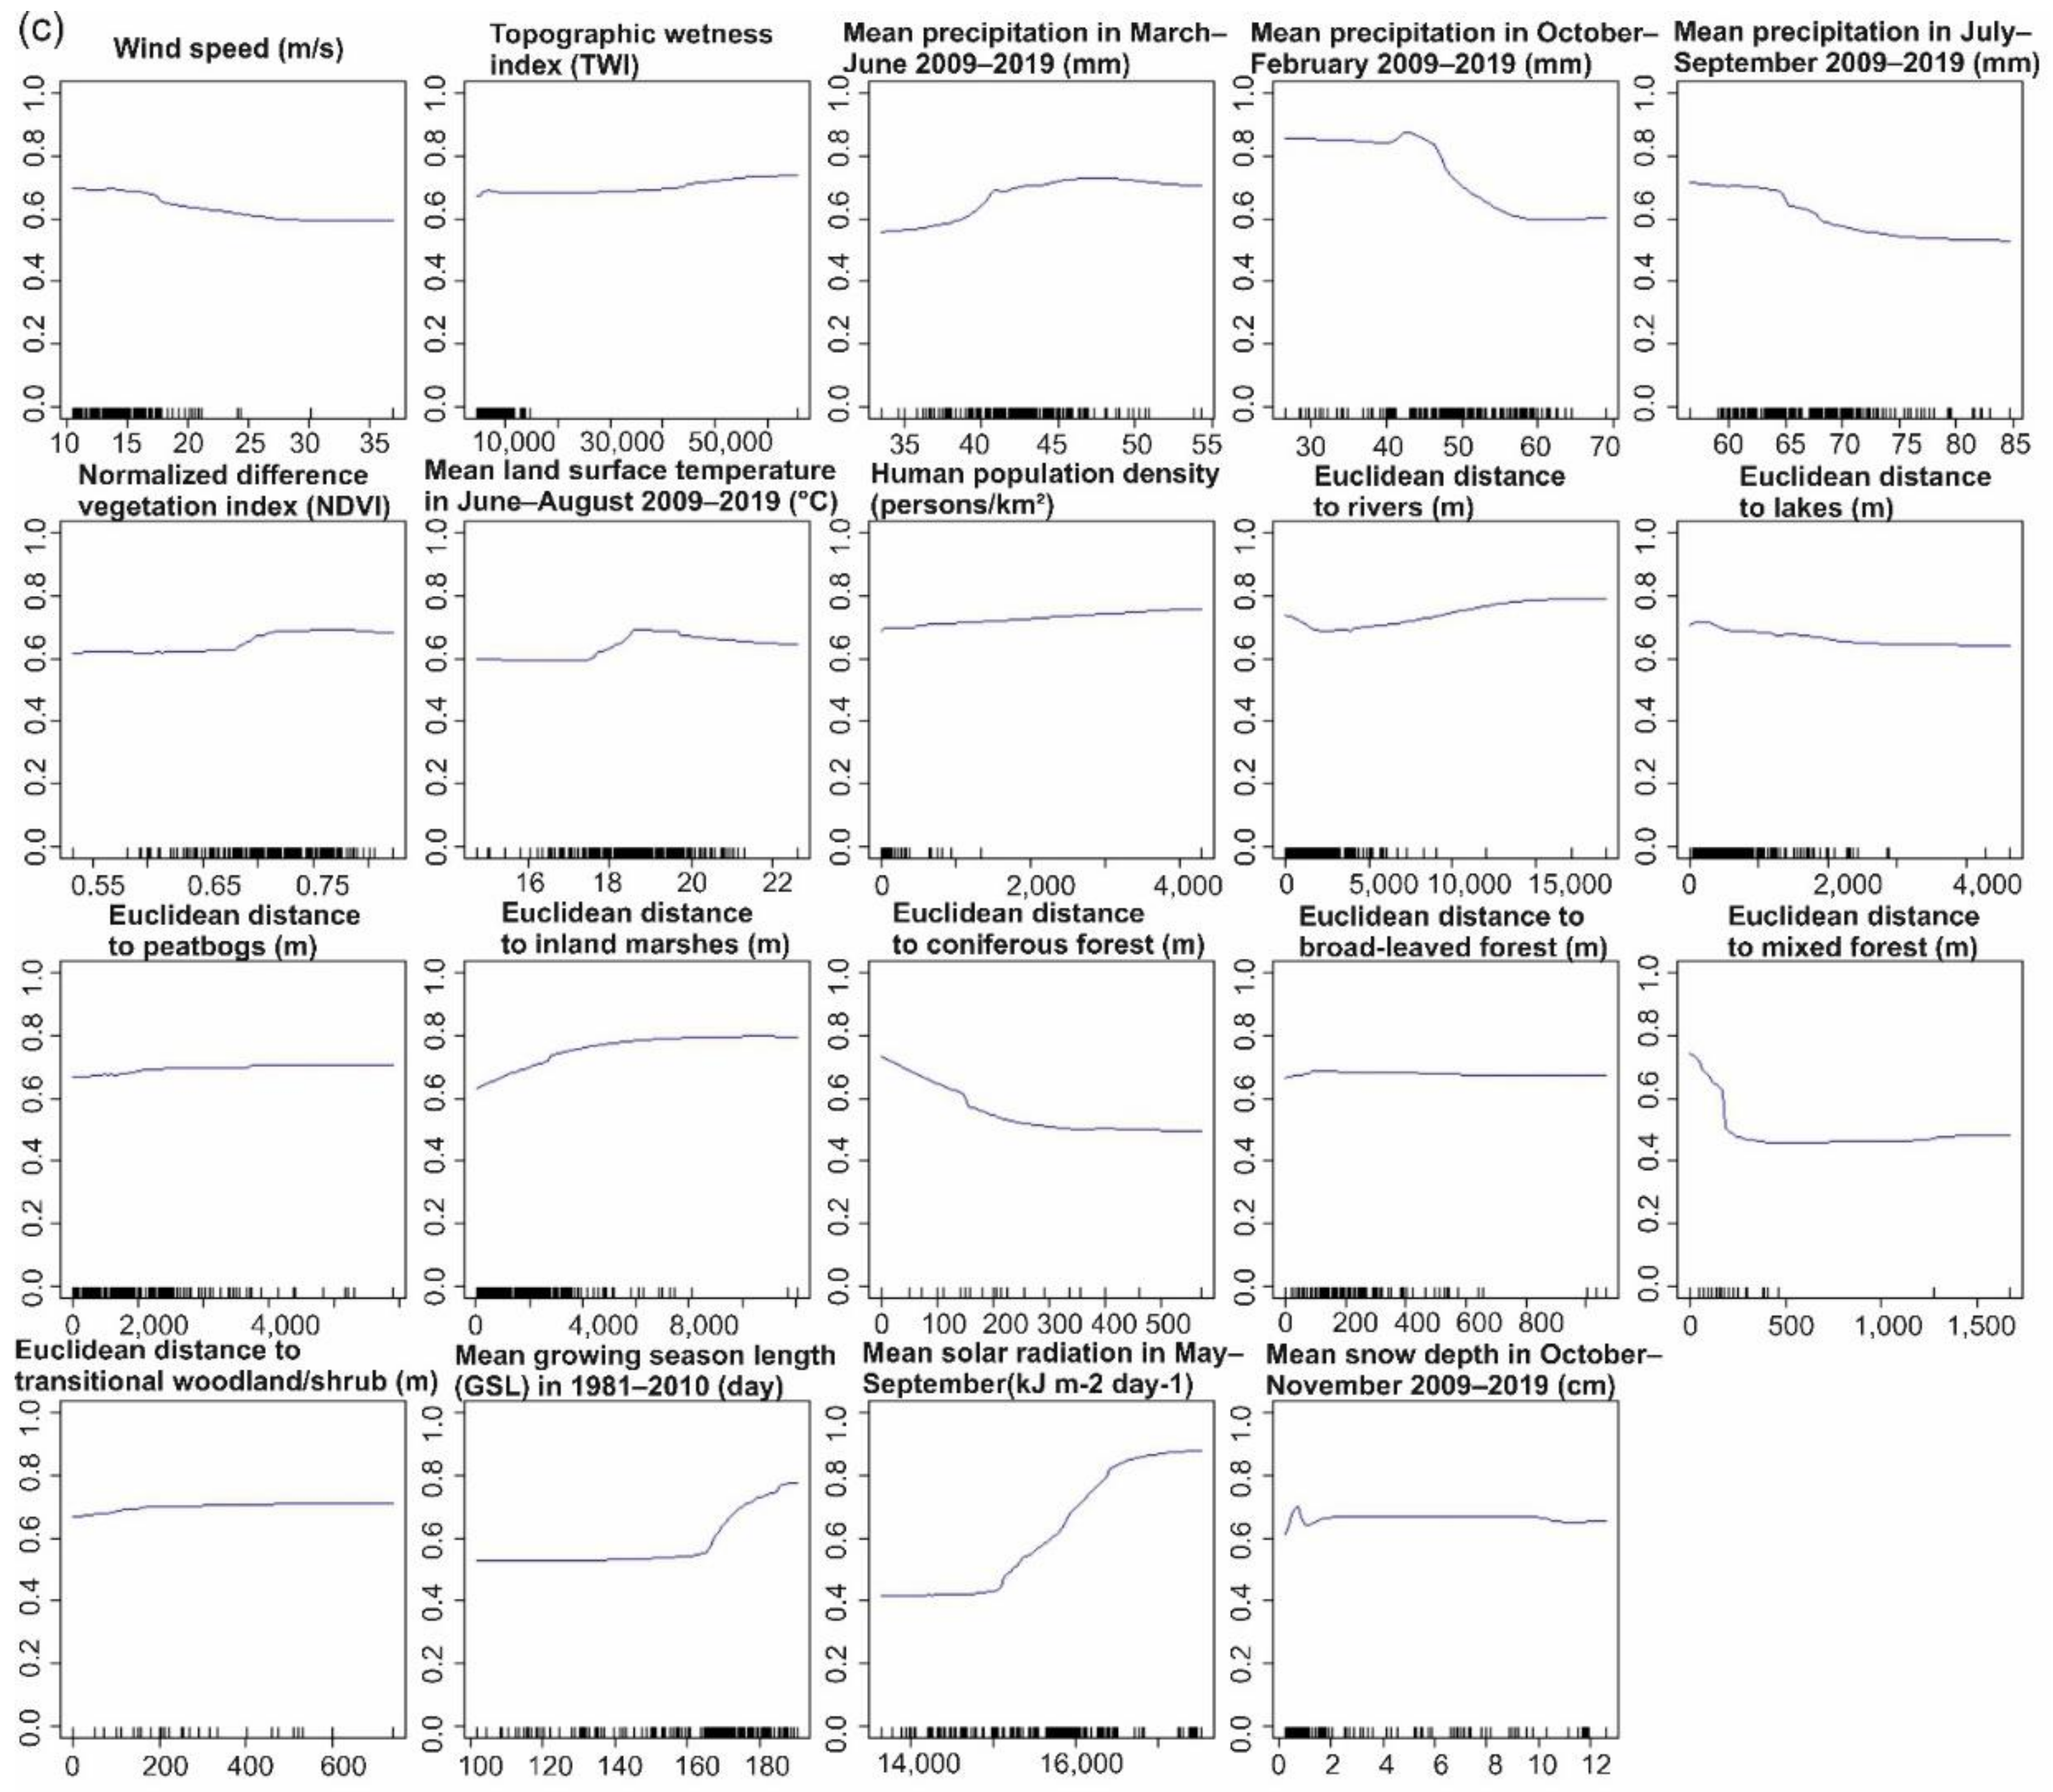
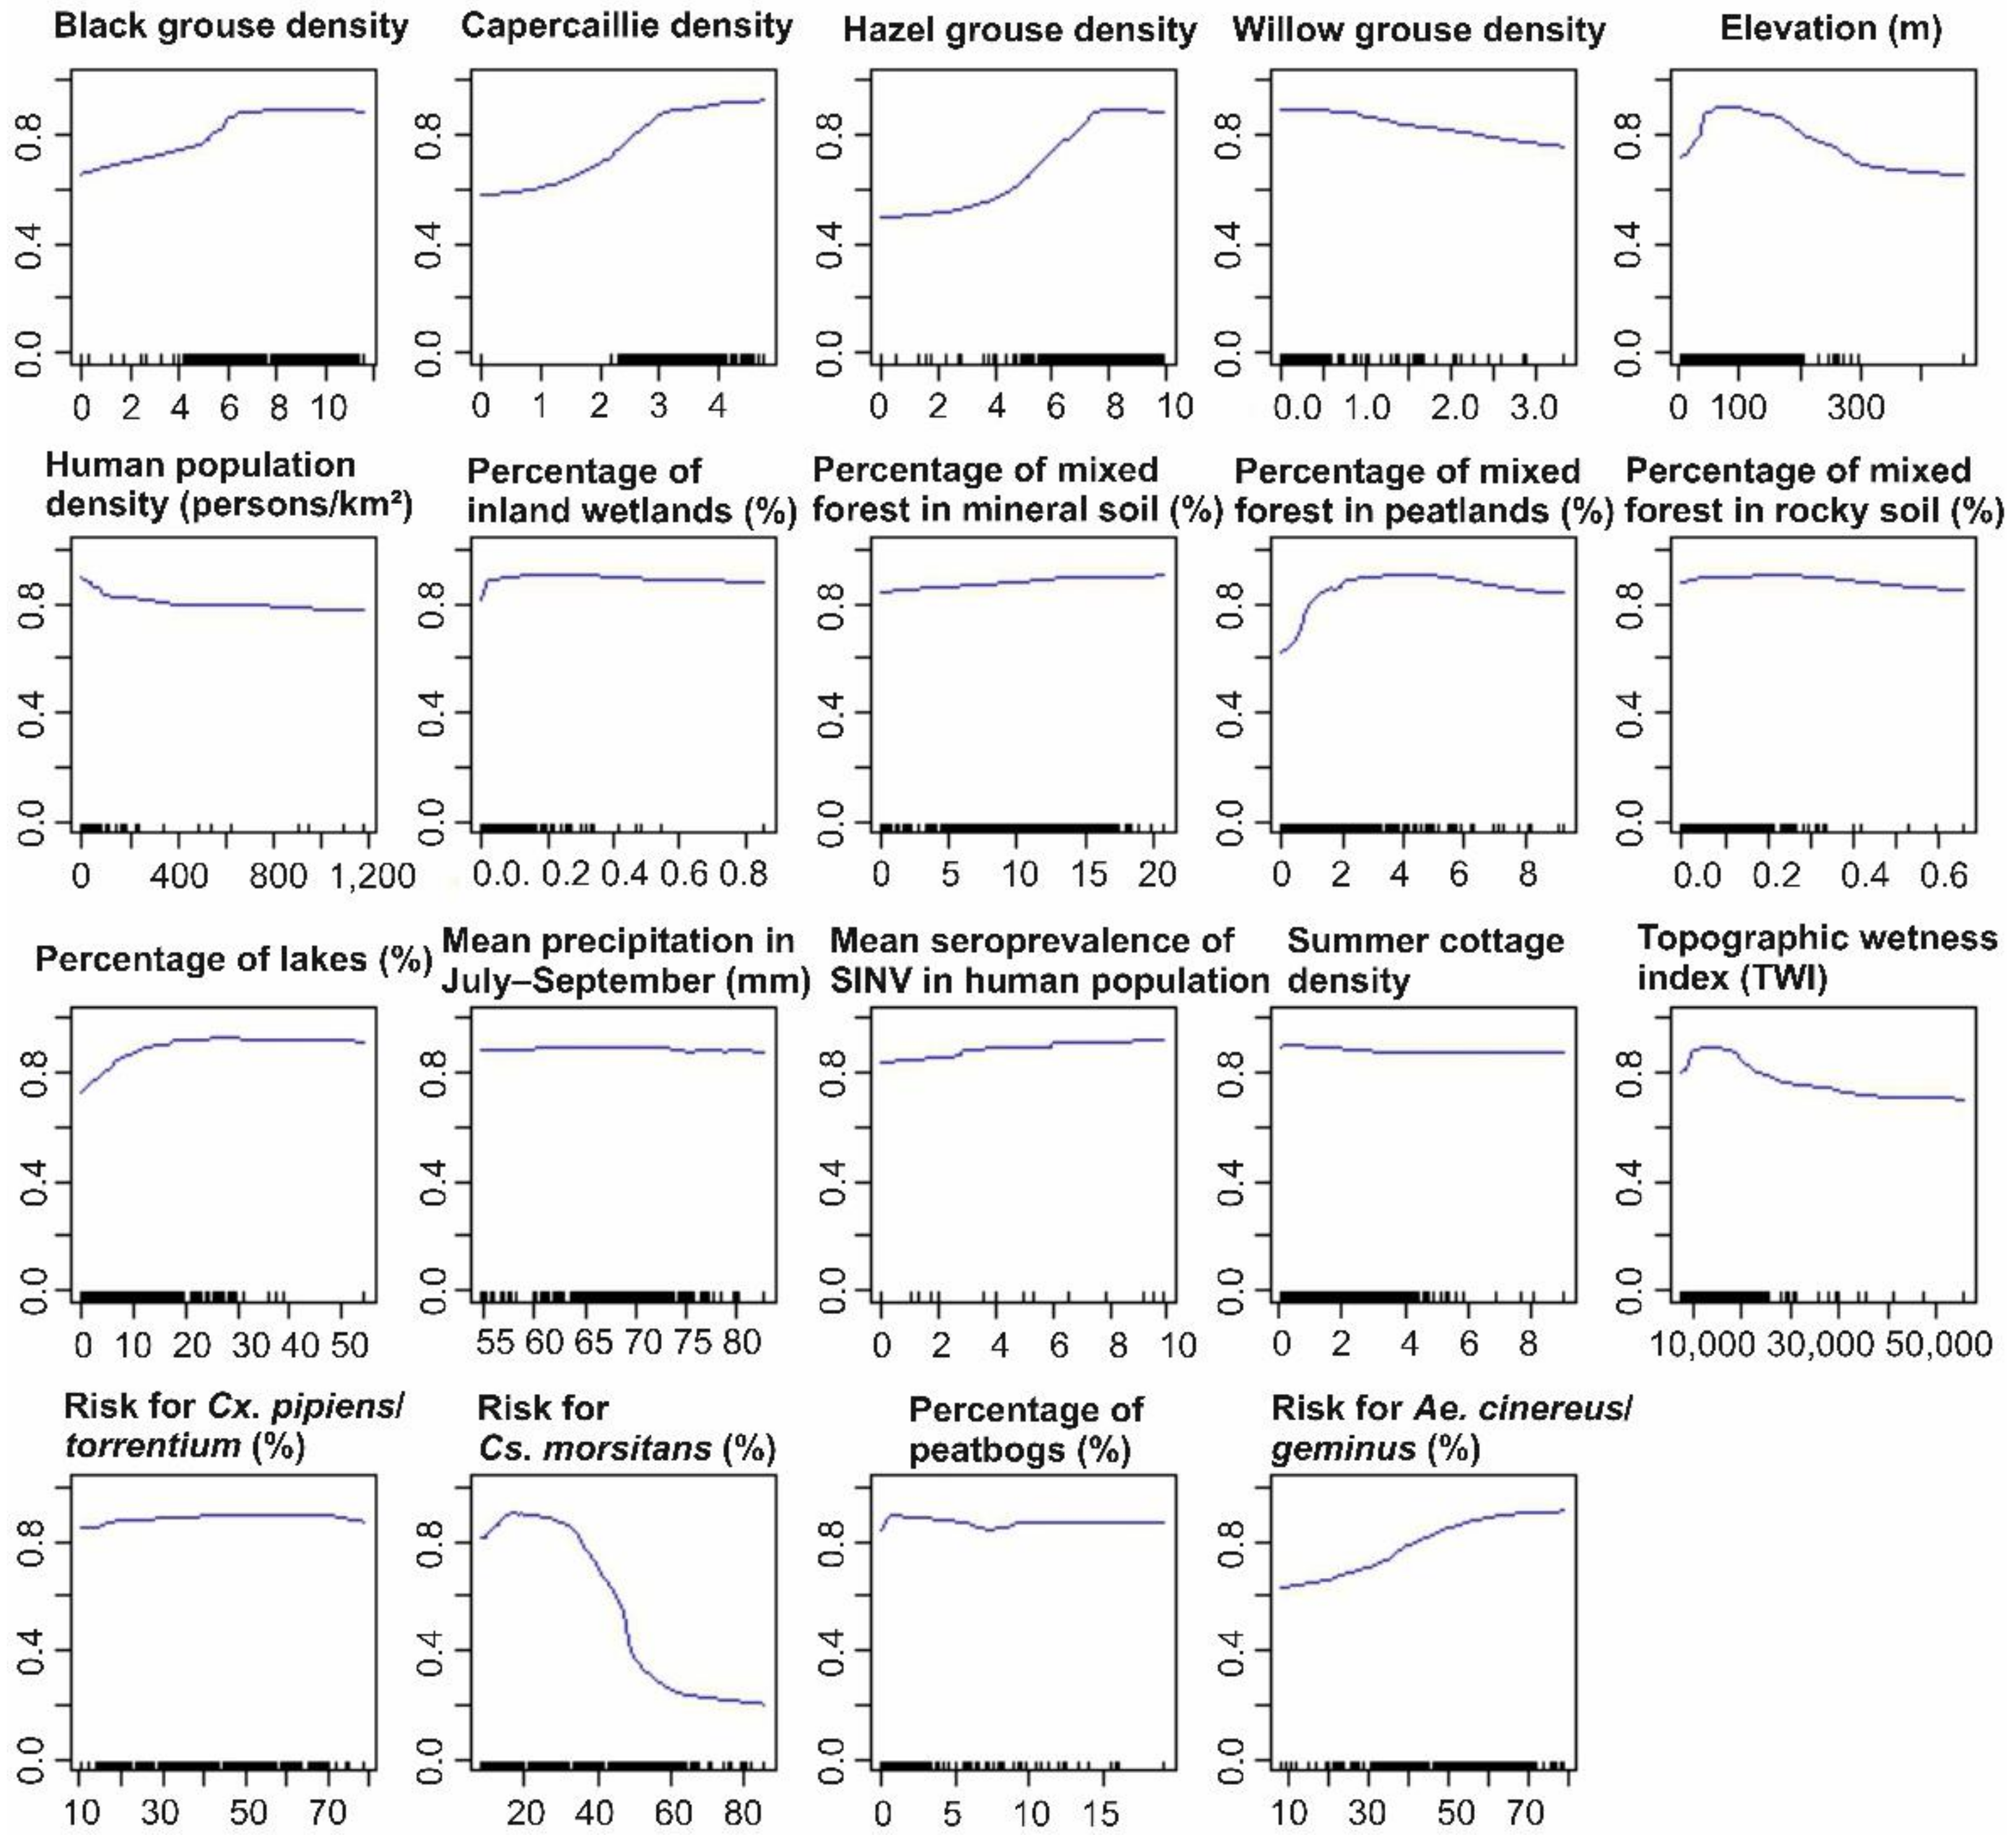
3.2.2. Predictor Contributions to the Distribution of Pogosta Disease Distribution

The relative contribution of predictors (%) based on the weighted mean ensemble model in biomod2 varied considerably (Figure A3a). The highest relative contribution was provided by the habitat suitability of Cs. morsitans (53%), the proportion of mixed forest in peatlands (10%), hazel grouse (9%) density, the habitat suitability of Ae. cinereus/geminus (7%), the number of lakes (5%), capercaillie (4%) and black grouse (3%) density per municipality. Based on variable contributions in GLM (VECMAP), all variables were included in the 10 most important variables except for the proportion of mixed forest in peatlands. Furthermore, the habitat suitability for Cx. pipiens/torrentium, the proportion of inland wetlands, elevation and human population density were important predictors based on GLM model in VECMAP. The contributions of predictors in the RF model (VECMAP) were mainly consistent in the weighted mean ensemble model and GLM model (VECMAP) (Figure A3b–c).
Based on the partial dependency plots, high densities of black grouse, capercaillie and hazel grouse indicated high probability of Pogosta disease occurrence (70–98%) (Figure 5). The high willow grouse densities, however, were associated with lower risk for Pogosta disease. A high proportion of mixed forest in peatland, peatbogs and lakes in the municipalities were associated with increased Pogosta disease risk (80–90%). In municipalities at elevations lower than 200 m, the Pogosta disease risk was higher (80–90%), compared to municipalities at higher altitudes. Furthermore, in municipalities at low to high topographic wetness index (TWI) rates, Pogosta disease risk remained high (80–90%). In the municipalities with a high probability of Ae. cinereus/geminus occurrence, Pogosta disease risk was also high (80–98%), and remained high also in municipalities with low to high suitability for Cx. pipiens/torrentium. In contrast, the disease risk decreased when the habitat suitability for Cs. morsitans increased to 50%, whereas in municipalities with low to moderate suitability (0–50%) for Cs. morsitans, the Pogosta risk was high (80–90%).

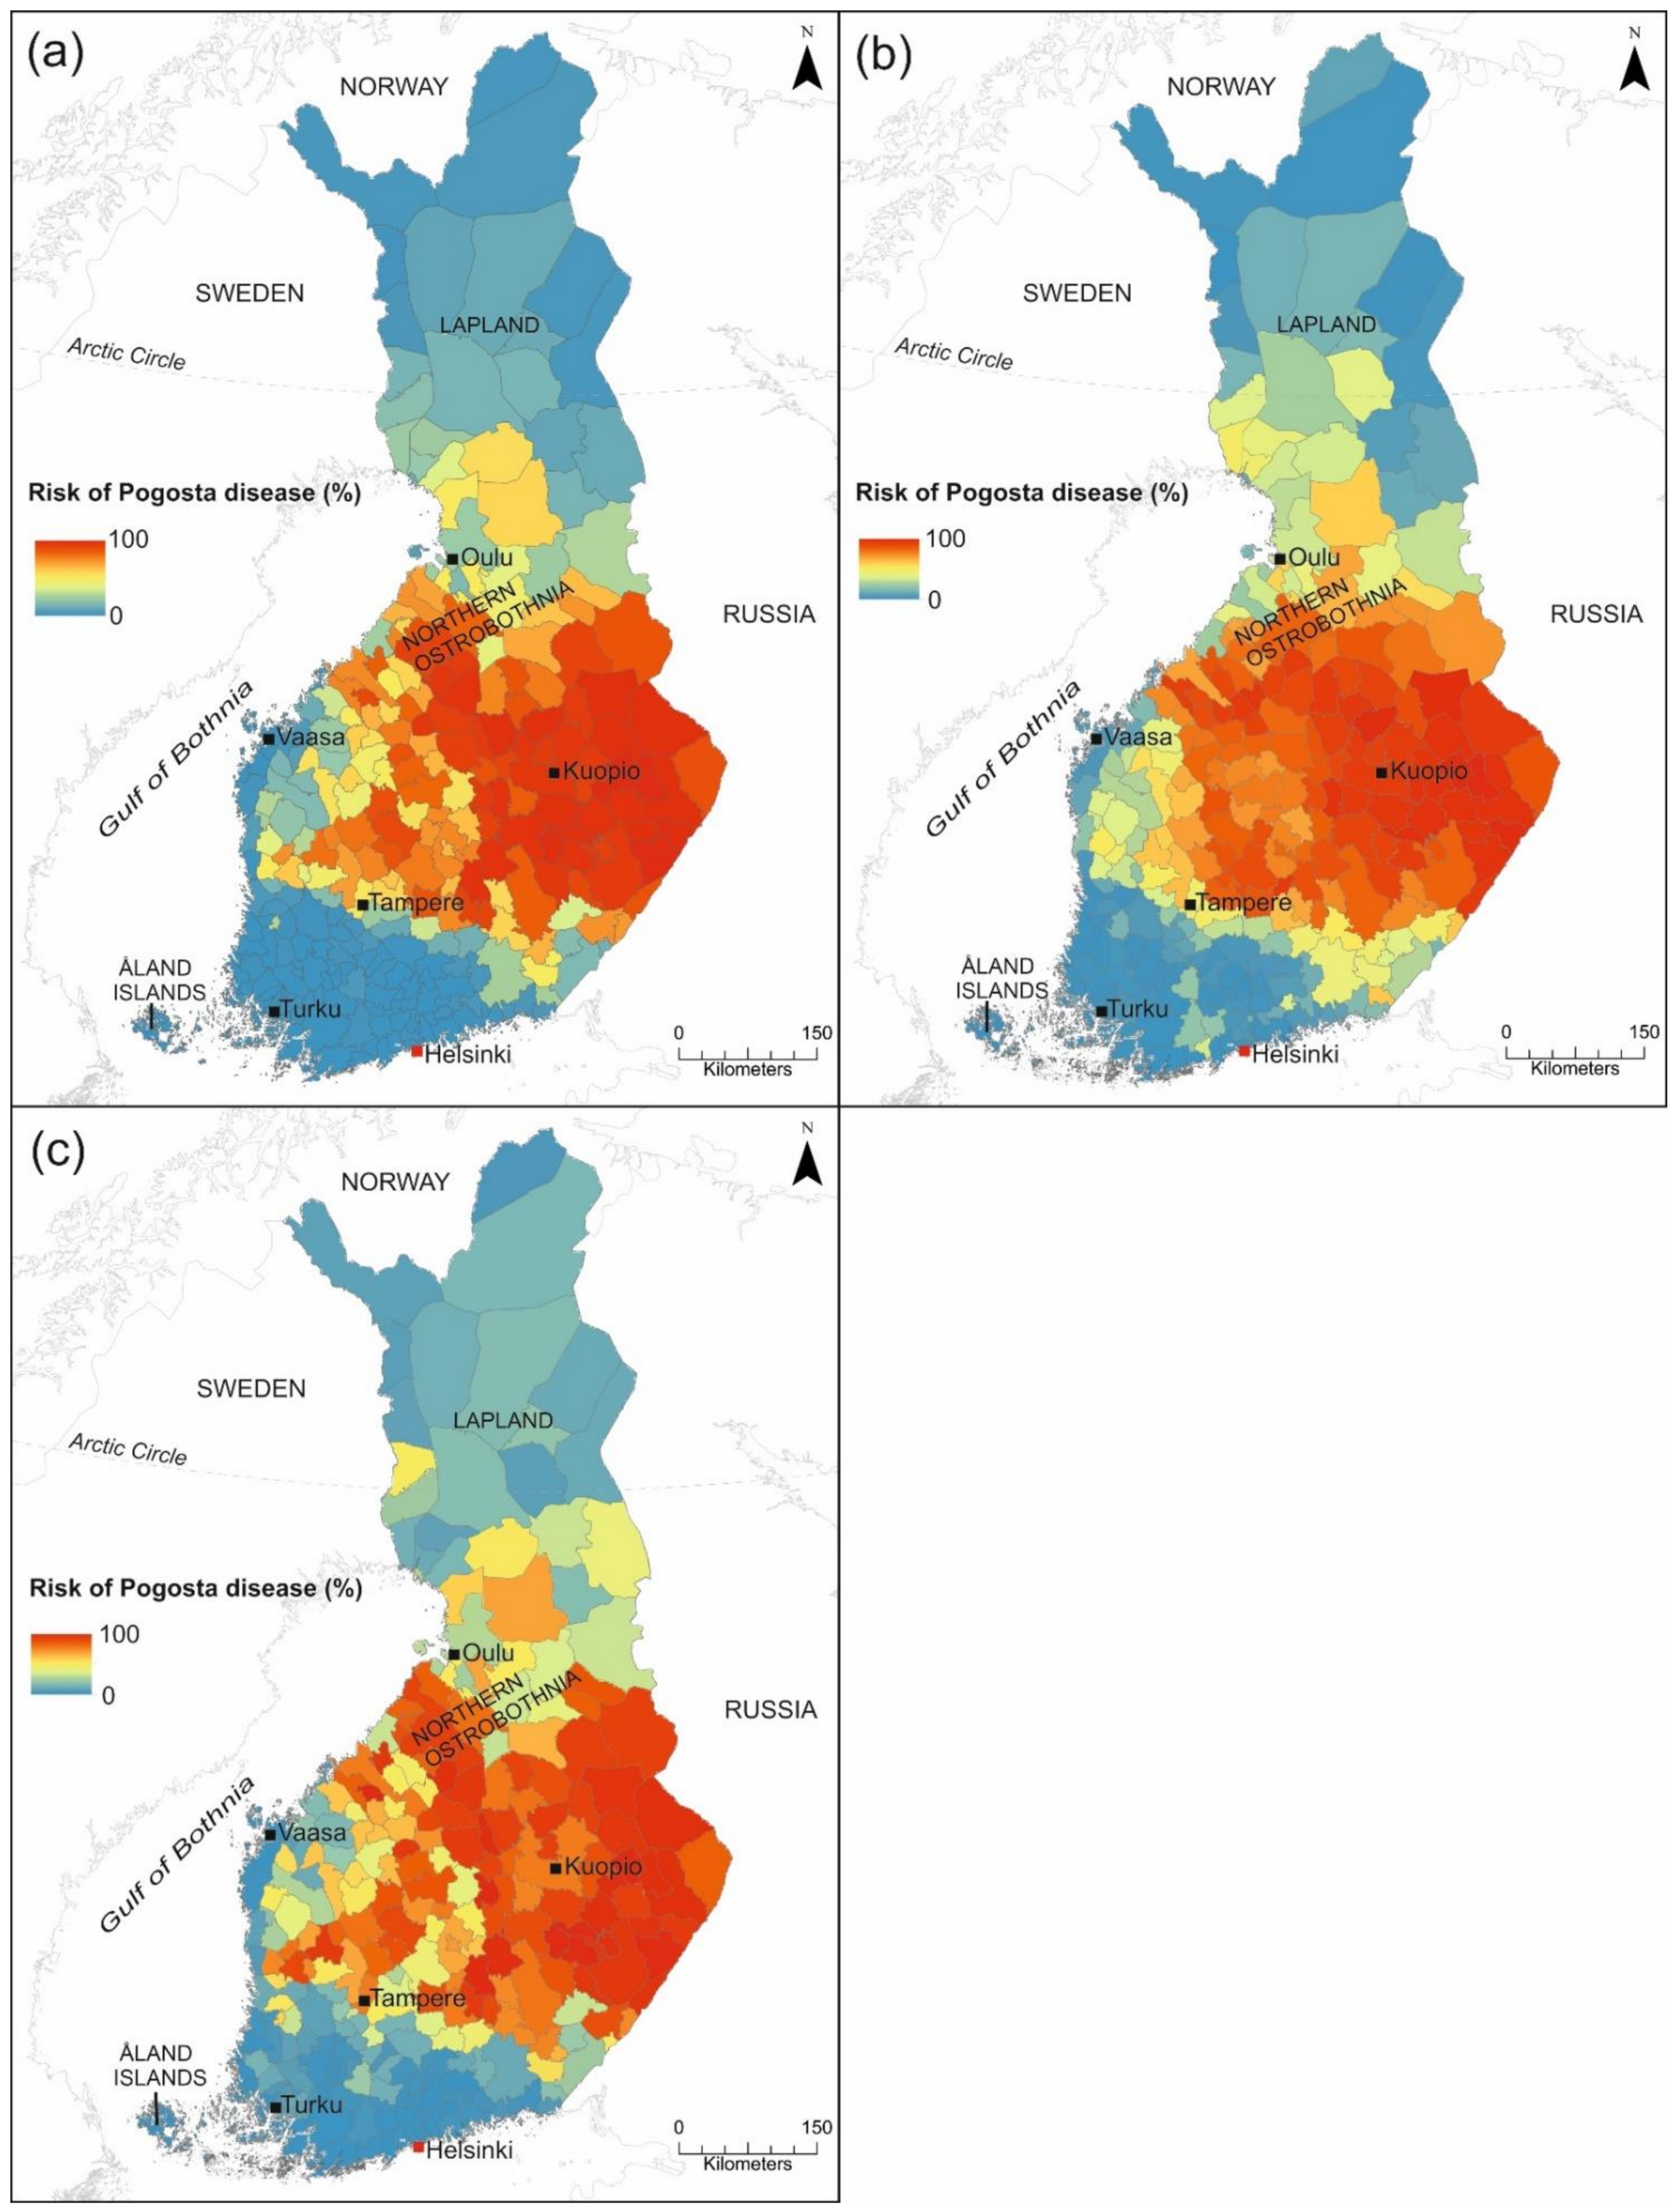
3.2.3. Pogosta Disease Risk Maps

The risk map generated from the weighted mean ensemble suggests that a high risk (70–100%) for Pogosta disease occurs in municipalities located in eastern and central Finland, but also in several municipalities along the western coast (Figure 6a). In municipalities bordering high-risk municipalities, the risk of SINV transmission was moderate (30–70%) based on the GLM model (VECMAP, Figure 6b). In contrast, municipalities in northern Lapland, southwestern Finland and the Åland Islands were estimated to be at a low risk (0–20%) for SINV transmission in all predictions (Figure 6a–c). The high-risk areas of Pogosta disease were similar in all prediction maps. Similar results were obtained with biomod2 and VECMAP analyses with the exception that moderate-risk areas in VECMAP predictions were slightly larger to the prediction based on the weighted mean ensemble model in biomod2 (Figure 6a–c).

4. Discussion

4.1. Validity of the Study

To our knowledge, only a handful of vector-borne disease modeling studies have included suitability data for vectors to predict disease occurrence [6,82]. An ensemble modeling approach was used to predict the potential SINV vectors occurrence and Pogosta disease risk. Ensemble predictions generally yield more accurate estimates over single-model estimates and are widely used to estimate the potential distributions of vectors and vector-borne diseases [83,84]. In VECMAP, both the GLM model and RF models were used to predict Pogosta disease risk. RF models are found to be one of the most accurate model algorithms with high performance in predicting species distributions and are widely used in the field [84,85,86].
Some uncertainty arose from mosquito absences, which were randomly selected from the points where collections were made for a whole-country study [47]. Since collection data covered so many species with differing life histories, any points where potential vectors were absent may not reflect true absences. Among other reasons, absences could be explained by having visited sites when one or more life stages was not active or to be collected or by using collection methods or traps which excluded some species.
There may be also differences in species-specific factors between Cx. pipiens and Cx. torrentium and between Aedes cinereus and Ae. geminus, which were pooled in this study. The distribution of Cx. pipiens extends to southern Lapland but Cx. torrentium is the more dominant of the two species across the whole country. If Cx. torrentium truly is the more dominant of the two species in Lapland, then it is unlikely to be involved in bird to human transmission of the virus since it is not reportedly a species which bite humans. Far less is known about the differences between Ae. cinereus and Ae. geminus, either for biting preferences, or for other behavioral traits. Based on the mosquito collections, Ae. geminus is by far the more dominant species of the two across the whole country [47]. Of all the species that are included in the modelling experiment, Ae. cinereus/geminus are the most common and voracious biters around the whole country. No experiments have sought to determine if one or the other species is more of a human biter than the other. However, based on the general biting habits of true Aedes (12 species), is can be assumed that they would both be aggressive human biters, and as such they would both be involved in the virus transmission. Furthermore, using presence-absence data instead of mosquito abundance data loses information on the relative suitability of habitats when all presences are treated as equal, regardless of the abundance of the individuals that the habitat supports [87]. Pogosta disease patient data [22] are documented by the municipality of residence and may not reflect the actual municipality where patients were infected. Data is also documented based on the date of sample collection rather than the onset of symptoms, which may indicate that there is a time lag of 2–3 weeks to serological diagnosis. Disease awareness among physicians has played a significant role in whether Pogosta disease is diagnosed with serological evidence. As with any infectious diseases with a heterogeneous clinical presentation, it is likely that milder cases or patients that did not experience symptoms did not seek care, and hence would not have been to the NIDR. However, the proportion of unreported cases should not differ regionally. High-resolution data was utilized in the potential vector models, but as Pogosta disease data was available at the municipality level, results were obtained at the same resolution, discarding some of this high-resolution data. We note that other influential variables not considered in this study may exist, such as the occurrence of migratory birds (e.g., passerines), which are known to be associated with SINV infections [8,23,26,88]. However, the number of candidate species of birds potentially involved is too large for all to be included in these models, and a general index of bird abundance may be too nonspecific. In addition, species distribution models (SDMs) of SINV vectors could benefit from micro-climate data or North-Atlantic Oscillation (NAO) index and wind climate [89]. Micro-climate data (spatial resolution < 50 m) better represents thermal and moisture conditions than coarse-scale gridded climate data (≥1 km2) [90], but producing microclimate data is computationally intensive and thus it is not yet feasible to apply in SDMs at the municipality scale. The North-Atlantic Oscillation (NAO) index captures the wide spectrum of conditions related to precipitation (water and snow), winds and temperature. In our future studies, we aim to include migratory bird data, the NAO index and future climate data in order to produce more accurate models to predict the occurrence of SINV infections under changing climate conditions.

4.2. Influential Variables

Consistent with previous research, environmental and climatic variables were important determinants of SINV vector occurrence. In particular, locations with high mean temperatures in June–August during the studied period, rich vegetation and a long growing season positively influenced the occurrence of Ae. cinereus/geminus (Figure A2a). Aedes cinereus larvae are known to need a temperature of 12–13 °C to hatch and 14–15 °C to develop, the optimum temperature being 24–25 °C [91]. Aedes cinereus is also an acidophilic mosquito, most often found in acido-oligotrophic habitats [34]. Based on our results, short distances to coniferous and mixed forest, low wind speed and low solar radiation in May–September were also suitable habitat conditions for Ae. cinereus/geminus. Aedes cinereus larvae mostly occur in semi-permanent, partly shaded pools of flood plains, in sedge marshes or bogs, at the edges of lakes covered by emergent vegetation, and in woodland pools [34]. Our study suggests that Cx. pipiens/torrentium favour locations with high water vapor pressure, high land surface temperatures in June–August during the studied period, low wind speed and barren vegetation (Figure A2b). Culex pipiens/torrentium are widely distributed and able to survive in various habitats, including natural unpolluted and urban polluted habitats close to humans [34,92]. We also found that high precipitation in March–June, high solar radiation in May–September and a long growing season were associated with higher Cs. morsitans occurrence (Figure A2c). Culiseta morsitans deposit their eggs during early summer in the moist substrate above the residual water level [34,93]. Furthermore, locations with moderate precipitation in July–September and October–February, and with short distances to mixed or coniferous forests, had suitable conditions for Cs. morsitans to be present. Suitable sites for Cs. morsitans are known to occur in both shaded and open habitats in swampy woodlands and temporary water bodies in forests [34,94].
Our study demonstrates the combined effects of vector species, host species and environmental factors to explain the occurrence of SINV infections. We found that in municipalities with a high probability of Ae. cinereus/geminus to occur, the risk for SINV infections was also high. To date, most SINV strains recovered by Swedish studies have been isolated from Cx. pipiens, Cx. torrentium and Cs. morsitans [8,28]. A recent study by Lundström et al. (2019) suggests that the increased prevalence of SINV-I, especially in Ae. cinereus and Cx. pipiens/torrentium, is a major cause of recent SINV outbreaks in Northern Europe. Our models suggested that the habitat suitability for Cs. morsitans negatively influenced the risk of SINV infections. This observation somewhat contradicts the notion that the presence of Cs. morsitans is linked to SINV transmission elsewhere in Northern Europe [8,28]. The role of Cs. morsitans in SINV transmission has not yet been studied in Finland, but would benefit from more mosquito collection data to boost predictions of presence. The negative relationship may also be in part due to correlation with unobserved variables or due to multicollinearity among predictors.
We found that high densities of hazel grouse, capercaillie and black grouse positively influenced the occurrence of SINV infections, with very similar response functions, indicating the role of resident grouse in the epidemiology of SINV in humans. On the contrary, we found that high willow grouse density was not associated with high Pogosta disease risk as with other resident grouse. Historically the distribution of willow grouse extended from southern Finland to Lapland, but as a result of population decline, the majority of the remaining willow grouse population is nowadays restricted to Lapland [95,96]. Outbreaks of Pogosta disease have previously been reported to follow a 7-year cycle in Finland [21], and were thought to be influenced by the resident grouse populations that also show 6–7-year cycles [97]. Based on the Pogosta disease cases during recent decades (Figure 1a), distinct epidemic cycles are no longer observed. This might be due, in part, to a reduction in the Finnish grouse populations, which were at a record low in 2009, and subsequently reached similar low values during the summers of 2016–2017. Since 2018, however, the population has shown some signs of recovery [23,96]. We also found that a high proportion of mixed forest in peatland, peatbogs, inland wetlands and lakes was associated with increased Pogosta disease risk. These findings that the natural foci of SINV infections mainly occur in wetland ecosystems of diverse biomes, including lowland forested wetlands and humid forests composed of deciduous and coniferous trees, are consistent with previous research from other European locations [26,98].

4.3. The Suitability for Potential SINV Vectors and the Risk of Pogosta Disease in Finland

The modeling results suggest that suitable habitats for Ae. cinereus/geminus and Cx. pipiens/torrentium occur throughout Finland demonstrating their widespread distribution in Europe including Sweden, Finland´s neighboring country (Figure 3a,b) [34,99]. In contrast, suitable habitats for Cs. morsitans occurred mainly in southern Finland including sporadic areas in western and eastern Finland (Figure 3c). In part this will be due to the relatively low number of collections made in these locations, and will be compounded by the collections frequently being made at unsuitable times of the year to obtain these species, or by including absence points in the dataset which were made at times when these species were inactive. However, Cs. morsitans is found to be species whose distribution ranges from southern Scandinavia to Northern Africa and, based on a Swedish study a majority of Cs. Morsitans, observations were documented in the same latitude where their suitability was highest in Finland [99].
Our study results suggest that the highest risk for SINV infections occurs in municipalities located in central, eastern, and western Finland, which is mainly consistent with previous findings about the incidence of Pogosta disease [21,23,25]. However, when comparing the prediction maps (Figure 6a–c) to the Pogosta disease incidence map 2000–2019 (Figure 1b), several differences are evident. Even though a general trend of geographic distribution of high-incidence municipalities was similar to high-risk municipalities, the geographical extent of high-risk municipalities was much wider on the prediction maps produced in this study (Figure 6a–c). Moderate-risk areas extended from southern Lapland to southern Finland, excluding the southern coast. In comparison with the incidence map, the largest differences occurred in western Finland, southern Lapland and Northern Ostrobothnia, where the risk was either high or moderate in several municipalities based on the prediction maps. This is an important detail when determining area-specific recommendations and delivering information to health care personnel to raise awareness of the disease among physicians. The locations with the highest environmental suitability for Ae. cinereus/geminus and Cx. pipiens/torrentium overlap in geographical range with the municipalities at high risk for SINV infections. In municipalities neighboring high-risk municipalities, the risk of SINV transmission was moderate. We note that northern Lapland, southwestern Finland and the Åland archipelago were estimated to be low-risk areas for SINV transmission. These areas in Finland are also the most extreme ends in terms of wind speed, depth of snow cover or cold air temperatures, and experience less severe heat extremes compared to elsewhere in Finland where climate change impacts are increasing. In northern Lapland, low temperatures and a long winter may halt viral replication and restrict vector populations, which may influence the low probability of Pogosta disease occurrence [100].

5. Conclusions

Despite the wide distribution of SINV in the Old World, the reasons for such a distinct geographical region and high numbers of cases in Finland have remained elusive. Our results provide new evidence for the joint influence of vectors, host species and environmental factors in shaping the pattern of SINV infections in Finland. Environmentally suitable areas were identified for the potential SINV vectors Ae. cinereus/geminus, Cx. pipiens/torrentium and Cs. morsitans. Municipalities with an increased risk of Pogosta disease were characterized by high environmental suitability for Ae. cinereus/geminus; high densities of black grouse, capercaillie and hazel grouse; a high proportion of mixed forest in peatlands; and a high number of lakes. The risk of transmission was predicted to be greatest in eastern and central Finland, and in several municipalities in western Finland, excluding the coastal areas. Future studies predicting the occurrence of Pogosta disease in Finland should also include the temporal dimension, focusing on the occurrence of potential SINV vectors under different scenarios of land use and climate change, as well as the population dynamics of both host and vector species.

Author Contributions

Conceptualization, R.U. and M.S.; methodology, R.U., G.H., C.M. and M.S.; software, R.U., G.H., and C.M.; validation, R.U., M.S. and J.A.; formal analysis, R.U.; investigation, R.U., C.L.C., T.D. and J.S.; resources, O.V. and P.P.; data curation, R.U.; writing—original draft preparation, R.U.; writing—review and editing, M.S., C.L.C., G.H., A.L., T.D., J.A., J.S., C.M., M.T.S., A.V., H.G., E.M.K., E.H., P.P. and O.V.; visualization, R.U.; supervision, M.S., E.H., P.P. and O.V.; project administration, O.V. and P.P.; funding acquisition, O.V. and P.P. All authors have read and agreed to the published version of the manuscript.

Funding

This research was funded by the Doctoral Program in Interdisciplinary Environmental Sciences (DENVI) of the University of Helsinki. The authors would also like to acknowledge their funding from Societas pro Fauna et Flora Fennica, the Academy of Finland for the VECLIMIT project (decision No #329323), and the VEO—European Union’s Horizon 2020- project (decision No #874735). Open access funding provided by University of Helsinki. The authors have declared that no competing interests exist.

Institutional Review Board Statement

This research did not require ethical review before implementation as Finnish law allows the Finnish institute for Health and Welfare to conduct epidemiological research using surveillance data without further requirements.

Informed Consent Statement

This research did not require informed patient consent before implementation as Finnish law allows the Finnish institute for Health and Welfare to conduct epidemiological research using surveillance data without further requirements.

Data Availability Statement

The data presented in this study are available in the article.

Acknowledgments

We would like to thank the Editor and the two anonymous reviewers for constructive comments on the manuscript.

Conflicts of Interest

The authors declare no conflict of interest.

Appendix A

Figure A1. Standardized values for relative contribution of predictors (%) used to predict the distribution of potential SINV vectors in 2000–2019 in Finland. Bars represent the mean value of relative contribution obtained from weighted mean ensemble model.
Ijerph 18 07064 g0a1
Figure A2. The partial dependency plots for (a) Ae. cinereus/geminus, (b) Cx. pipiens/torrentium, and (c) Cs. morsitans based on average mean ensemble models.
Ijerph 18 07064 g0a2aIjerph 18 07064 g0a2b
Figure A3. (a) Standardized relative contribution of predictors (%) obtained from the weighted mean ensemble model in biomod2, (b) variable selection rank order of bootstrap models based on GLM model in VECMAP, and (c) variable contribution based on prediction forest in RF model (VECMAP).
Ijerph 18 07064 g0a3

References

  1. Sutherst, R.W. Global change and human vulnerability to vector-borne diseases. Clin. Microbiol. Rev. 2004, 17, 136–173. [Google Scholar] [CrossRef] [Green Version]
  2. Lambin, E.F.; Tran, A.; Vanwambeke, S.O.; Linard, C.; Soti, V. Pathogenic landscapes: Interactions between land, people, disease vectors, and their animal hosts. Int. J. Health Geogr. 2010, 9, 54. [Google Scholar] [CrossRef] [Green Version]
  3. Eisen, R.J.; Eisen, L. Spatial modeling of human risk of exposure to vector-borne pathogens based on epidemiological versus arthropod vector data. J. Med. Entomol. 2008, 45, 181–192. [Google Scholar] [CrossRef]
  4. Bhatt, S.; Gething, P.W.; Brady, O.J.; Messina, J.P.; Farlow, A.W.; Moyes, C.L.; Drake, J.M.; Brownstein, J.S.; Hoen, A.G.; Sankoh, O.; et al. The global distribution and burden of dengue. Nature 2013, 496, 504–507. [Google Scholar] [CrossRef]
  5. Talmoudi, K.; Bellali, H.; Ben-Alaya, N.; Saez, M.; Malouche, D.; Chahed, M.K. Modeling zoonotic cutaneous leishmaniasis incidence in Central Tunisia from 2009-2015: Forecasting models using climate variables as predictors. PLoS Negl. Trop. Dis. 2017, 11, e0005844. [Google Scholar] [CrossRef] [PubMed] [Green Version]
  6. Messina, J.P.; Brady, O.J.; Golding, N.; Kraemer, M.U.G.; Wint, G.R.W.; Ray, S.E.; Pigott, D.M.; Shearer, F.M.; Johnson, K.; Earl, L.; et al. The current and future global distribution and population at risk of dengue. Nat. Microbiol. 2019, 4, 1508–1515. [Google Scholar] [CrossRef]
  7. EEA. European Environment Agency. Vector-Borne Diseases. 2020. Available online: https://www.eea.europa.eu/data-and-maps/indicators/vector-borne-diseases-2/assessment (accessed on 18 December 2020).
  8. Lundström, J.O.; Hesson, J.C.; Schäfer, M.L.; Östman, Ö.; Semmler, T.; Bekaert, M.; Weidmann, M.; Lundkvist, Å.; Pfeffer, M. Sindbis virus polyarthritis outbreak signalled by virus prevalence in the mosquito vectors. PLoS Negl. Trop. Dis. 2019, 13, e0007702. [Google Scholar] [CrossRef] [Green Version]
  9. Musa, G.J.; Chiang, P.; Sylk, T.; Bavley, R.; Keating, W.; Lakew, B.; Tsou, H.; Hoven, C.W. Use of GIS mapping as a public health tool-from cholera to cancer. Health Serv. Insights 2013, 6, 111–116. [Google Scholar] [CrossRef]
  10. Carroll, L.N.; Au, A.P.; Detwiler, L.T.; Fu, T.; Painter, I.S.; Abernethy, N.F. Visualization and analytics tools for infectious disease epidemiology: A Systematic Review. J. Biomed. Inform. 2014, 51, 287–298. [Google Scholar] [CrossRef] [Green Version]
  11. Taylor, R.M.; Hurlbut, H.S.; Work, T.H.; Kingston, J.R.; Frothingham, T.E. Sindbis Virus: A newly recognized arthropod-transmitted virus. Am. J. Trop. Med. Hyg. 1955, 4, 844–862. [Google Scholar] [CrossRef] [PubMed]
  12. Calisher, C.H.; Monath, T.P.; Mitchell, C.J.; Sabattini, M.S.; Cropp, C.B.; Kerschner, J.; Hunt, A.R.; Lazuick, J.S. Arbovirus investigations in Argentina, 1977–1980. Am. J. Trop. Med. Hyg. 1985, 34, 956–965. [Google Scholar] [CrossRef] [PubMed]
  13. Hubálek, Z. Mosquito-borne viruses in Europe. Parasitol. Res. 2008, 103 (Suppl. 1), 29. [Google Scholar] [CrossRef]
  14. Laine, M.; Luukkainen, R.; Toivanen, A. Sindbis viruses and other alphaviruses as cause of human arthritic disease. J. Intern. Med. 2004, 256, 457–471. [Google Scholar] [CrossRef] [PubMed]
  15. Kurkela, S.; Manni, T.; Myllynen, J.; Vaheri, A.; Vapalahti, O. Clinical and laboratory manifestations of sindbis virus infection: Prospective study, Finland, 2002–2003. J. Infect. Dis. 2005, 191, 1820–1829. [Google Scholar] [CrossRef]
  16. Kurkela, S. Sindbis Virus and Pogosta Disease in Finland. Ph.D. Thesis, University of Helsinki, Helsinki, Finland, 2007. Retrieved from HELDA. Available online: http://hdl.handle.net/10138/20554 (accessed on 20 September 2020).
  17. ECDC. European Centre for Disease Prevention and Control. Facts about Sindbis Fever. 2020. Available online: https://www.ecdc.europa.eu/en/sindbis-fever/facts (accessed on 18 December 2020).
  18. Go, Y.; Balasuriya, U.; Lee, C. Zoonotic encephalitides caused by arboviruses: Transmission and epidemiology of alphaviruses and flaviviruses. Clin. Exp. Vaccine Res. 2014, 3, 58–77. [Google Scholar] [CrossRef] [PubMed] [Green Version]
  19. Jupp, P.G.; Blackburn, N.K.; Thompson, D.L.; Meenehan, G.M. Sindbis and West Nile virus infections in the Witwatersrand-Pretoria region. S. Afr. Med. J. 1986, 70, 218–220. [Google Scholar]
  20. Lundström, J.O.; Vene, S.; Espmark, A.; Engvall, M.; Niklasson, B. Geographical and temporal distribution of Ockelbo disease in Sweden. Epidemiol. Infect. 1991, 106, 567–574. [Google Scholar] [CrossRef]
  21. Brummer-Korvenkontio, M.; Vapalahti, O.; Kuusisto, P.; Saikku, P.; Manni, T.; Koskela, P.; Nygrén, T.; Brummer-Korvenkontio, H.; Vaheri, A. Epidemiology of Sindbis virus infections in Finland 1981–96: Possible factors explaining a peculiar disease pattern. Epidemiol. Infect. 2002, 129. [Google Scholar] [CrossRef]
  22. NIDR. Finnish National Infectious Diseases Register. 2021. Available online: https://thl.fi/en/web/infectious-diseases-and-vaccinations/surveillance-and-registers/finnish-national-infectious-diseases-register (accessed on 25 May 2021).
  23. Kurkela, S.; Rätti, O.; Huhtamo, E.; Uzcátegui, N.Y.; Nuorti, J.P.; Laakkonen, J.; Manni, T.; Helle, P.; Vaheri, A.; Vapalahti, O. Sindbis virus infection in resident birds, migratory birds, and humans, Finland. Emerg. Infect. Dis. 2008, 14, 41–47. [Google Scholar] [CrossRef]
  24. THL. Terveyden ja Hyvinvoinnin Laitos, National Institute for Health and Welfare. Infectious Diseases in Finland 1995–2009. Report 28/2010. 2010. Available online: http://urn.fi/URN:NBN:fi-fe201205085094 (accessed on 18 December 2020).
  25. Sane, J.; Guedes, S.; Kurkela, S.; Lyytikäinen, O.; Vapalahti, O. Epidemiological analysis of mosquito-borne Pogosta disease in Finland, 2009. Eurosurveillance 2010, 15, 19462. [Google Scholar] [CrossRef]
  26. Lundström, J.O.; Lindström, K.M.; Olsen, B.; Dufva, R.; Krakower, D.S. Prevalence of Sindbis virus neutralizing antibodies among swedish passerines indicates that thrushes are the main amplifying hosts. J. Med. Entomol. 2001, 38, 289–297. [Google Scholar] [CrossRef]
  27. Hesson, J.C.; Verner-Carlsson, J.; Larsson, A.; Ahmed, R.; Lundkvist, Å.; Lundström, J.O. Culex torrentium mosquito role as major enzootic vector defined by rate of Sindbis virus infection, Sweden, 2009. Emerg. Infect. Dis. 2015, 21, 875–878. [Google Scholar] [CrossRef] [PubMed]
  28. Francy, D.B.; Jaenson, T.G.; Lundström, J.O.; Schildt, E.B.; Espmark, A.; Henriksson, B.; Niklasson, B. Ecologic studies of mosquitoes and birds as hosts of Ockelbo virus in Sweden and isolation of Inkoo and Batai viruses from mosquitoes. Am. J. Trop. Med. Hyg. 1989, 41, 355–363. [Google Scholar] [CrossRef] [PubMed]
  29. Turell, M.; Lundström, J.; Niklasson, B. Transmission of Ockelbo virus by Aedes cinereus, A. communis, and A. excrucians (Diptera: Culicidae) collected in an enzootic area in central Sweden. J. Med. Entomol. 1990, 27, 266–268. [Google Scholar] [CrossRef] [PubMed]
  30. Turell, M.J. Members of the Culex pipiens complex as vectors of viruses. J. Am. Mosq. Control Assoc. 2012, 28, 123–126. [Google Scholar] [CrossRef] [PubMed]
  31. Sane, J.; Kurkela, S.; Putkuri, N.; Huhtamo, E.; Vaheri, A.; Vapalahti, O. Complete coding sequence and molecular epidemiological analysis of Sindbis virus isolates from mosquitoes and humans, Finland. J. Gen. Virol. 2012, 93, 1984–1990. [Google Scholar] [CrossRef]
  32. Tingström, O.; Lwande, O.; Näslund, J.; Spyckerelle, I.; Engdahl, C.; Von Schoenberg, P.; Ahlm, C.; Evander, M.; Bucht, G. Detection of Sindbis and Inkoo virus RNA in genetically typed mosquito larvae sampled in northern Sweden. Vector Borne Zoonotic Dis. 2016, 16. [Google Scholar] [CrossRef] [Green Version]
  33. Korhonen, E.M.; Suvanto, M.T.; Uusitalo, R.; Faolotto, G.; Smura, T.; Sane, J.; Vapalahti, O.; Huhtamo, E. Sindbis virus strains of divergent origin isolated from humans and mosquitoes during a recent outbreak in Finland. Vector Borne Zoonotic Dis. 2020, 20, 843–849. [Google Scholar] [CrossRef]
  34. Becker, N.; Petrić, D.; Zgomba, M.; Boase, C.; Madon, M.; Dahl, C.; Kaiser, A. Mosquitoes and Their Control, 2nd ed.; Springer: Berlin/Heidelberg, Germany, 2010; pp. 3–8. [Google Scholar] [CrossRef]
  35. Lwande, O.W.; Näslund, J.; Lundmark, E.; Ahlm, K.; Ahlm, C.; Bucht, G.; Evander, M. Experimental infection and transmission competence of Sindbis virus in Culex torrentium and Culex pipiens mosquitoes from Northern Sweden. Vector Borne Zoonotic Dis. 2019, 19, 128–133. [Google Scholar] [CrossRef] [Green Version]
  36. Bergman, A.; Dahl, E.; Lundkvist, Å.; Hesson, J.C. Sindbis virus infection in non-blood-fed hibernating Culex pipiens mosquitoes in Sweden. Viruses 2020, 12, 1441. [Google Scholar] [CrossRef] [PubMed]
  37. Reiter, P. Weather, vector biology, and arboviral recrudescence. In The Arboviruses: Epidemiology and Ecology, 1st ed.; CRC Press: Boca Raton, FL, USA, 1988; pp. 245–256. [Google Scholar]
  38. Brady, O.J.; Johansson, M.A.; Guerra, C.A.; Bhatt, S.; Golding, N.; Pigott, D.M.; Delatte, H.; Grech, M.G.; Leisnham, P.T.; Maciel-de-Freitas, R.; et al. Modelling adult Aedes aegypti and Aedes albopictus survival at different temperatures in laboratory and field settings. Parasites Vectors 2013, 6, 351. [Google Scholar] [CrossRef] [Green Version]
  39. ECDC. European Centre for Disease Prevention and Control. Vector-Borne Diseases. 2020. Available online: https://www.ecdc.europa.eu/en/climate-change/climate-change-europe/vector-borne-diseases (accessed on 18 December 2020).
  40. Reisen, W.K.; Fang, Y.; Martinez, V.M. Effects of temperature on the transmission of West Nile virus by Culex tarsalis (Diptera: Culicidae). J. Med. Entomol. 2006, 43, 309–317. [Google Scholar] [CrossRef] [Green Version]
  41. Tian, H.; Bi, P.; Cazelles, B.; Zhou, S.; Huang, S.; Jing, Y.; Pei, Y.; Wu, X.; Fu, S.; Tong, S.; et al. How environmental conditions impact mosquito ecology and Japanese encephalitis: An eco-epidemiological approach. Environ. Int. 2015, 79, 17–24. [Google Scholar] [CrossRef] [PubMed]
  42. Poh, K.C.; Chaves, L.F.; Reyna-Nava, M.; Roberts, C.M.; Fredregill, C.; Bueno, R.; Debboun, M.; Hamer, G.L. The influence of weather and weather variability on mosquito abundance and infection with West Nile virus in Harris County, Texas, USA. Sci. Total Environ. 2019, 675, 260–272. [Google Scholar] [CrossRef]
  43. Morin, C.W.; Comrie, A.C. Regional and seasonal response of a West Nile virus vector to climate change. Proc. Natl. Acad. Sci. USA 2013, 110, 15620–15625. [Google Scholar] [CrossRef] [Green Version]
  44. Trawinski, P.R.; Mackay, D.S. Identification of environmental covariates of West Nile virus vector mosquito population abundance. Vector Borne Zoonotic Dis. 2010, 10, 515–526. [Google Scholar] [CrossRef]
  45. Jalava, K.; Sane, J.; Ollgren, J.; Ruuhela, R.; Rätti, O.; Kurkela, S.; Helle, P.; Hartonen, S.; Pirinen, P.; Vapalahti, O.; et al. Climatic, ecological and socioeconomic factors as predictors of Sindbis virus infections in Finland. Epidemiol. Infect. 2012, 141, 1–10. [Google Scholar] [CrossRef]
  46. Hesson, J.; Rettich, F.; Merdic, E.U.H.; Vignjević, G.; Östman, Ö.; Schäfer, M.; Schaffner, F.; Foussadier, R.; Besnard, G.; Medlock, J.; et al. The arbovirus vector Culex torrentium is more prevalent than Culex pipiens in northern and central Europe. Med. Vet. Entomol. 2014, 28, 179–186. [Google Scholar] [CrossRef] [PubMed]
  47. Culverwell, C.L.; Uusitalo, R.J.; Korhonen, E.M.; Vapalahti, O.P.; Huhtamo, E.; Harbach, R.E. The mosquitoes of Finland: Updated distributions and bionomics. Med. Vet. Entomol. 2021, 35, 1–29. [Google Scholar] [CrossRef] [PubMed]
  48. Barbet-Massin, M.; Jiguet, F.; Albert, C.; Thuiller, W. Selecting pseudo-absences for species distribution models: How, where and how many? Methods Ecol. Evol. 2012, 3, 327–338. [Google Scholar] [CrossRef]
  49. Helle, P.; Ikonen, K.; Kantola, A. Wildlife monitoring in Finland-on-line information to game administration, hunters and the wider public. Can. J. For. Res. 2016, 46. [Google Scholar] [CrossRef]
  50. Venäläinen, A.; Laapas, M.; Pirinen, P.; Horttanainen, M.; Hyvönen, R.; Lehtonen, I.; Junila, P.; Hou, M.; Peltola, H. Estimation of the high-spatial-resolution variability in extreme wind speeds for forestry applications. Earth Syst. Dyn. 2017, 8, 529–545. [Google Scholar] [CrossRef] [Green Version]
  51. Aalto, J.; Pirinen, P.; Jylhä, K. New gridded daily climatology of Finland: Permutation-based uncertainty estimates and temporal trends in climate. J. Geophys. Res. Atmos. 2016, 121. [Google Scholar] [CrossRef] [Green Version]
  52. Pirinen, P.; Simola, H.; Aalto, J.; Kaukoranta, J.; Karlsson, P.; Ruuhela, R. Tilastoja Suomen Ilmastosta 1981–2010 (Climatological Statistics of Finland 1981–2010); Finnish Meteorological Institute: Helsinki, Finland, 2012. [Google Scholar]
  53. SYKE, Finnish Environment Institute. Corine Maanpeite 2018. 2020. Available online: https://ckan.ymparisto.fi/dataset/%7B0B4B2FAC-ADF1-43A1-A829-70F02BF0C0E5%7D (accessed on 17 December 2020).
  54. Statistics Finland. 2020. Available online: https://tilastokeskus-kartta.swgis.fi/# (accessed on 17 September 2020).
  55. Salmivaara, A.; Launiainen, S.; Tuominen, S.; Ala-Ilomäki, J.; Finér, L. Topographic Wetness Index for Finland; Natural Resources Institute Finland: Helsinki, Finland, 2017; Available online: http://urn.fi/urn:nbn:fi:csc-kata20170511114638598124 (accessed on 10 May 2020).
  56. NLS of Finland, National Land Survey of Finland. Digital Elevation Model 2019. 10 m x 10 m. Available online: http://urn.fi/urn:nbn:fi:csc-kata00001000000000000622 (accessed on 10 May 2020).
  57. Fick, S.; Hijmans, R. WorldClim 2: New 1-km spatial resolution climate surfaces for global land areas. Int. J. Climatol. 2017, 37. [Google Scholar] [CrossRef]
  58. Didan, K. MOD13A3 MODIS/Terra Vegetation Indices Monthly L3 Global 1 km SIN Grid V006. NASA EOSDIS Land Processes DAAC. 2015. [Google Scholar]
  59. Wan, Z.; Hook, S.; Hulley, G. MYD11C3 MODIS/Aqua Land Surface Temperature/Emissivity Monthly L3 Global 0.05Deg CMG V006 [Data set]. NASA EOSDIS Land Processes DAAC. 2015. [Google Scholar]
  60. R Core Team. R: A Language and Environment for Statistical Computing; R Foundation for Statistical Computing: Vienna, Austria, 2019; Available online: http://www.R-project.org/ (accessed on 7 June 2020).
  61. Thuiller, W.; Lafourcade, B.; Engler, R.; Araújo, M. BIOMOD-A platform for ensemble forecasting of species distributions. Ecography 2009, 32, 369–373. [Google Scholar] [CrossRef]
  62. Thuiller, W.; Georges, D.; Engler, R. Biomod2: Ensemble Platform for Species Distribution Modelling. 2014. R Package Version 3.1-64. Available online: https://mran.microsoft.com/snapshot/2014-10-20/web/packages/biomod2/biomod2.pdf (accessed on 2 February 2020).
  63. Kruijff, M.; Hendrickx, G.; Wint, W.; Ginati, A. Mapping habitats for vectors of infectious disease: VECMAP. In Proceedings of the International Astronautical Congress, Cape Town, South Africa, 3–7 October 2011; Available online: https://business.esa.int/sites/default/files/KruijffIAC-11-B5%201%2010%20-%20VECMAP%20-%20v2.2.pdf (accessed on 18 September 2020).
  64. Besley, D.A.; Kuh, E.; Welsh, R.E. Regression Diagnostics: Identifying Influential Data and Sources of Collinearity; Wiley & Sons, Inc.: New York, NY, USA, 1980. [Google Scholar]
  65. Naimi, B.; Hamm, N.A.S.; Groen, T.A.; Skidmore, A.K.; Toxopeus, A.G. Where is positional uncertainty a problem for species distribution modelling? Ecography 2014, 37, 191–203. [Google Scholar] [CrossRef]
  66. Dormann, C.; Elith, J.; Bacher, S.; Buchmann, C.; Carl, G.; Carré, G.; Diekötter, T.; García Márquez, J.; Gruber, B.; Lafourcade, B.; et al. Collinearity: A review of methods to deal with it and a simulation study evaluating their performance. Ecography 2013, 36, 27–46. [Google Scholar] [CrossRef]
  67. McCullagh, P.; Nelder, J.A. Generalized Linear Models, 2nd ed.; Chapman & Hall: London, UK, 1989. [Google Scholar]
  68. Hastie, T.J.; Tibshirani, R. Generalized Additive Models, 1st ed.; Chapman and Hall: London, UK, 1990. [Google Scholar]
  69. Breiman, L.; Friedman, J.; Stone, C.J.; Olshen, R.A. Classification and Regression Trees, 1st ed.; Chapman and Hall: London, UK, 1984. [Google Scholar]
  70. Ripley, B.D. Pattern Recognition and Neural Networks; Cambridge University Press: Cambridge, UK, 1996. [Google Scholar] [CrossRef]
  71. Friedman, J.H. Multivariate adaptive regression splines. Ann. Statist. 1991, 19, 1–67. [Google Scholar] [CrossRef]
  72. Ridgeway, G. The state of boosting. Comput. Sci. Stat. 1999, 31, 172–181. [Google Scholar]
  73. Breiman, L. Random forests. Mach. Learn. 2001, 45, 5–32. [Google Scholar] [CrossRef] [Green Version]
  74. Phillips, S.; Dudík, M.; Schapire, R. A maximum entropy approach to species distribution modeling. In Proceedings of the Twenty-First International Conference on Machine Learning (ICML 2004), Banff, AB, Canada, 4–8 July 2004; p. 83. [Google Scholar] [CrossRef] [Green Version]
  75. Zhao, C.; Gao, F. A nested-loop fisher discriminant analysis algorithm. Chemom. Intellig. Lab. Syst. 2015, 146, 396–406. [Google Scholar] [CrossRef]
  76. Elith, J.; Graham, C.; Anderson, R.; Dudík, M.; Ferrier, S.; Guisan, A.; Hijmans, R.; Huettmann, F.; Leathwick, J.; Lehmann, A.; et al. Novel methods improve prediction of species’ distributions from occurence data. Ecography 2006, 29, 129–151. [Google Scholar] [CrossRef] [Green Version]
  77. Pearson, R.; Thuiller, W.; Araújo, M.; Martínez-Meyer, E.; Brotons, L.; Mcclean, C.; Miles, L.; Segurado, P.; Dawson, T.; Lees, D. Model-based uncertainty in species range prediction. J. Biogeogr. 2006, 33, 174–1711. [Google Scholar] [CrossRef]
  78. Wood, S.N. Fast stable restricted maximum likelihood and marginal likelihood estimation of semiparametric generalized linear models. J. R. Stat. Soc. Ser. B 2011, 73, 3–36. [Google Scholar] [CrossRef] [Green Version]
  79. Guisan, A.; Zimmermann, N. Predictive habitat distribution models in ecology. Ecol. Model. 2000, 135, 147–186. [Google Scholar] [CrossRef]
  80. Fielding, A.H.H. A review of methods for the assessment of prediction errors in conservation presence/absence models. Environ. Conserv. J. 1997, 24, 38–49. [Google Scholar] [CrossRef]
  81. Ruete, A.; Leynaud, G. Goal-oriented evaluation of species distribution models’ accuracy and precision: True skill statistic profile and uncertainty maps. PeerJ Prepr. 2015, 3, e1478. [Google Scholar] [CrossRef] [Green Version]
  82. Akhtar, M.; Kraemer, M.U.G.; Gardner, L.M. A dynamic neural network model for predicting risk of zika in real time. BMC Med. 2019, 17, 171. [Google Scholar] [CrossRef] [PubMed] [Green Version]
  83. Araújo, M.B.; New, M. Ensemble forecasting of species distributions. Trends Ecol. Evol. 2007, 22, 42–47. [Google Scholar] [CrossRef] [PubMed]
  84. Sintayehu, D.W.; Tassie, N.; De Boer, W.F. Present and future climatic suitability for dengue fever in Africa. Infect. Ecol. Epidemiol. 2020, 10, 1782042. [Google Scholar] [CrossRef] [PubMed]
  85. Li, X.; Wang, Y. Applying various algorithms for species distribution modelling. Integr. Zool. 2013, 8, 124–135. [Google Scholar] [CrossRef] [PubMed]
  86. Lippi, C.; Gaff, H.; White, A.; John, H.; Richards, A.; Ryan, S. Exploring the niche of Rickettsia montanensis (Rickettsiales: Rickettsiaceae) infection of the American dog tick (Acari: Ixodidae), using multiple species distribution model approaches. J. Med. Entomol. 2021, 58, 1083–1092. [Google Scholar] [CrossRef] [PubMed]
  87. Pearce, J.L.; Boyce, M.S. Modelling distribution and abundance with presence-only data. J. Appl. Ecol. 2006, 43, 405–412. [Google Scholar] [CrossRef]
  88. Lundström, J.; Turell, M.; Niklasson, B. Viremia in three orders of birds (anseriformes, galliformes and passeriformes) inoculated with Ockelbo virus. J. Wildl. Dis. 1993, 29, 189–195. [Google Scholar] [CrossRef] [Green Version]
  89. Laurila, T.K.; Sinclair, V.A.; Gregow, H. Climatology, variability, and trends in near-surface wind speeds over the North Atlantic and Europe during 1979–2018 based on ERA5. Int. J. Climatol. 2021, 41, 2253–2278. [Google Scholar] [CrossRef]
  90. Lembrechts, J.J.; Lenoir, J.; Roth, N.; Hattab, T.; Milbau, A.; Haider, S.; Pellissier, L.; Pauchard, A.; Ratier Backes, A.; Dimarco, R.D.; et al. Comparing temperature data sources for use in species distribution models: From in-situ logging to remote sensing. Global Ecol. Biogeogr. 2019, 28, 1578–1596. [Google Scholar] [CrossRef]
  91. Mohrig, W. Die Culiciden Deutschlands. Untersuchungen zur taxonomie, biologie und ökologie der einheimischen stechmücken. Parasitol. Schr. 1969, 18, 1–260. [Google Scholar]
  92. Harbach, R.E. Culex pipiens: Species versus species complex taxonomic history and perspective. J. Am. Mosq. Control Assoc. 2012, 28, 10–23. [Google Scholar] [CrossRef]
  93. Medlock, J.M.; Snow, K.R.; Leach, S. Potential transmission of West Nile virus in the British Isles: An ecological review of candidate mosquito bridge vectors. Med. Vet. Entomol. 2005, 19, 2–21. [Google Scholar] [CrossRef] [PubMed]
  94. Medlock, J.M.; Vaux, A.G.C. Seasonal dynamics and habitat specificity of mosquitoes in an English wetland: Implications for UK wetland management and restoration. J. Vector Ecol. 2015, 40, 90–106. [Google Scholar] [CrossRef]
  95. Finnish Museum of Natural History. Finnish Breeding Bird Atlas. 2020. Available online: http://atlas3.lintuatlas.fi/results/species/willow%20grouse (accessed on 17 December 2020).
  96. NRIF. Natural Resources Institute of Finland. Metsäkanalintujen Kannat Edelleen Kasvussa. 2019. Available online: https://www.luke.fi/uutinen/metsakanalintujen-kannat-edelleen-kasvussa/ (accessed on 17 December 2020).
  97. Lindström, J.; Ranta, E.; Kaitala, V.; Lindén, H. The clockwork of Finnish tetraonid population dynamics. Oikos 1995, 74, 185–194. [Google Scholar] [CrossRef]
  98. Ernek, E.; Kožuch, O.; Nosek, J.; Labuda, M. Evidence for circulation of Sindbis virus and other arboviruses by using sentinel animals in western Slovakia. Intervirology 1973, 2, 186–192. [Google Scholar] [CrossRef] [PubMed]
  99. Lundström, J.; Schäfer, M.; Hesson, J.; Blomgren, E.; Lindström, A.; Wahlqvist, P.; Halling, A.; Hagelin, A.; Ahlm, C.; Evander, M.; et al. The geographic distribution of mosquito species in Sweden. J. Am. Mosq. Control Assoc. 2013, 31, 35. [Google Scholar]
  100. Ciota, A.T.; Keyel, A.C. The role of temperature in transmission of zoonotic arboviruses. Viruses 2019, 11, 1013. [Google Scholar] [CrossRef] [PubMed] [Green Version]
Figure 1. (a) Human Pogosta disease cases registered in Finland during 2000–2019. (b) The average incidence of Pogosta disease per 1000 inhabitants over a 20-year period in Finland. (c) Annual number of Pogosta disease cases, and (d) mean monthly Pogosta disease cases notified in Finland in 2000–2019 [22]. An incidence rate below 0.48 was considered as absence of the disease.
Ijerph 18 07064 g001
Figure 2. Workflow of modeling the spatial distribution of (a) potential SINV vectors with biomod2 approach, and (b) Pogosta disease with biomod2 and VECMAP approach.
Ijerph 18 07064 g002
Figure 3. Prediction maps for (a) Ae. cinereus/geminus, (b) Cx. pipiens/torrentium, and (c) Cs. morsitans in Finland based on weighted mean ensemble model.
Ijerph 18 07064 g003
Figure 4. (a) Model performance comparison of 8 model algorithms by area under the receiver operating characteristic curve (AUC) and true skill statistics (TSS) values of 50 model runs in biomod2. The points represent the mean values and the solid lines represent the 95% range of variation. ANN = artificial neural networks; CTA = classification tree analysis; GAM = generalized additive models; GBM = generalized boosted models; GLM = generalized linear models; MARS = multivariate additive regression splines; MAXENT = maximum entropy models; RF = random forest model. (b) Model performance based on weighted mean ensemble model (EMwMean) in biomod2 and GLM and RF models in VECMAP.
Ijerph 18 07064 g004
Figure 5. The partial dependency plots for Pogosta disease modeling based on the weighted mean ensemble model produced by biomod2.
Ijerph 18 07064 g005
Figure 6. Predicted risk of Pogosta disease in Finland by (a) weighted mean ensemble model produced by biomod2, and (b) GLM model, and (c) RF model produced by VECMAP. The risk is expressed on a scale between 0 (low risk) to 100 (high risk) and visualized with colours ranging from blue (low-risk area) and to red (high-risk area).
Ijerph 18 07064 g006
Table 1. Description and source of all predictor data.
Data SourceData Layer(s)ModificationsYearSpatial ResolutionReferences
FMIWind speed 50 years return interval (m/s)Calculated mean wind speed 50 y interval per municipality.1979–201520 m[50]
FMIMean monthly air temperature (°C)Calculated mean monthly temperature per municipality in 2000–2019 in July–September, October–February and March–June. Air temperature measurement height was 2 m (FMI).2000–20191000 m[51]
FMIMean monthly precipitation (mm)Calculated mean monthly precipitation per municipality in 2000–2019 in July–September, October–February and March–June.2000–20191000 m[51]
FMIMean monthly snow depth (cm)Calculated mean monthly snow depth per municipality in 2000–2019 in October–November, December–February and March–April.2000–20191000 m[51]
FMIMean precipitation during growing season (mm)Calculated mean precipitation during growing season per municipality.averages for 1981–2010 1000 m[52]
FMIMean heat summation during growing season (°C day)Calculated mean heat summation during growing season per municipality.averages for 1981–2010 1000 m[52]
FMIGrowing season length (GLS) (day)Calculated growing season length (GLS) per municipality.averages for 1981–2010 1000 m[52]
LUKEDensity (individuals/km2) of willow grouse (Lagopus lagopus), black grouse (Lyrurus tetrix), capercaillie (Tetrao urogallus) and hazel grouse (Tetrastes bonasia)Average annual densities at a 100 km radius from the municipality center, further averaged over the years. Based on wildlife triangle census.2000–2019Municipality[49]
SYKE, EEA, EU/Copernicus programmeCORINE land cover 2018Euclidean distances to selected land cover types from mosquito species PA point were calculated in ArcGIS. Proportion (%) of chosen land cover types were derived by calculating percentage of each land cover type for municipality.201820 m[53]
Statistics FinlandHuman population density (persons/km2)Calculated as sum per municipality.20191000 m[54]
Statistics FinlandSummer cottage density (cottages/km2)Calculated in ArcGIS in order to present summer cottages per area (km2) of municipality.2019Municipality[54]
Kurkela et al. 2008Mean seroprevalence of SINV in human population in FinlandSeroprevalence rate was taken from the hospital district in which municipality belongs to.1999–2003Hospital districts [23]
NLS of FinlandTopographic wetness index (TWI) Calculated mean TWI per municipality.201616 × 16 m[55]
NLS of FinlandDigital elevation model (m)Calculated mean elevation per municipality.201910 × 10 m[56]
WorldClim- Global climate dataSolar radiation (kJ m−2 day−1)Calculated mean solar radiation in May–September.averages for 1980–2000 ~1000 m[57]
WorldClim- Global climate dataWater vapor pressure (kPa)Calculated mean water vapor pressure in May–September.averages for 1980–2000 ~1000 m[57]
NASA EarthdataNormalized Difference Vegetation Index (NDVI) (MOD13A3)Calculated mean NDVI in June 2000–2019 per municipality.in June,
2000–2019
1000 m[58]
NASA EarthdataLand surface temperature (°C) (MOD11C3)Calculated mean monthly LST per municipality in 2000–2019 April–May, June–August and September–October2000–20195600 m[59]
Lorna Culverwell, Jenny HessonThe distribution data of Cs. morsitans, Cx.pipiens/torrentium and Ae. cinereus/geminusThe occurrence data of Cx. pipiens and Cx. torrentium, and Ae. cinereus and Ae. geminus, were unified to Cx. pipiens/torrentium and Ae. cinereus/geminus due to the lack of reliable identification methods to distinguish them to either of the species.2009–2018Location (Longitude, Latitude)[46,47]
THL, NIDRPatient Pogosta disease dataPogosta disease average incidence per 1000 inhabitants during 2000–2019 per municipality was calculated in ArcGIS.2000–2019Municipality[22]
FMI = Finnish Meteorological Institute; LUKE = Natural Resources Institute Finland; SYKE = Finnish Environment Institute; EEA = European Environment Agency; EU = European Union; THL = Finnish Institute for Health and Welfare; NIDR = National Infectious Disease Register.
Table 2. Final environmental and other predictors used in (a) potential SINV vector species modeling, and (b) Pogosta disease modeling with value ranges.
(a)Ae. cinereus/geminusCx. pipiens/torrentiumCs. morsitans
PredictorMin.Max.Avg.Min.Max.Avg.Min.Max.Avg.
Wind speed 50 years interval 10.541.314.410.514.614.610.536.914.6
Topographic wetness index (TWI) 426965,53516,708461765,53515,261461765,53515,261
Mean snow depth in October–November 2009–2019xxx0.212.42.30.212.62.3
Mean precipitation in October–February 2009–201926.368.847.426.3494926.868.849
Mean precipitation in March–June 2009–201933.554.742.233.554.341.933.554.341.9
Mean precipitation in July–September 2009–201955.885.367.554.784.767.156.684.767.1
Mean normalized difference vegetation index
(NDVI) in June 2009–2019
0.40.80.70.40.80.70.50.80.7
Mean water vapor pressure
in May–September 2009–2019
xxx0.81.211.04xxx
Human population density04281141.90428173.40428173.4
Euclidean distance to water courses 019,194.32485.6020,634.42884.2019,194.32884.2
Euclidean distance to water bodies 04628.9665.804628.9757.104628.9757.1
Euclidean distance to peatbogs 04891.81021.5204303.61093.104891.81093.1
Euclidean distance to inland marshes 012,041.42155.2012,041.42182.844.712,041.42182.8
Euclidean distance to coniferous forest 02272.798.203217.676.30570.176.3
Euclidean distance to broad-leaved forest 02062.4201.60906.9170.401063.2170.4
Euclidean distance to mixed forest 01724.1136.603265119.301668.8119.3
Euclidean distance to transitional woodland/shrub 01073.6141.901073.6135.30738.2135.3
Mean land surface temperature
in June–August 2009–2019
13.32418.412.423.918.714.722.618.7
Mean precipitation during growth season 1981–201093.1190.3157.8184.1378.5326.5101.9190.3162.6
Mean solar radiation in May–September 13,71817,52615,460xxx13,63917,52615,662
Elevation 0.1116.5564.6xxxxxx
(b)Pogosta disease
PredictorMin.Max.Avg.
Black grouse density 011.66.9
Capercaillie density04.93.2
Hazel grouse density0107.3
Willow grouse density 03.30.3
Elevation (m)4.9471.394.2
Human population density (persons/km2)0117736.7
Percentage of inland wetlands (%)00.90.1
Percentage of mixed forest in mineral soil (%)020.910.4
Percentage of mixed forest in peatlands (%)09.32
Percentage of mixed forest in rocky soil (%)00.70.1
Percentage of lakes (%)054.48.4
Mean precipitation in July–September in 2000–2019 (mm)54.882.868.2
Mean seroprevalence of SINV in human population09.93.5
Summer cottage density 0.19.11.8
Topographic wetness index (TWI)775165,53517,062
Suitability for Cx. pipiens/torrentium (%)10.678.741.3
Risk for Cs. morsitans (%)8.385.936.2
Percentage of peatbogs (%)019.12.1
Risk for Ae. cinereus/geminus (%)8.578.750.9
x = Predictor not included in the final dataset.
Publisher’s Note: MDPI stays neutral with regard to jurisdictional claims in published maps and institutional affiliations.

