
An Integrated Approach to Assess the Environmental Impacts of Large-Scale Gold Mining: The Nzema-Gold Mines in the Ellembelle District of Ghana as a Case Study


Abstract
1. Introduction
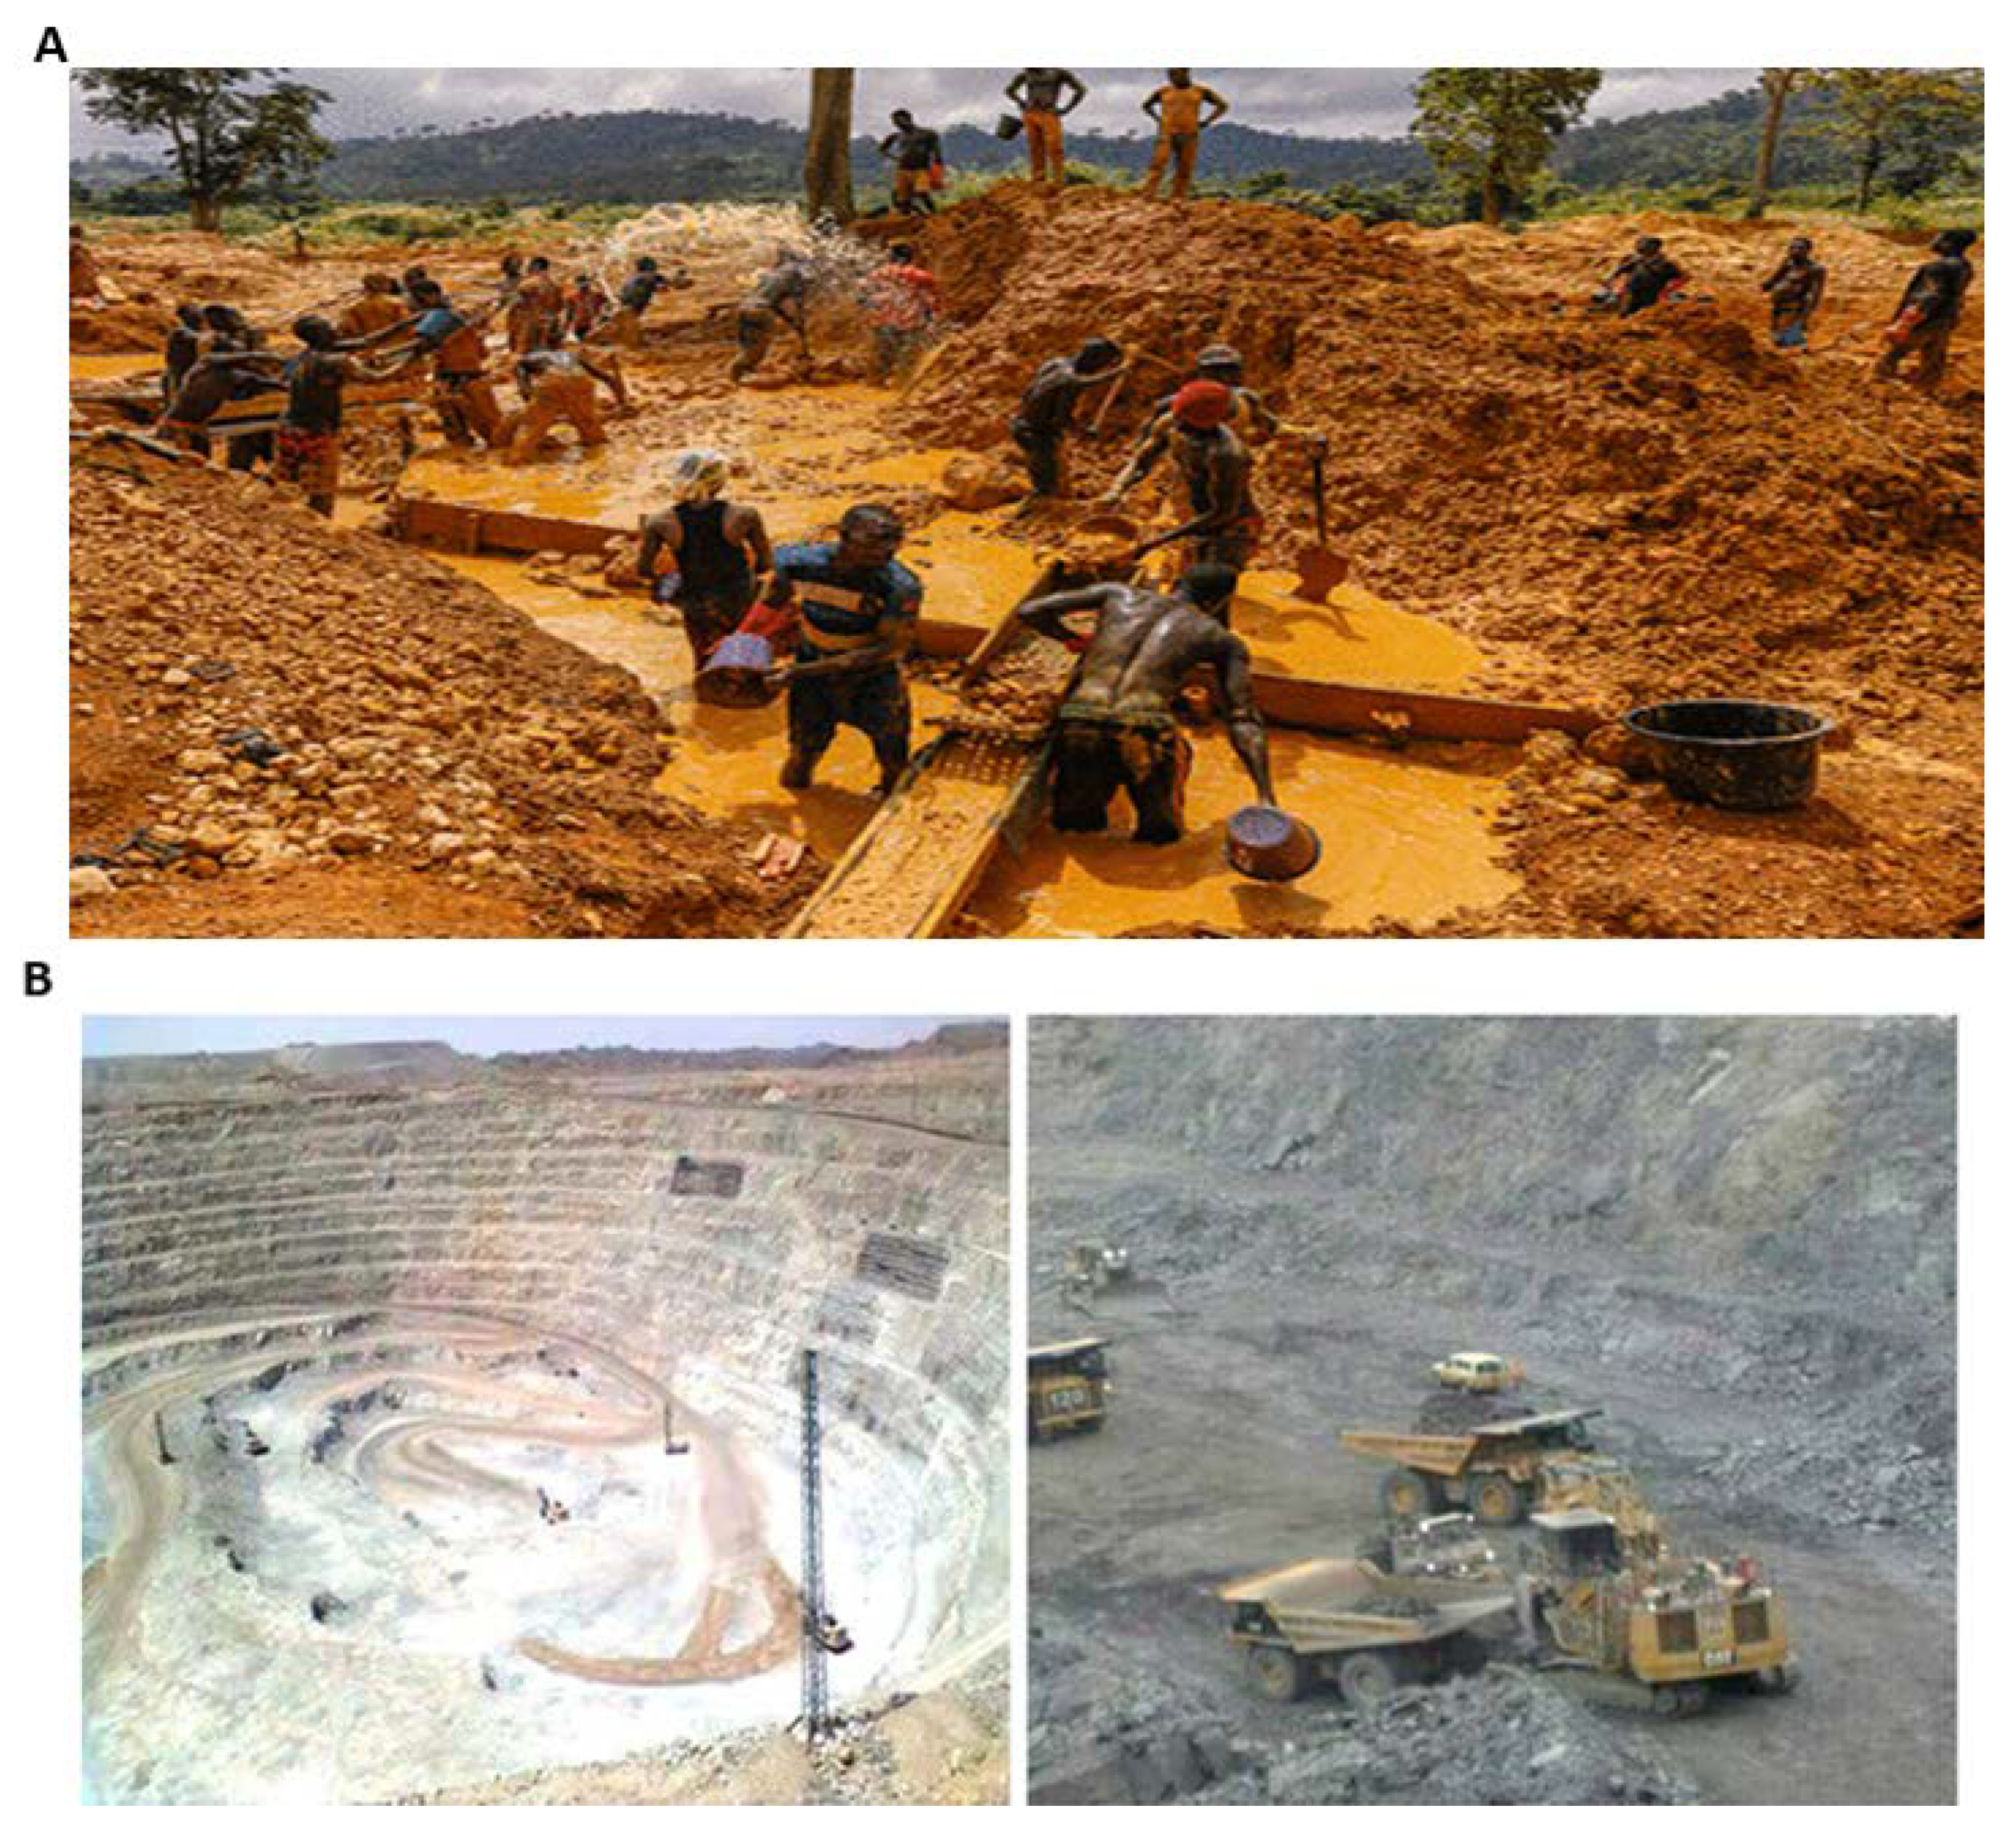
Overview of Gold Mining Activities in Ghana
2. Materials and Methods
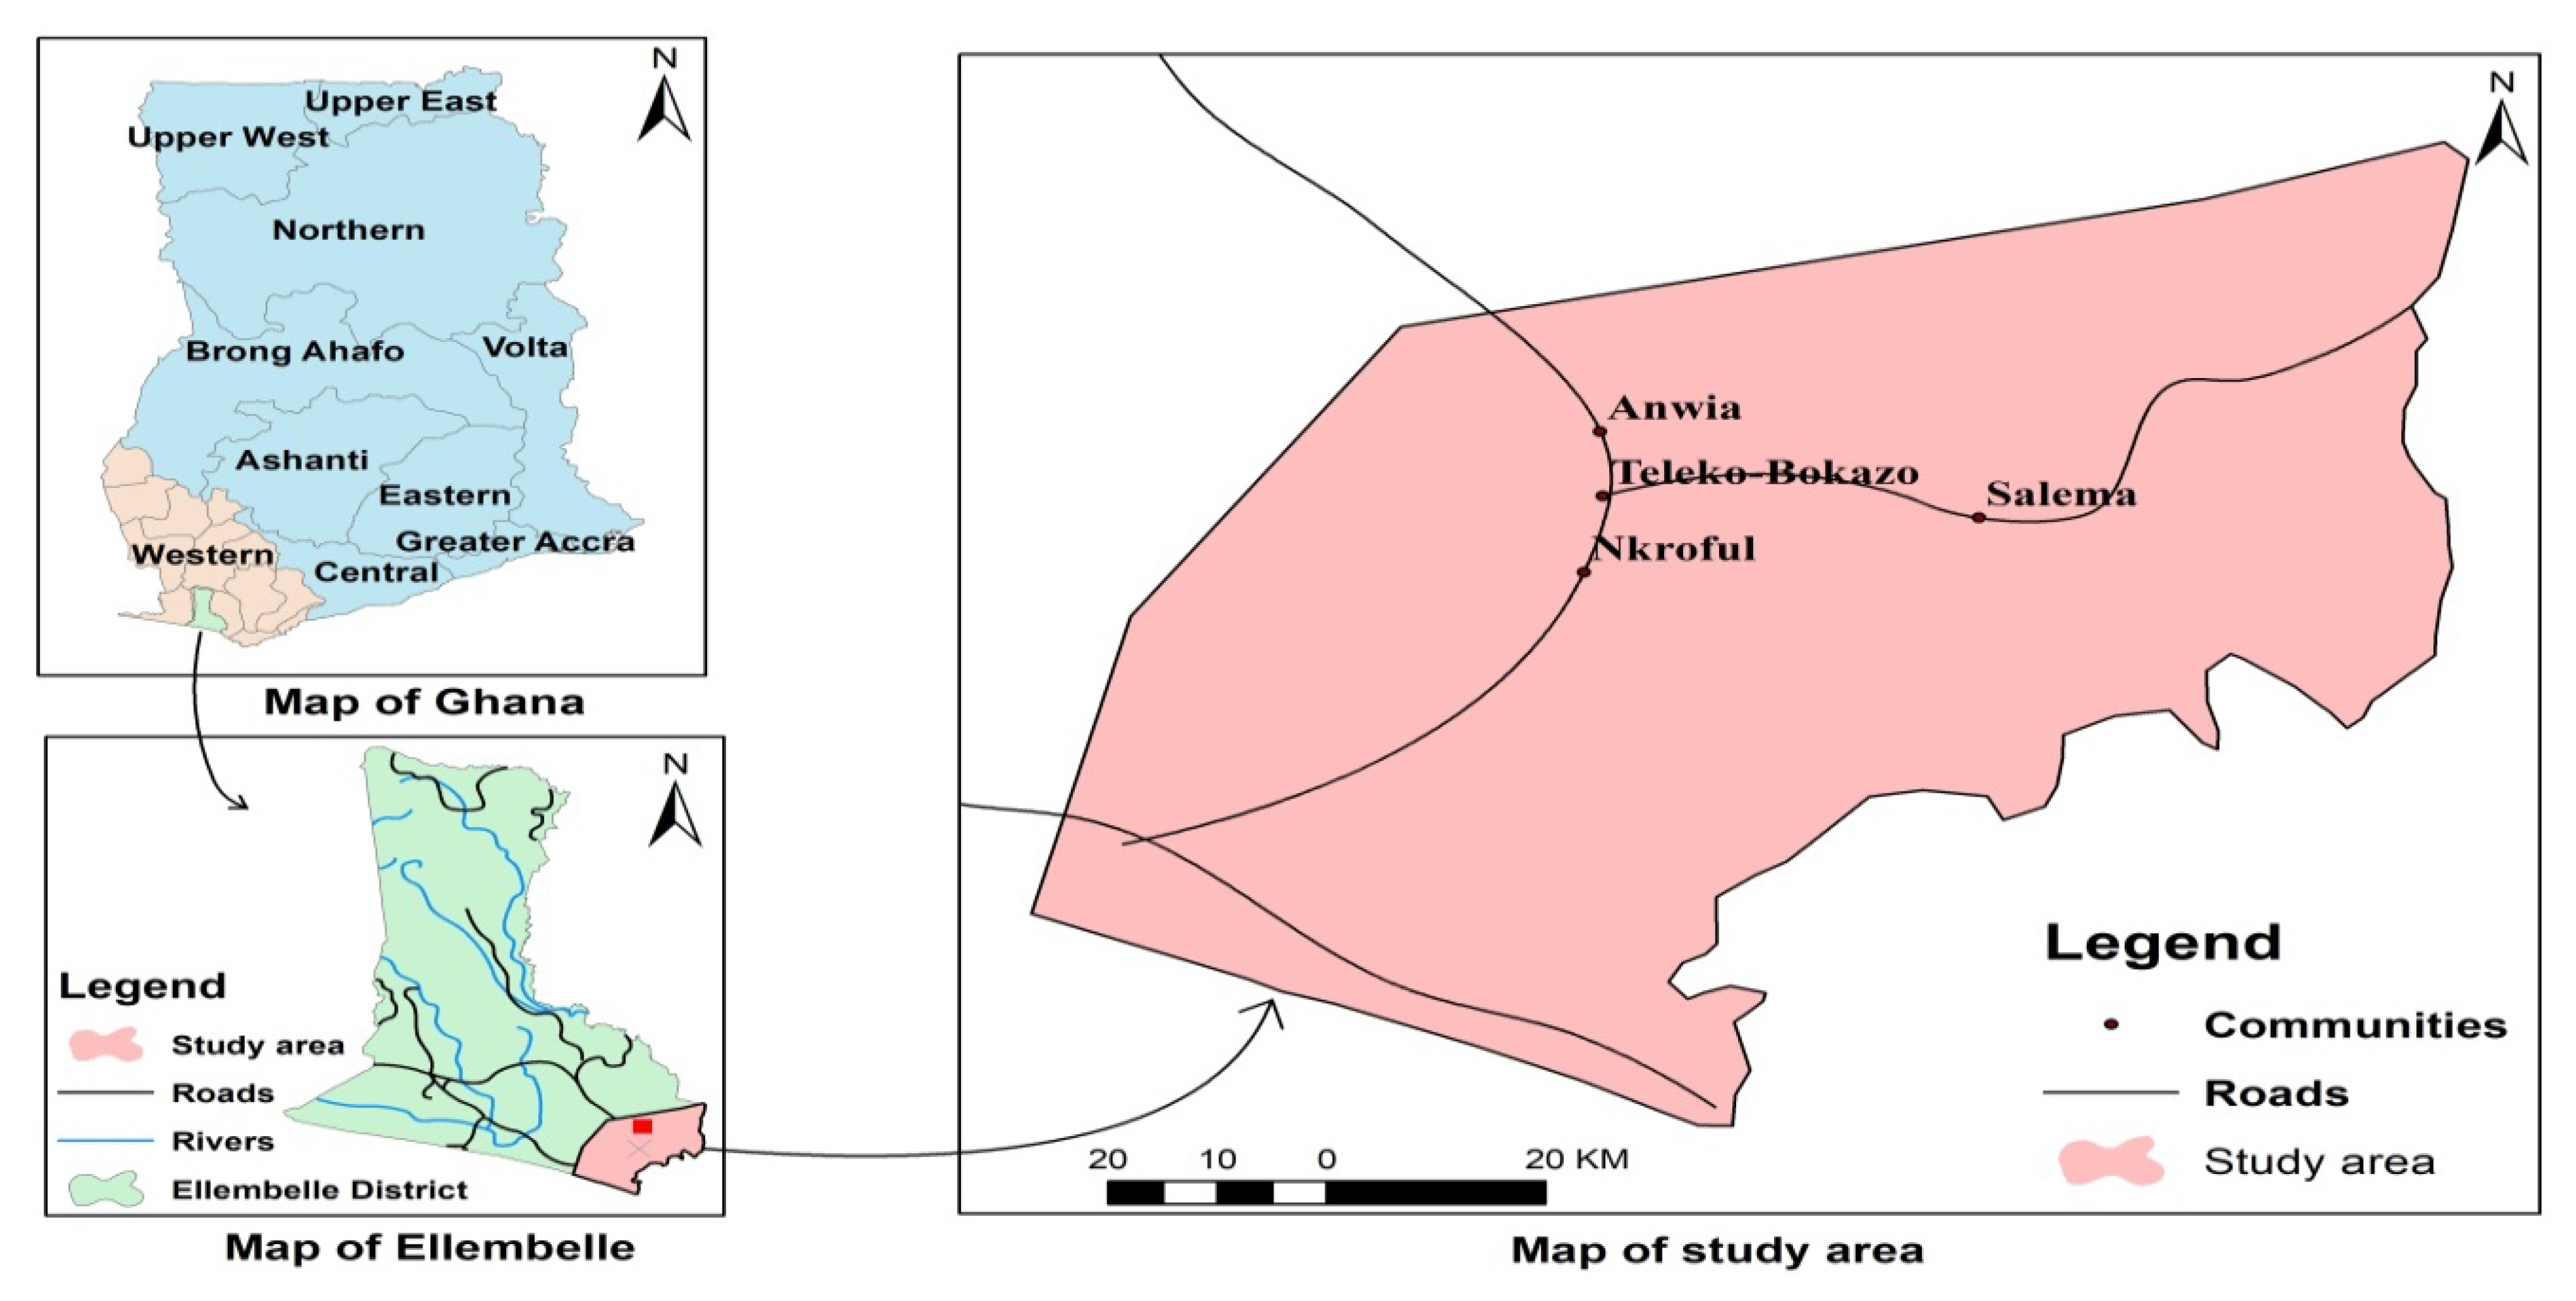
2.1. Study Area
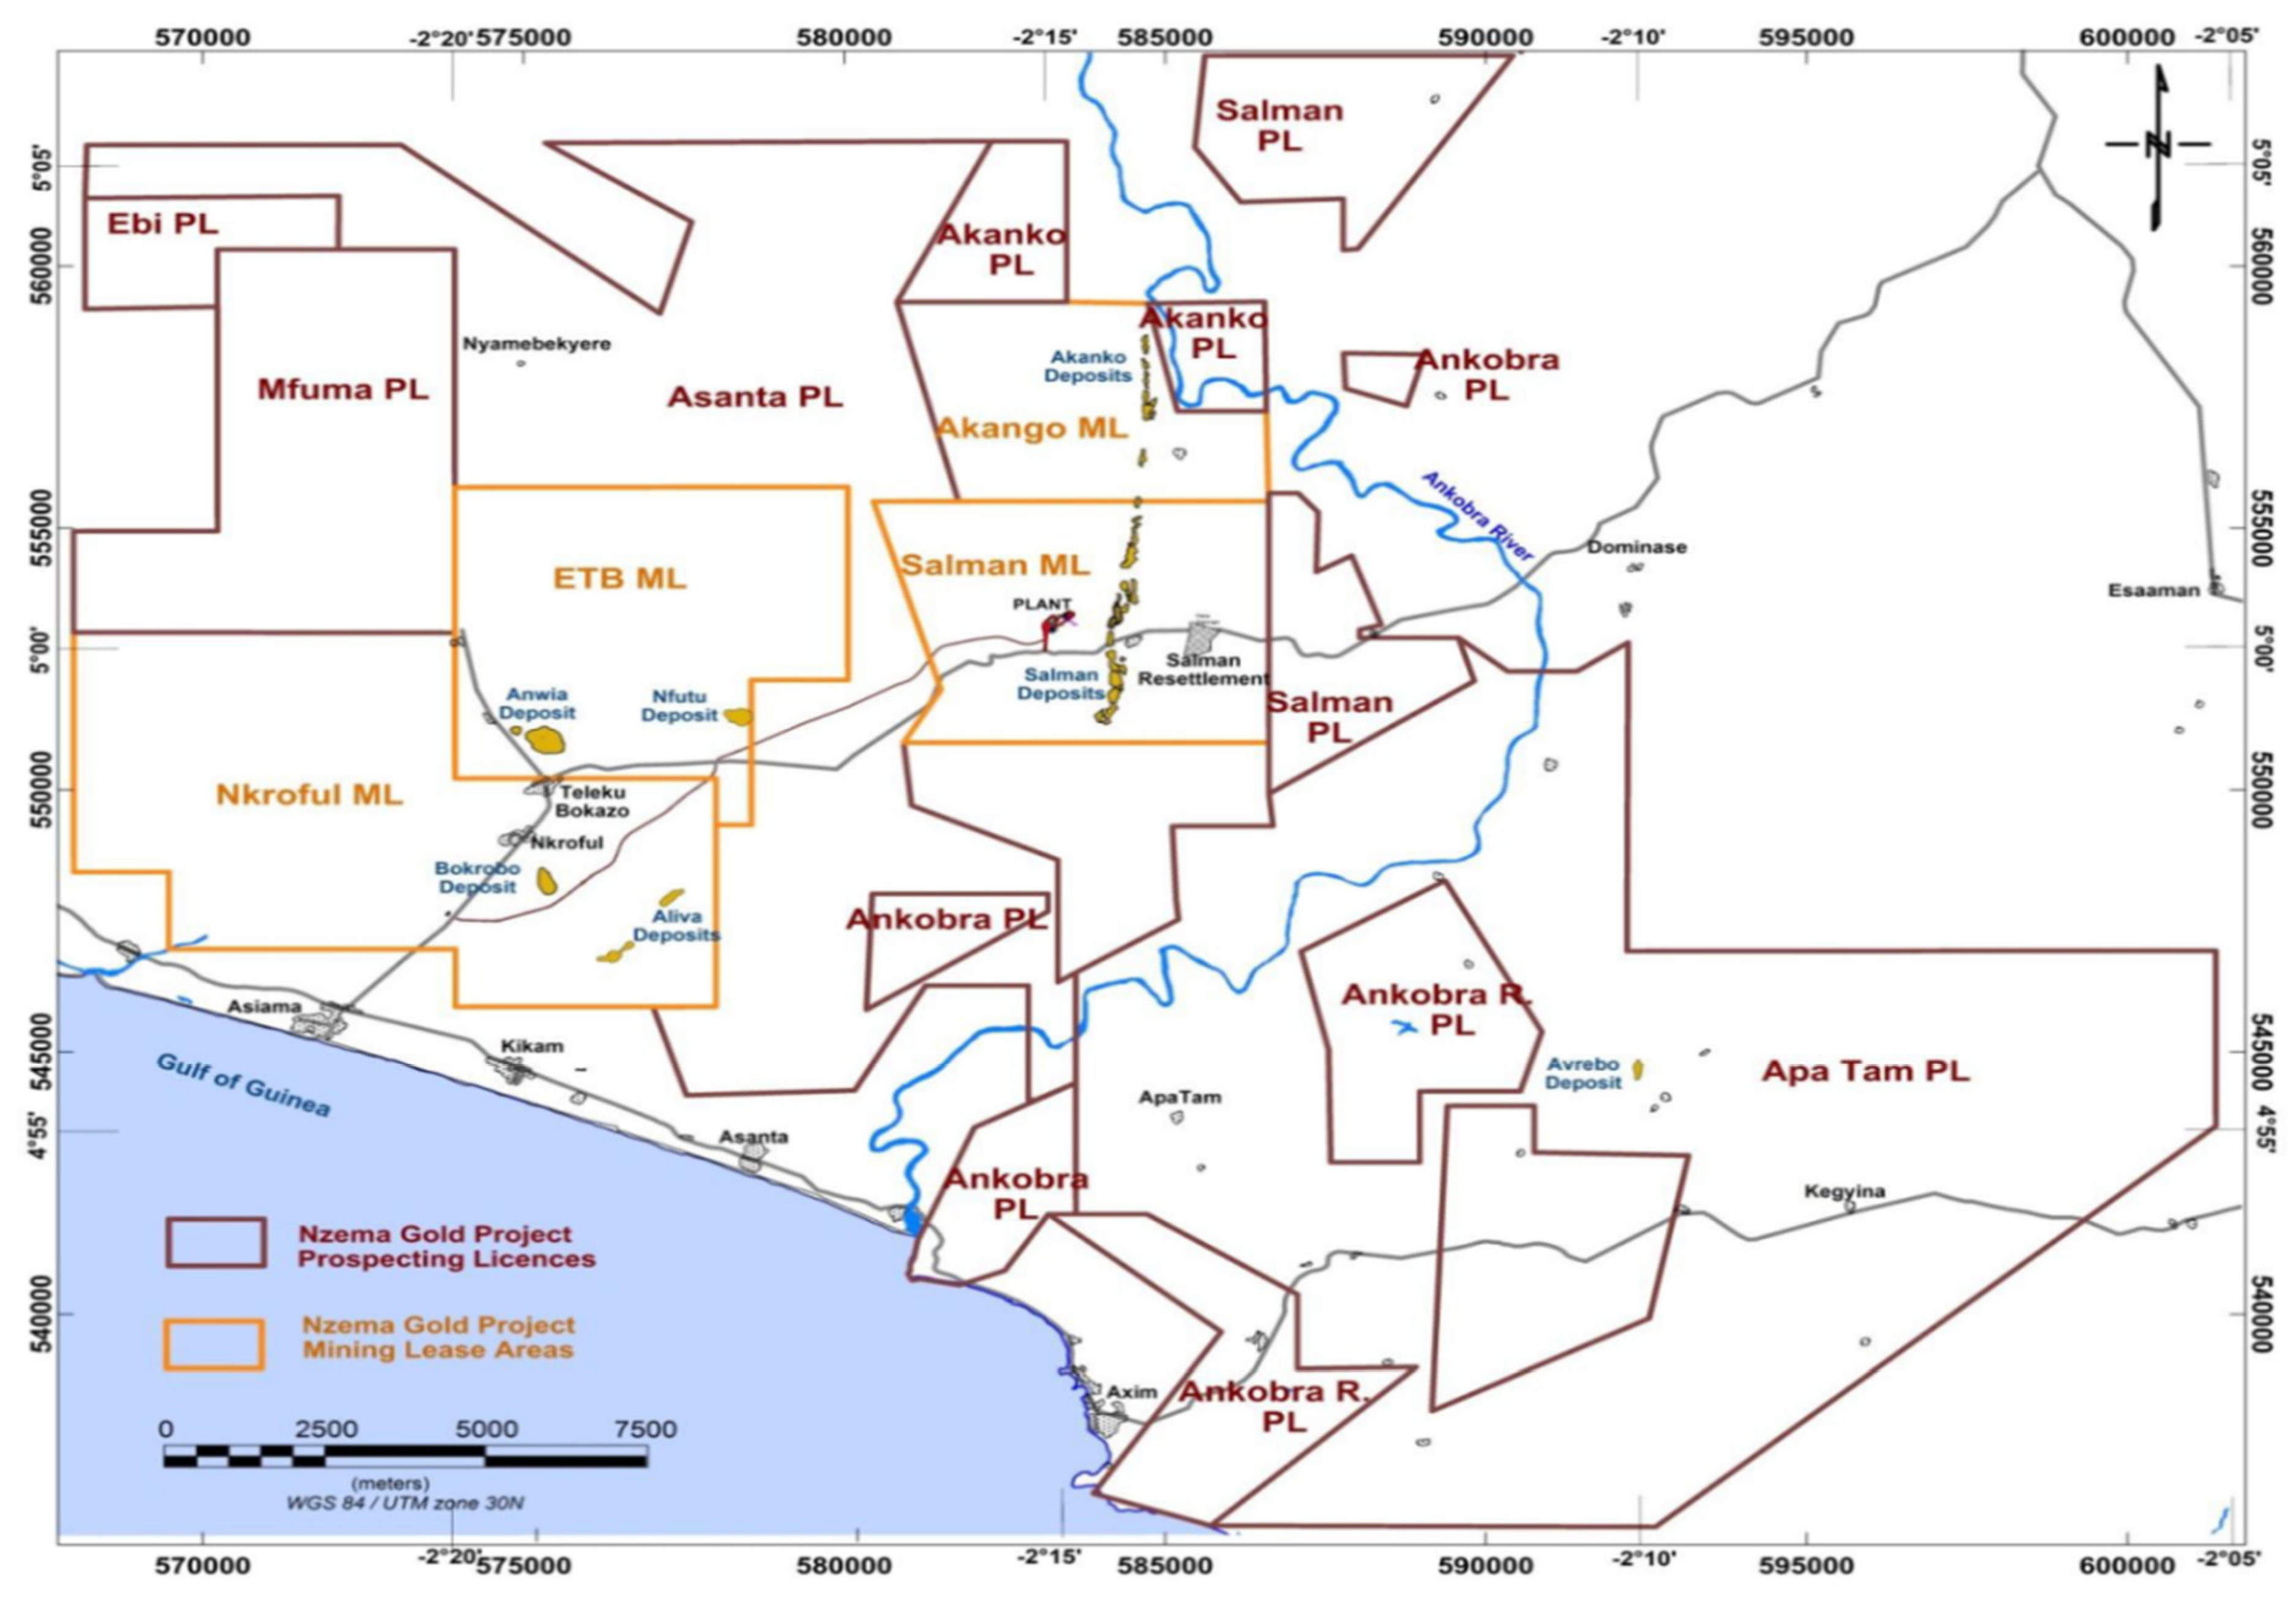
2.1.1. Case Study
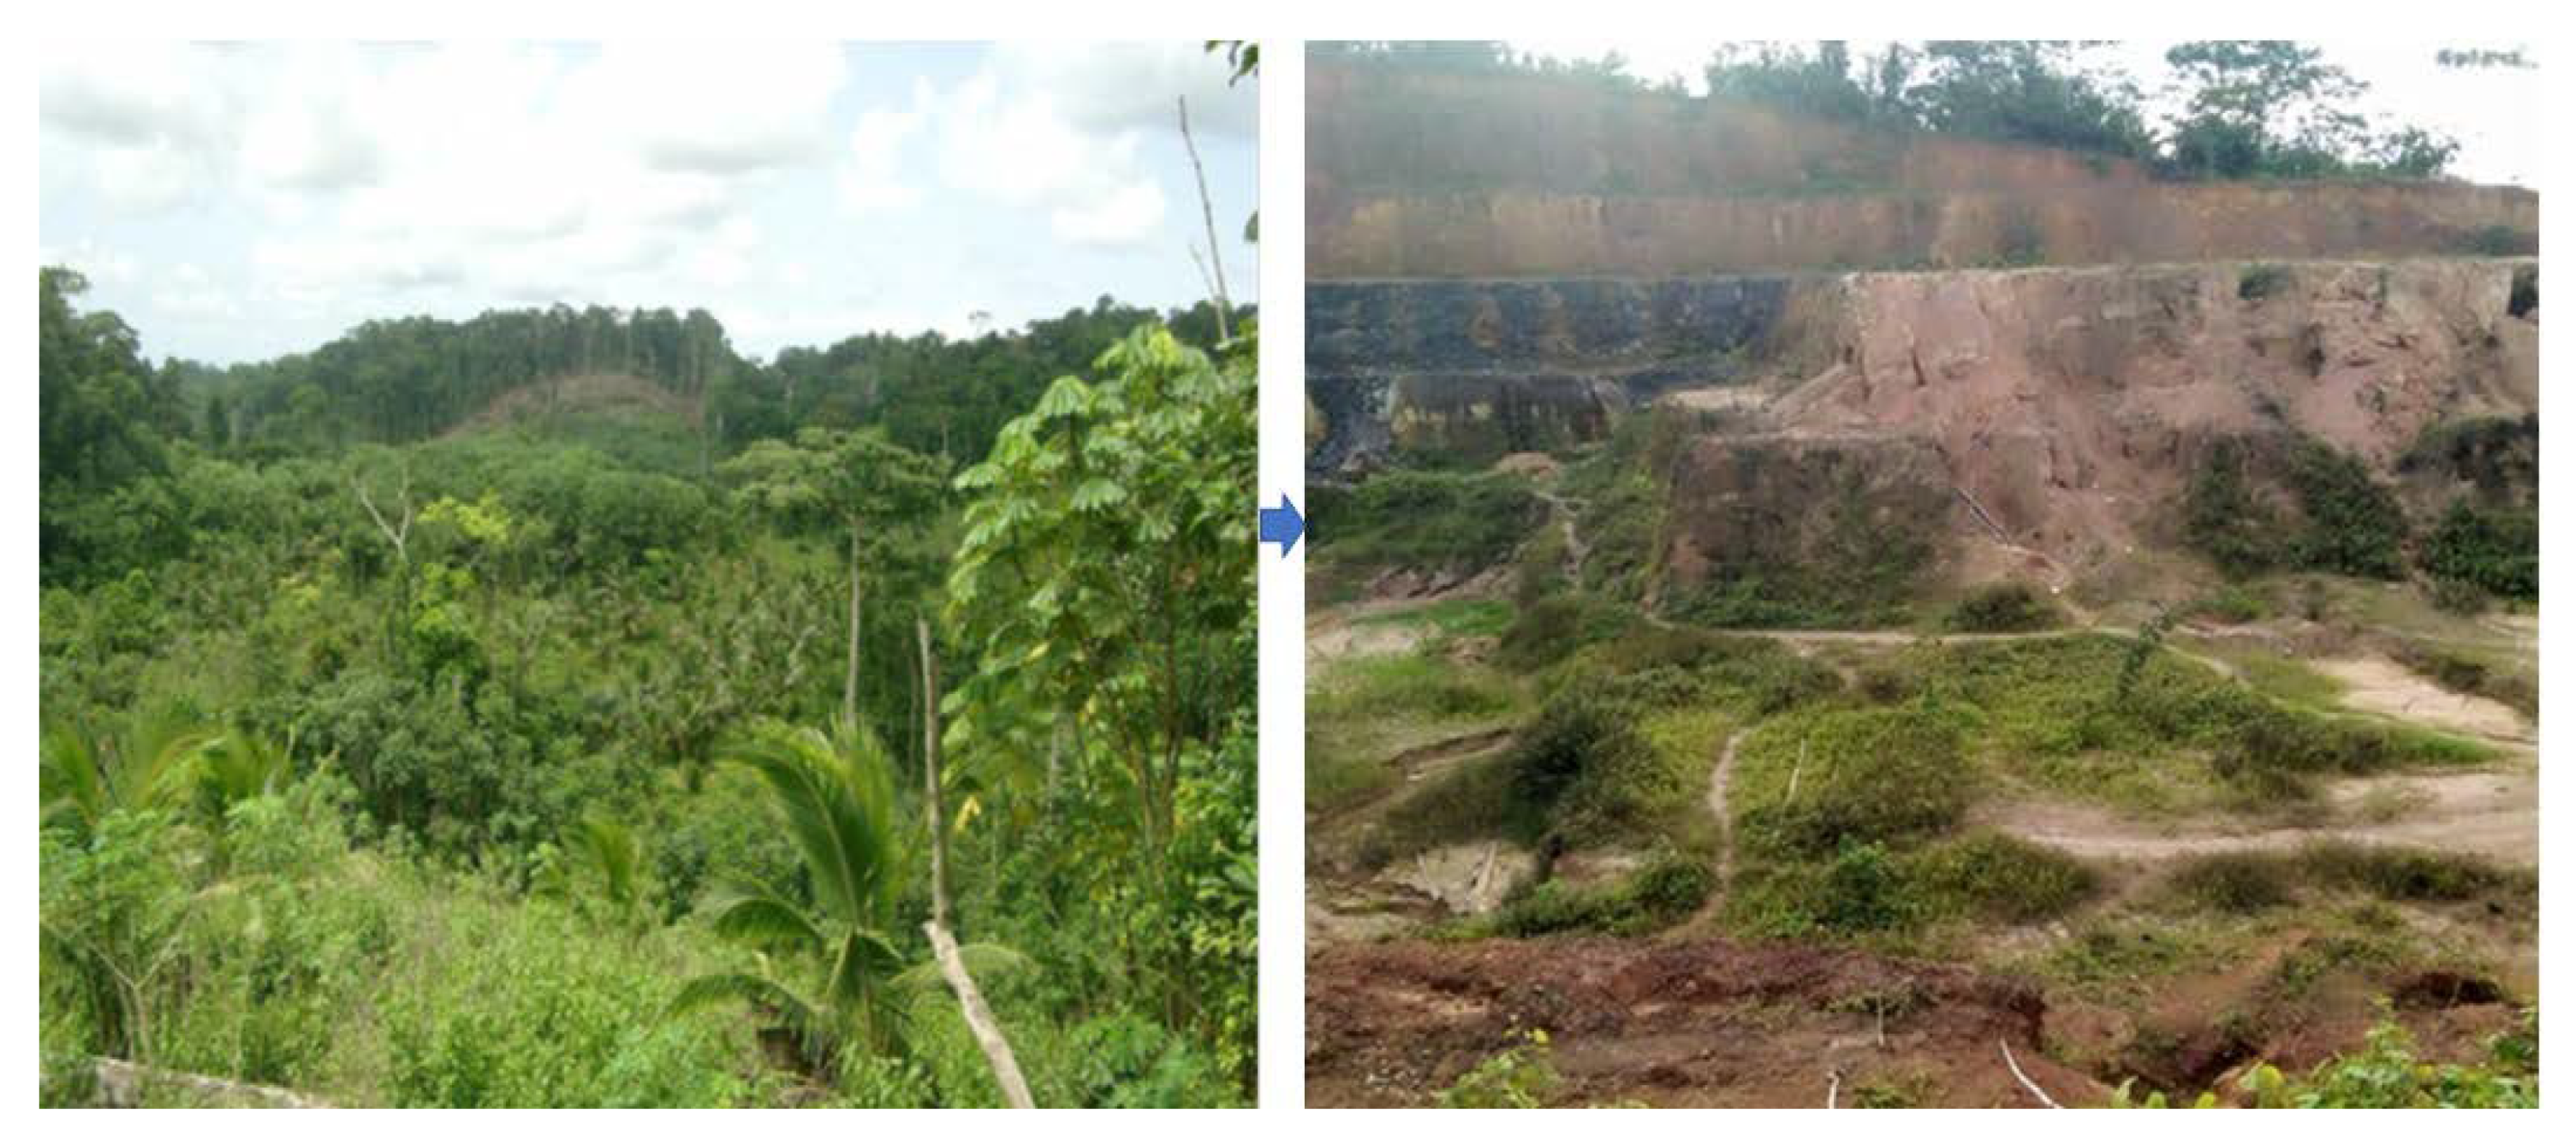
Large-Scale Surface Mining in Ellembelle
2.2. Methods of Data Collection and Analysis
2.2.1. Data Collection
Participant Observations, Interviews, and Questionnaires
The Normalized Difference Vegetation Index (NDVI)
2.2.2. Data Analysis and Presentation
3. Results and Discussion
3.1. Demographic Characteristics of Respondents
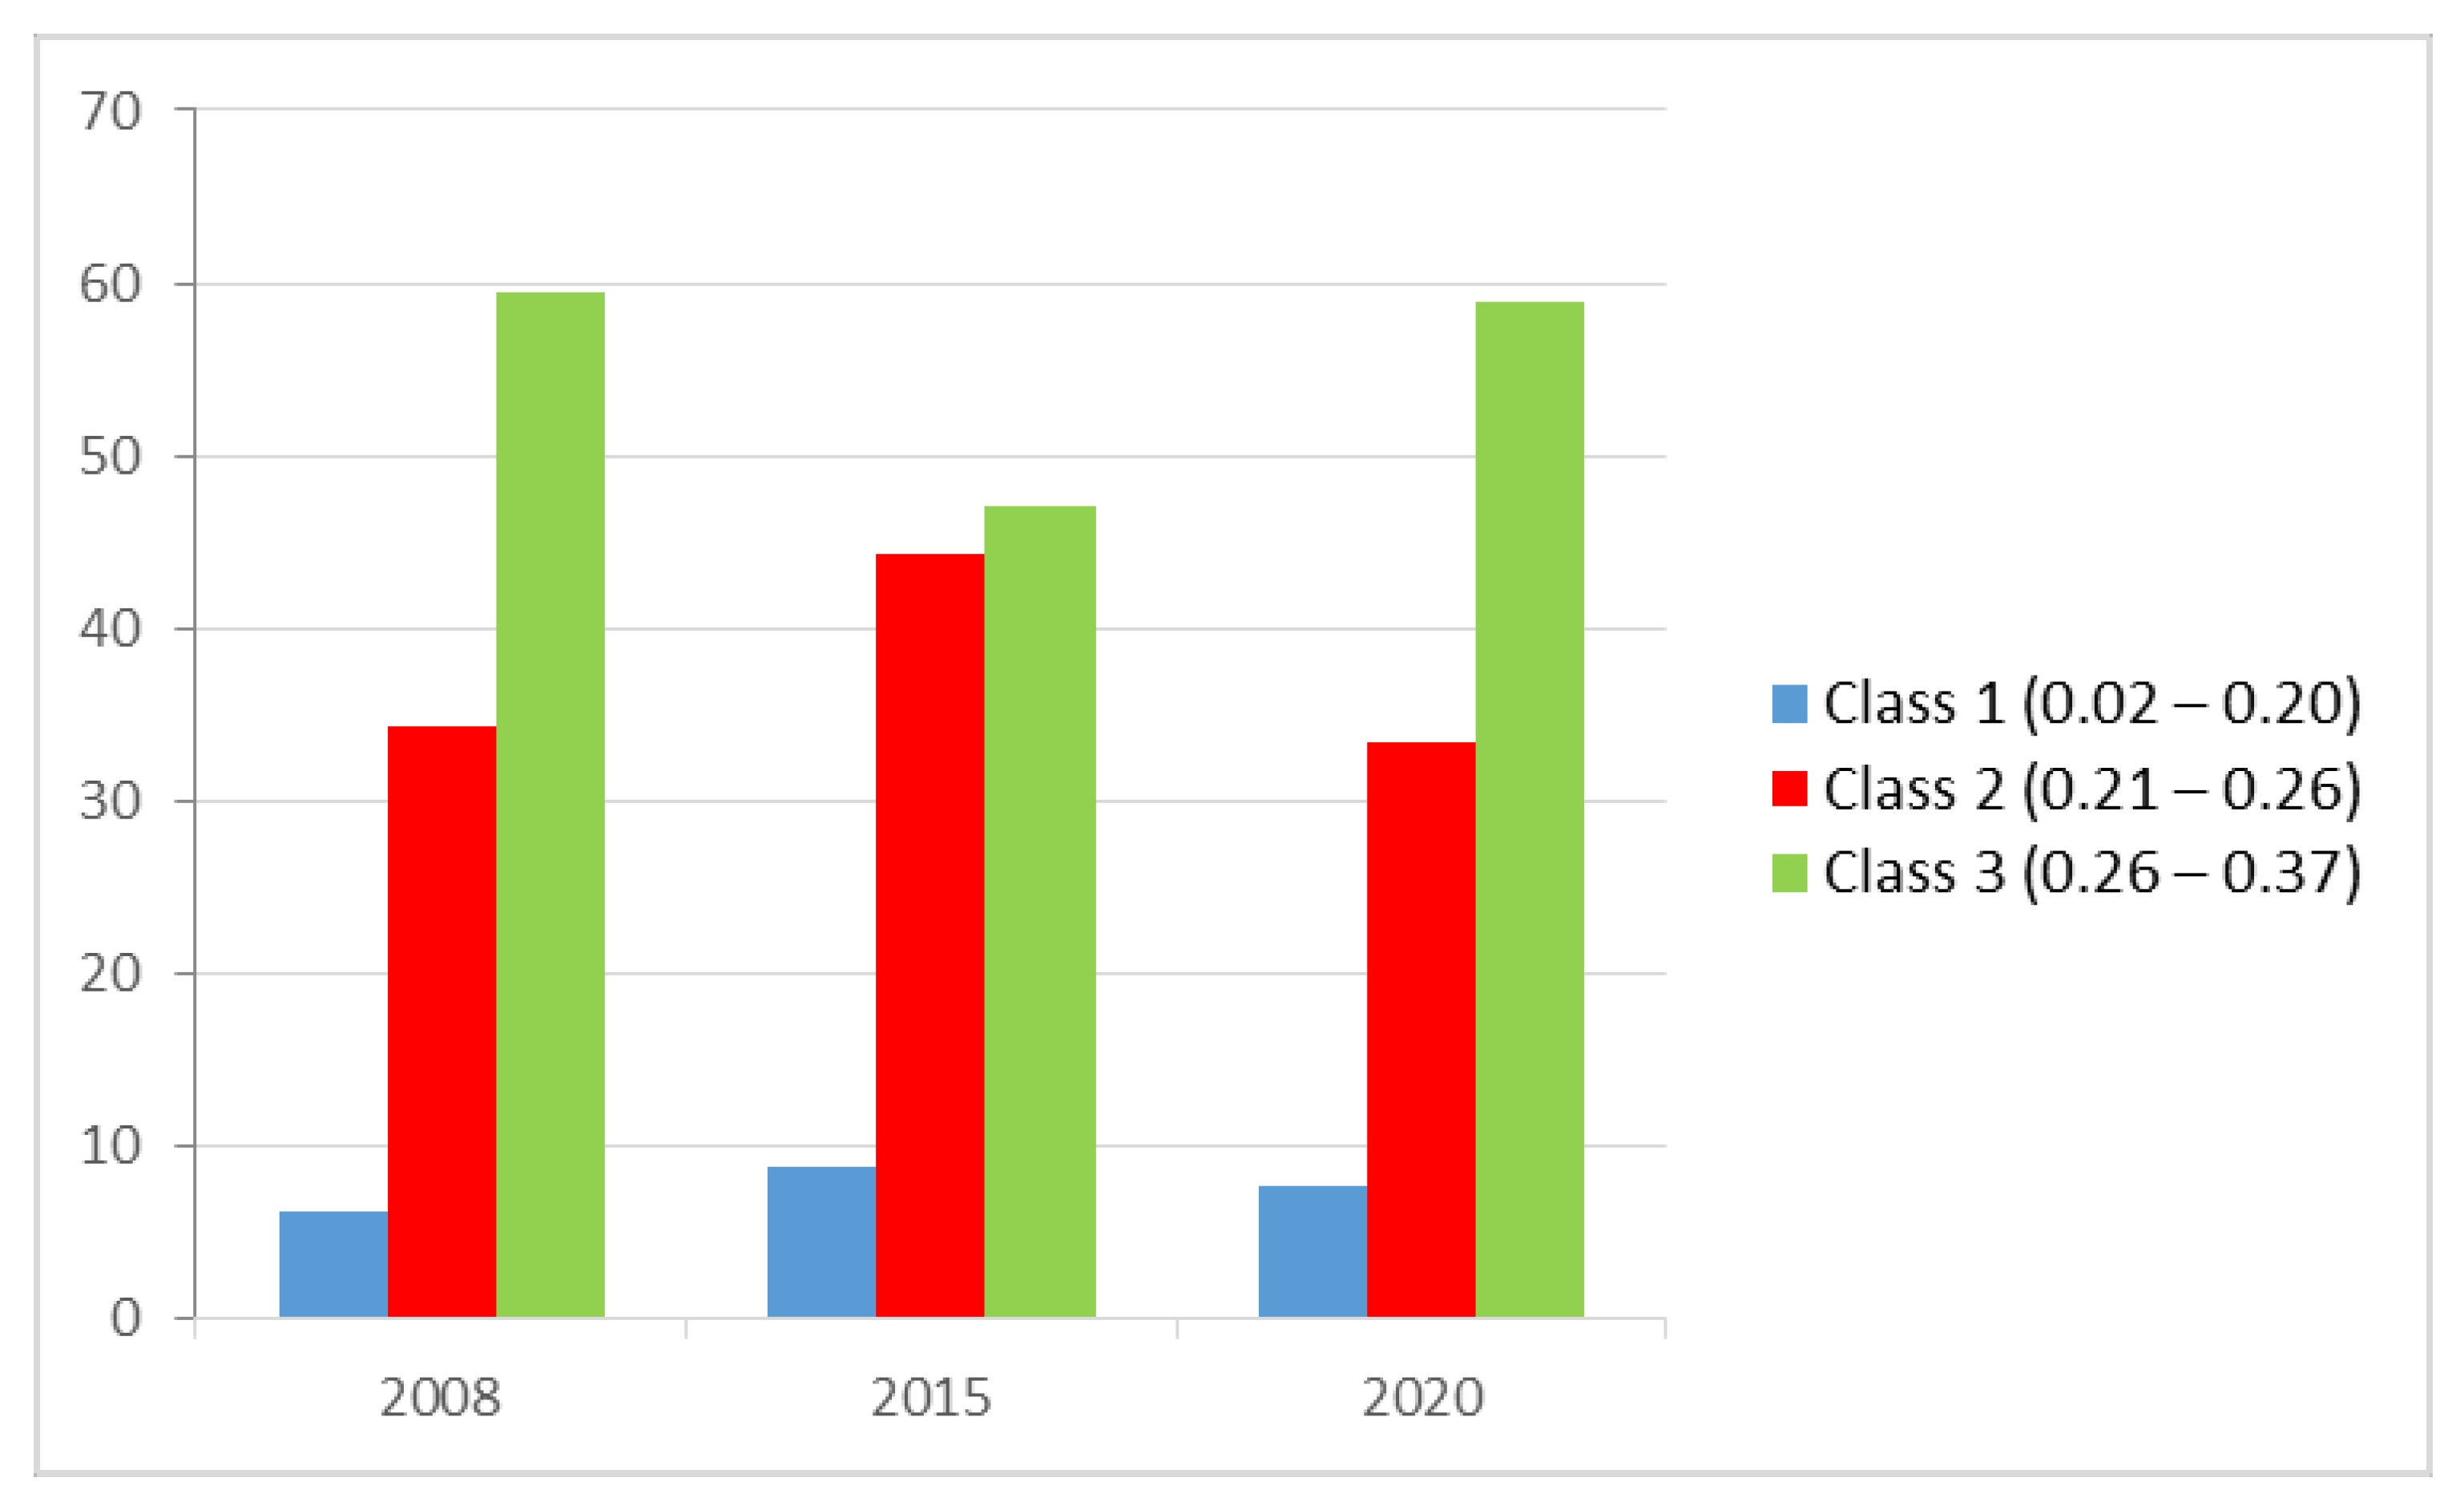
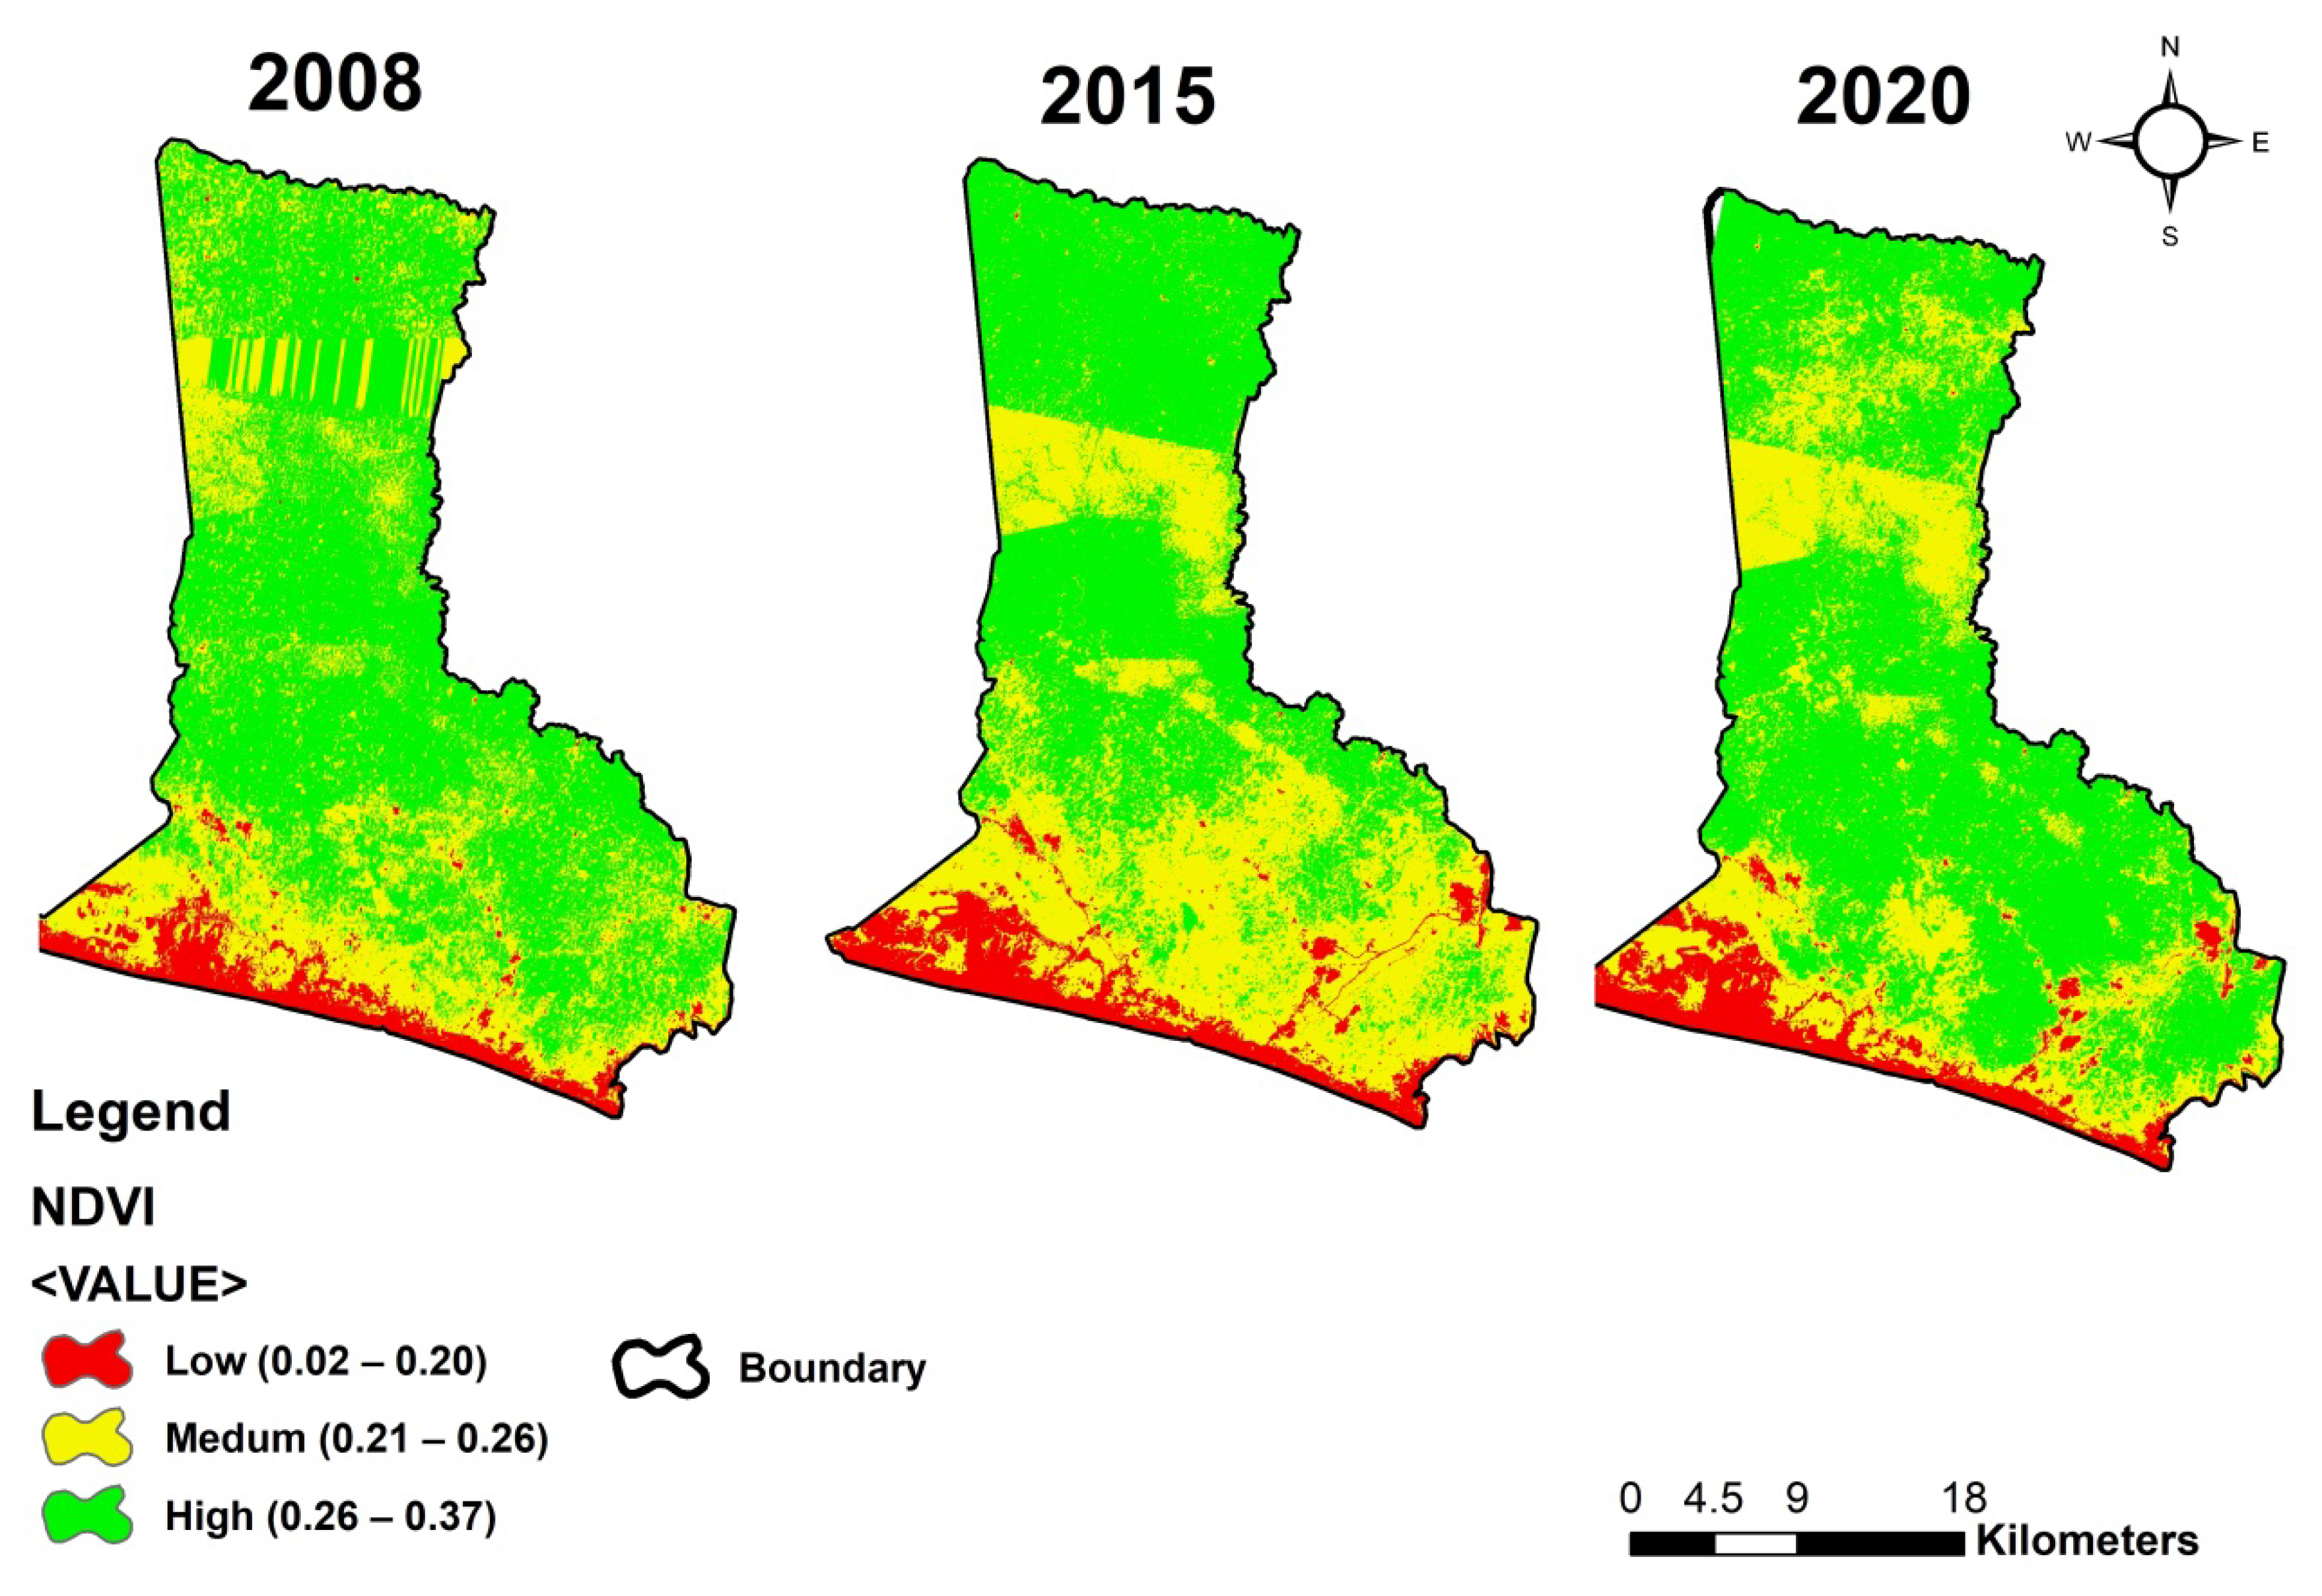
3.2. Results of the NDVI Analysis
3.3. Field and Community Survey
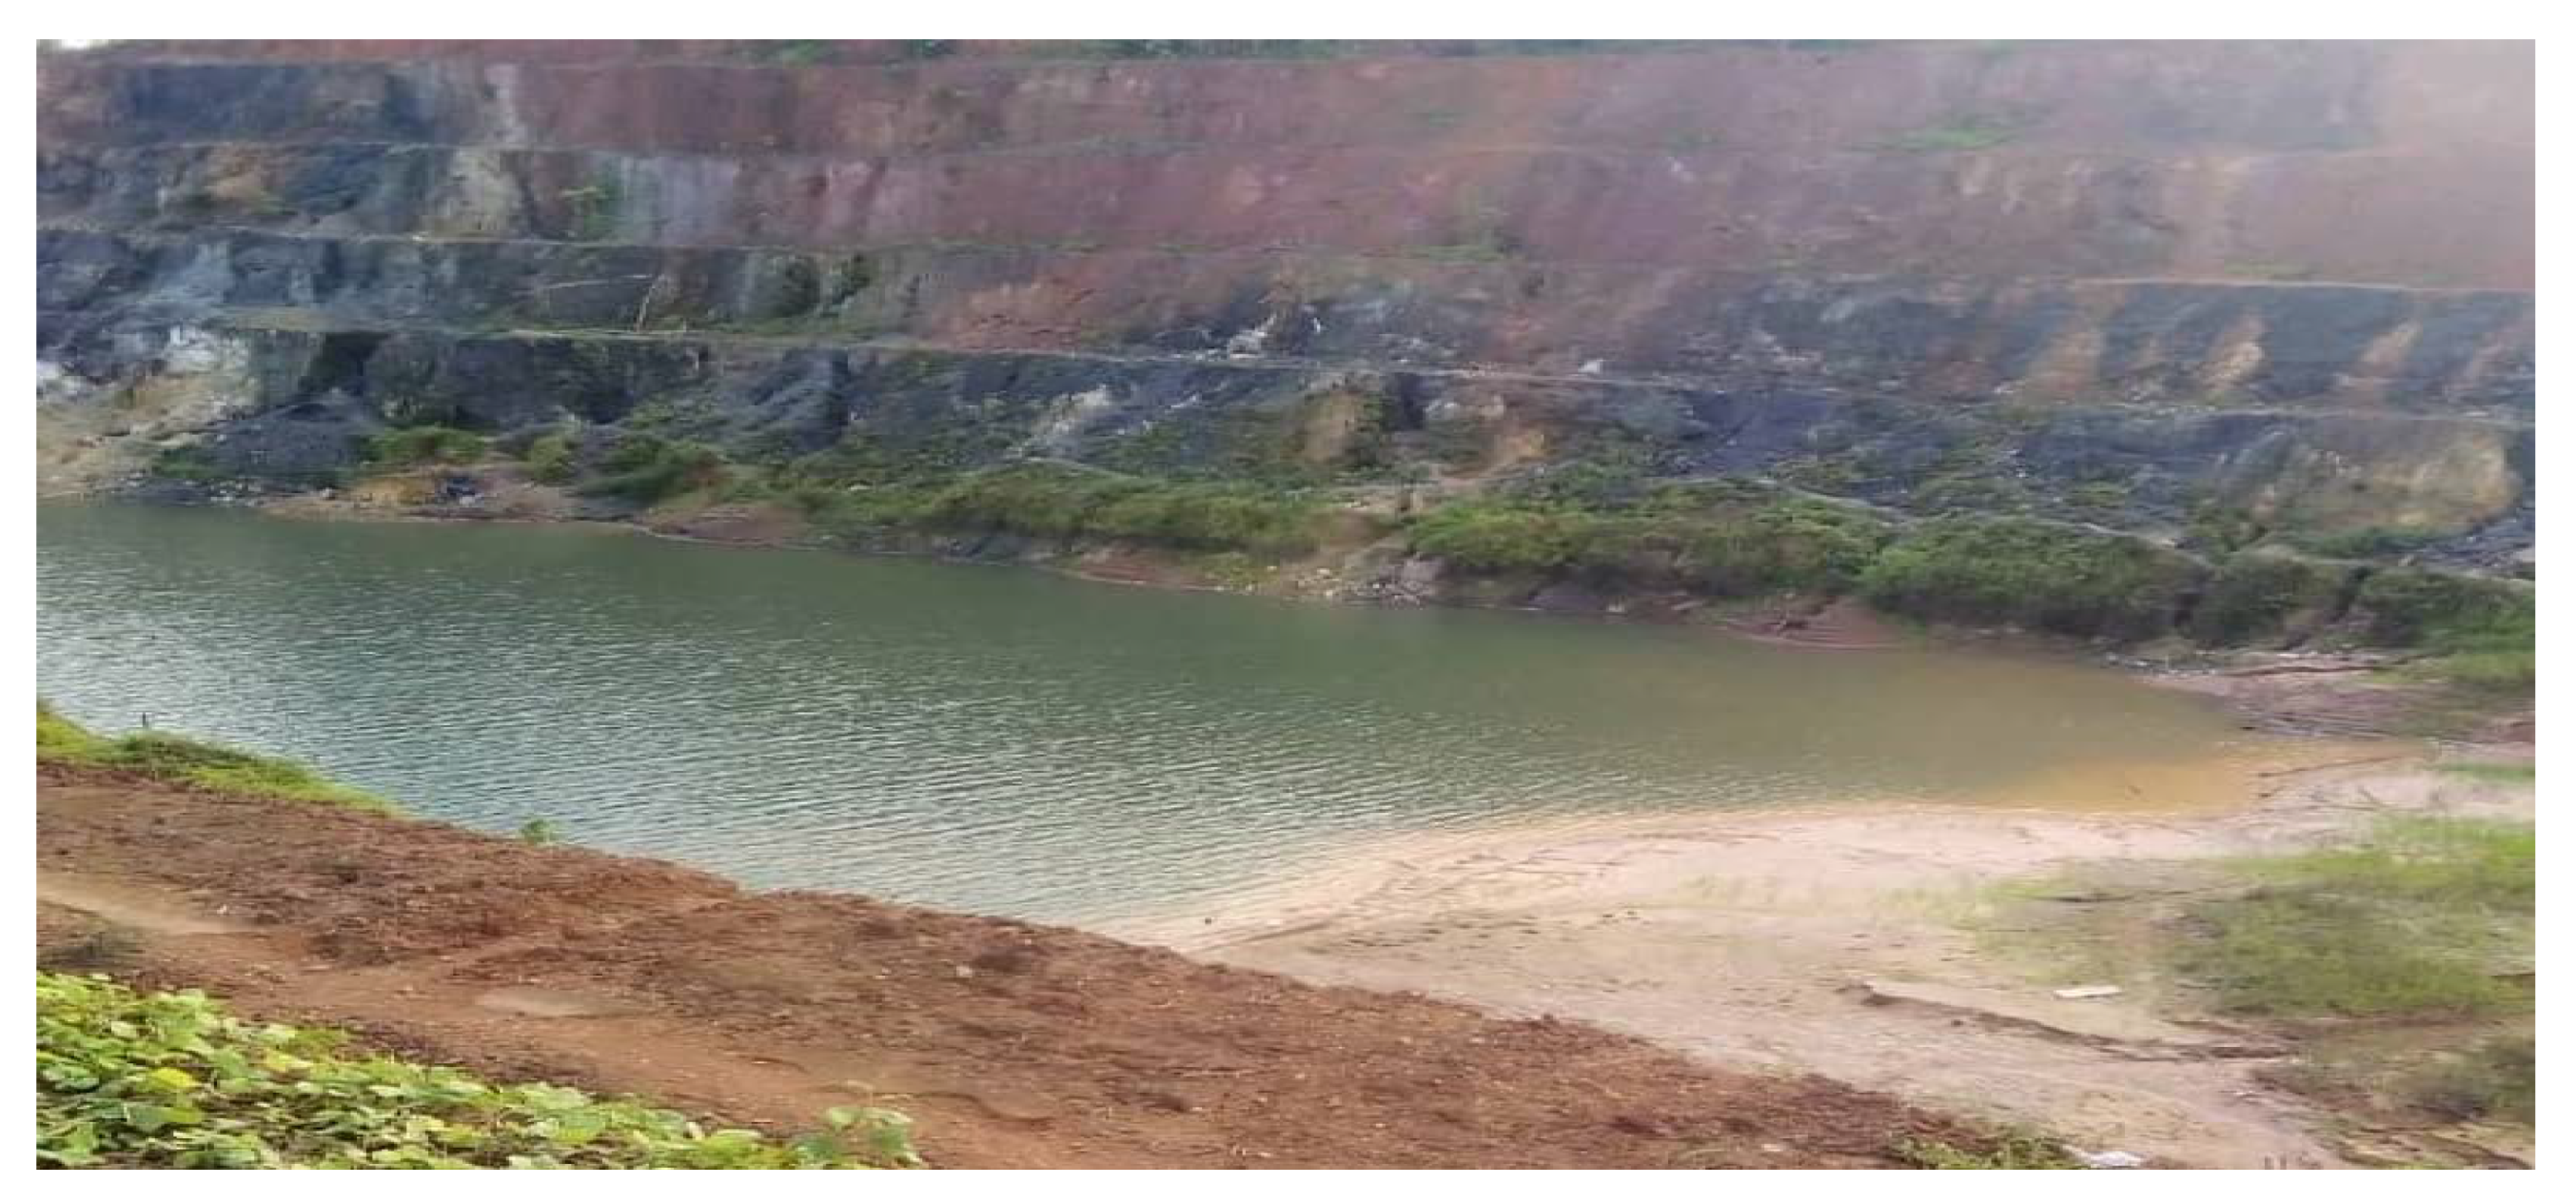
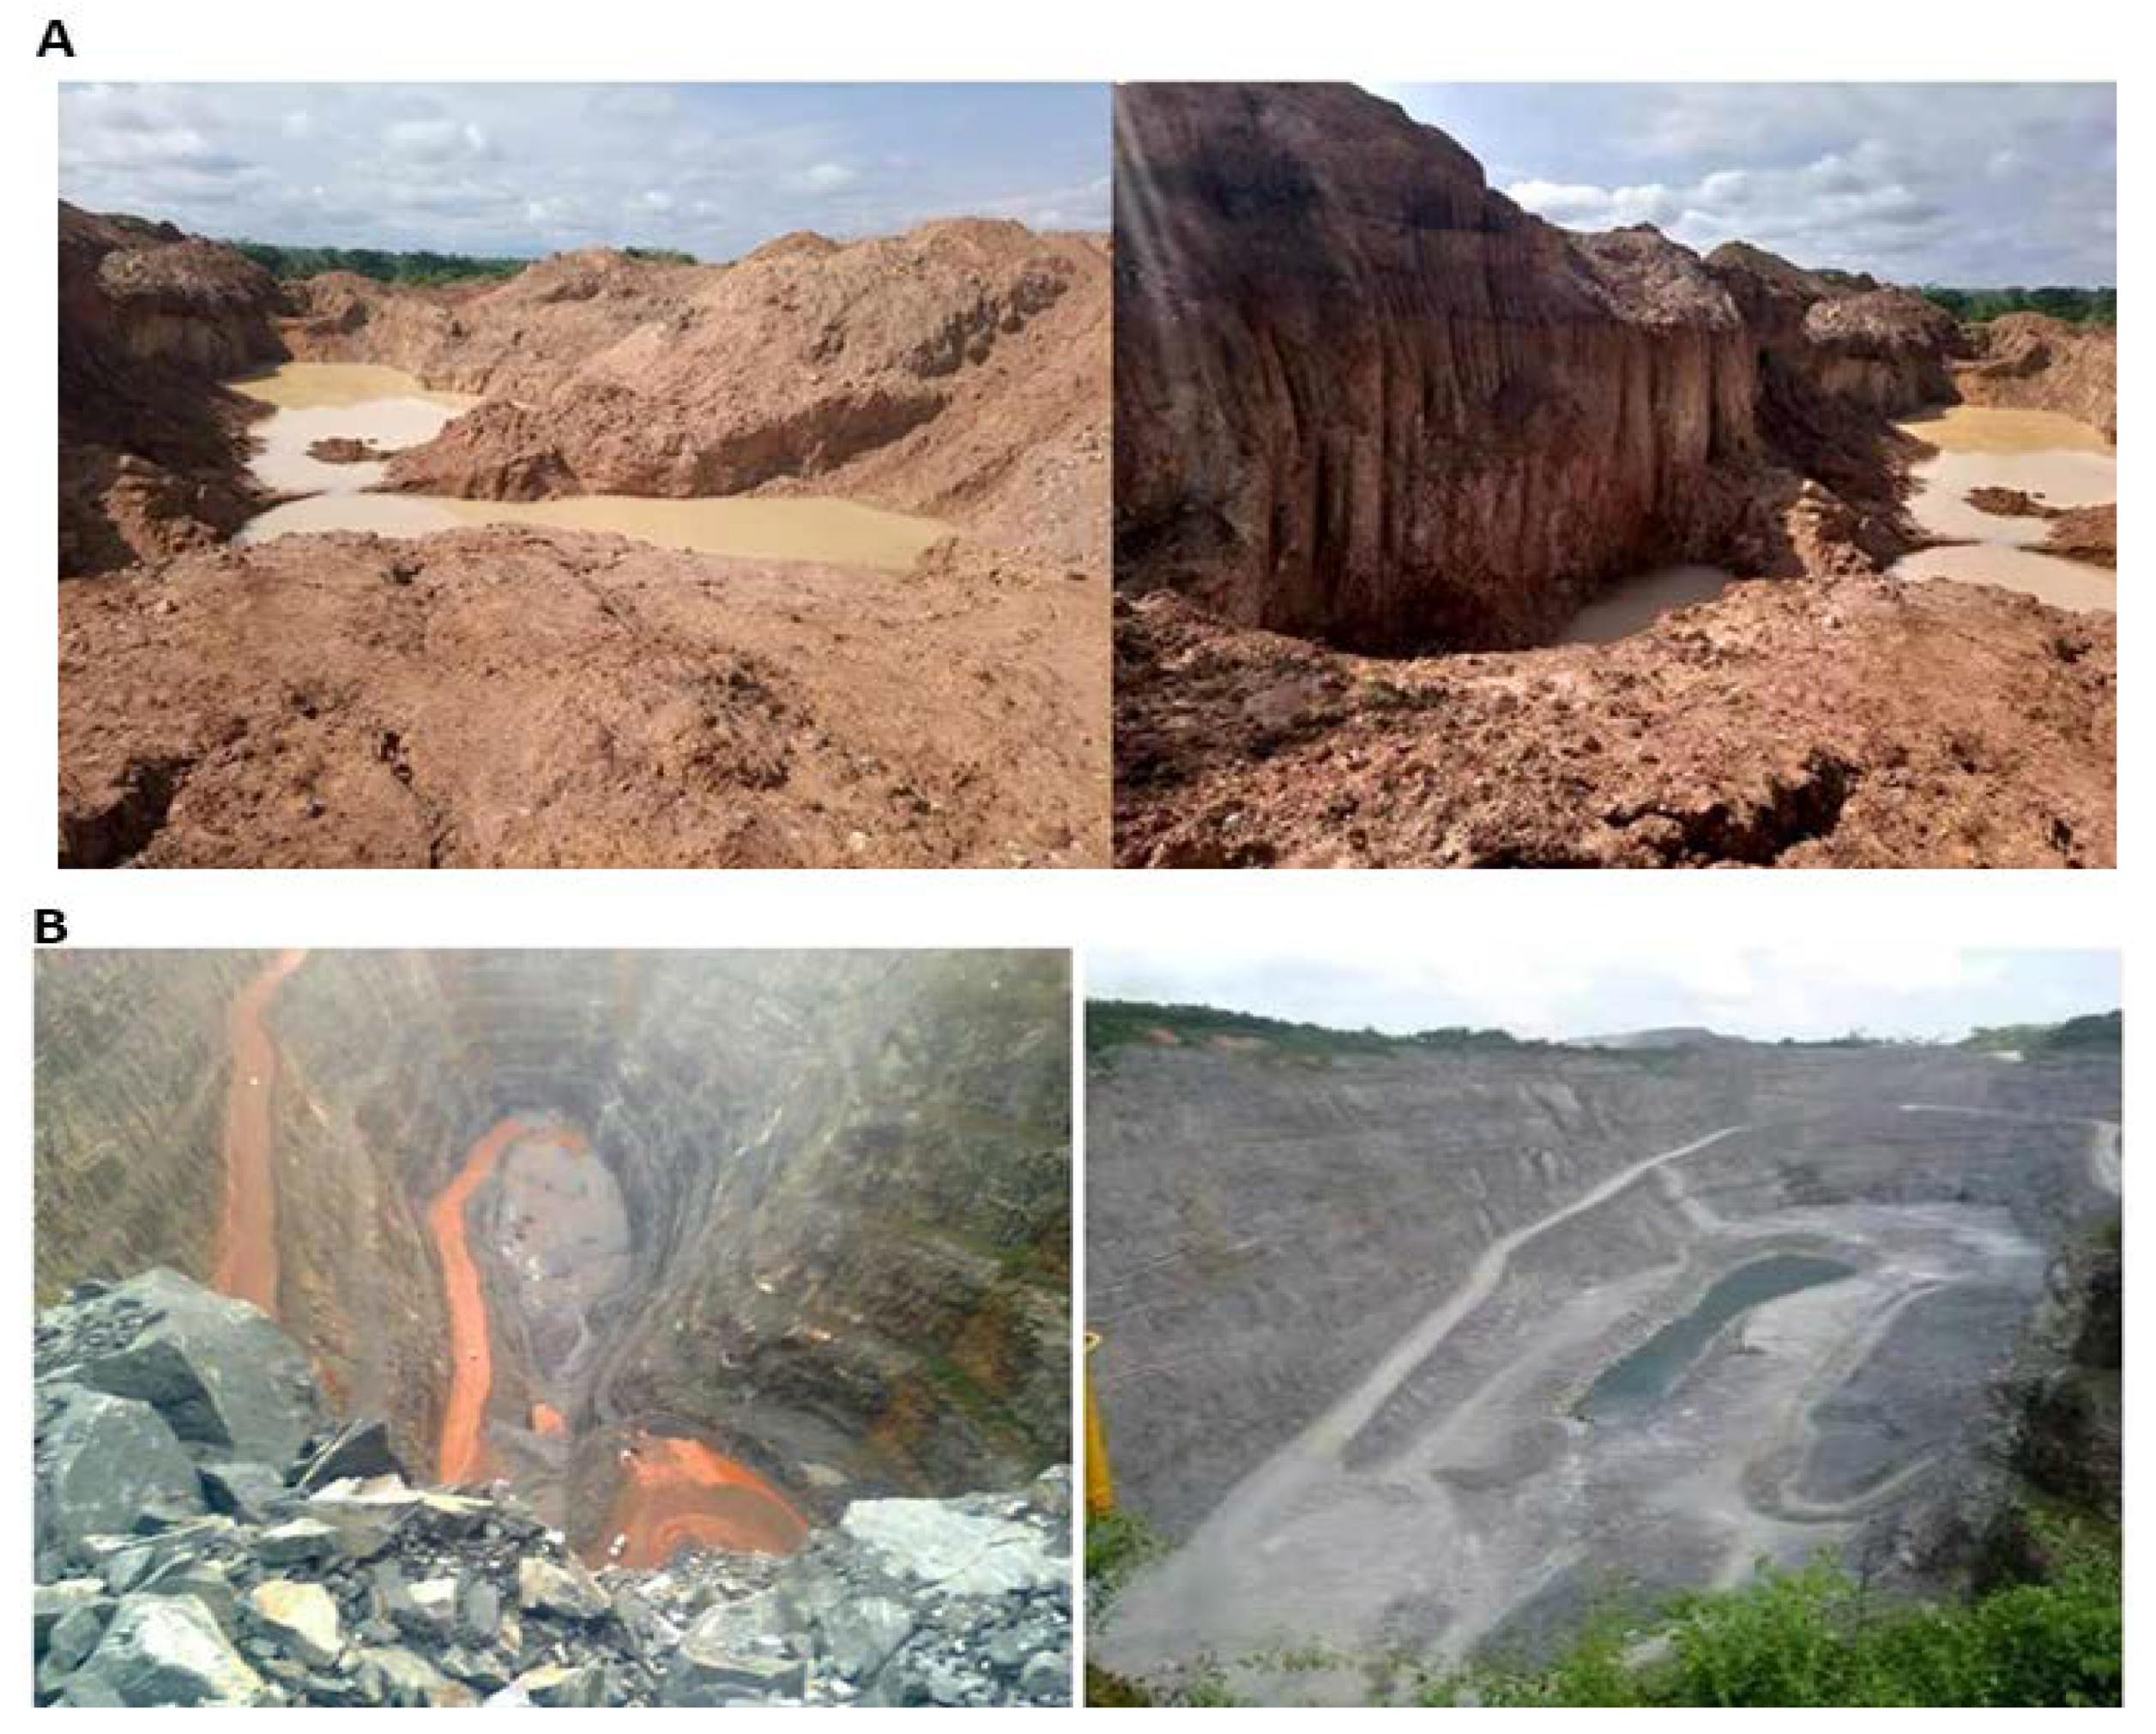
3.3.1. Impact on Water
3.3.2. Impact on Vegetation/Ecosystem and Agricultural Land
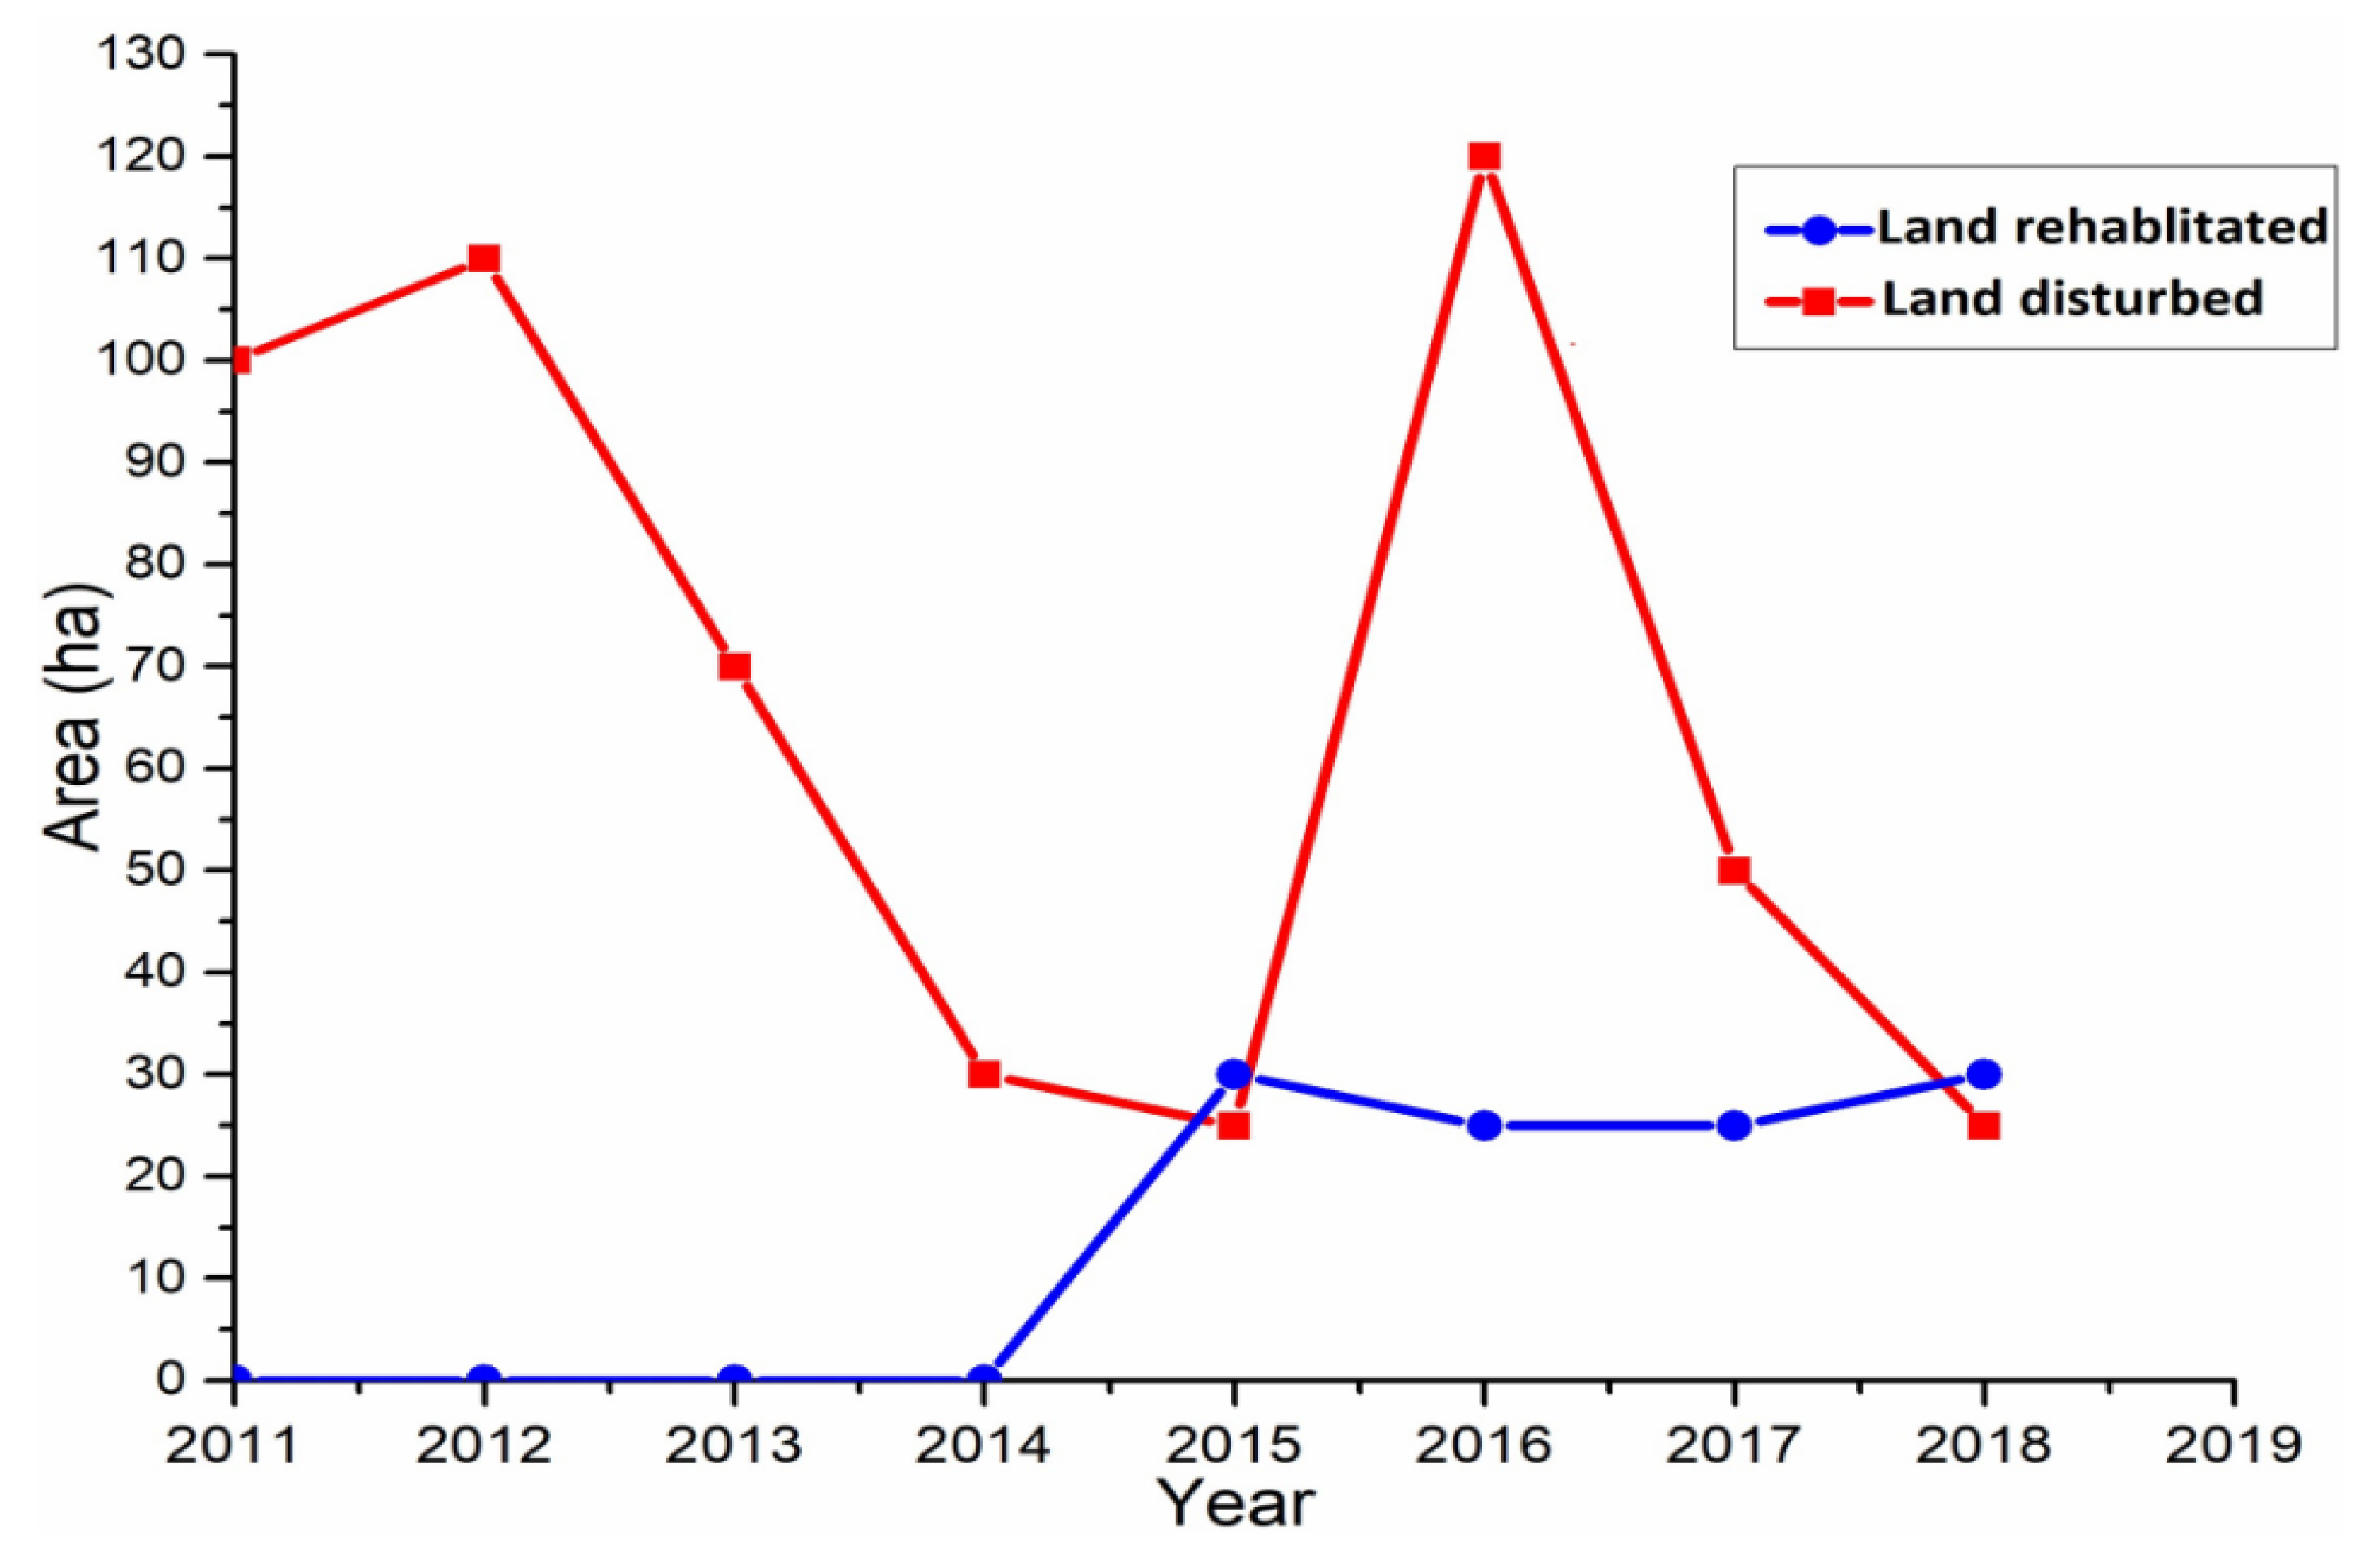
3.3.3. Impact on Land and Soil
3.3.4. Noise Pollution
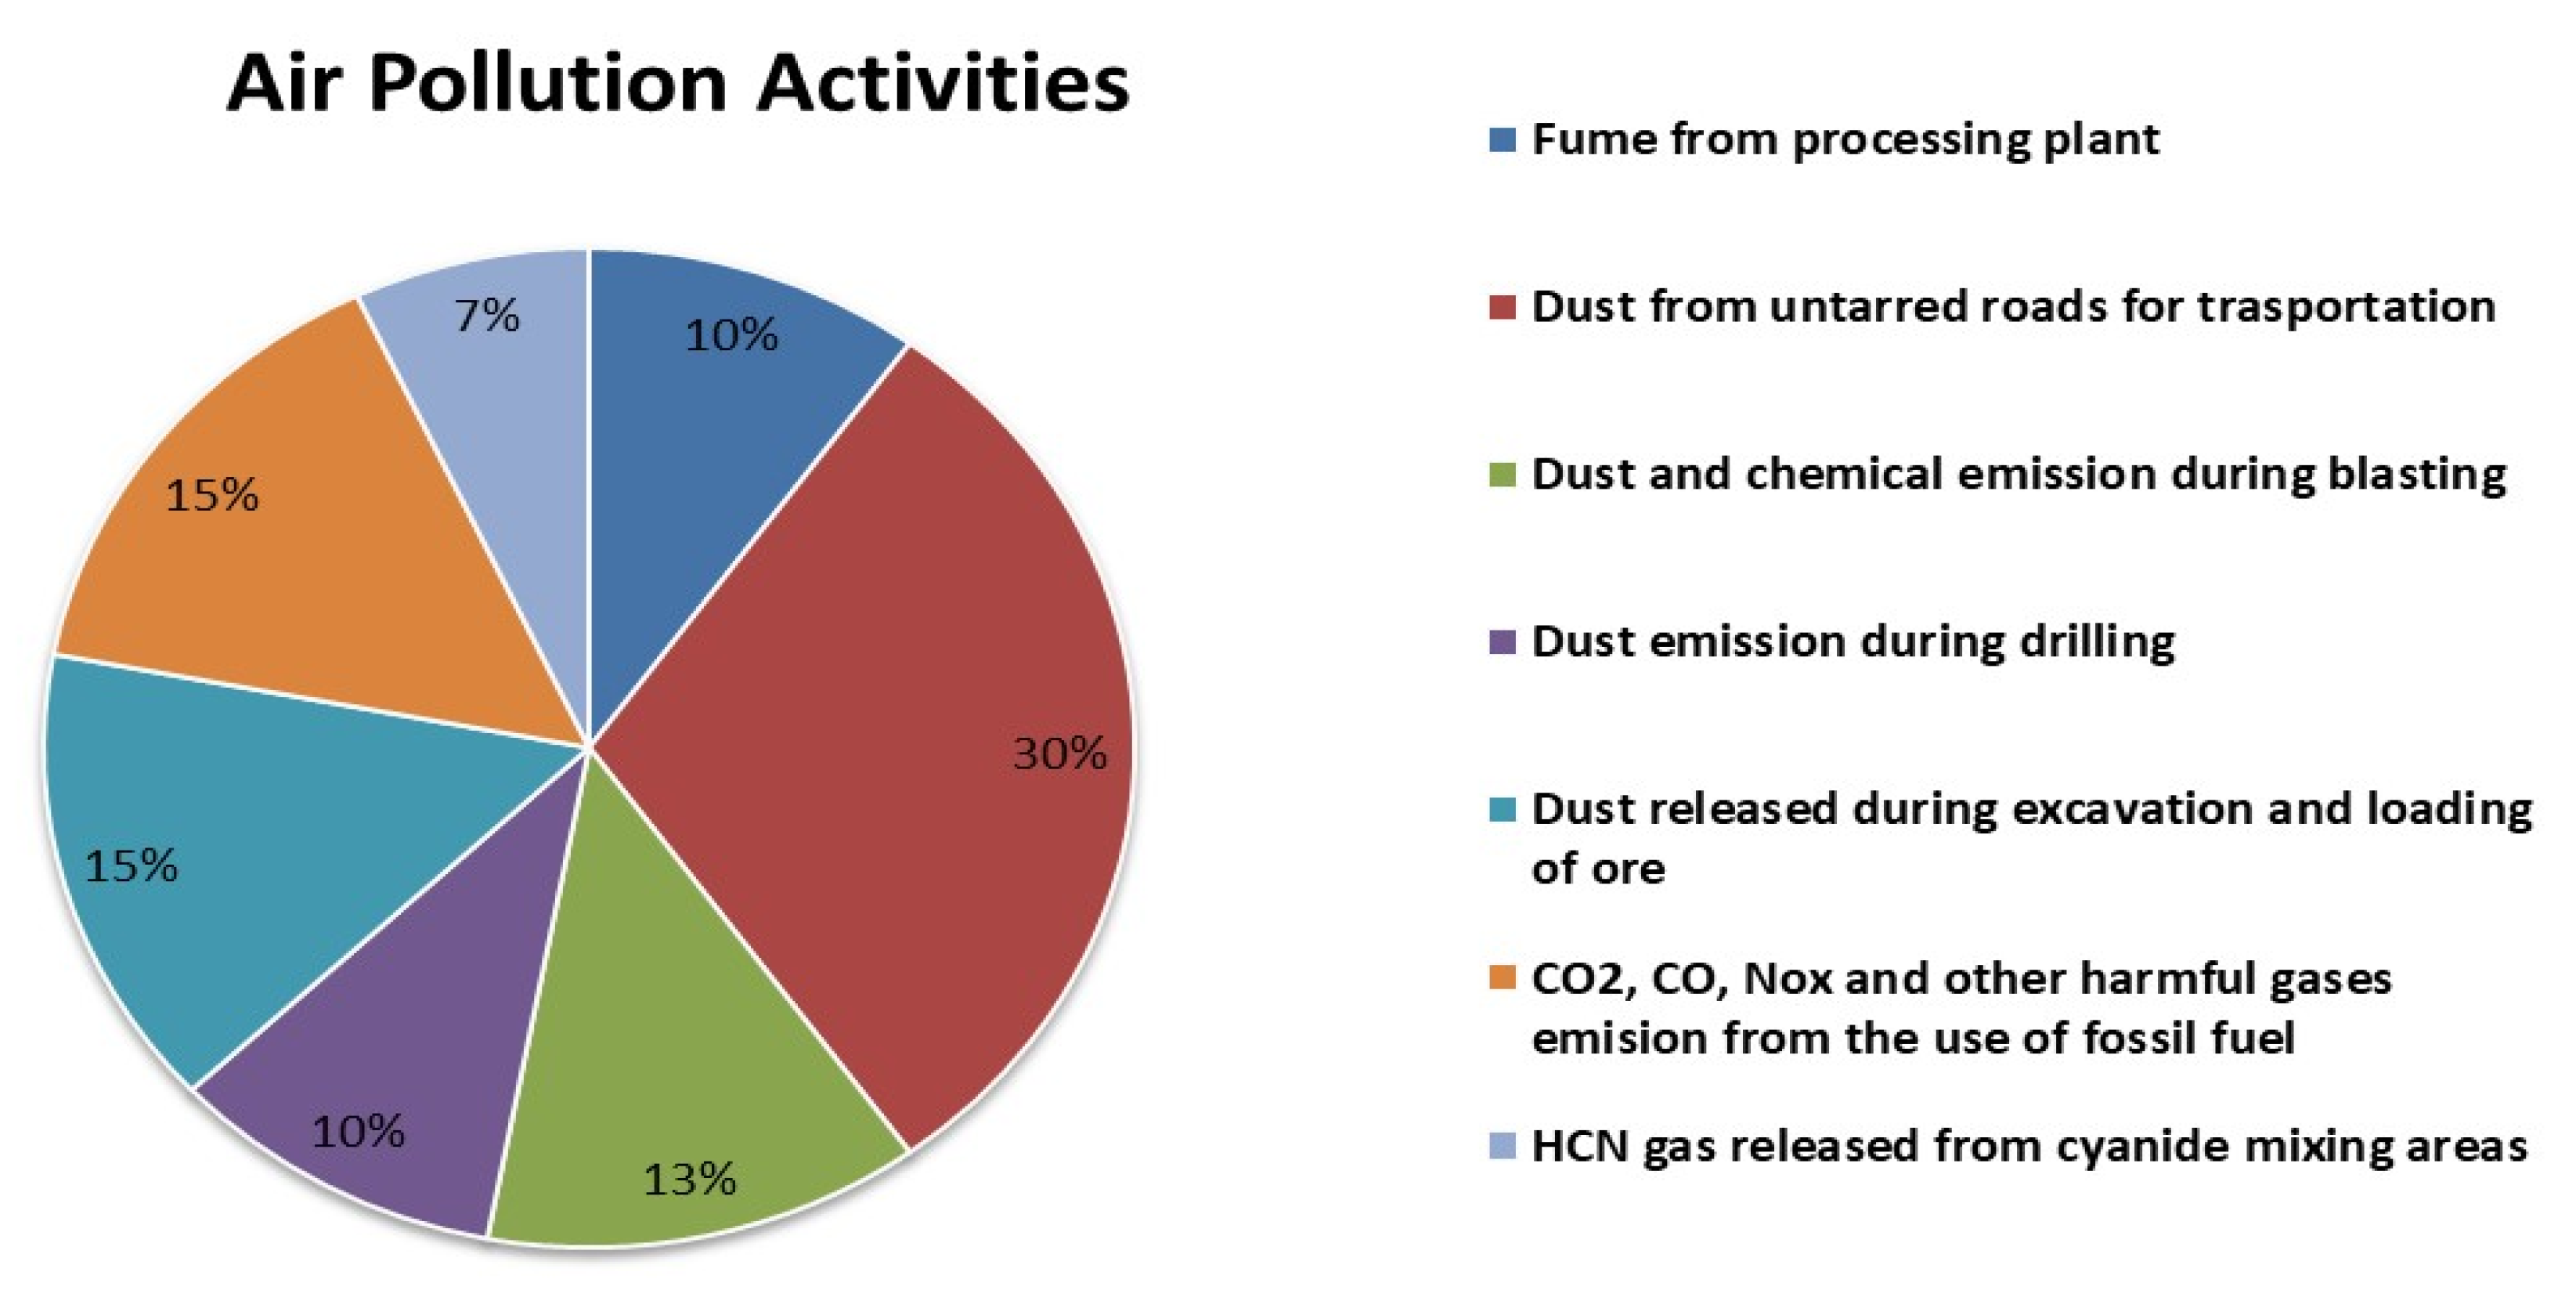
3.3.5. Impacts on Air
4. Conclusions and Recommendation
- Ensuring Effective Stakeholder Coordination, almost all environment components suffer the consequences of large-scale mining activities; therefore, controlling such impacts requires cross-sectoral efforts from all mining sector institutions. There should be effective coordination among all environmental protection and mining support institutions like EPA, Mineral commission, Forestry, and other stakeholders, such as traditional councils and opinion leaders of host communities. Doing this will offer traditional rulers a golden opportunity to add their views to decisions that directly or indirectly affect their wellbeing. Effective collaboration with well-defined roles among these stakeholders will provide a solid body to ensure environmental sustainability by effectively monitoring and scrutinizing the objectives and activities of mining companies.
- Frequent Environmental Education in Mining Communities, environmental protection institutions like the EPA should frequently organize environmental education and awareness programs for mining companies and citizens of host communities on the value of the environment and how to enhance its sustainability as mining operations unfold. Mining companies should be made aware and be educated on some of their unwanted practices and the associated negative impacts that jeopardize environmental sustainability.
- Conducting of Thorough Environmental Impact Assessment, as the mining company is still searching for gold deposits to extend its operations to other areas in the district, appropriate and responsible agencies like the EPA are to conduct an extensive environmental impact assessment to determine and weigh the potential hazards of a newly proposed site before granting a permit. The mining company should be denied a permit if these potential hazards to the environment are very severe after the impact assessment.
- Embarking on Afforestation Programs, the government should make it mandatory for large-scale mining companies to incorporate afforestation programs in their activities. Abandoned mine sites and degraded land should not only be rehabilitated by filling pits with gravel, but should include replanting trees to regain the lost vegetation.
- Installations of Noise Absorbing Machines and Formulation of Strict Blasting Regulations, mining companies should install modern noise-absorbing machines in host communities to help absorb and reduce the excessive noise generated into the community during blasting and other operational activities. Blasting regulations should also involve a defined distance from mining operating sites to communities to deter blasting at mines sites near communities.
Supplementary Materials
Author Contributions
Funding
Institutional Review Board Statement
Informed Consent Statement
Data Availability Statement
Acknowledgments
Conflicts of Interest
References
- Bansah, K.J.; Kansake, B.A.; Assan, E.; Bekui, P.; Bansah, K.J.; Kansake, B.A.; Assan, E.; Bekui, P. Socioeconomic and Environmental Assessment of Informal Artisanal and Small-Scale Mining in Ghana. J. Clean. Prod. 2018, 202, 465–475. [Google Scholar] [CrossRef]
- Emmanuel, A.Y.; Jerry, C.S.; Dzigbodi, D.A. Review of environmental and health impacts of mining in Ghana. J. Health Pollut. 2018, 8, 43–52. [Google Scholar] [CrossRef]
- The World Bank. Mongolia, A Review of Environmental and Social Impacts in the Mining Sector; The World Bank: Washington, DC, USA, 2006. [Google Scholar]
- The Israel’s Trade and Economic Mission to Ghana: Ghana Mining Industry Review; Ministry of Economy and Industries, Foreign Trade Administration: Accra, Ghana, 2020.
- Opoku-Ware, J. The Social and Environmental Impacts of Mining Activities on Indigenous Communities-The Case of Newmont Gold (Gh) Limited (Kenyasi) in Ghan. Master Thesis, University of Agder, Kristiansand, Norway, May 2010. [Google Scholar]
- Ghana Chamber of Mines. Performance of the Mining Industry in 2015; Ghana Chamber of Mines: Accra, Ghana, 2016; Volume 2013, pp. 1–12. [Google Scholar]
- Akabzaa, T.; Darimani, A. Impact of mining sector investment in Ghana: A study of the Tarkwa mining region. A draft report prepared for SAPRI. Third World Netw. 2001, 11, 47–61. [Google Scholar]
- Mabey, P.T.; Li, W.; Sundufu, A.J.; Lashari, A.H. Environmental Impacts: Local Perspectives of Selected Mining Edge Communities in Sierra Leone. Sustainability 2020, 12, 5525. [Google Scholar] [CrossRef]
- Boafo, J.; Paalo, S.A.; Dotsey, S. Illicit Chinese small-scale mining in Ghana: Beyond institutional weakness? Sustainability 2019, 11, 5943. [Google Scholar] [CrossRef]
- Awudi, G.B. The Role of Foreign Direct Investment (FDI) in the Mining Sector of Ghana and the Environment. In Proceedings of the Conference on Foreign Direct Investment and the Environment, Paris, France, 7–8 February 2002. [Google Scholar]
- Gyawu, M.A.; Brako, S.; Adzimah, E.D. Assessing the Challenges Facing Cocoa Production in Ghana: A Supply Chain Perspective (A Case of Selected Licensed Cocoa Buying Companies in Ashanti Region-Ghana). Res. J. Supply Chain. Manag. 2015, 2, 1–16. [Google Scholar]
- Bansah, K.J.; Yalley, A.B.; Duamkor-Dupey, N.K.; Sakyi-Addo, G.B. Small Scale Mining in Ghana: Improving Operations by Utilizing Professional Engineers. In Proceedings of the 4th Biennial International Mining and Minerals Conference, Tarkwa, Ghana, 3–6 August 2016; pp. 24–34. [Google Scholar]
- Arkorful, K.; Acheamfour, B.; Dina, A.; Sheila, F.O.O. Research into Small Scale Mining Formalization in Ghana: Changing the Paradigm of Illigal Galamse; GGA-WA: Accra, Ghana, 2019. [Google Scholar]
- Abwao, D. Mining Companies in Ghana 2020 a Comprehensive List ▷ YEN. Available online: https://yen.com.gh/104793-list-mining-companies-ghana-2020.html (accessed on 12 September 2020).
- Owusu-Nimo, F.; Mantey, J.; Nyarko, K.B.; Appiah-Effah, E.; Aubynn, A. Spatial distribution patterns of illegal artisanal small scale gold mining (Galamsey) operations in Ghana: A focus on the Western Region. Heliyon 2018, 4, e00534. [Google Scholar] [CrossRef]
- Mensah, A.K.; Mahiri, I.O.; Owusu, O.; Mireku, O.D.; Wireko, I.; Kissi, E.A. Environmental Impacts of Mining: A Study of Mining Communities in Ghana. Appl. Ecol. Environ. Sci. 2015, 3, 81–94. [Google Scholar] [CrossRef]
- Burrows, E.; Bird, L. Gold, Guns and China Ghana’s Fight to End Galamsey; African Arguments. Available online: https://africanarguments.org/2017/05/gold-guns-and-china-ghanas-fight-to-end-galamsey/ (accessed on 14 September 2020).
- Amponsah-Tawiah, K. The Mining Industry in Ghana: A Blessing or a Curse. Int. J. Bus. Soc. Sci. 2011, 2, 62–70. [Google Scholar]
- George, B.; Clark, J.L.M. Mining; the Underground Mining. 2017. Available online: https://www.britannica.com/technology/mining/Underground-mining (accessed on 12 October 2020).
- Kemp, D.; Owen, J.R. The Extractive Industries and Society Characterising the interface between large and small-scale mining. Extr. Ind. Soc. 2019, 6, 1091–1100. [Google Scholar] [CrossRef]
- Hilson, G. ‘Inherited commitments’: Do changes in ownership affect Corporate Social Responsibility (CSR) at African gold mines? Afr. J. Bus. Manag. 2011, 5, 10921–10939. [Google Scholar] [CrossRef][Green Version]
- Erdiaw-Kwasie, M.O.; Dinye, R.D.; Mabunyewah, M. Impacts of Mining on the Natural Environment and Wellbeing of Mining-Fringe Communities in Prestea, Ghana. Greener J. Soc. Sci. 2014, 4, 108–122. [Google Scholar] [CrossRef]
- Yaraghi, N.; Ronkanen, A.K.; Torabi Haghighi, A.; Aminikhah, M.; Kujala, K.; Kløve, B. Impacts of gold mine effluent on water quality in a pristine sub-arctic river. J. Hydrol. 2020, 589, 125170. [Google Scholar] [CrossRef]
- Ghanadistricts.com. A Repository of All Local Assemblies in Ghana. Available online: https://www.ghanadistricts.com/Home/District/198 (accessed on 12 October 2020).
- Ghana Statitical Service. 2010 Population and Housing Census, District Analytical Survey, Ellembelle District; Ghana Statitical Service: Accra, Ghana, 2014.
- Johnson, N.; de Klerk, Q.; Yeo, W.; Roux, A. Technical Report and Mineral Resource and Reserve Update for the Nzema Gold Mine, Ghana, West Africa; Endeavour Mining Corporation: London, UK, 2013; pp. 1–173. [Google Scholar]
- Mkpuma, R.O.; Okeke, O.C.; Abraham, E.M. Environmental Problems of Surface and Underground Mining: A review. Int. J. Eng. Sci. 2015, 4, 12–20. [Google Scholar]
- Kuma, J.S.; Younger, P.L. Water quality trends in the Tarkwa gold-mining district, Ghana. Bull. Eng. Geol. Environ. 2004, 63, 119–132. [Google Scholar] [CrossRef]
- Sahebjalal, E.; Dashtekian, K. Analysis of land use-land covers changes using normalized difference vegetation index (NDVI) differencing and classification methods. Afr. J. Agric. Res. 2013, 8, 4614–4622. [Google Scholar] [CrossRef]
- Huang, S.; Tang, L.; Hupy, J.P.; Wang, Y.; Shao, G. A commentary review on the use of normalized difference vegetation index (NDVI) in the era of popular remote sensing. J. For. Res. 2021, 32, 1–6. [Google Scholar] [CrossRef]
- Choubin, B.; Soleimani, F.; Pirnia, A.; Sajedi-Hosseini, F.; Alilou, H.; Rahmati, O.; Melesse, A.M.; Singh, V.P.; Shahabi, H. Effects of Drought on Vegetative Cover Changes: Investigating Spatiotemporal Patterns; Elsevier Inc.: Amsterdam, The Netherlands, 2019. [Google Scholar]
- Drisya, J.; Kumar, S.D.; Thendiyath, R. Spatio-Temporal Variability of Soil Moisture and Drought Estimation Using a Distributed Hydrological Model: Book Chapter Integrating Disaster Science and Management; Elsevier Inc.: Amsterdam, The Netherlands, 2018. [Google Scholar]
- Yacouba, D.; Guangdao, H.; Xingping, W. Assessment of Land Use Cover Changes Using Ndvi and Dem in Puer and Simao Counties, Yunnan Province, China. World Rural Obs. 2009, 1, 1–11. [Google Scholar]
- Lyon, J.G.; Yuan, D.; Lunetta, R.S.; Elvidge, C.D. A Change Detection Experiment Using Vegetation Indices. Photogramm. Eng. Remote Sens. 1998, 64, 143–150. [Google Scholar]
- Hilson, G.; Nyame, F. Gold mining in Ghana’s forest reserves: A report on the current debate. Area 2006, 38, 175–185. [Google Scholar] [CrossRef]
- Jones, H.G.; Vaughan, R.A. Remote Sensing of Vegetation: Principles, Techniques, and Applications; Oxford University Press: New York, NY, USA, 2010; p. 353. [Google Scholar]
- Mcveagh, P.; Yule, I.; Grafton, M. Pasture yield mapping from your groundspread truck. In Advanced Nutrient Management: Gains from the Past—Goals for the Future. Occasional Re-port No. 25; Currie, L.D., Christensen, C.L., Eds.; Fertilizer and Lime Research Centre: Palmerston North, New Zealand, 2012; pp. 1–5. [Google Scholar]
- Kamga, M.A.; Olatubara, C.O.; Atteh, M.M.; Nzali, S.; Adenikinju, A.; Mbiatso, T.Y.; Ngatcha, R.B. Perception of the Environmental Degradation of Gold Mining on Socio-Economic Variables in Eastern Cameroon, Cameroon. Eur. J. Sustain. Dev. Res. 2018, 2. [Google Scholar] [CrossRef]
- Beane, S.J.; Comber, S.D.W.; Rieuwerts, J.; Long, P. Abandoned metal mines and their impact on receiving waters: A case study from Southwest England. Chemosphere 2016, 153, 294–306. [Google Scholar] [CrossRef]
- Garbarino, E.; Orveillon, G.; Saveyn, H.G.M.; Barthe, P.; Eder, P. Best Available Techniques (BAT) Reference Document for the Management of Waste from Extractive Industries. JRC Sci. Policy Rep. 2018. [Google Scholar] [CrossRef]
- Monna, F.; Hamer, K.; Lévêque, J.; Sauer, M. Pb isotopes as a reliable marker of early mining and smelting in the Northern Harz province (Lower Saxony, Germany). J. Geochem. Explor. 2000, 68, 201–210. [Google Scholar] [CrossRef]
- Schueler, V.; Kuemmerle, T.; Schröder, H.; Schueler, V.; Kuemmerle, T. Royal Swedish Academy of Sciences Impacts of Surface Gold Mining on Land Use Systems in Western Ghana. Ambio 2016, 40, 528–539. [Google Scholar] [CrossRef] [PubMed]
- Berger, E.; Frör, O.; Schäfer, R.B. Salinity impacts on river ecosystem processes: A critical mini-review. Philos. Trans. R. Soc. B Biol. Sci. 2019, 374. [Google Scholar] [CrossRef] [PubMed]
- Peng, J.; Zong, M.; Hu, Y.; Liu, Y.; Wu, J. Assessing Landscape Ecological Risk in a Mining City: A Case Study in Liaoyuan City, China. Sustainability 2015, 7, 8312–8334. [Google Scholar] [CrossRef]
- Olías, M.; Nieto, J.M.; Sarmiento, A.M.; Cerón, J.; Canovas, C.R. Seasonal water quality variations in a river affected by acid mine drainage: The Odiel River (South West Spain). Sci. Total Environ. 2014, 333, 267–281. [Google Scholar] [CrossRef]
- Amedofu, G.K. Hearing Impairment among Workers in a Surface Gold Mining Company in Ghana. Afr. J. Health Sci. 2002, 9, 91–97. [Google Scholar] [CrossRef]
- Hilson, G. Distributing Mining Wealth to Communities in Ghana: Addressing Problems of Elite Capture and Political Corruption; Anti-Corruption Resource Centre: Bergen, Norway, 2013; p. 34. [Google Scholar]
- National Geographic Resource. Noise Pollution. Available online: https://www.nationalgeographic.org/encyclopedia/noise-pollution/ (accessed on 5 November 2020).


| Variable | Community | Total | |||
|---|---|---|---|---|---|
| Nkroful | T. Bokazo | Anwia | Salma | n = 65 (%) | |
| Gender | |||||
| Male | 13 | 7 | 10 | 10 | 40 (61.5) |
| Female | 7 | 8 | 5 | 5 | 25 (38.5) |
| Age group | |||||
| 20–35 | 4 | 3 | 3 | 4 | 14 (21.5) |
| 36–45 | 11 | 8 | 10 | 8 | 37 (56.9) |
| 46+ | 5 | 4 | 2 | 3 | 14 (21.5) |
| Educational level | |||||
| Non-Formal | 3 | 5 | 8 | 8 | 24 (36.9) |
| Basic | 4 | 3 | 3 | 1 | 11 (16.9) |
| Secondary | 5 | 4 | 4 | 3 | 16 (24.6) |
| Tertiary | 8 | 3 | 0 | 3 | 14 (21.5) |
| Occupation | |||||
| Stakeholder institution | 3 | 0 | 0 | 0 | 3 (4.6) |
| Opinion leader | 3 | 2 | 2 | 2 | 9 (13.8) |
| Mine worker | 2 | 1 | 0 | 1 | 4 (6.2) |
| Farmer | 8 | 8 | 9 | 8 | 33 (50.8) |
| Others | 4 | 4 | 4 | 4 | 16 (24.6) |
| NDVI (KM2) | 2008 | 2015 | 2020 | |||
|---|---|---|---|---|---|---|
| km2 | % | km2 | % | km2 | % | |
| Class 1 (Low) | 59.59 | 6.28 | 83.22 | 8.76 | 73.40 | 7.73 |
| Class 2 (Medium) | 325.76 | 34.32 | 419.68 | 44.22 | 316.78 | 33.38 |
| Class 3 (High) | 563.80 | 59.40 | 446.25 | 47.01 | 558.97 | 58.89 |
| Total | 949.15 | 100 | 949.15 | 100 | 949.15 | 100 |
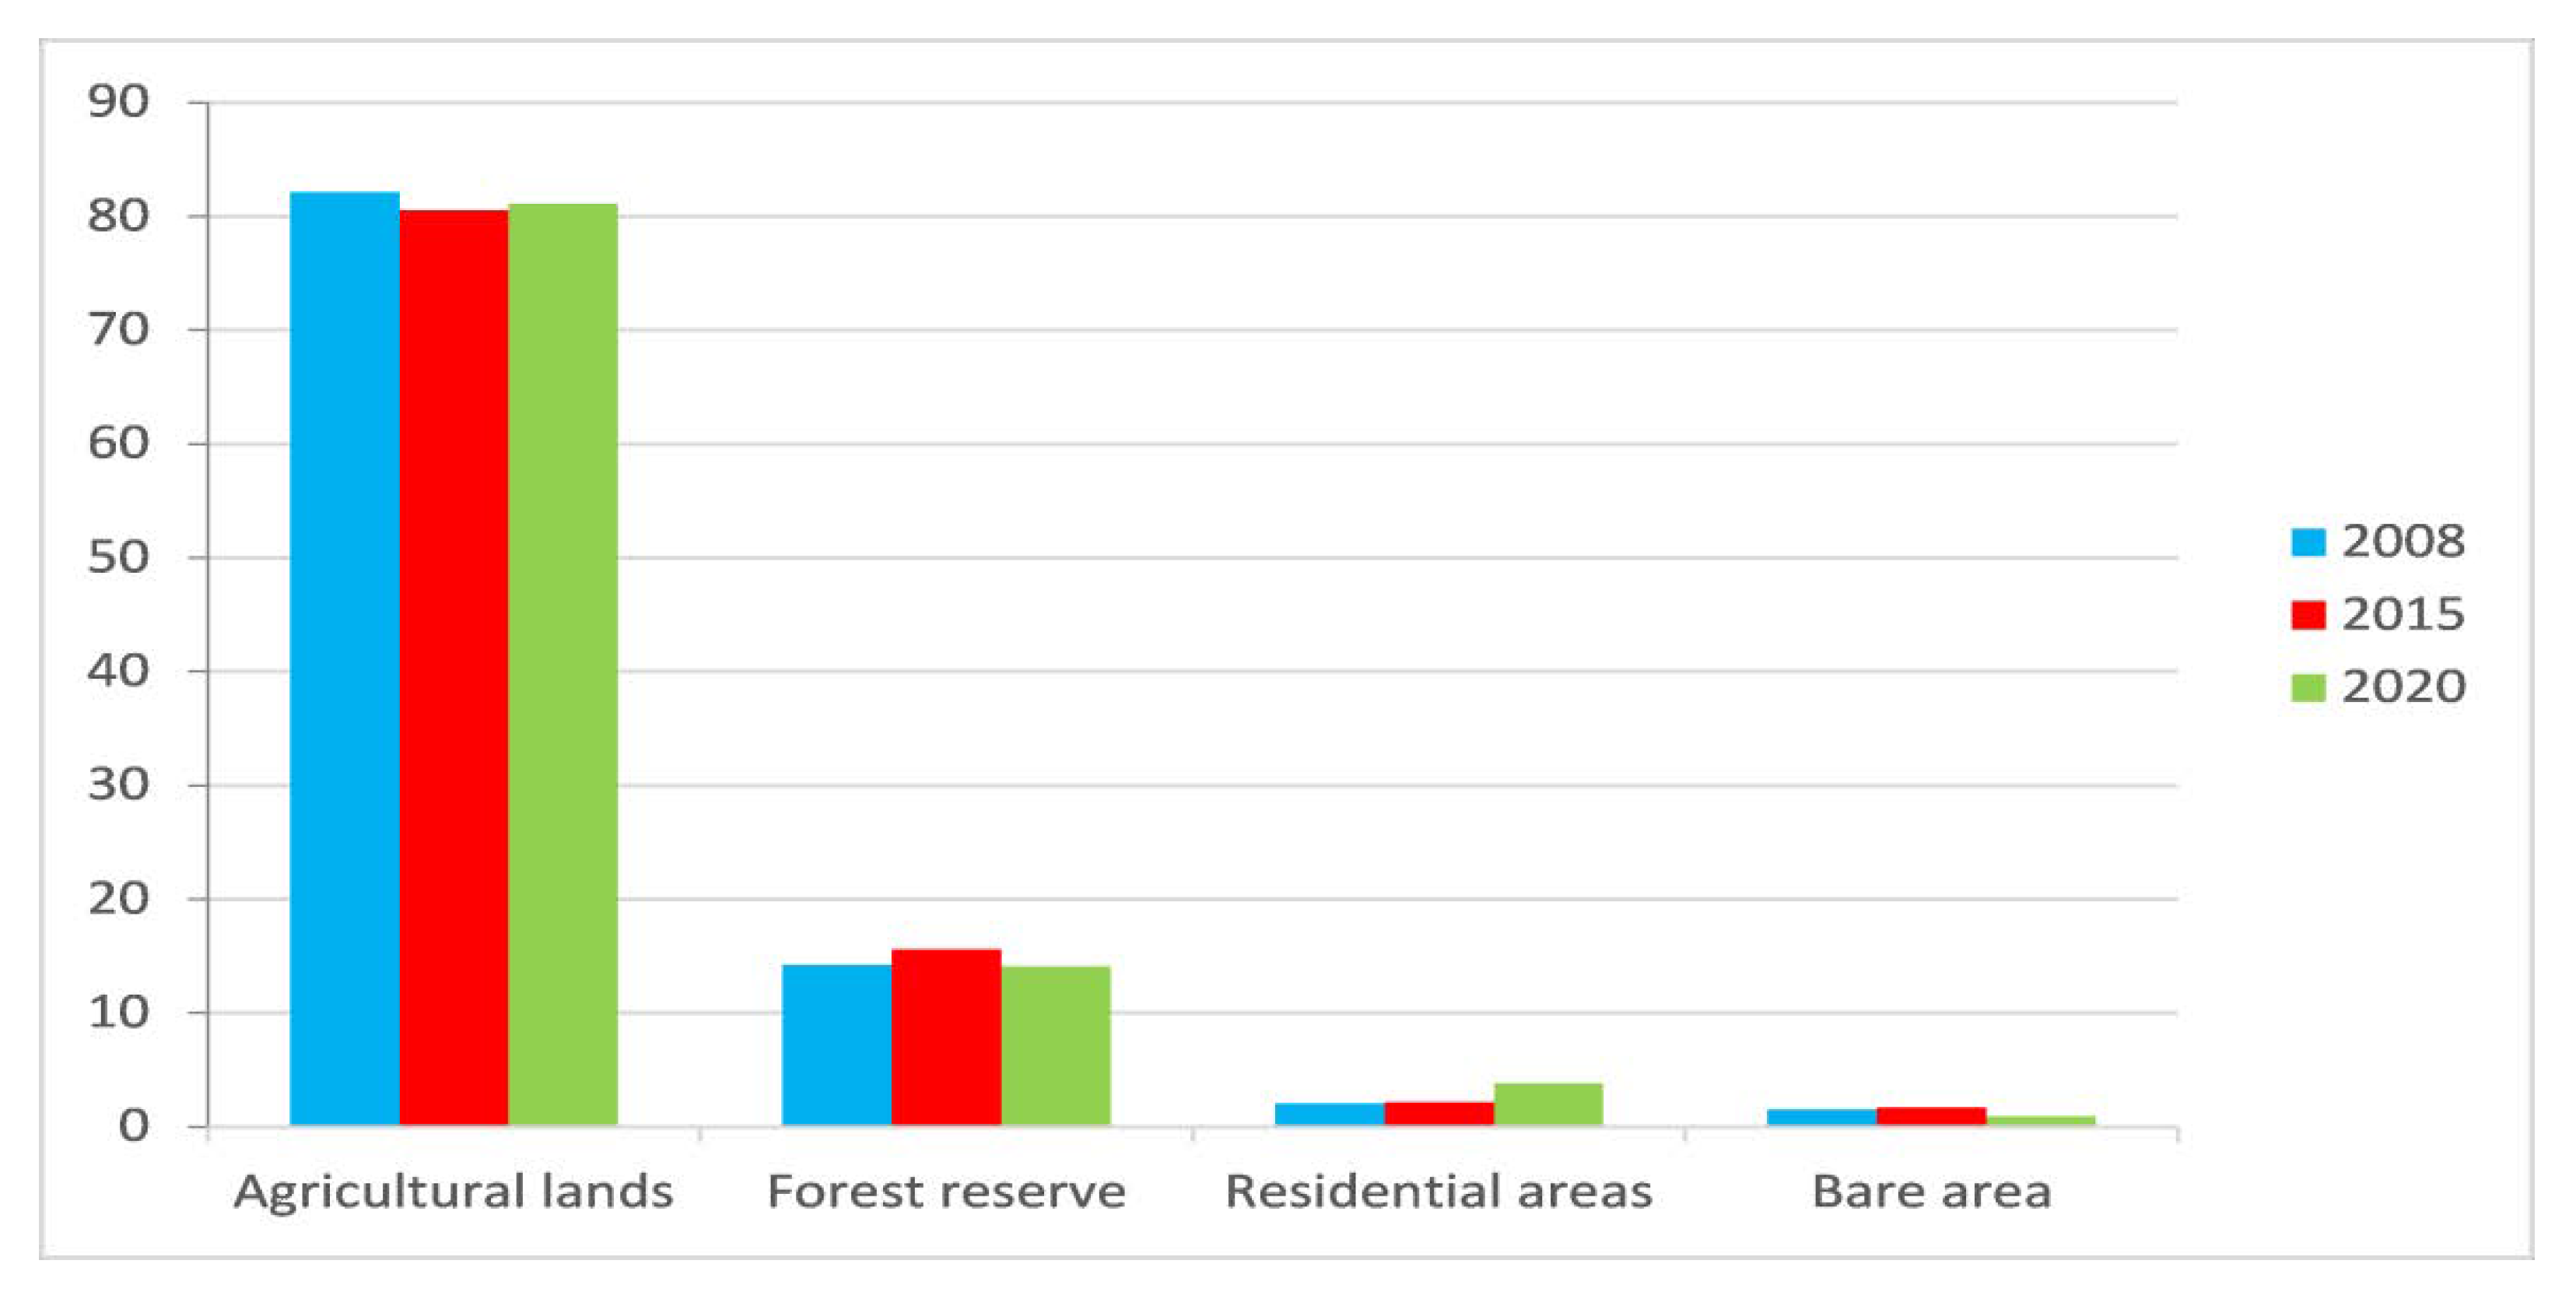
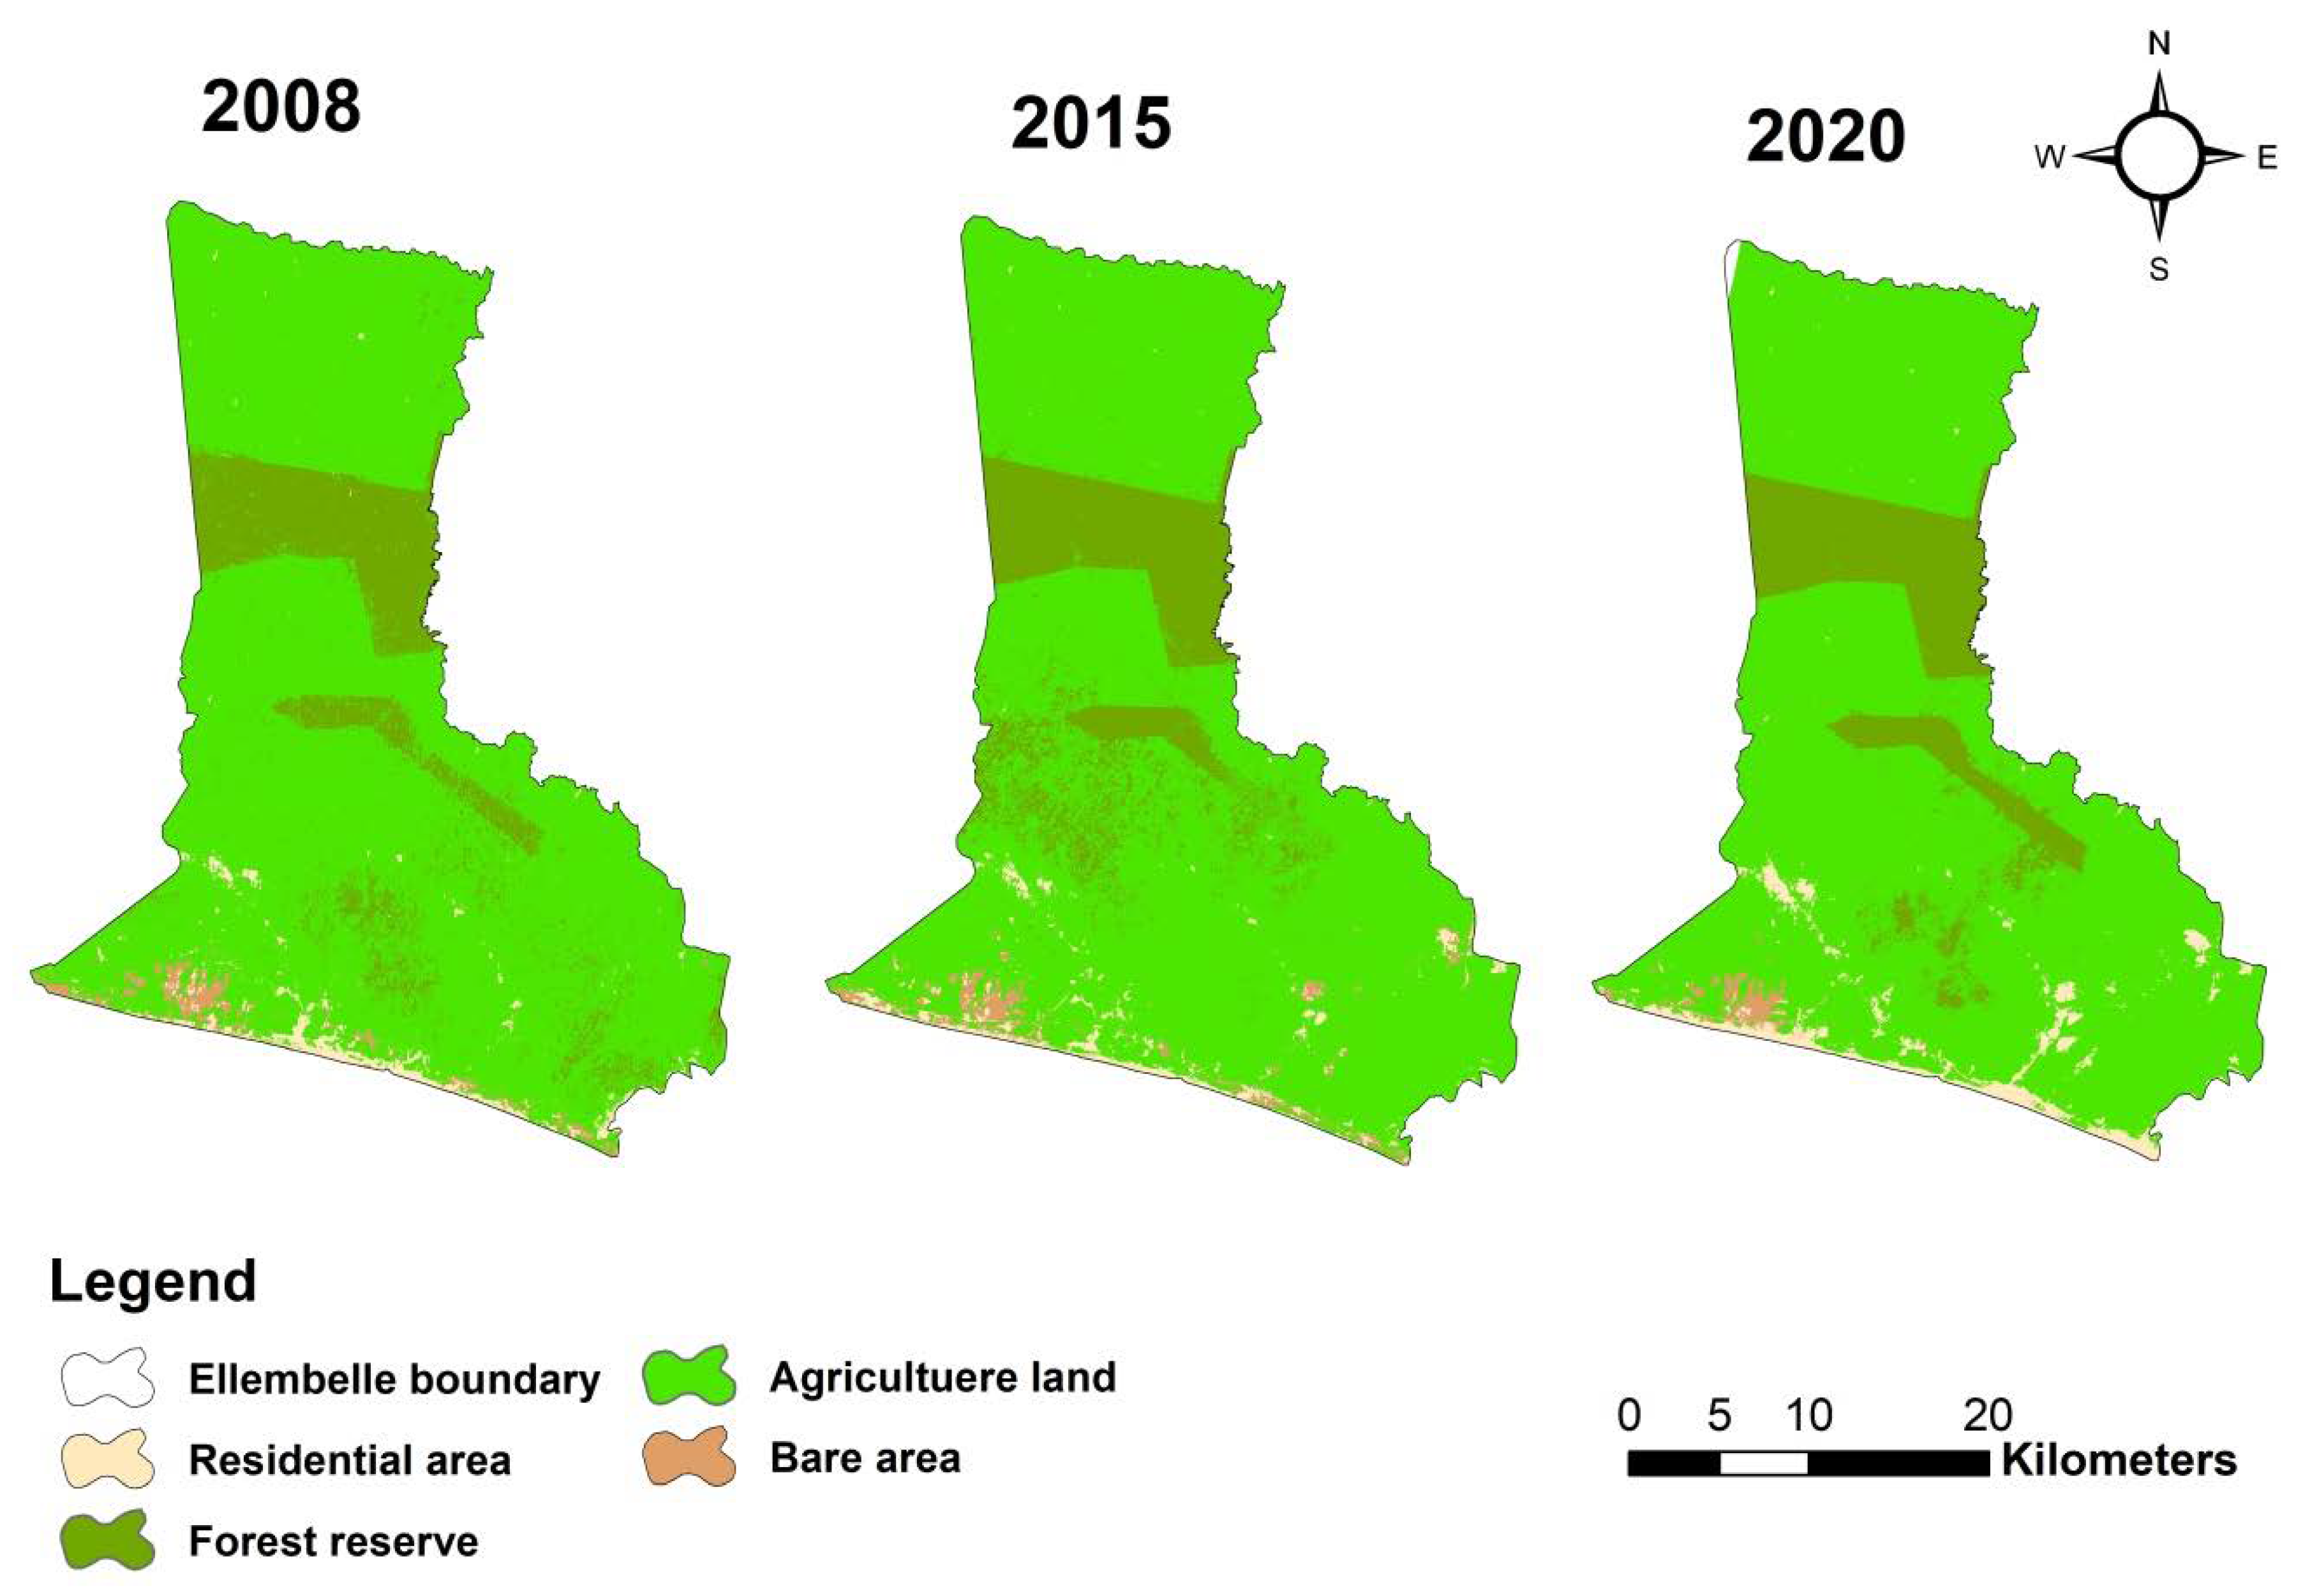
| LULC Type | 2008 LULC Area | 2015 LULC Area | 2020 LULC Area | Change between 2008 and 2015 | Change between 2015 and 2020 | |||||
|---|---|---|---|---|---|---|---|---|---|---|
| km2 | % | km2 | % | km2 | % | km2 | % | km2 | % | |
| Agricultural lands | 779.55 | 82.13 | 764.44 | 80.54 | 769.91 | 81.11 | −15.11 | −0.98 | 5.47 | 0.36 |
| Forest reserve | 135.10 | 14.23 | 147.89 | 15.58 | 133.84 | 14.10 | 12.79 | 4.52 | −14.05 | −4.99 |
| Residential areas | 19.80 | 2.09 | 20.50 | 2.16 | 36.58 | 3.85 | 0.70 | 1.74 | 16.08 | 28.17 |
| Bare area | 14.73 | 1.55 | 16.35 | 1.72 | 8.85 | 0.94 | 1.62 | 5.21 | −7.50 | −29.76 |
| Total | 949.18 | 100 | 949.18 | 100 | 949.18 | 100 | - | - | - | - |
Publisher’s Note: MDPI stays neutral with regard to jurisdictional claims in published maps and institutional affiliations. |
© 2021 by the authors. Licensee MDPI, Basel, Switzerland. This article is an open access article distributed under the terms and conditions of the Creative Commons Attribution (CC BY) license (https://creativecommons.org/licenses/by/4.0/).
Share and Cite
Usman Kaku, D.; Cao, Y.; Al-Masnay, Y.A.; Nizeyimana, J.C. An Integrated Approach to Assess the Environmental Impacts of Large-Scale Gold Mining: The Nzema-Gold Mines in the Ellembelle District of Ghana as a Case Study. Int. J. Environ. Res. Public Health 2021, 18, 7044. https://doi.org/10.3390/ijerph18137044
Usman Kaku D, Cao Y, Al-Masnay YA, Nizeyimana JC. An Integrated Approach to Assess the Environmental Impacts of Large-Scale Gold Mining: The Nzema-Gold Mines in the Ellembelle District of Ghana as a Case Study. International Journal of Environmental Research and Public Health. 2021; 18(13):7044. https://doi.org/10.3390/ijerph18137044
Chicago/Turabian StyleUsman Kaku, Dawuda, Yonghong Cao, Yousef Ahmed Al-Masnay, and Jean Claude Nizeyimana. 2021. "An Integrated Approach to Assess the Environmental Impacts of Large-Scale Gold Mining: The Nzema-Gold Mines in the Ellembelle District of Ghana as a Case Study" International Journal of Environmental Research and Public Health 18, no. 13: 7044. https://doi.org/10.3390/ijerph18137044
APA StyleUsman Kaku, D., Cao, Y., Al-Masnay, Y. A., & Nizeyimana, J. C. (2021). An Integrated Approach to Assess the Environmental Impacts of Large-Scale Gold Mining: The Nzema-Gold Mines in the Ellembelle District of Ghana as a Case Study. International Journal of Environmental Research and Public Health, 18(13), 7044. https://doi.org/10.3390/ijerph18137044