Article

Water Quality Assessment and Evaluation of Human Health Risk in Mutangwi River, Limpopo Province, South Africa

by
Rofhiwa T. Madilonga
1,
Joshua N. Edokpayi
1,*,
Elijah T. Volenzo
1,
Olatunde S. Durowoju
1 and
John O. Odiyo
1,2
1
Department of Hydrology and Water Resources, University of Venda, Thohoyandou 0950, South Africa
2
Office of the DVC Research Innovation Commercialization and Internationalization (RICI), Vaal University of Technology, Vanderbijlpark 1911, South Africa
*
Author to whom correspondence should be addressed.
Int. J. Environ. Res. Public Health 2021, 18(13), 6765; https://doi.org/10.3390/ijerph18136765
Submission received: 14 May 2021 / Revised: 14 June 2021 / Accepted: 15 June 2021 / Published: 24 June 2021

Abstract

:
Freshwater supply is essential to life on Earth; however, land use activities such as mining and agriculture pose a significant danger to freshwater resources and the wellbeing of aquatic environments. This study temporarily assesses the water quality characteristics of Mutangwi River. Physicochemical parameters (pH, temperature, total dissolved solids (TDS), salinity, electrical conductivity (EC), and turbidity) were determined in situ using an Extech multimeter and turbidity meter. The concentration of the selected metals (Mg, Cr, Fe, Cd, Mn, Pb, Ca, and Na) were analysed using an Atomic Absorption Spectrophotometer. Membrane filtration method was used to analyse microbiological parameters (Escherichia coli and Enterococci). The physicochemical water quality parameters as well as basic anions (fluoride, phosphate, sulfate, nitrate, and chloride) determined complied with the regulatory guideline of the World Health Organization (WHO) and the South Africa National Standards (SANS). Some of the trace metals (Mn, Ca, Fe, and Mg) were found below the guideline values, while others (Pb and Cd) exceeded the threshold limit. The counts for E. coli (814.5–2169 cfu/100 mL) and Enterococci (333–9396 cfu/100 mL) in the study did not comply with the regulatory guidelines. The water quality status using the water quality index (WQI) indicated that on the average, the water quality from Mutangwi River is poor (WQI > 100). The hazard quotient through ingestion exposure did not exceed the threshold limit of 1, for adults and children. This implies that there is no potential non-carcinogenic health risk from trace elements via ingestion of drinking water for children and adults. However, cancer risk for adults and children was computed in relation to Cd and Pb levels and exceeded the threshold limit 10−4, indicating a possible carcinogenic risk. Water from the river should be adequately treated prior to domestic and agricultural use.

1. Introduction

Water quality often determines the fitness of water use for a variety of purposes. The assessment of water quality is thus important to evaluate the water use potential of any water resource [1]. The consumption of clean and safe water has been linked to increased health outcomes globally [2,3]. Despite the achievements that have been recorded with increased access to potable water, millions of people suffer various health-related preventable diseases due to the consumption of contaminated water [4].
In many cities and towns globally, sustainable access to clean and safe water has been reported; however, unfortunately, many people who live in peri-urban and rural regions of the world do not have continuous access to clean and safe water and they often resort to several alternative sources for their domestic water needs [5,6,7,8,9]. In most low-income countries, water is usually abstracted from rivers, lakes, and dams and used without any form of treatment [10,11]. The ease of access to surface water is one of the controlling factors contributing to its wide use, though it is often prone to higher chances of contamination and serves as one of the major sinks for environmental pollution [10,12]. Water quality is of a great concern globally because the decline in its quality due to contamination has great economic and public health burden [5,7,10].
In South Africa, surface waters such as rivers, lakes, ponds, and streams are key components for water supply due to the numerous dams that are fed from them. In the absence of sustainable access to potable water in rural areas, people are left to seek for alternative sources to meet their basic needs, and surface water is the first point of call as it is easy to access and use [2,3,11]. Consumption of untreated and inadequately treated water remains a major disease burden to public health and causes waterborne diseases such as cholera, typhoid, and dysentery [10,12]. Furthermore, high levels of trace metals and anions in drinking surface water have been reported to cause various health complications, including gastric cancer, baby blue syndrome, altered reproduction potential, and mouth ulceration [13,14].
Anthropogenic and natural factors can cause an increase in the level of contamination of freshwater sources [8,15]. Activities such as human settlements, industrialization, and agriculture (crop and livestock farming) have adversely affected the quality of most rivers, streams, and dams. Although there are legislations to protect surface water bodies from pollution, such as the pollutant pay principle, they are hardly enforced [5]. This has consequently led to increased contamination of surface water bodies, which are often a source of domestic water, agricultural water, occupation, and recreation to many who lives along their course [9].
Mutangwi River is widely used for domestic, recreational, and agricultural purposes (irrigation and animal watering). Moreover, small-scale businesses such as car washes abstract water from the river. Small-scale fishing also occurs within the river course. Edokpayi et al. [12] reported the discharge of inadequately treated hospital wastewater effluent into the river before it joins the Nzhelele River, which feeds the Nzhelele dam for water supply. Other potential sources of pollution to the river system include open dumping of solid wastes, open grazing of free-ranging animals, and surface runoff from various farmlands within its course. Hence, it is of outmost importance to report on the water quality status of Mutangwi River as, to the best of our knowledge, there are no published data on this important water resource in a semi-arid region of South Africa.
We, therefore, report our findings on the physicochemical and microbiological characteristics of Mutangwi River. In addition, we present the overall status of water in the river using the Water Quality Index (WQI), which is a versatile tool for summarizing the water quality status of a river system. Furthermore, since the water is used for several purposes, we computed the potential carcinogenic and noncarcinogenic health risk associated with its consumption based on the trace metals levels recorded.

2. Materials and Methods
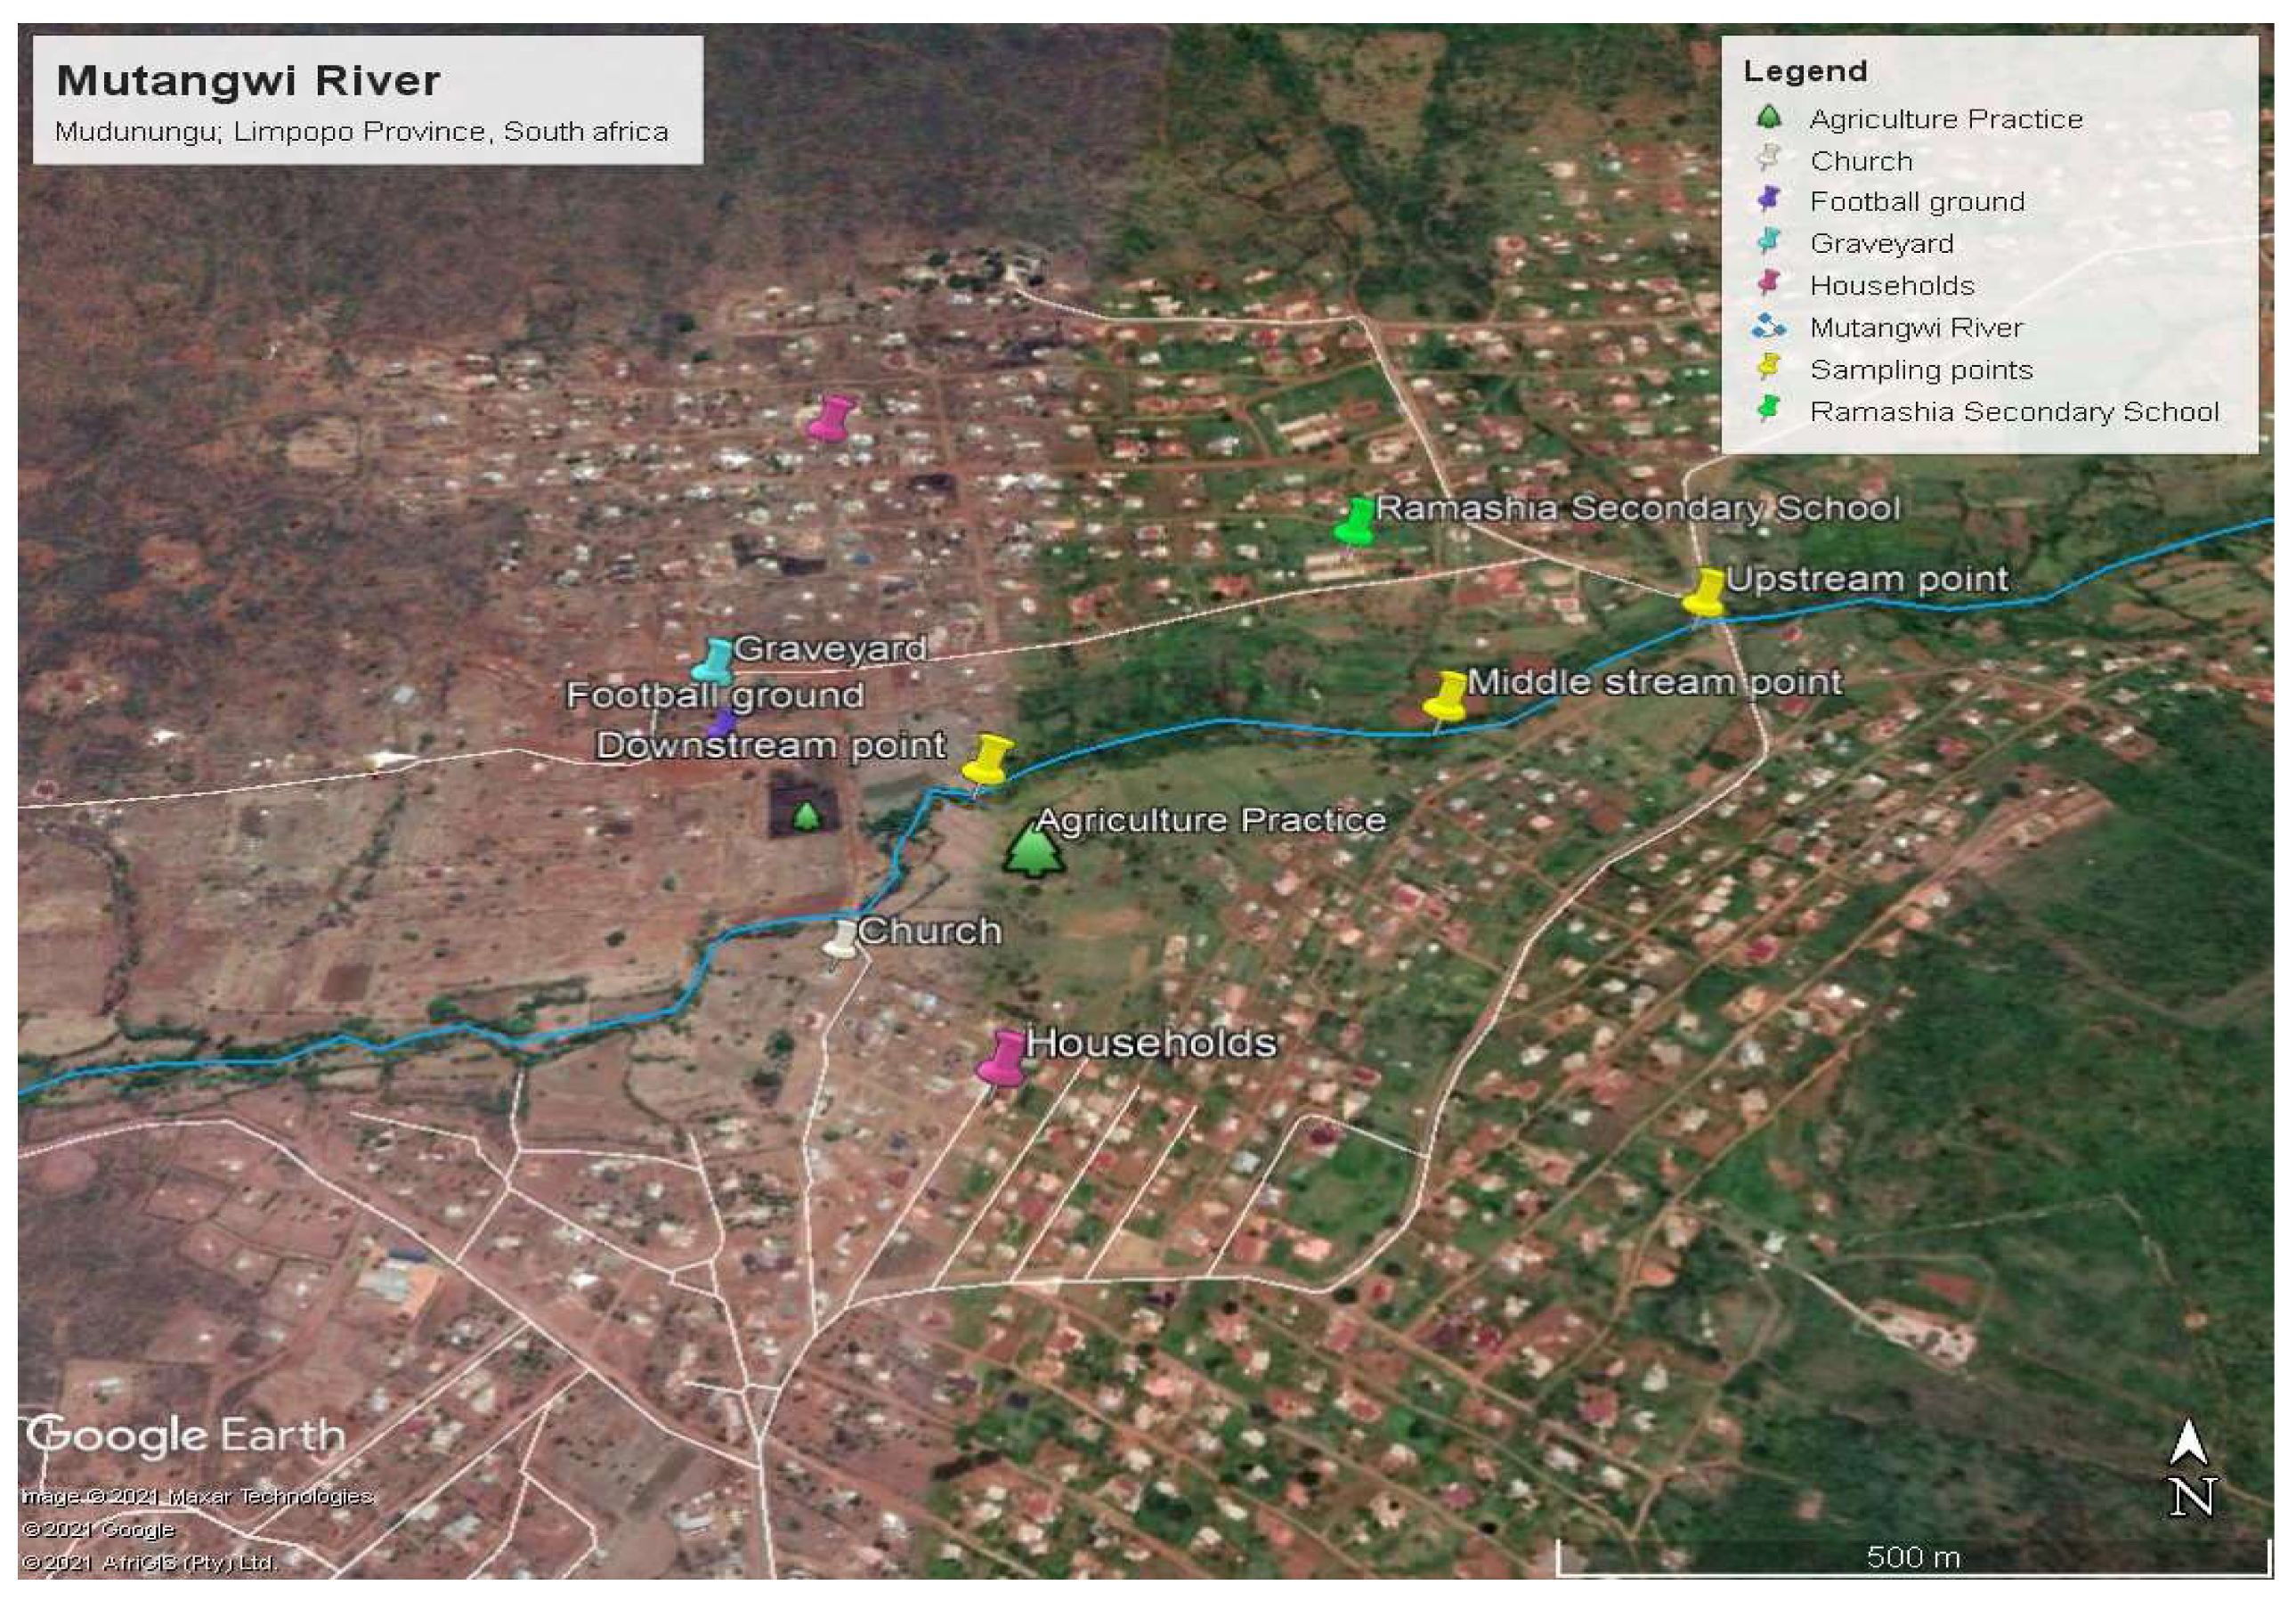
2.1. Study Area

The study area is situated at Mudunungu Village, Thulamela Municipality. It is located at a height of 1318 m above the sea level. Its geographical location is 22°52′60′′ S and 30°13′0′′ E. Mutangwi River (Figure 1) is generally used for various activities but mainly for domestic and agriculture purposes (Thulamela Municipality IDP Review, 2013–2014). It is estimated that about 80% of rainfall is received in summer (September–March) compared to the winter period (April–August). Daily temperature in the catchment ranges between 12 and 22 °C in the dry season and between 20 and 41 °C during the wet season [16].
The mean yearly precipitation ranges from 480 to 560 mm, with a mean annual runoff of about 50 million cubic meters [16].
The potential pollution sources include ablution facilities, sanitation, car wash, laundry, and dumping of refuse on open spaces and on the riverbank. Land use activities vary in the upper, middle and lower parts of Mutangwi River. The river is covered by large-scale agricultural activities, there is dominant forest in the upper stream and the lower part has cropping plantation.

2.2. Sampling

Mutangwi River was divided into three sections, which are the upstream, midstream, and downstream, for samples collection. Twenty-seven water samples were collected in triplicate using sterilized plastics bottles on a monthly basis between June and August 2018. Samples were collected for physicochemical, microbiological, and trace metals analyses. Water samples for metals were preserved with concentrated nitric acid. Collected samples were kept in an ice chest and transported to the Hydrology Laboratory of the University of Venda for further examination. Microbial analysis was performed within 6 h of sample collection.

2.3. Samples Analysis

2.3.1. Physiochemical Parameters

Temperature, pH, electrical conductivity (EC), salinity, and total dissolved solids (TDS) were measured in the field using an Extech multimeter (EC 400, Extech Instruments, Nashua, NH, USA). Turbidimeter was used to measure the turbidity (TB 400, Extech Instruments, Nashua, NH, USA) of the water samples.

2.3.2. Trace Metals

Trace metals were analysed using an atomic absorption spectrophotometer (900H, Perkin Elmer, Akron, OH, USA). Calibration standards were prepared from 100 mg/L stock solution of the test metals.

2.3.3. Anions

Anion (fluoride, phosphate, sulphate, nitrate, and nitrite) concentrations were determined using Ion Chromatography (IC). The water samples were filtered with syringe filters (0.45 μm) and placed in a standard vial in an automated autosampler connected to the IC (850 professional IC, Metrohm AG, Herisau, Switzerland).

2.3.4. Microbiological Analysis

Escherichiacoli and Enterococcus levels in the samples were evaluated using Membrane Filtration (MF) technique. M-Tec Chromo select Agar (Sigma Aldrich, Johannesburg, South Africa) was prepared for E. coli enumeration while m-Enterococcus Agar (Sigma Aldrich, Johannesburg, South Africa) was used for the determination of enterococci levels. The agars were prepared according to the manufacturer’s guidelines. The samples (100 mL) were filtered through 47 mm sterile membrane filters using a vacuum pump and a manifold by adhering to the protocols of the American Public Health Association [17]. The filter paper containing the test organisms was incubated for 24 and 48 h at 37 °C and 45 °C for E. coli and enterococci, respectively. The results were reported as colony-forming units per 100 mL of sample.

2.4. Water Quality Index (WQI)

WQI is an index that reflects the composite impact of various water quality parameters for easy interpretation and use by water administrators. The WQI was computed through three steps. First, each of the 15 parameters was assigned a weight (wi) according to their relative importance in the overall quality of water for drinking purposes (Table 1). The maximum weight of 5 was assigned to a parameter because of its major importance in water quality assessment, minimum weight of 1 was assigned to those parameters deemed insignificant to the overall water quality. Other parameters were assigned weights between 1 and 5 based on their relative significance in the water quality evaluation. The mathematical formula used for the WQI computation is presented in the equations below [18,19]:
W i = w i i = 1 n w i
W i is the unit weight of pollutant variable; n is the total number of pollutant variables; w i is the weight of each parameter.
Quality   rating   scale   ( q i ) = ( C i S i ) × 100
q i is the quality rating, C i is the concentration of each chemical parameter in each water sample in mg/L, and S i is the drinking water standard for each chemical parameter in mg/L.
For computing WQI, q i and W i were used as shown in Equation (3) below [18,19].
WQI = i = 1 n W i × q i
WQI ranks water quality in the range of excellent to unsuitable for drinking with numerical values computed using Equation (3) (Table 1).

2.5. Quantitative Health Risk Assessment

Human exposure risk pathways of an individual to trace metals contamination could be through three main pathways including inhalation via nose and mouth, direct ingestion, and dermal absorption through skin exposure. Common exposure pathways to water are dermal absorption and ingestion routes. Exposure dose for determining human health risk through these two pathways has been described in the literature [21] and can be calculated using the equations below:
E x p i n g e s t i o n = C w a t e r × I R × E F × E D B W × A T
E x p d e r m a l = C w a t e r × S A × K p × E T × I R × E F × E D × C F B W × A T
where E x p i n g e s t i o n is the exposure dose through ingestion of water (mg/kg/day); E x p d e r m a l is the exposure dose through dermal absorption (mg/kg/day); C w a t e r is the average concentration of the estimated metals in water (µg/L), and K p is the dermal permeability coefficient in water (cm/h): 0.001 for Cu, Mn, Fe, and Cd, while 0.0006 for Zn, 0.002 for Cr, and 0.004 for Pb. The other constants in those equations are shown in Table 2.
Potential noncarcinogenic risks due to exposure of trace metals were determined by comparing the calculated contaminant exposures from each exposure route (ingestion and dermal) with the reference dose (RfD). The constant of R f D i n g e s t i o n of Cd, Pb, Mn, and Fe is 0.5, 1.4, 24, and 700, respectively, while R f D d e r m a l values of analysed trace elements Cd, Pb, Mn, and Fe are 0.025, 0.42, 0.96, and 140 [21]. The Hazard Quotient ( H Q ) toxicity potential of an average daily intake to reference dose for an individual via the two pathways can be determined using Equation (6) [22].
H Q i n g e s t i o n / d e r m a l = E x p i n g e s t i o n / d e r m a l R f D i n g e s t i o n / d e r m a l
where   R f D i n g e s t i o n / d e r m a l is ingestion/dermal toxicity reference dose (mg/kg/day). The R f D i n g e s t i o n / d e r m a l   values were obtained from the literature [18,21,23]. An HQ < 1 is assumed to be safe and taken as significant noncarcinogenic [24], but HQ > 1 indicates a potential health risk to those exposed to the levels of the contaminant.
To assess the overall potential noncarcinogenic effects posed by more than one metal and pathway, the sum of the computed HQs across metals was expressed as hazard index (HI) [21]. HI > 1 showed that exposure could have a potential adverse effect on human health [18].
Carcinogenic risk ( C R ) through ingestion pathway was estimated using Equation (7):
C R i n g e s t i o n = E x p i n g e s t i o n × C S F
where C R i n g e s t i o n is cancer risk through ingestion of trace metals-contaminated water, E x p i n g e s t i o n is average daily dose (mg/kg/day) of heavy metals, and C S F is cancer slope factor (mg/kg/day). The slope factor for Pb and Cd is 0.009 and 6.1, respectively.

3. Results and Discussion

3.1. Physical Parameters

The EC values ranged from 182.25 to 233.17 µS/cm (Table 3). The values recorded complied with the standard guideline of <1700 mS/m [25] and 600 mS/m [26], respectively. The average values of TDS ranged from 126.37 to 167.5 mg/L, and were numerically higher in downstream sites (Table 3) and complied with regulatory standards.
Temperature plays a crucial role in water bodies with regards to chemical responses and the metabolic rates of life forms and it is therefore a controlling factor of aquatic species distribution [27,28]. Mean temperatures recorded in the sampling sites were within the recommended guideline set by SANS and WHO (25 °C) [25,26]. The temperature is suitable for use of irrigation (6.5–8.4) and aquaculture (6.5–9), respectively. The pH of the samples was in the range of 7.03–7.15 (Table 3) and complied with the recommended guidelines for human consumption [25,26]. Sudden changes in pH can have an adverse impact on aquatic biota.
Salinity level varied between 83.89 and 133.52 mg/L (Table 3). Excessive salinity may cause eye irritation in human and chlorosis in plants [29]. Mean values of salinity recorded complied with the standard guidelines [25,26]. Turbidity levels recorded were above the permissible limit of 1 and <5 NTU prescribed by SANS and WHO, respectively, for domestic water use in all sampling points. Average turbidity level of the study ranged from 3.87 to 5.54 NTU (Table 3). However, it was within the permissible limit of aquaculture water use (25 NTU) [28]. The level of turbidity was quite low compared to others reported in the region [30]. Comparable levels have been reported by Ejoh et al. [31] at Ubongo and Egini Rivers, Udu LGA, Delta State Nigeria (2.3–5.8 NTU).

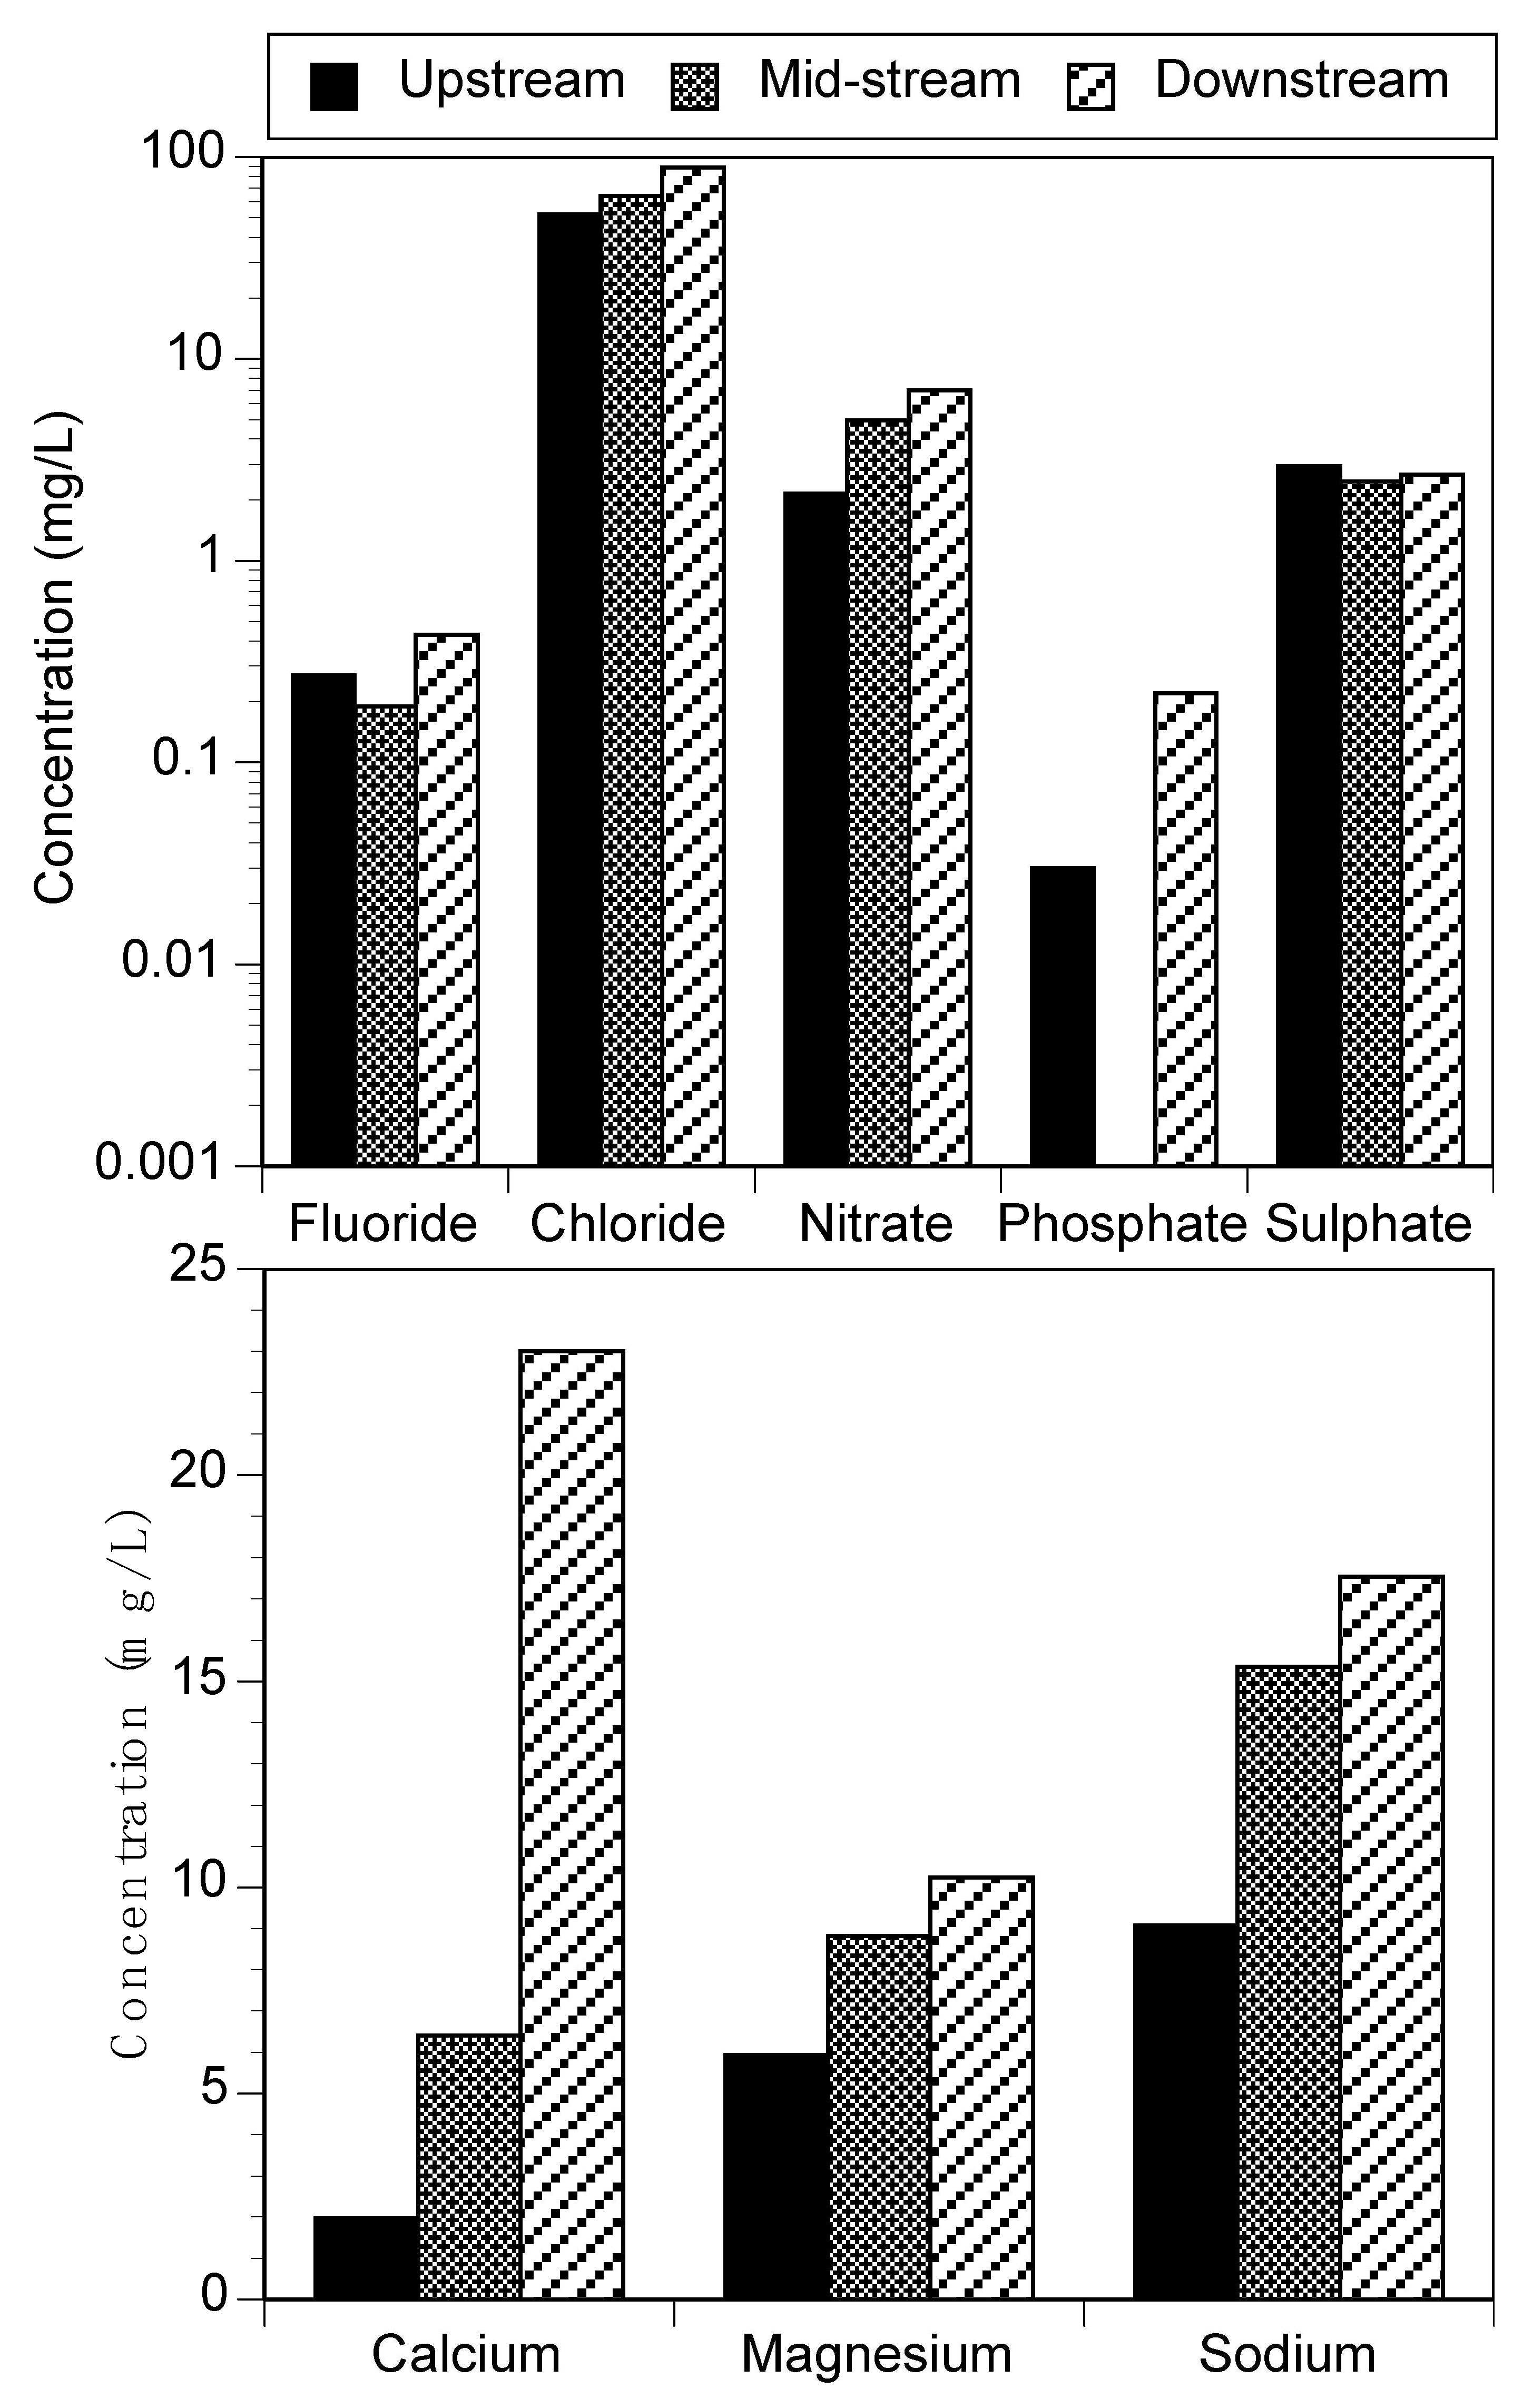
3.2. Chemical Parameters

Major Cations and Anions

Fluoride ( F ) is an essential anion in drinking water. Its occurrence in levels <0.5 mg/L has been linked with dental caries in children, while higher levels exceeding 1.5 mg/L can cause dental and skeletal fluorosis as well as non-fluorosis diseases [32,33]. Low levels of fluoride below 0.5 mg/L were determined in this study (Figure 2). The other anions (Cl, NO3, PO43−, and SO42−) were within the permissible limit for domestic and agricultural water use. The levels of nitrates and phosphates determined in this study can be linked with the practice of agriculture around the river course. Figure 2 shows that higher levels of the various anions were recorded at the downstream sampling sites than upstream, which could be due to increase in anthropogenic activities along the river course.
Concentration of phosphate recorded in all sampling points varied between 0.03 and 0.22 mg/L (Figure 2) and complied with the regulatory guidelines for domestic purposes, irrigation, and livestock water use. A study by Wei et al. [34]. observed that phosphate in water is not viewed as toxic directly to animals and people. However, its presence in high levels can initiate poisonous algal blooms and hypoxic waters with reduced biotic diversity. A study by Awomeso et al. [35] showed that the concentration of phosphates in Nairobi River ranged from 2.0 to 3.34 mg/L.
Sulphate ( SO 4 2 )   is a crucial and essential nutrient for tissue development in plants and animals. Sulphate levels recorded ranged from 2.46 to 2.94 mg/L (Figure 2). Concentrations in all sampling points were within the limit of DWAF and WHO for residential water utilization of 200 and 250 mg/L, respectively [25,28]. Nitrogen is important to human health, but a high level in other food products and drinking water could lead to major and serious health problems. The concentration of nitrate varied between 2.15 and 6.98 mg/L (Figure 2) and complied with the WHO (50 mg/L) threshold limit for domestic water use [25]. High nitrate ( NO 3 ) levels in drinking water can cause methemoglobinemia in infants [36,37].
The concentration of chloride ranged from 52.08 to 88.59 mg/L (Figure 2). Chloride ( Cl ) levels were higher compared with other anions examined in the study but complied with the guideline value for drinking water and agricultural purposes.
Calcium (Ca) is vital major cation for biochemical interactions in living organisms. The recorded levels varied between 1.96 and 23 mg/L (Figure 2) and complied with regulatory standards for domestic and agricultural water use [28]. Low levels of Sodium (Na) in the range of 9.08–17.55 mg/L (Figure 2) were determined in the study area and complied with several regulatory standards for domestic and agricultural water use. Similarly, low levels of magnesium were also determined in this study. Like the anions, higher levels were found at the downstream sites.

3.3. Trace Metals Concentration

The concentration of lead (Pb) ranged from 0.05 to 0.07 mg/L and exceeded the threshold limit of 0.01 mg/L for drinking water. The levels found are of health risk to humans and aquatic organisms. High levels of Pb above 0.01 mg/L have been linked to anaemia, memory loss, anorexia, brain damage, and death. Furthermore, this finding can be compared to studies reported by Ayandiran et al. [38] in Rupsha and Oluwa Rivers in South West Nigeria.
The levels of cadmium (Cd) determined in this study ranged between 0.01 and 0.02 mg/L and did not comply with safe levels as stipulated by WHO [25] and SANS [26] (Figure 3). The levels found could cause potential ecological risk of metals to aquatic organisms. Moreover, with respect to Cd, the water is not fit for aquaculture and irrigation of fresh vegetables. The presence of cadmium is a major concern since it can cause potential health risk to humans and aquatic organisms. The levels of cadmium recorded could be from emission through air and water from hazardous waste sites and factories. High levels of Cd have been linked to several diseases in man and aquatic organisms, including memory loss, reproductive defect, and cancer, as well as damage to the lungs, kidney, and immune system, which could eventually lead to death [39].
Iron is a metal at the dynamic site of numerous significant redox proteins in plants and animals [40]. The concentration of iron (Fe) ranged between 0.18 and 0.3 mg/L (Figure 3). The SANS guideline of 2 mg/L associated with chronic effect associated with Fe consumption via water was not exceeded in any of the sampling months. In addition, the aesthetic guideline value of 0.3 mg/L was not exceeded [25]. High levels of Fe have been associated with several anthropogenic activities such as washing of clothes and cars in rivers. Fe is known to affect the aesthetic property of water, interfering with the taste and appearance of water. The consumption of Fe-rich water has been implicated with negative effects on human health, such as hypertension, congestion of blood vessels, and increased respiration rate [41]. The levels of Mn ranged between 0.01 and 0.05 mg/L and complied with regulatory standards for drinking and irrigation of fresh vegetables. Both Fe and Mn can adversely affect the taste of water and influence the water aesthetic properties if their level exceeds the permissible limit [26].

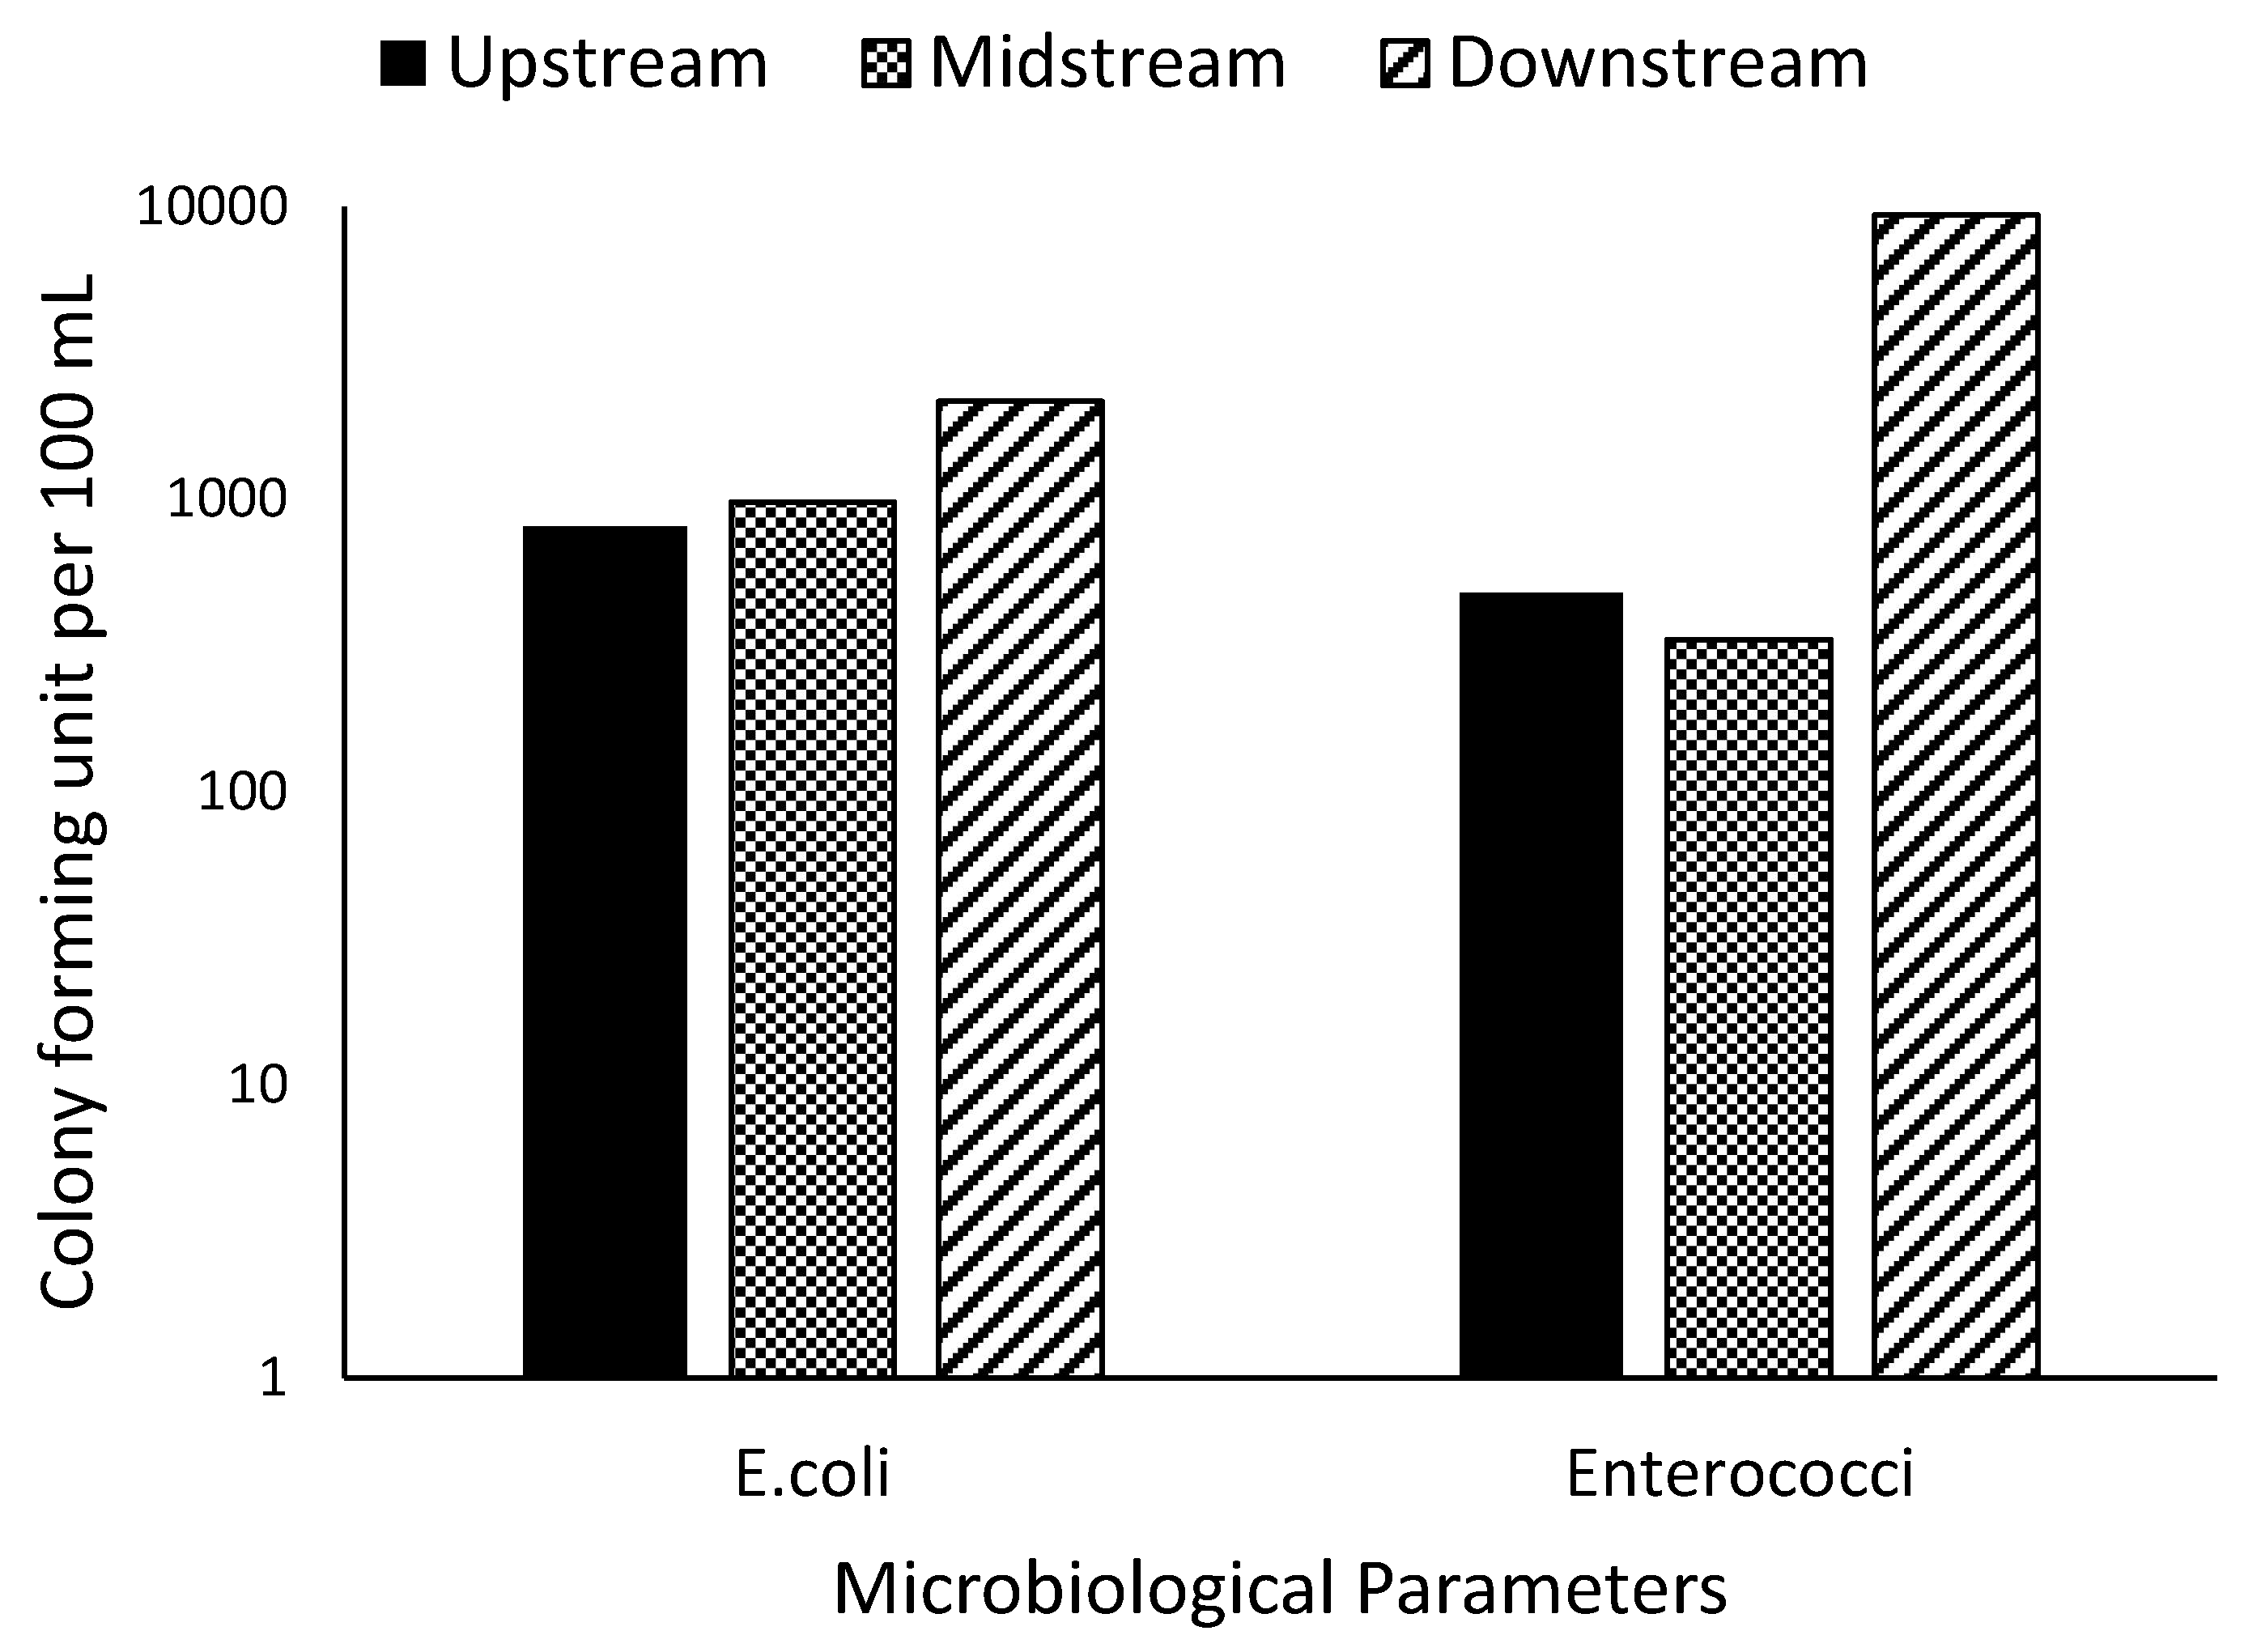
3.4. Microbiological Parameters

The values of E. coli count were in a range of 814.5–2169 cfu/100 mL, and higher values were recorded at the downstream sampling sites of the river (Figure 4). This level exceeded the regulatory standards for drinking water (0 cfu/100 mL) [25,26] and agriculture use (irrigation) (1 cfu/100 mL) [28]. Mutangwi River is contaminated with E. coli and therefore is not suitable for irrigation, recreation, and domestic purposes without proper treatment. Enterococci levels differed distinctively in each of the sampling points. Enterococci is an opportunist pathogen whose occurrence in freshwater systems has been strongly linked to sewage discharge, and they usually show resistance to antibiotics [42]. They are often considered as a good indicator for the assessment of microbiological risks to humans and aquatic life [43]. Enterococci levels recorded in the study ranged from 333 to 9396 cfu/100 mL and did not comply with regulatory standards (Figure 4).
In various river systems in South Africa, different levels of microbial contamination have been recorded, which often necessitate the need for disinfection before use. Table 4 shows the levels of E. coli and Enterococci reported in some rivers in South Africa. The potential sources of pollution have been linked to surface runoffs, discharge of sewage water, open defecation by free-ranging animals, dumping of diapers by the river bank, etc. [4,44]. The consumption of faecal-contaminated water has been implicated in various disease outbreaks, such as diarrhoea and cholera. The consumption of raw vegetables irrigated with faecal-contaminated water in local areas has led to stomach cramps, vomiting, and diarrhoea [45].

3.5. Water Quality Index

Water Quality Index (WQI) is significant rating that determines the general overall water quality status in a singular term that is useful for the determination of suitable treatment and use [8,21,57]. One of the limitations of WQI is that it does not account for microbial water quality parameters.
The WHO guideline for drinking water quality was used for the calculation of WQI. The rating of the river water was computed using the physicochemical parameters obtained. Table 5 shows how the WQI was determined.
Results from Table 5 show that the upstream of Mutangwi River has water of good quality that can be used for various purposes. However, the water quality of the midstream and downstream of the river is poor, and the overall rating of the water quality of the river is poor. Hence, the river water quality is poor both microbiologically and physicochemically and should not be used without appropriate treatment.
There was a strong correlation between nitrate and phosphate with a value of r = 0.74 (Table 6), inferring that they could be from similar sources such as sewage effluent, drainage from farmland, and fertilizers. A strong correlation exists between TDS and EC (r = 0.99), as expected, as they are both directly proportional to each other. The more solids that are dissolved in the water, the higher is the value of the electric conductivity. The sources of ions could be natural, i.e., geological condition, and from human activities such as domestic and industrial waste and also from agricultural activities. E. coli had a strong correlation with Enterococci with (r = 0.99) (Table 6). Hence, the presence of E. coli can be used to infer the presence of Enterococci. Pb showed a strong correlation to Cd (r = 0.86). Other correlation results can be seen in Table 6.

3.6. Human Health Risk Assessment

3.6.1. Noncarcinogenic risk

Summary of Hazard Quotient (HQ) values for some trace elements (Pb, Cd, Mn, and Fe) in drinking water through ingestion and dermal routes were computed for adults and children (Table 7 and Table 8). The trace metals can pose potential adverse health effects when the HQ value of a metal is higher than 1 [58]. The HQ through ingestion and dermal exposure for both children and adult groups did not exceed 1 in all sampling points as well as the hazard index (HI). Hence, we did not find evidence for noncarcinogenic risk related to trace elements (Pb, Cd, Mn, and Fe) in Mutangwi River. The occurrence of acute illness, however, is expected due to the levels of E. coli and enterococci recorded. Similar findings have been reported in previous studies [59,60,61,62].

3.6.2. Carcinogenic Risk (CR)

The cancer risk was computed based on the intake level of inorganic Pb and Cd, which may increase carcinogenic effects depending on the exposure dose and duration of exposure. Only metals that are carcinogenic in nature were used in this computation. Considering ingestion exposure pathways, estimated CRingestion values for adults were in the range of (5.15 ×   10 5   to 1.75 × 10 1 ) and were (1.31 × 10 1   to 9.33 × 10 1 ) for children. The average values of C R i n g for adults and children were 1.80 × 10 1   and 9.89 × 10 1 , respectively. Pb had the highest average contribution of CR compared to Cd. C R i n g levels of Pb exceeded the threshold for both children and adults for all selected sampling points (Table 7 and Table 8). This result clearly shows that children are more vulnerable to health risks associated with drinking water than adults. Similar studies showing the vulnerability of children to chemical contaminants in food and water have been reported [63,64]. These findings imply that the water is of a poor quality and should be treated prior to domestic water use. The use of water with Pb and Cd levels higher than the permissible limit can also be of health risk to the fishes that live in the water.

4. Conclusions

The results obtained in this study have presented baseline data on the water quality of Mutangwi River. All the physicochemical parameters, except for turbidity, complied with regulatory standards, as did the levels of the anions. All the major cations also fell within the standard limit. Pb and Cd were present in elevated levels above the threshold limit of SANS and WHO. Similarly, the levels of faecal coliform bacteria recorded did not comply with regulatory standards. The downstream of the river was more contaminated compared to the upstream and midstream. The WQI showed that the quality of the upstream of the river can be regarded as good while the mid and downstream are poor and need treatment before use. Due to the levels of microbes in the water, the water quality of Mutangwi River can be regarded as poor, although it can be used for irrigation of tree crops. There was no potential noncarcinogenic risk (HQ < 1) associated with the consumption of the river water. However, carcinogenic risk was computed for both children and adults. Therefore, adequate treatment of water from this river is highly recommended.

Author Contributions

Conceptualization, R.T.M., J.N.E. and E.T.V.; sampling and data analysis, R.T.M., J.N.E. and O.S.D.; manuscript–original draft preparation, R.T.M., J.N.E., O.S.D. and J.O.O.; writing–review and editing, R.T.M., J.N.E., O.S.D., E.T.V. and J.O.O.; funding acquisition, J.N.E. All authors have read and agreed to the published version of the manuscript.

Funding

This research was partly supported with the National Research Foundation grant offered to J.N.E. (UID:127276).

Institutional Review Board Statement

Not applicable.

Informed Consent Statement

Not applicable.

Data Availability Statement

The data that support the findings of this study are available from the corresponding author, upon reasonable request.

Acknowledgments

The authors would love to extend their acknowledgements all the professionals who contributed to the collection of the data, the teamwork, commitment, and passion to make this possible.

Conflicts of Interest

The authors declare no conflict of interest.

References

  1. Edokpayi, J.N.; Makungo, R.; Mathivha, F.; Rivers, N.; Volenzo, T.; Odiyo, J.O. Influence of global climate change on water resources in South Africa: Toward an adaptive management approach. In Water Conservation and Wastewater Treatment in BRICS Nations; Singh, P., Milshina, Y., Tian, K., Gusain, D., Bassin, J., Eds.; Elsevier: Amsterdam, The Netherlands, 2020; Chapter 5; pp. 83–115. ISBN 9780128183397. [Google Scholar] [CrossRef]
  2. DWAF. Guideline for the Management of Waterborne Epidemics, with the Emphasis on Cholera, 1st ed.; Water Quality Management Series Guideline Document U1.5; Department of Water Affairs and Forestry: Pretoria, South Africa, 2002. [Google Scholar]
  3. Centre of Scientific Research. A CSIR Perspective on Water in South Africa; CSIR Report No. CSIR/NRE/PW/IR/2011/0012/A; Centre of Scientific Research: Pretoria, South Africa, 2010. [Google Scholar]
  4. Edokpayi, J.N.; Rogawski, E.T.; Kahler, D.M.; Hill, C.L.; Reynolds, C.; Nyathi, E.; Smith, J.A.; Odiyo, J.O.; Samie, A.; Bessong, P.; et al. Challenges to Sustainable Safe Drinking Water: A Case Study of Water Quality and Use across Seasons in Rural Communities in Limpopo Province, South Africa. Water 2018, 10, 159. [Google Scholar] [CrossRef] [Green Version]
  5. Tortajada, C.; Biswas, A.K. Achieving universal access to clean water and sanitation in an era of water scarcity: Strengthening contributions from academia. Curr. Opin. Environ. Sustain. 2018, 34, 21–25. [Google Scholar] [CrossRef]
  6. Zakir, H.; Sharmin, S.; Akter, A.; Rahman, S. Assessment of health risk of heavy metals and water quality indices for irrigation and drinking suitability of waters: A case study of Jamalpur Sadar area, Bangladesh. Environ. Adv. 2020, 2, 100005. [Google Scholar] [CrossRef]
  7. Janoska, O.; Gruszecka-Kosowska, A. Water quality and Human Health Risk Assessment: A case study of the Czarna Przemsza River source in Zawiercie, Poland. Hum. Ecol. Risk Assess. Int. J. 2018, 26, 757–781. [Google Scholar] [CrossRef]
  8. Olasoji, S.O.; Oyewole, N.O.; Abiola, B.; Edokpayi, J.N. Water Quality Assessment of Surface and Groundwater Sources Using a Water Quality Index Method: A Case Study of a Peri-Urban Town in Southwest, Nigeria. Environments 2019, 6, 23. [Google Scholar] [CrossRef] [Green Version]
  9. Gao, B.; Gao, L.; Gao, J.; Xu, D.; Wang, Q.; Sun, K. Simultaneous evaluations of occurrence and probabilistic human health risk associated with trace elements in typical drinking water sources from major river basins in China. Sci. Total Environ. 2019, 666, 139–146. [Google Scholar] [CrossRef]
  10. Edokpayi, J.N.; Enitan-Folami, A.M.; Adeeyo, A.O.; Durowoju, O.; Jegede, A.O.; Odiyo, J.O. Recent trends and national policies for water provision and wastewater treatment in South Africa. In Water Conservation and Wastewater Treatment in BRICS Nations; Singh, P., Milshina, Y., Tian, K., Gusain, D., Bassin, J., Eds.; Elsevier: Amsterdam, The Netherlands, 2020; Chapter 10; pp. 187–221. ISBN 9780128183397. [Google Scholar] [CrossRef]
  11. Edokpayi, J.N.; Odiyo, J.O.; Popoola, E.O.; Msagati, T.A. Evaluation of microbiological and physicochemical parameters of alternative source of drinking water: A case study of Nzhelele River. South Africa. Open Microbiol. J. 2018, 12, 18. [Google Scholar] [CrossRef] [Green Version]
  12. Edokpayi, J.N.; Odiyo, J.O.; Popoola, O.E.; Msagati, T.A. Evaluation of contaminants removal by waste stabilization ponds: A case study of Siloam WSPs in Vhembe District, South Africa. Heliyon 2021, 7, e06207. [Google Scholar] [CrossRef] [PubMed]
  13. Zhang, Q.; Xu, P.; Qian, H. Assessment of Groundwater Quality and Human Health Risk (HHR) Evaluation of Nitrate in the Central-Western Guanzhong Basin, China. Int. J. Environ. Res. Public Health 2019, 16, 4246. [Google Scholar] [CrossRef] [Green Version]
  14. Wu, J.; Lu, J.; Wen, X.; Zhang, Z.; Lin, Y. Severe Nitrate Pollution and Health Risks of Coastal Aquifer Simultaneously Influenced by Saltwater Intrusion and Intensive Anthropogenic Activities. Arch. Environ. Contam. Toxicol. 2019, 77, 79–87. [Google Scholar] [CrossRef]
  15. Strehmel, A.; Schmalz, B.; Fohrer, N. Evaluation of land use. Land management and soil conservation strategies to reduce non-point source pollution loads in the three gorges region. China. Environ. Manag. 2016, 58, 906–921. [Google Scholar] [CrossRef] [PubMed]
  16. Office of the Mayor, Vhembe District Municipality. Vhembe District Municipality Integrated Development Plan (IDP). 2018–2019; Vhembe District Municipality: Limpopo Province, South Africa, 2018.
  17. APHA (American Public Health Association). Standard Methods for the Examination of Water and Wastewater, 18th ed.; American Public Health Association: Washington, DC, USA, 1992; pp. 518–523.
  18. Li, S.; Zhang, Q. Spatial characterization of dissolved trace elements and heavy metals in the upper Han River (China) using multivariate statistical techniques. J. Hazard. Mater. 2010, 176, 579–588. [Google Scholar] [CrossRef] [PubMed]
  19. Ramyapriya, R.; Elango, L. Evaluation of geogenic and anthropogenic impacts on spatio-temporal variation in quality of surface water and groundwater along Cauvery River, India. Environ. Earth Sci. 2017, 77, 2. [Google Scholar] [CrossRef]
  20. Singh, S.; Hussian, A. Water quality index development for groundwater quality assessment of Greater Noida sub-basin, Uttar Pradesh, India. Cogent Eng. 2016, 3, 1177155. [Google Scholar] [CrossRef]
  21. USEPA (US Environmental Protection Agency). Risk Assessment Guidance for Superfund. In Human Health Evaluation Manual; USEPA: Washington, DC, USA, 1989; Volume I, EPA/540/1-89/002. [Google Scholar]
  22. Edokpayi, J.N.; Enitan, A.M.; Mutileni, N.; Odiyo, J.O. Evaluation of water quality and human risk assessment due to heavy metals in groundwater around Muledane area of Vhembe District, Limpopo Province, South Africa. Chem. Central J. 2018, 12, 2. [Google Scholar] [CrossRef] [PubMed]
  23. Iqbal, J.; Shah, M.H. Health Risk Assessment of Metals in Surface Water from Freshwater Source Lakes, Pakistan. Hum. Ecol. Risk Assess. Int. J. 2013, 19, 1530–1543. [Google Scholar] [CrossRef]
  24. USEPA. Drinking Water Standards and Health Advisories, EPA 822-R09–011; Office of Water: Washington, DC, USA, 2009.
  25. WHO. Guidelines for Drinking-Water Quality, 4th ed.; WHO: Geneva, Switzerland, 2011; p. 155. [Google Scholar]
  26. SANS. South African National Standards 241-1-2015, 2nd ed.; SABS: Pretoria, South Africa, 2015. [Google Scholar]
  27. Lushchak. V.I. Environmentally induced oxidative stress in aquatic animals. Aquat. Toxicol. 2011, 101, 13–30. [Google Scholar] [CrossRef]
  28. Department of Water Affairs and Forestry (DWAF). South African Water Quality Guidelines. Volume 7: Aquatic Ecosystems; Department of Water and Sanitation: Pretoria, South Africa, 1996.
  29. Pawari, M.J.; Gawande, S. Assessment of underground water quality around Hadapsar region in Pune, Maharashtra. Int. Res. J. Eng. Technol. 2015, 2, 943–950. [Google Scholar]
  30. Edokpayi, J.N.; Odiyo, J.O.; Popoola, E.O.; Msagati, T. Evaluation of temporary seasonal variation of heavy metals and their potential ecological risk in Nzhelele River, South Africa. Open Chem. 2017, 15, 272–282. [Google Scholar] [CrossRef]
  31. Ejoh, A.; Unuakpa, B.; Ibadin, F.; Edeki, S. Dataset on the assessment of water quality and water quality index of Ubogo and Egini rivers, Udu LGA, Delta State Nigeria. Data Brief. 2018, 19, 1716–1726. [Google Scholar] [CrossRef]
  32. Onipe, T.; Edokpayi, J.N.; Odiyo, J.O. A review on the potential sources and health implications of fluoride in groundwater of Sub-Saharan Africa. J. Environ. Sci. Health Part A 2020, 55, 1078–1093. [Google Scholar] [CrossRef] [PubMed]
  33. Ayele, B.A.; Yifru, Y.M.; Tekle-Haimanot, R.; Godebo, T.R. Neuro-medical complications of fluoride toxicity among populations living in fluorosis endemic region of the Ethiopian Rift Valley. Res. Sq. 2019. (preprint). [Google Scholar] [CrossRef] [Green Version]
  34. Wei, K.; Yin, H.; Peng, H.; Lu, G.; Dang, Z. Bioremediation of triphenyl phosphate in river water microcosms: Proteome alteration of Brevibacillus brevis and cytotoxicity assessments. Sci. Total Environ. 2019, 649, 563–570. [Google Scholar] [CrossRef]
  35. Awomeso, J.; Taiwo, A.; Idowu, O.; Gbadebo, A.; Oyetunde, O. Assessment of water quality of Ogun River in southwestern Nigeria. IFE J. Sci. 2019, 21, 375. [Google Scholar] [CrossRef] [Green Version]
  36. Nartey, V.K.; Hayford, E.K.; Ametsi, S.K. Assessment of the impact of solid waste dumpsites on some surface water systems in the Accra Metropolitan Area. Ghana. J. Water Resour. Prot. 2012, 4, 605. [Google Scholar] [CrossRef] [Green Version]
  37. Fox, C.; Richardson, K.; Maidment, I.D.; Savva, G.; Matthews, F.; Smithard, D.; Coulton, S.; Katona, C.; Boustani, M.A.; Brayne, C. Anticholinergic Medication Use and Cognitive Impairment in the Older Population: The Medical Research Council Cognitive Function and Ageing Study. J. Am. Geriatr. Soc. 2011, 59, 1477–1483. [Google Scholar] [CrossRef] [PubMed]
  38. Ayandiran, T.; Fawole, O.; Dahunsi, S. Water quality assessment of bitumen polluted Oluwa River, South-Western Nigeria. Water Resour. Ind. 2018, 19, 13–24. [Google Scholar] [CrossRef]
  39. WHO/UNICEF Joint Water Supply and Sanitation Monitoring Programme. In Progress on Sanitation and Drinking Water. Update and MDG Assessment; World Health Organization: Geneva, Switzerland, 2015.
  40. Edokpayi, J.N.; Odiyo, J.O.; Popoola, O.; Msagati, T. Assessment of trace metals contamination of surface water and sediment: A case study of Mvudi River. South Africa. Sustainability 2016, 8, 135. [Google Scholar] [CrossRef] [Green Version]
  41. Islam, M.S.; Mohanta, S.C.; Siddique, M.A.B.; Abdullah-Al-Mamun, M.; Hossain, N.; Bithi, U.H. Physico-chemical assessment of water quality parameters in Rupsha river of Khulna region, Bangladesh. Int. J. Eng. Sci. 2018, 7, 73–78. [Google Scholar]
  42. Al-Gheethi, A.A.; Efaq, A.N.; Bala, J.D.; Norli, I.; Abdel-Monem, M.O.; Ab Kadir, M.O. Removal of pathogenic bacteria from sewage-treated effluent and biosolids for agricultural purposes. Appl. Water Sci. 2018, 8, 74. [Google Scholar] [CrossRef] [Green Version]
  43. Liu, Y.; He, Y.; Li, M.; Wang, J.; Liu, K.; Li, X. Does Wireless Sensor Network Scale? A Measurement Study on GreenOrbs. IEEE Trans. Parallel Distrib. Syst. 2013, 24, 1983–1993. [Google Scholar] [CrossRef] [Green Version]
  44. Edokpayi, J.N.; Odiyo, J.A.; Msagati, T.A.; Potgieter, N. Preliminary monitoring of faecal indicator organisms of surface water: A case study of Mvudi River, South Africa. J. Sci. Technol. 2016, 36, 33. [Google Scholar] [CrossRef]
  45. Mailula, M.A.; Gumbo, J.R. Assessment of Microbial Quality of Surface Water Sources of Luvuvhu River Catchment, South Africa. 2017. Available online: http://hdl.handle.net/11602/1278 (accessed on 19 March 2020).
  46. Le Roux, W.J.; Schaefer, L.M.; Genthe, B. Microbial water quality in the upper Olifants River catchment; implications for health. Afr. J. Microbiol. Res. 2012, 6, 6580–6588. [Google Scholar]
  47. Sibanda, T.; Chigor, V.N.; Okoh, A.I. Seasonal and spatio-temporal distribution of faecal-indicator bacteria in Tyume River in the Eastern Cape Province, South Africa. Environ. Monit. Assess. 2013, 185, 6579–6590. [Google Scholar] [CrossRef] [PubMed]
  48. Gemmell, M.E.; Schmidt, S. Is the microbiological quality of the Msunduzi River (KwaZulu-Natal, South Africa) suitable for domestic, recreational, and agricultural purposes? Environ. Sci. Pollut. Res. 2013, 20, 6551–6562. [Google Scholar] [CrossRef]
  49. Chigor, V.N.; Sibanda, T.; Okoh, A.I. Studies on the bacteriological qualities of the Buffalo River and three source water dams along its course in the Eastern Cape Province of South Africa. Environ. Sci. Pollut. Res. 2012, 20, 4125–4136. [Google Scholar] [CrossRef] [Green Version]
  50. Teklehaimanot, G.Z.; Coetzee, M.A.A.; Momba, M.N.B. Faecal pollution loads in the wastewater effluents and receiving water bodies: A potential threat to the health of Sedibeng and Soshanguve communities, South Africa. Environ. Sci. Pollut. Res. 2014, 21, 9589–9603. [Google Scholar] [CrossRef]
  51. Britz, T.; Sigge, G.; Huisamen, N.; Kikine, T.; Ackermann, A.; Lötter, M.; Lamprecht, C.; Kidd, M. Fluctuations of indicator and index microbes as indication of pollution over three years in the Plankenburg and Eerste Rivers, Western Cape, South Africa. Water SA 2013, 39, 457–466. [Google Scholar] [CrossRef] [Green Version]
  52. Jordaan, K.; Bezuidenhout, C.C. Bacterial community composition of an urban river in the North West Province, South Africa, in relation to physico-chemical water quality. Environ. Sci. Pollut. Res. 2015, 23, 5868–5880. [Google Scholar] [CrossRef] [PubMed]
  53. Ekwanzala, M.D.; Abia, A.L.K.; Ubomba-Jaswa, E.; Keshri, J.; Momba, N.B.M. Genetic relatedness of faecal coliforms and enterococci bacteria isolated from water and sediments of the Apies River, Gauteng, South Africa. AMB Express 2017, 7, 1–10. [Google Scholar] [CrossRef] [PubMed] [Green Version]
  54. Griesel, M.; Jagals, P. Faecal indicator organisms in the Renoster Spruit system of the Modder-Riet River catchment and implications for human users of the water. Water SA 2002, 28, 227–234. [Google Scholar] [CrossRef] [Green Version]
  55. Potgieter, N.; Karambwe, S.; Mudau, L.S.; Barnard, T.; Traore, A. Human Enteric Pathogens in Eight Rivers Used as Rural Household Drinking Water Sources in the Northern Region of South Africa. Int. J. Environ. Res. Public Health 2020, 17, 2079. [Google Scholar] [CrossRef] [Green Version]
  56. Mbanga, J.; Abia, A.L.K.; Amoako, D.G.; Essack, S.Y. Longitudinal Surveillance of Antibiotic Resistance in Escherichia coli and Enterococcus spp. from a Wastewater Treatment Plant and Its Associated Waters in KwaZulu-Natal, South Africa. Microb. Drug Resist. 2021. [Google Scholar] [CrossRef]
  57. Sahu, P.; Sikdar, P.K. Hydrochemical framework of the aquifer in and around East Kolkata Wetlands, West Bengal, India. Environ. Earth Sci. 2008, 55, 823–835. [Google Scholar] [CrossRef]
  58. EPA (Environmental Protection Agency). SPECIATE 4.4 Database. Available online: https://www.epa.gov/ (accessed on 1 June 2015).
  59. Ahmad, N.; Jaafar, M.S.; Alsaffar, M.S. Study of radon concentration and toxic elements in drinking and irrigated water and its implications in Sungai Petani, Kedah, Malaysia. J. Radiat. Res. Appl. Sci. 2015, 8, 294–299. [Google Scholar] [CrossRef] [Green Version]
  60. Rajeshkumar, S.; Liu, Y.; Zhang, X.; Ravikumar, B.; Bai, G.; Li, X. Studies on seasonal pollution of heavy metals in water, sediment, fish and oyster from the Meiliang Bay of Taihu Lake in China. Chemosphere 2018, 191, 626–638. [Google Scholar] [CrossRef] [PubMed]
  61. Asare-Donkor, N.K.; Boadu, T.A.; Adimado, A.A. Evaluation of groundwater and surface water quality and human risk assessment for trace metals in human settlements around the Bosomtwe Crater Lake in Ghana. SpringerPlus 2016, 5, 1812. [Google Scholar] [CrossRef] [PubMed] [Green Version]
  62. Saha, N.; Rahman, M.S.; Ahmed, M.B.; Zhou, J.L.; Ngo, H.H.; Guo, W. Industrial metal pollution in water and probabilistic assessment of human health risk. J. Environ. Manag. 2017, 185, 70–78. [Google Scholar] [CrossRef] [PubMed]
  63. Mannzhi, M.P.; Edokpayi, J.N.; Durowoju, O.S.; Gumbo, J.; Odiyo, J.O. Assessment of selected trace metals in fish feeds, pond water and edible muscles of Oreochromis mossambicus and the evaluation of human health risk associated with its consumption in Vhembe district of Limpopo Province, South Africa. Toxicol. Rep. 2021, 8, 705–717. [Google Scholar] [CrossRef]
  64. Ikenaka, Y.; Nakayama, S.M.M.; Muzandu, K.; Choongo, K.; Teraoka, H.; Mizuno, N.; Ishizuka, M. Heavy metal contamination of soil and sediment in Zambia. Afr. J. Environ. Sci. Technol. 2010, 4, 729–739. [Google Scholar]
Figure 1. Map of the study area.
Ijerph 18 06765 g001
Figure 2. Major anions (top) and cations (bottom) in Mutangwi River.
Ijerph 18 06765 g002
Figure 3. Trace metal concentration in Mutangwi River.
Ijerph 18 06765 g003
Figure 4. E. coli and Enterococci levels in the sampling sites.
Ijerph 18 06765 g004
Table 1. Water quality rating based on WQI.
WQIQuality StatusPossible UseGrading
50Excellent water qualityDomestic purposesA
50–100Good water qualityAny purpose without treatmentB
100–200Poor water qualityIrrigation and partial body contactC
200–300Very poor water qualityIrrigation and industrial, domesticD
>300Unsuitable for drinking purposesProper treatment required before useE
Adapted and revised from [20].
Table 2. Health risk assessment of different exposure through parameter.
ParameterUnitChildAdult
Exposure Frequency (EF)Day/year365365
Body Weight (BW)kg1570
Ingestion Rate (IR) or Daily intake (DI)L/day1.82.2
Exposure Duration (ED)Years670
Skin surface Area (SA) cm 3 660018,000
Exposure Time (ET)Hours/day10.58
Conversion Factor (CF) L / cm 3 0.0010.001
Averaging Time (AT)Days365 × 6365 × 70
Particular Emission Factor (PEM) m 3 / kg 1.3 × 1091.3 × 103
Adapted from [21].
Table 3. Mean concentrations and standard deviation of the physiochemical water quality parameters.
ParametersUpstream Average and SDMidstream
Average and SD
Downstream
Average and SD
WHO [25]SANS [26]Limit of Agriculture Water Use [28]
LivestockIrrigationAquaculture
Temperature (°C)18.18 ± 2.4318.69 ± 1.4418.08 ± 2.29<25<25
pH7.03 ± 0.137.15 ± 0.47.08 ± 0.196.5–8.56.5–9.5n/a6.5–8.46.5–9.0
Salinity (mg/L)83.89 ± 25.15110.67 ± 6.69133.52 ± 45.04600–900<1500n/an/an/a
TDS (mg/L)126.37 ± 38.61166.01 ± 7.07167.5 ± 19.560–400≤12000–3000n/an/a
EC (µs/cm)182.25 ± 51.65235.83 ± 12.97233.17 ± 2.51600.01≤1700n/a0–3000n/a
Turbidity (NTU)5.54 ± 0.503.87 ± 2.543.965 ± 1.73<1<1n/an/a25
TDS, total dissolved solids; EC, electrical conductivity; SD, standard deviation; n/a, guideline value not available.
Table 4. Comparison levels of E. coli and Enterococci in Mutangwi River and other rivers in South Africa.
RiversE. coli
(cfu/100 mL)
Enterococci (cfu/100 mL)ProvincesYearReferences
Olifants River34–15991620–2760Mpumalanga2012[46]
Tyume River100–16,000 33–5100Eastern Cape 2013[47]
Msunduzi River1–391–79Limpopo 2013[48]
Buffalo River0–1900–5,300,000KwaZulu Natal2013[49]
Klip and Vaal Rivers>5>40Gauteng2014[50]
Eerste Rivers5–10017–510Western Cape2015[51]
Mooi River61–54874–870North West2016[52]
Mvudi River1650–4767 950–11,533 Limpopo2016[40]
Apies River3.93.97Gauteng 2017[53]
Luvuvhu River>300–>40019,100–25,000Limpopo2017[45]
Mooder River01–6212–104Free state2018[54]
Nzhelele River100–57,000100–80,000Limpopo2018[6]
Mutoti River29.2–57.120–2180Limpopo2020[55]
Umhlangane River246377KwaZulu Natal 2021[56]
Mutangwi River814.5–2169333–9396Limpopo2021Current study
Table 5. Physio-chemical parameters used for WQI determination.
Parameters Desirable   Limit   ( S i ) Weight   of   Each   Parameter   ( w i ) Relative   Weight   ( W i ) q i
upstream
q i
Midstream
q i  
Downstream
WQI  
Upstream
WQI
Midstream
WQI
Downstream
WQI (Mean)
pH6.5–8.540.071493.7395.3394.406.646.686.746.69
TDS (mg/L)50040.071425.2733.2033.51.832.372.342.18
EC (µs/cm)600.0140.071430.3739.3038.862.813.82.773.12
Salinity600 30.053513.9818.422.20.0750.9841.190.74
Temperature2520.035772.7274.7672.322.592.662.52.58
Fluoride (mg/L)1.040.071427.019.043.01.921.353.02.09
Chloride (mg/L)25030.053520.8325.7235.441.111.3821.898.13
Nitrate (mg/L)4550.08924.7710.9715.510.420.971.380.92
Sulphate (mg/L)20030.05351.471.231.340.150.1260.140.14
Fe (mg/L)0.330.053566.6699.9603.565.33.214.02
Ca (mg/L)7520.03572.688.510.270.090.300.360.25
Mg (mg/L)3020.035719.7729.434.130.711.041.210.99
Na (mg/L)10030.05359.0815.3217.550.480.810.930.74
Pb (mg/L)0.0150.089250060070044.653.5262.4453.52
Cd (mg/L)0.00550.089220040040017.8435.6835.6829.73
w i = 56 w i = 1.00 WQI = 84.82 WQI = 116.97 WQI = 145.78115.86
Table 6. Statistical analysis of correlation result.
ParametersTemp. (°C)pHSalinityTDSECTurb.FClNO3PO43−SO42−E. coliEnterococciFeMnPbCaMgNaCd
Temp. (°C)1
pH0.831
Salinity (mg/L)−0.110.451
TDS (mg/L)0.330.790.91
EC (µs/cm)0.40.830.860.991
Turb. (NTU)−0.41−0.84−0.86−0.99−0.991
F (mg/L)−0.85−0.410.610.220.14−0.1391
Cl (mg/L)−0.360.230.970.770.72−0.720.781
NO3 (mg/L)−0.060.490.990.920.88−0.880.580.961
PO43− (mg/L)−0.72−0.210.770.410.34−0.340.970.890.741
SO42− (mg/L)−0.73−0.98−0.59−0.88−0.910.920.25−0.39−0.630.051
E. coli (cfu/100mL)−0.530.010.890.620.55−0.550.90.970.870.97−0.181
Enterococci (cfu/100mL)−0.64−0.10.830.510.44−0.440.940.930.80.99−0.050.991
Fe (mg/L)0.990.83−0.110.30.39−0.4−0.84−0.33−0.06−0.71−0.73−0.53−0.631
Mn (mg/L)−0.64−0.95−0.68−0.93−0.950.960.14−0.5−0.71−0.060.99−0.29−0.17−0.61
Pb (mg/L)−0.150.410.990.880.84−0.830.650.980.990.79−0.560.910.85−0.2−0.71
Ca (mg/L)0.150.660.960.980.96−0.960.390.880.970.58−0.780.750.660.14−0.90.951
Mg (mg/L)0.040.580.980.950.93−0.920.490.920.990.66−0.710.820.740.03−0.80.980.991
Na (mg/L)0.120.640.970.970.95−0.950.420.890.980.6−0.760.770.680.12−0.80.960.990.991
Cd (mg/L)0.360.810.880.990.99−0.990.180.750.90.39−0.890.590.480.35−0.90.860.970.940.961
Temp., temperature; Turb., turbidity; F, fluoride; Cl, chloride; NO3, nitrate; PO43−, phosphate; SO42−, sulphate.
Table 7. Human health risk assessment indices for cancer risks from ingestion and absorption of studied metals for the adults.
ParametersSampling Points E X P i n g E X P d e r H Q i n g C R i n g
Upstream 3.14   ×   10 4 1.49   ×   10 6 6.29   ×   10 4 5.15   ×   10 5
CdMidstream 6.29   ×   10 4 2.98   ×   10 6 1.26   ×   10 3 1.03   ×   10 4
Downstream 6.29   ×   10 4 2.98   ×   10 6 1.26   ×   10 3 1.03   ×   10 4
Upstream 1.57   ×   10 4 2.98   ×   10 5 1.12   ×   10 3 1.75   ×   10 1
PbMidstream 1.89   ×   10 4 3.58   ×   10 5 1.35   ×   10 3 2.10   ×   10 1
Downstream 2.20   ×   10 4 4.18   ×   10 5 1.57   ×   10 3 2.44   ×   10 1
Upstream 1.26   ×   10 3 5.97   ×   10 6 5.24   ×   10 5 -
MnMidstream 3.14   ×   10 4 1.49   ×   10 6 1.31   ×   10 5 -
Downstream 6.29   ×   10 4 2.98   ×   10 6 2.62   ×   10 5 -
Upstream 6.29   ×   10 3 2.98   ×   10 5 8.98   ×   10 6 -
FeMidstream 9.43   ×   10 4 4.47   ×   10 5 1.35   ×   10 5 -
Downstream 5.66   ×   10 3 2.68   ×   10 5 8.08   ×   10 6 -
Upstream-- 1.81   ×   10 3 -
HIMidstream-- 2.63   ×   10 3 -
Downstream-- 2.86   ×   10 3 -
HI, hazard index; -, not applicable.
Table 8. Human health risk assessment indices for cancer risks from ingestion and absorption of studied metals for the children.
ParametersSampling Points E X P i n g E X P d e r H Q i n g C R i n g
Upstream 6.92   ×   10 3 6.92   ×   10 3 6.92   ×   10 3 6.67   ×   10 1
CdMidstream 1.00   ×   10 2 1.00   ×   10 2 1.00   ×   10 2 1.31   ×   10 1
Downstream 1.09   ×   10 2 1.09   ×   10 2 1.09   ×   10 2 9.33   ×   10 1
Upstream 6.92   ×   10 3 6.92   ×   10 3 6.92   ×   10 3 6.67   ×   10−1
PbMidstream 1.00   ×   10 2 1.00   ×   10 2 1.00   ×   10 2 1.31   ×   10 1
Downstream 1.09   ×   10 2 1.09 × 10⁻² 1.09   ×   10 2 9.33   ×   10 1
Upstream 6.92   ×   10 3 6.92   ×   10−3 6.92   ×   10 3 -
MnMidstream 1.00   ×   10 2 1.00   ×   10 2 1.00   ×   10 2 -
Downstream 1.09   ×   10 2 1.09   ×   10 2 1.09   ×   10 2 -
Upstream 6.92   ×   10 3 6.92   ×   10 3 6.92   ×   10 3 -
FeMidstream 1.00   ×   10 2 1.00   ×   10 2 1.00   ×   10 2 -
Downstream 1.09   ×   10 2 1.09   ×   10 2 1.09   ×   10 2 -
Upstream-- 6.92   ×   10 3 -
HIMidstream-- 1.00   ×   10−2-
Downstream--1.09 × 10⁻²-
HI, hazard index; -, not applicable.
Publisher’s Note: MDPI stays neutral with regard to jurisdictional claims in published maps and institutional affiliations.

