
Using Machine Learning Algorithms to Develop a Clinical Decision-Making Tool for COVID-19 Inpatients

 , , ,
, , ,  , ,
, ,
Abstract
1. Introduction
2. Materials and Methods
2.1. Study Design and Setting
2.2. Study Population
2.3. Data Collection
2.4. Independent Predictor Variables
2.5. Outcomes
2.6. Data Analysis
2.6.1. Missing Values
2.6.2. Balancing Outcomes
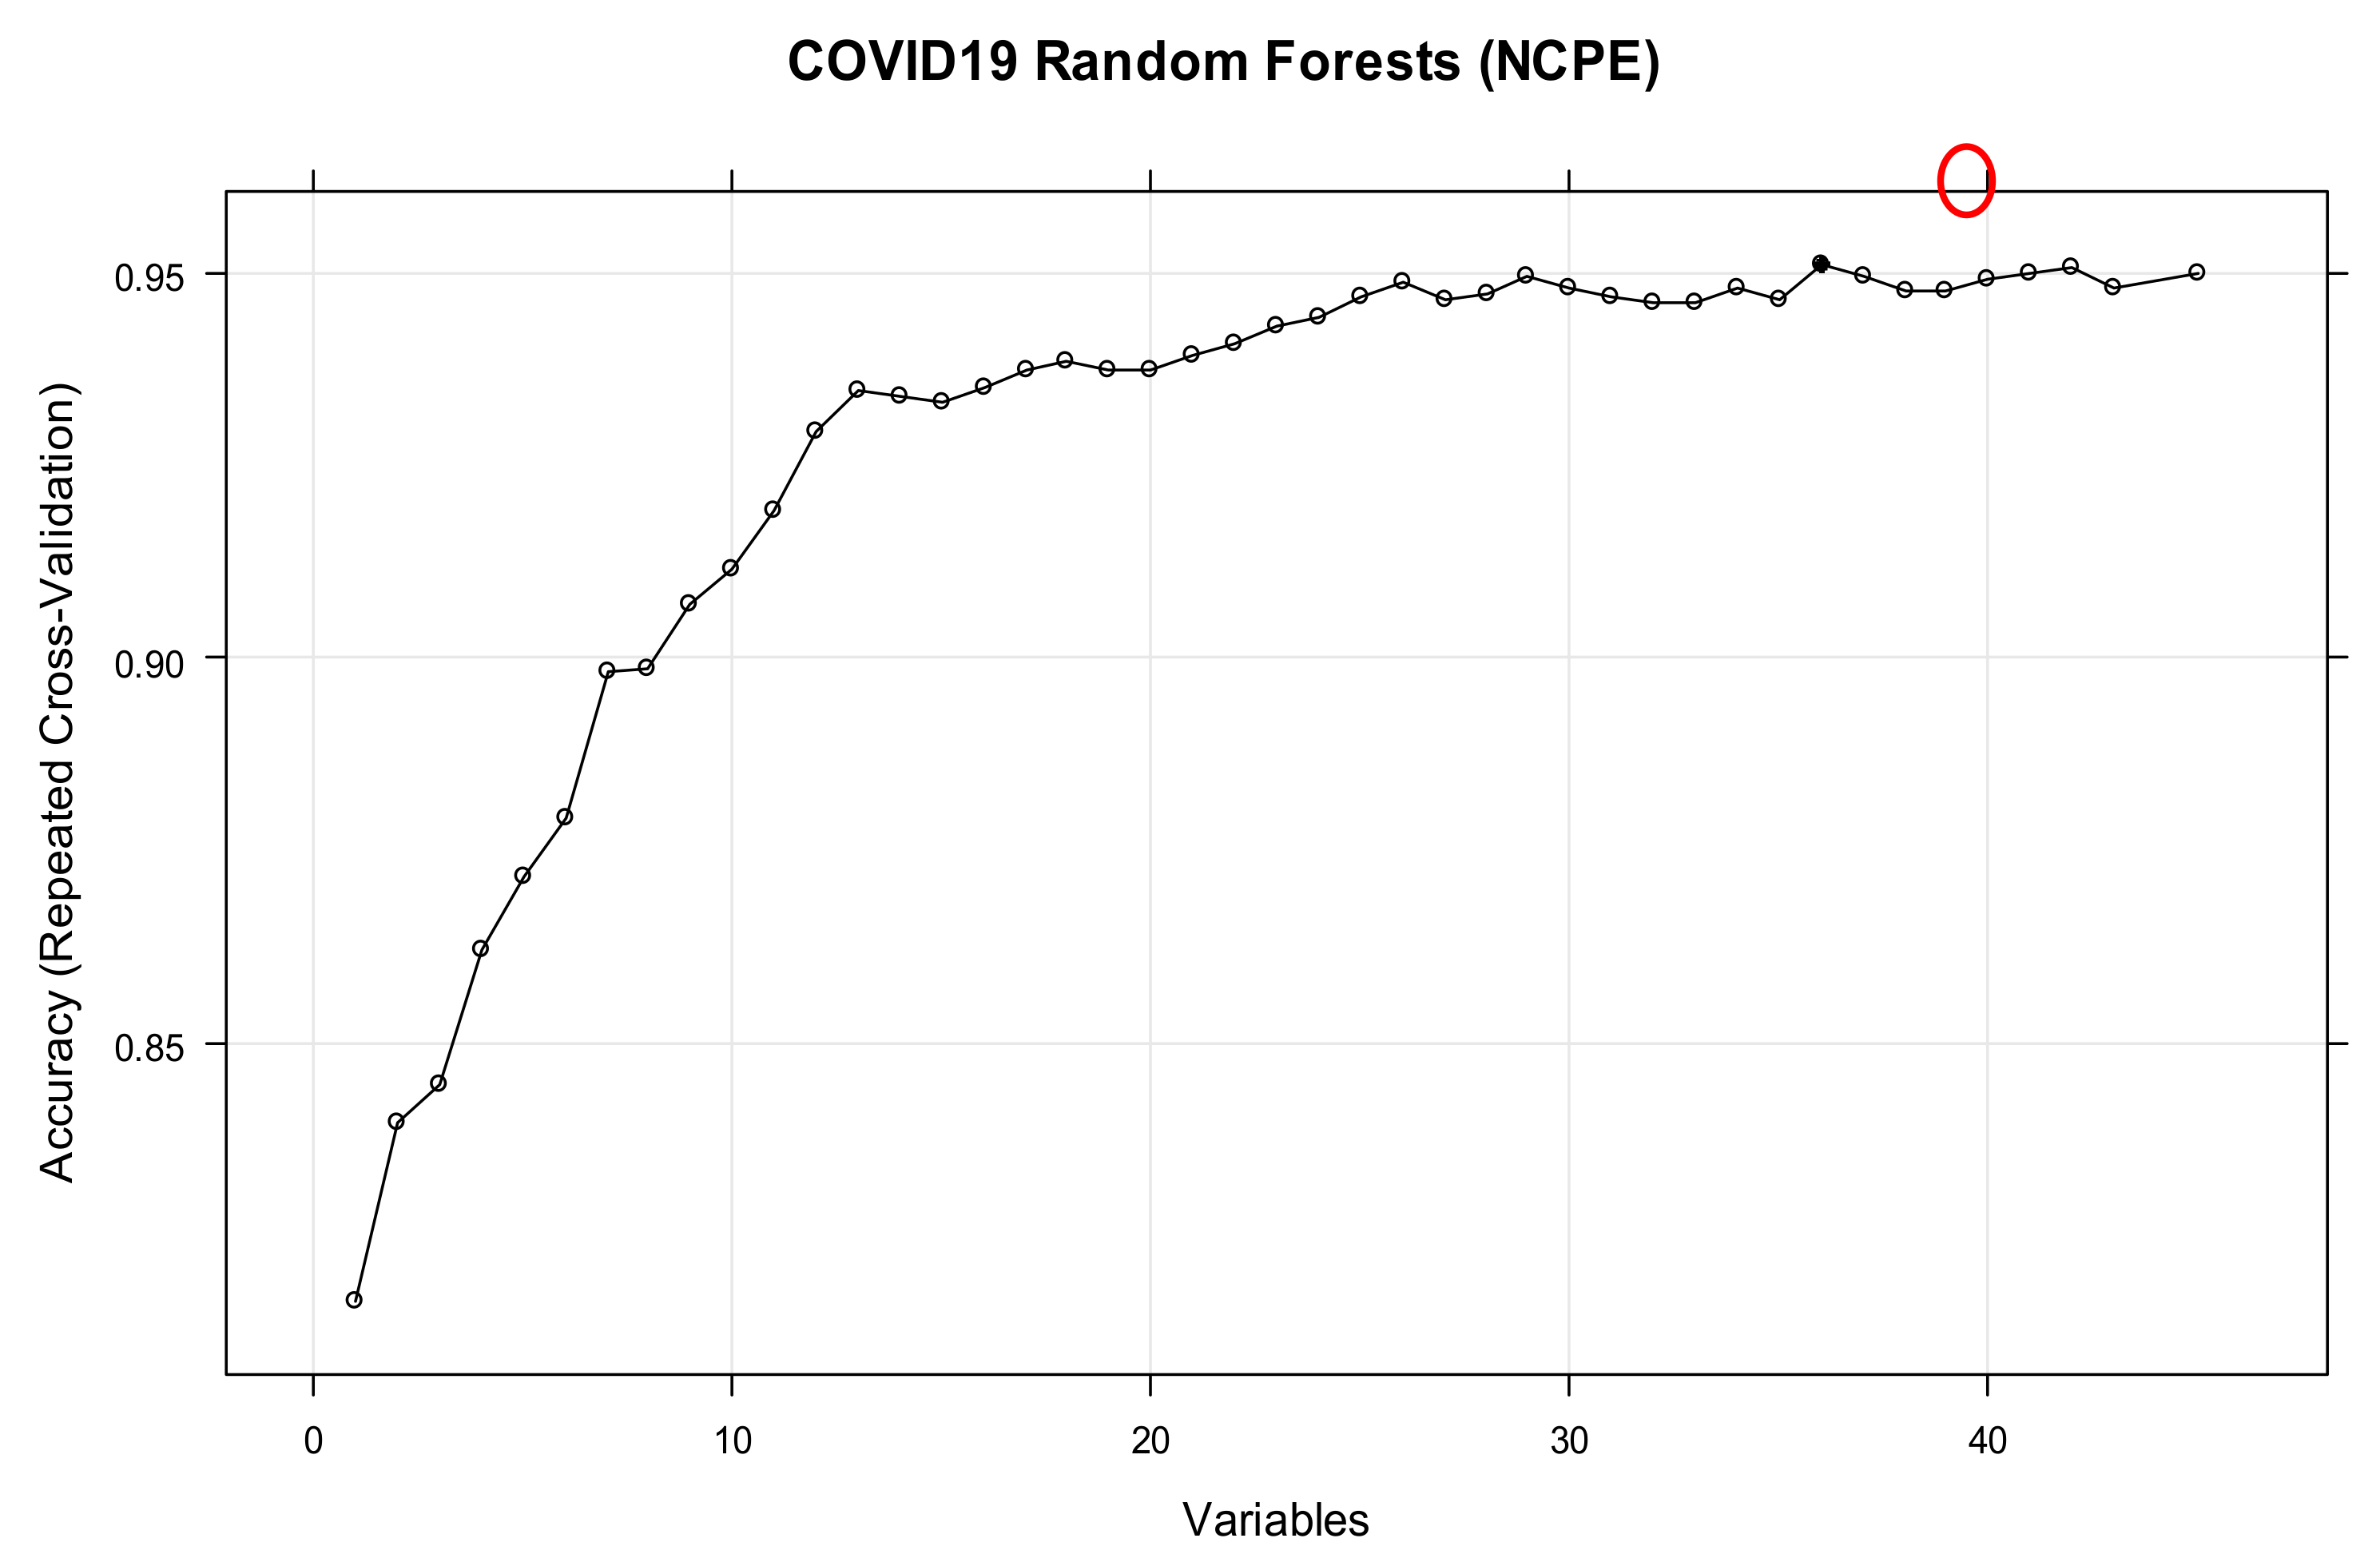
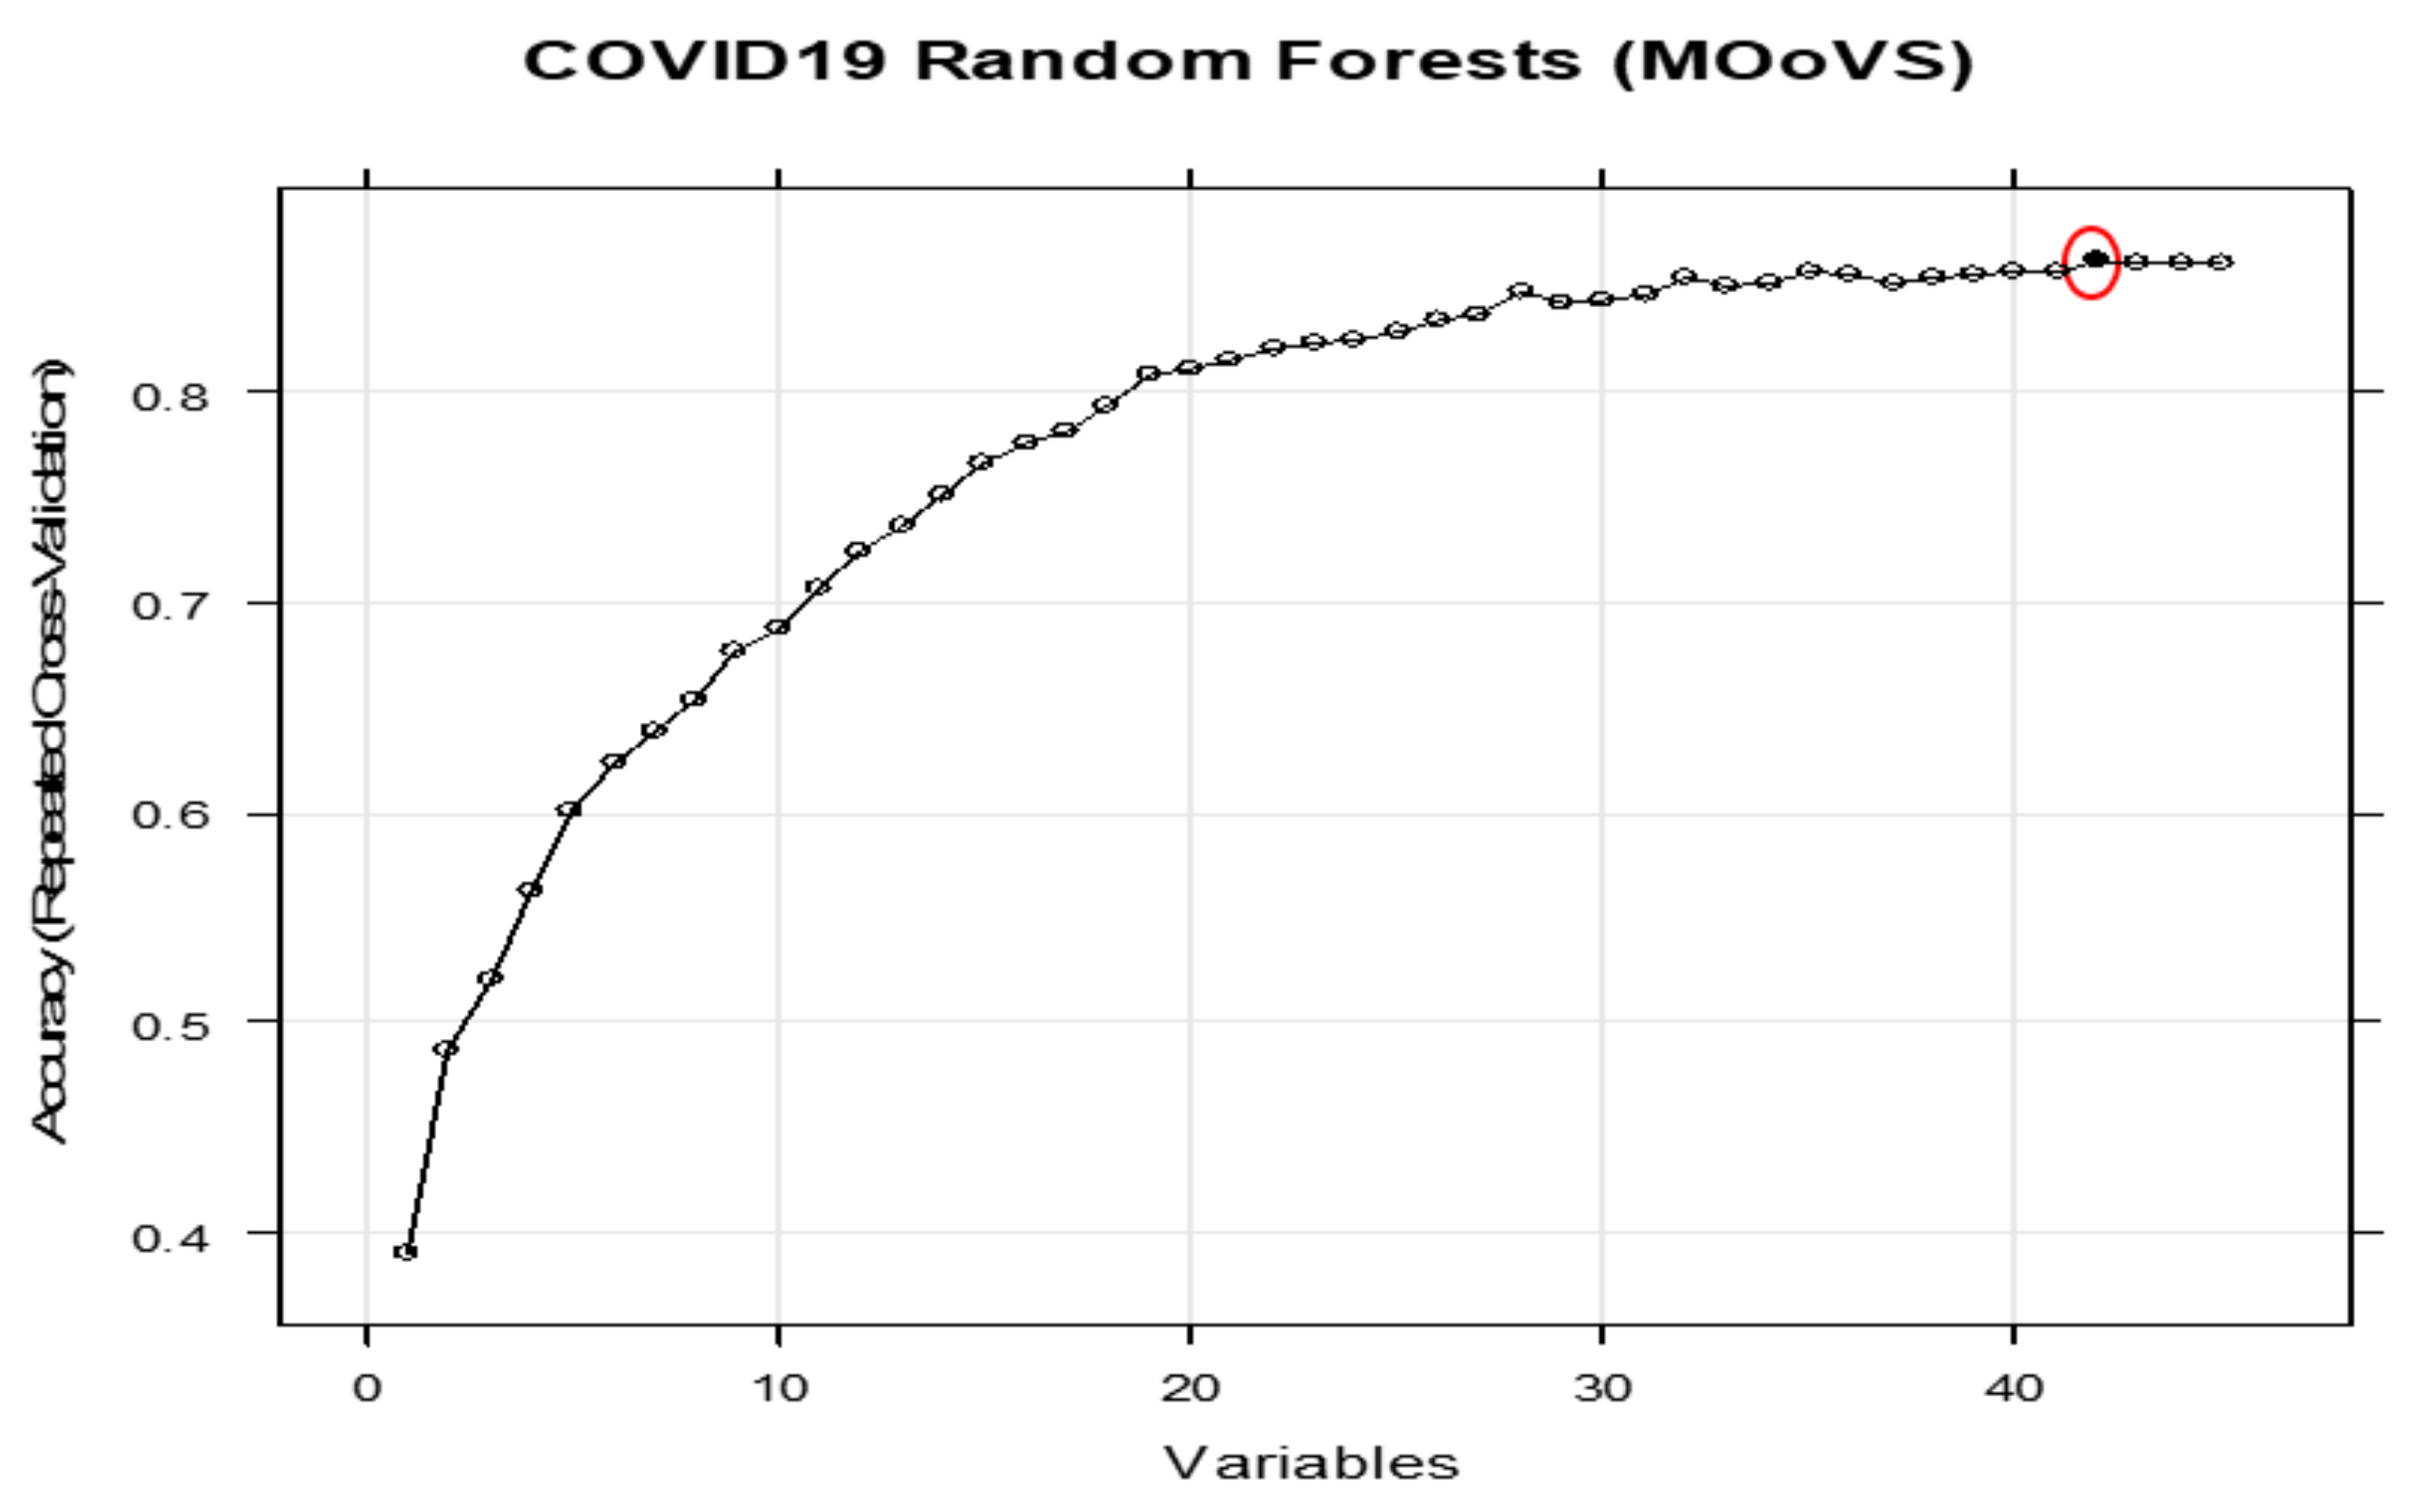
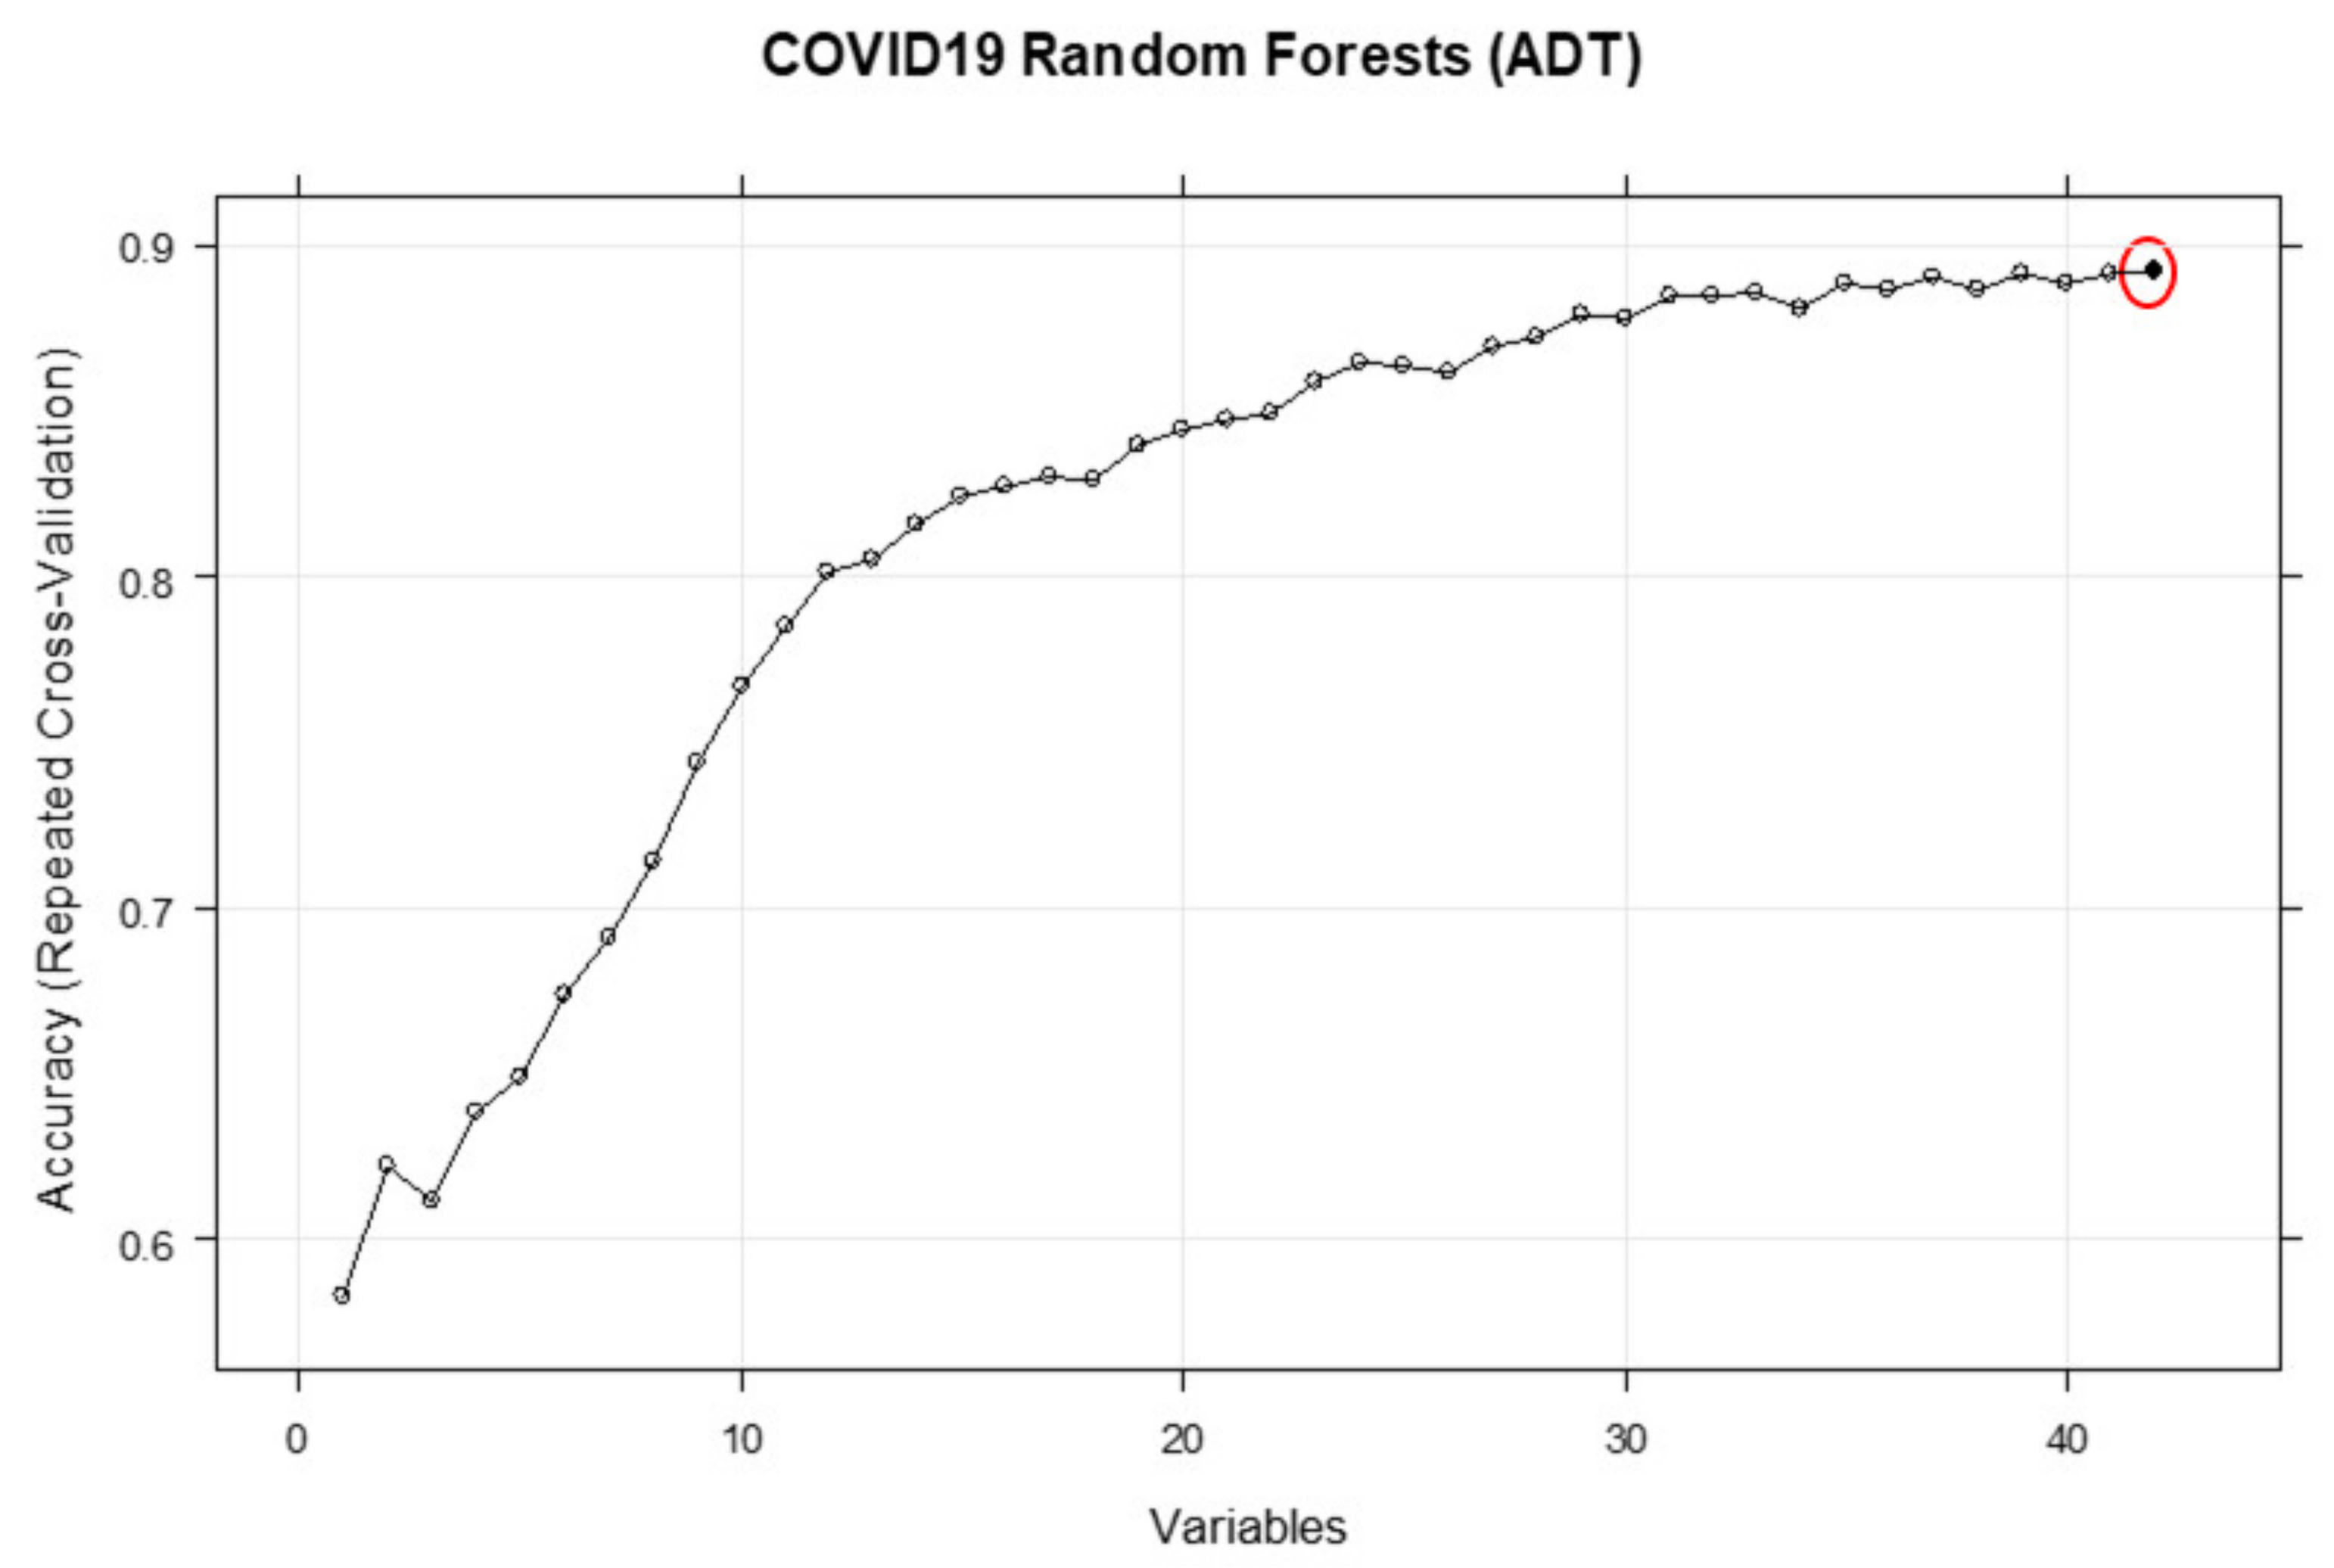
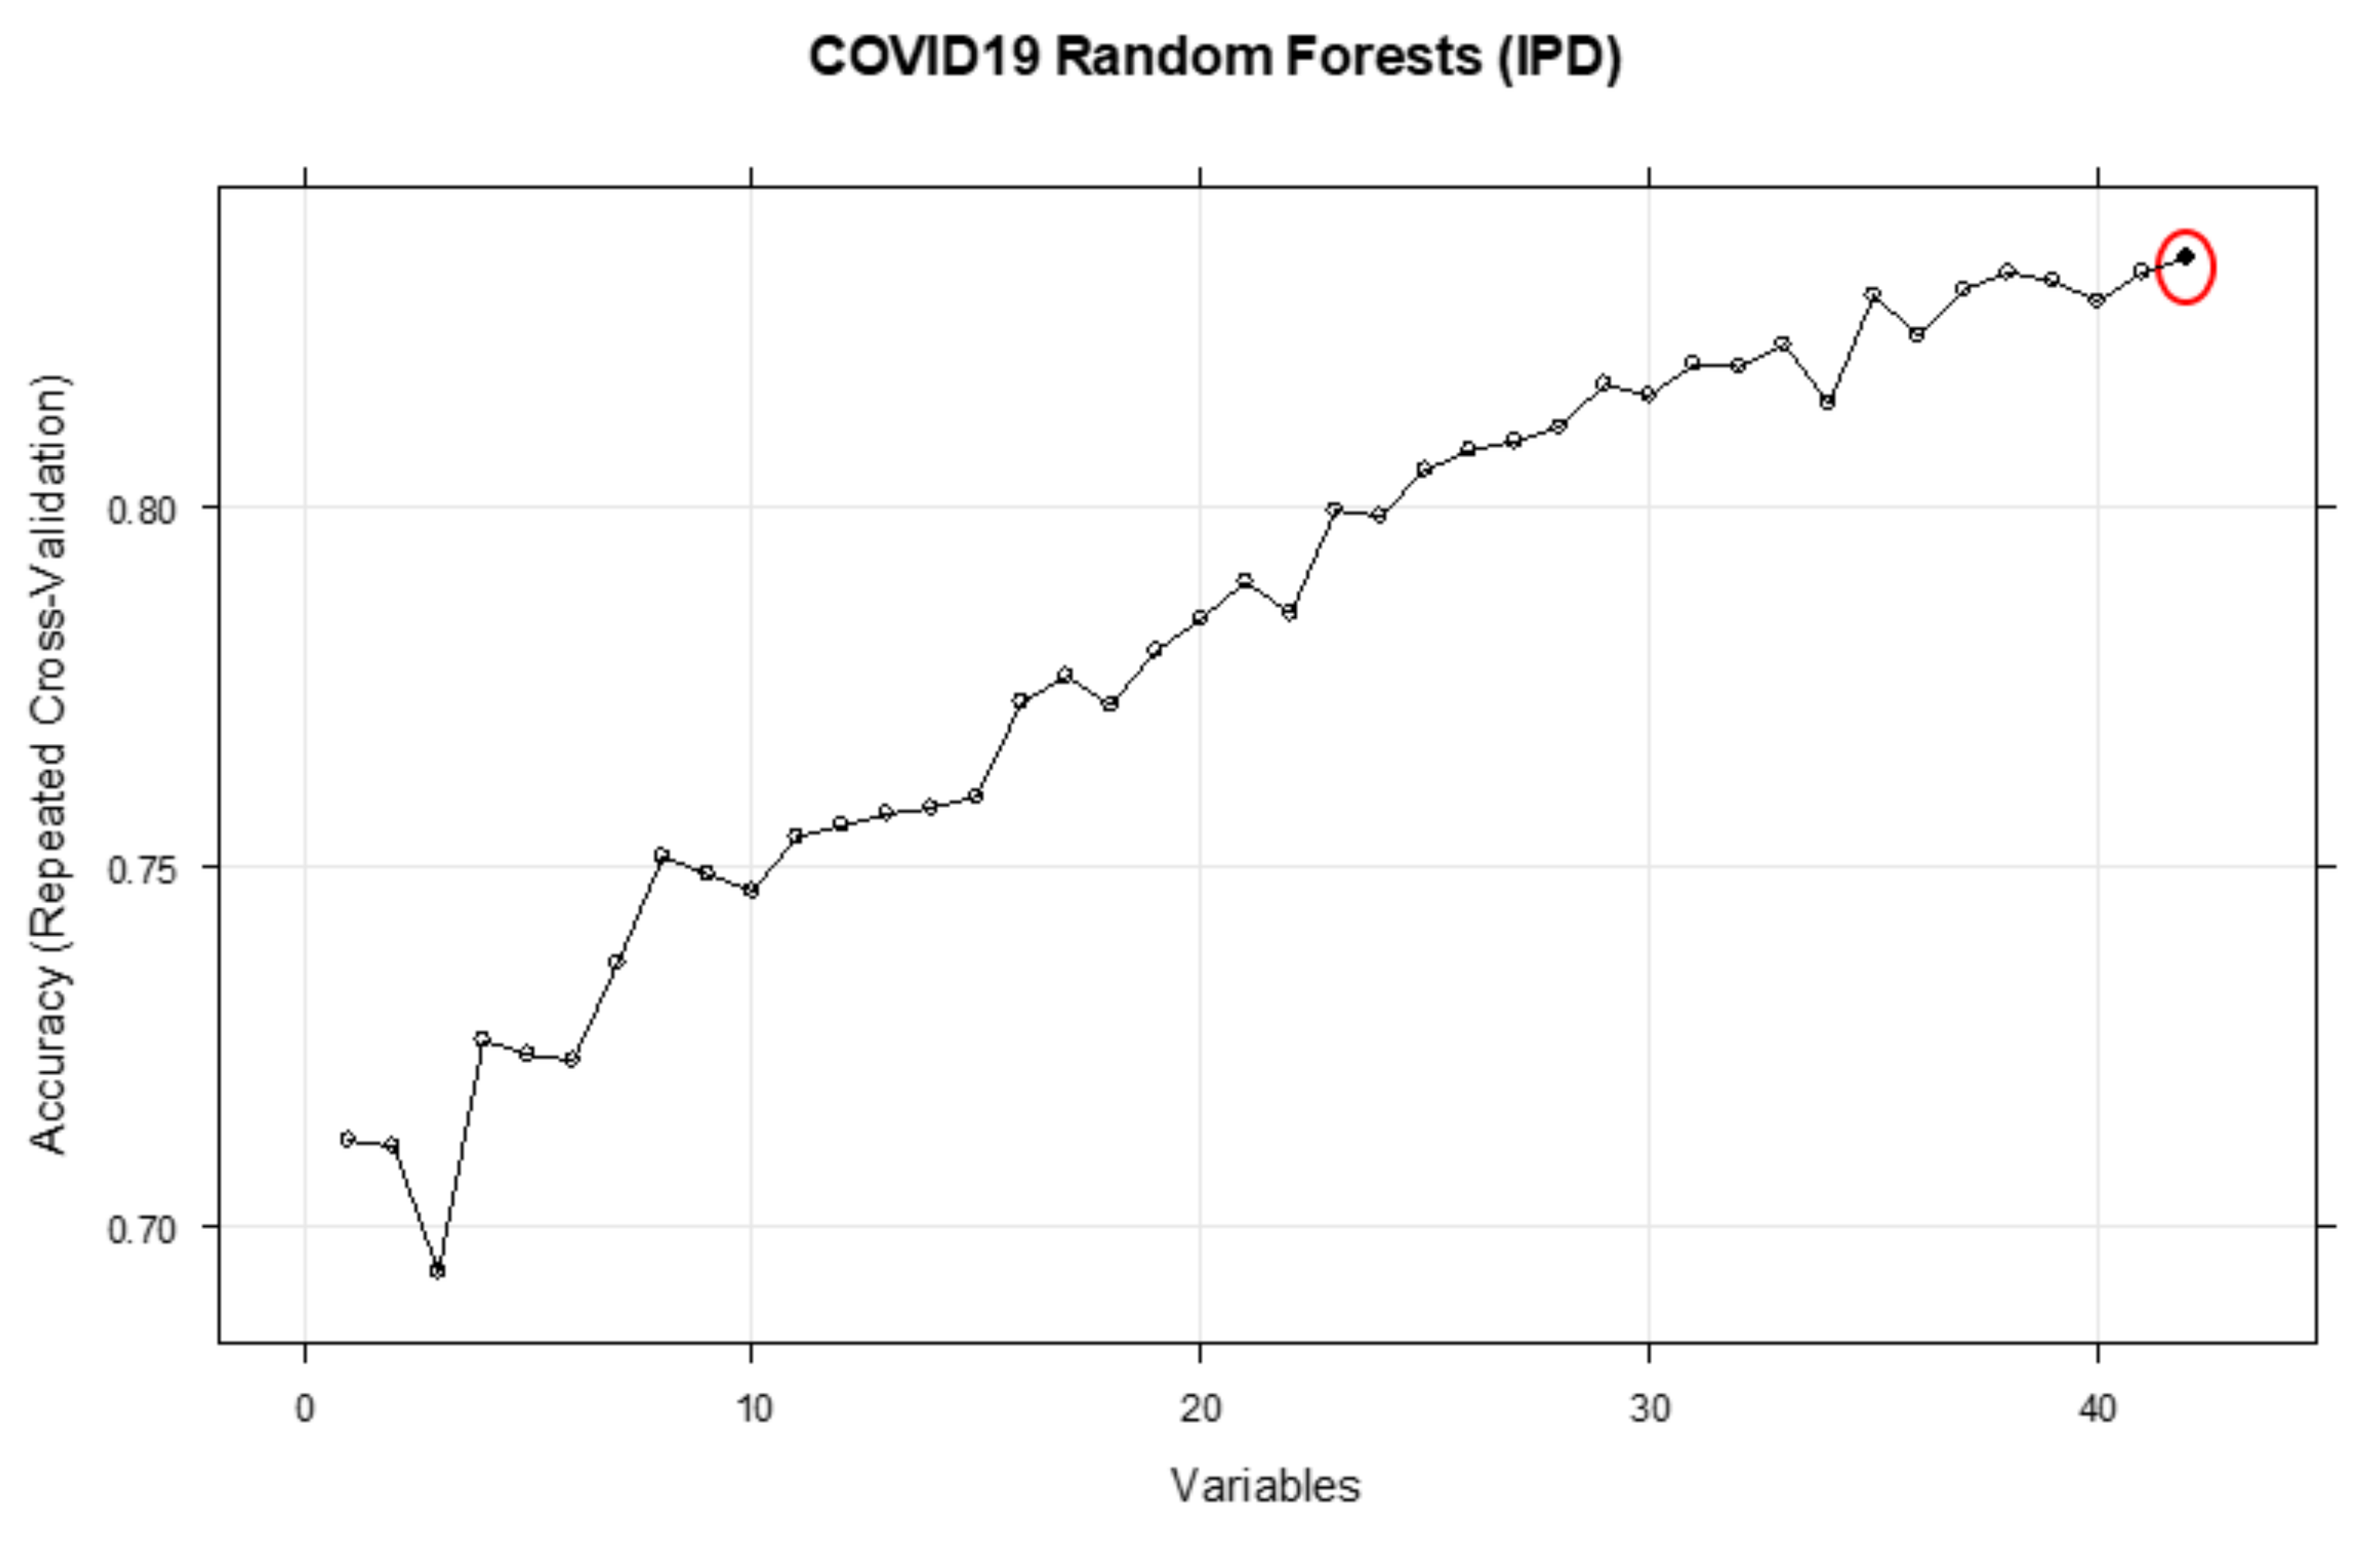
2.6.3. Feature Selection
2.7. Bayesian Network Modelling
3. Results
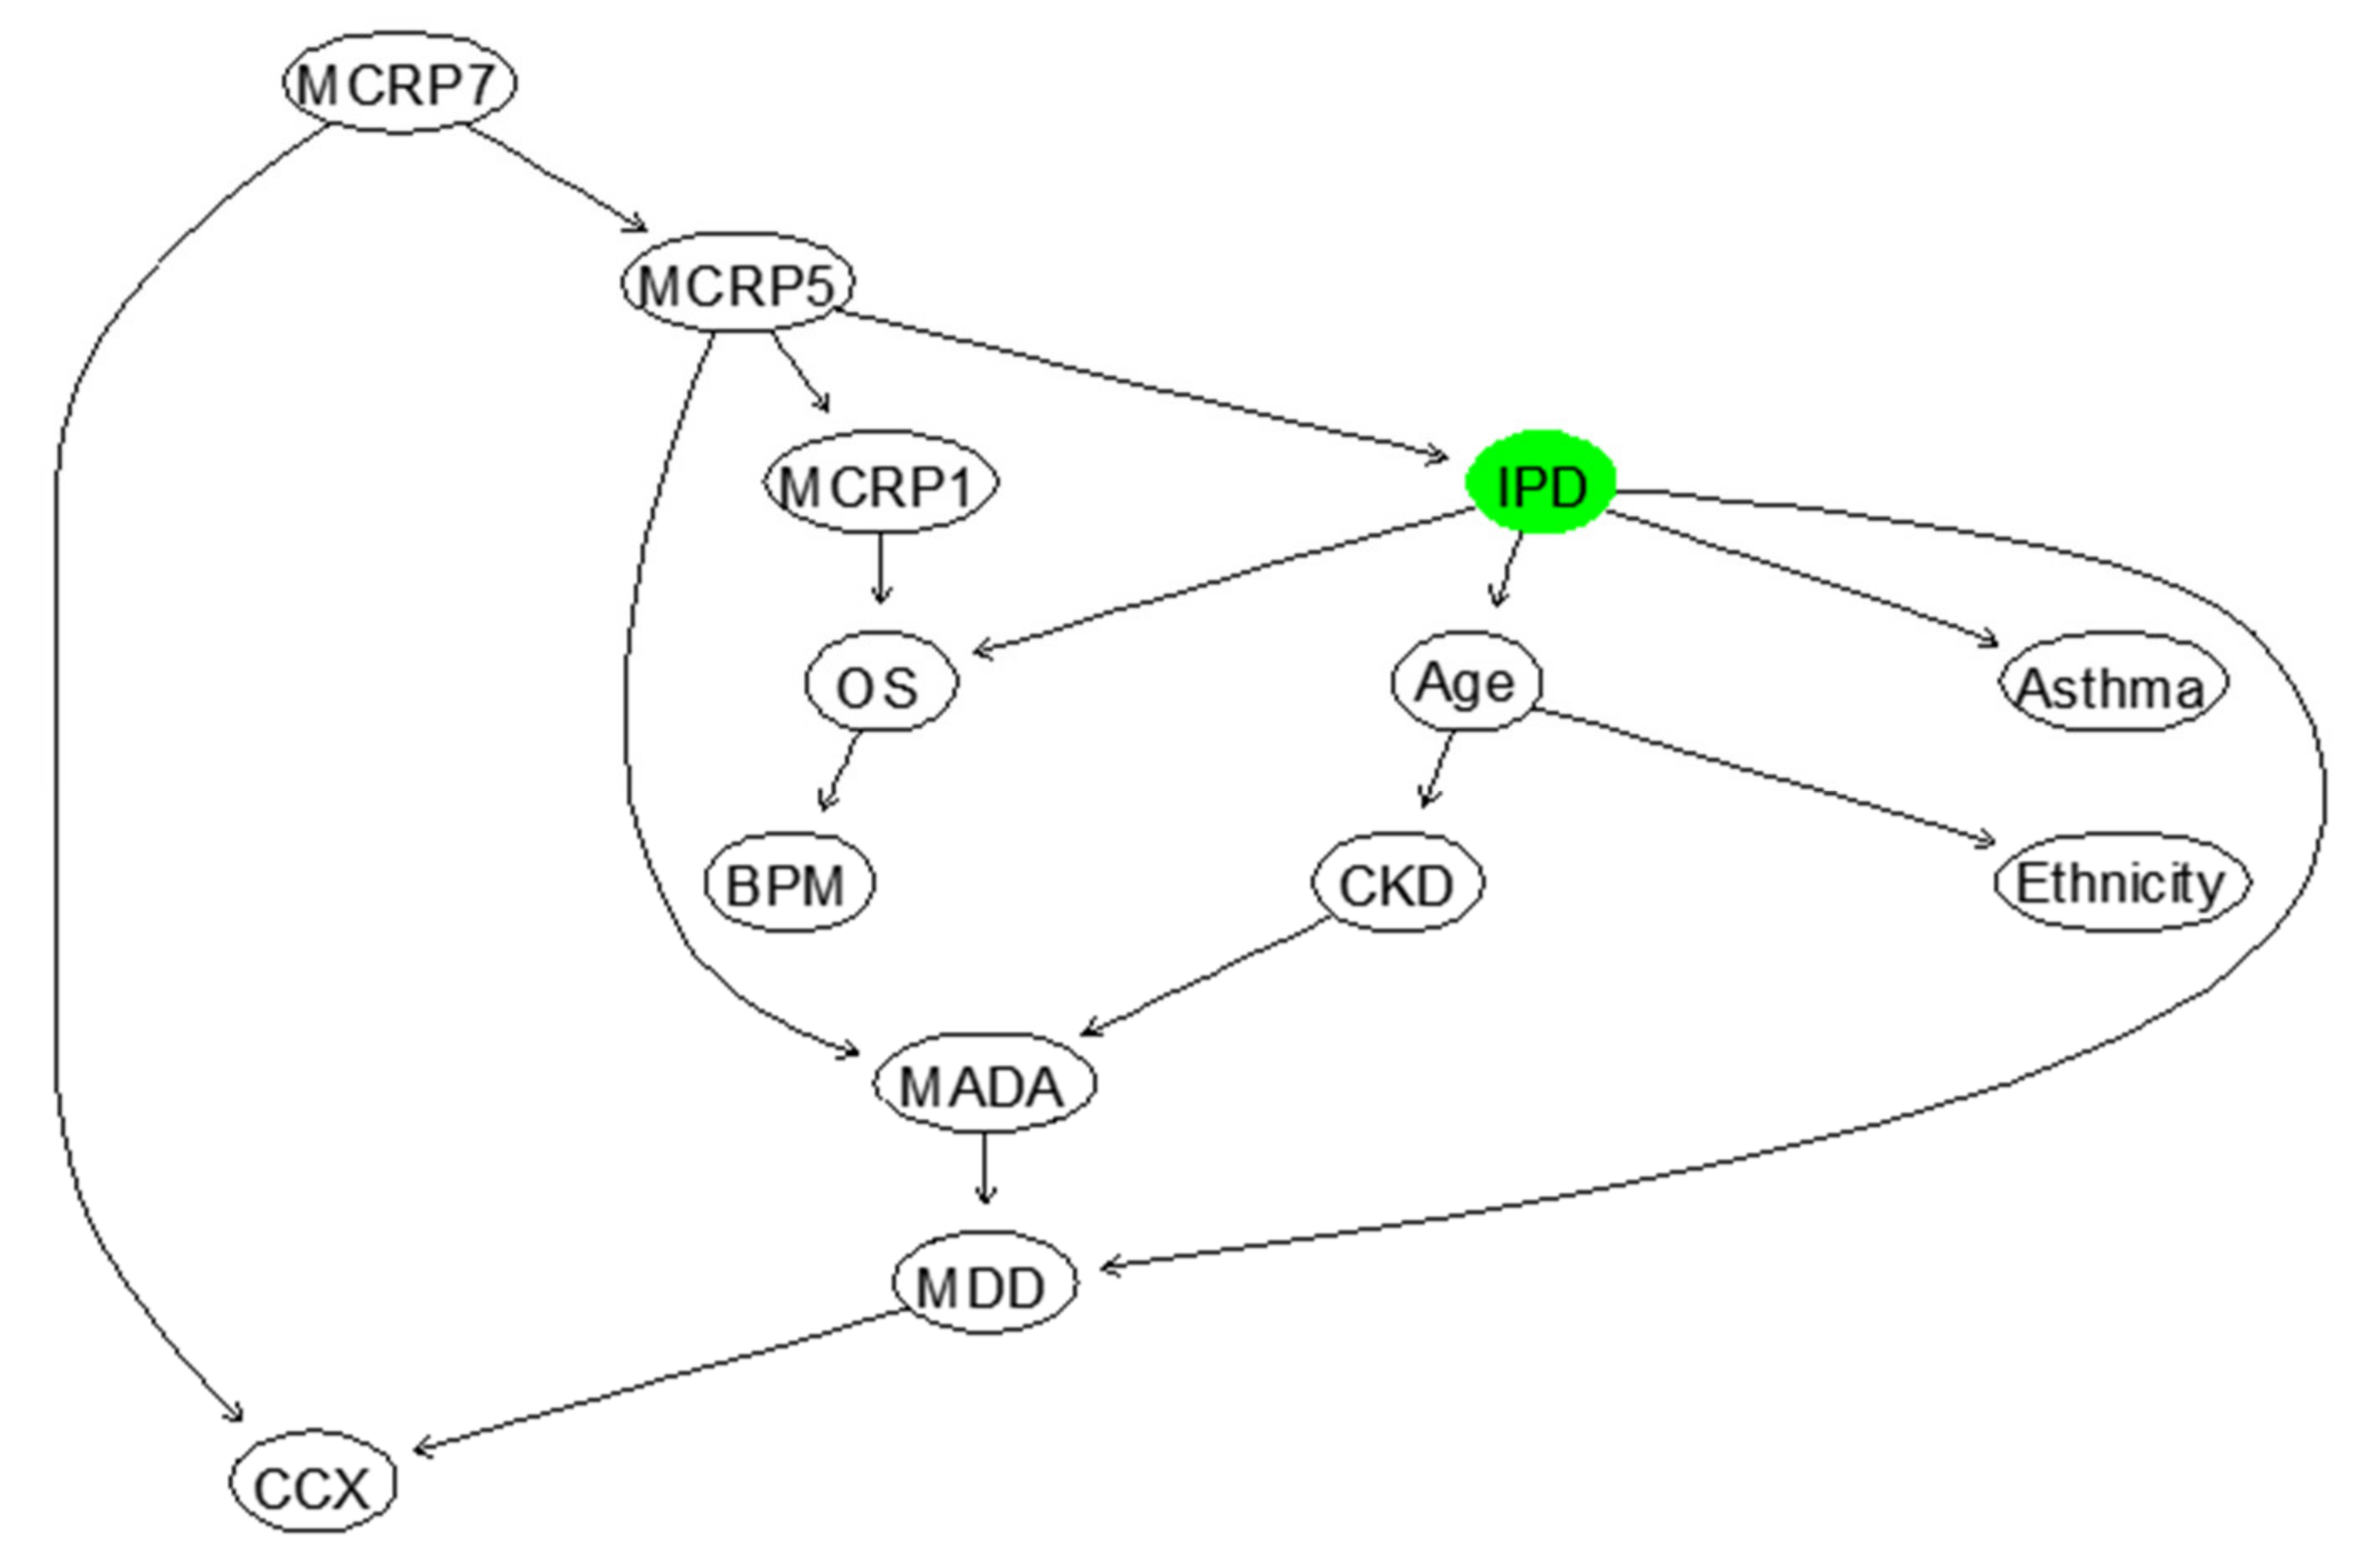
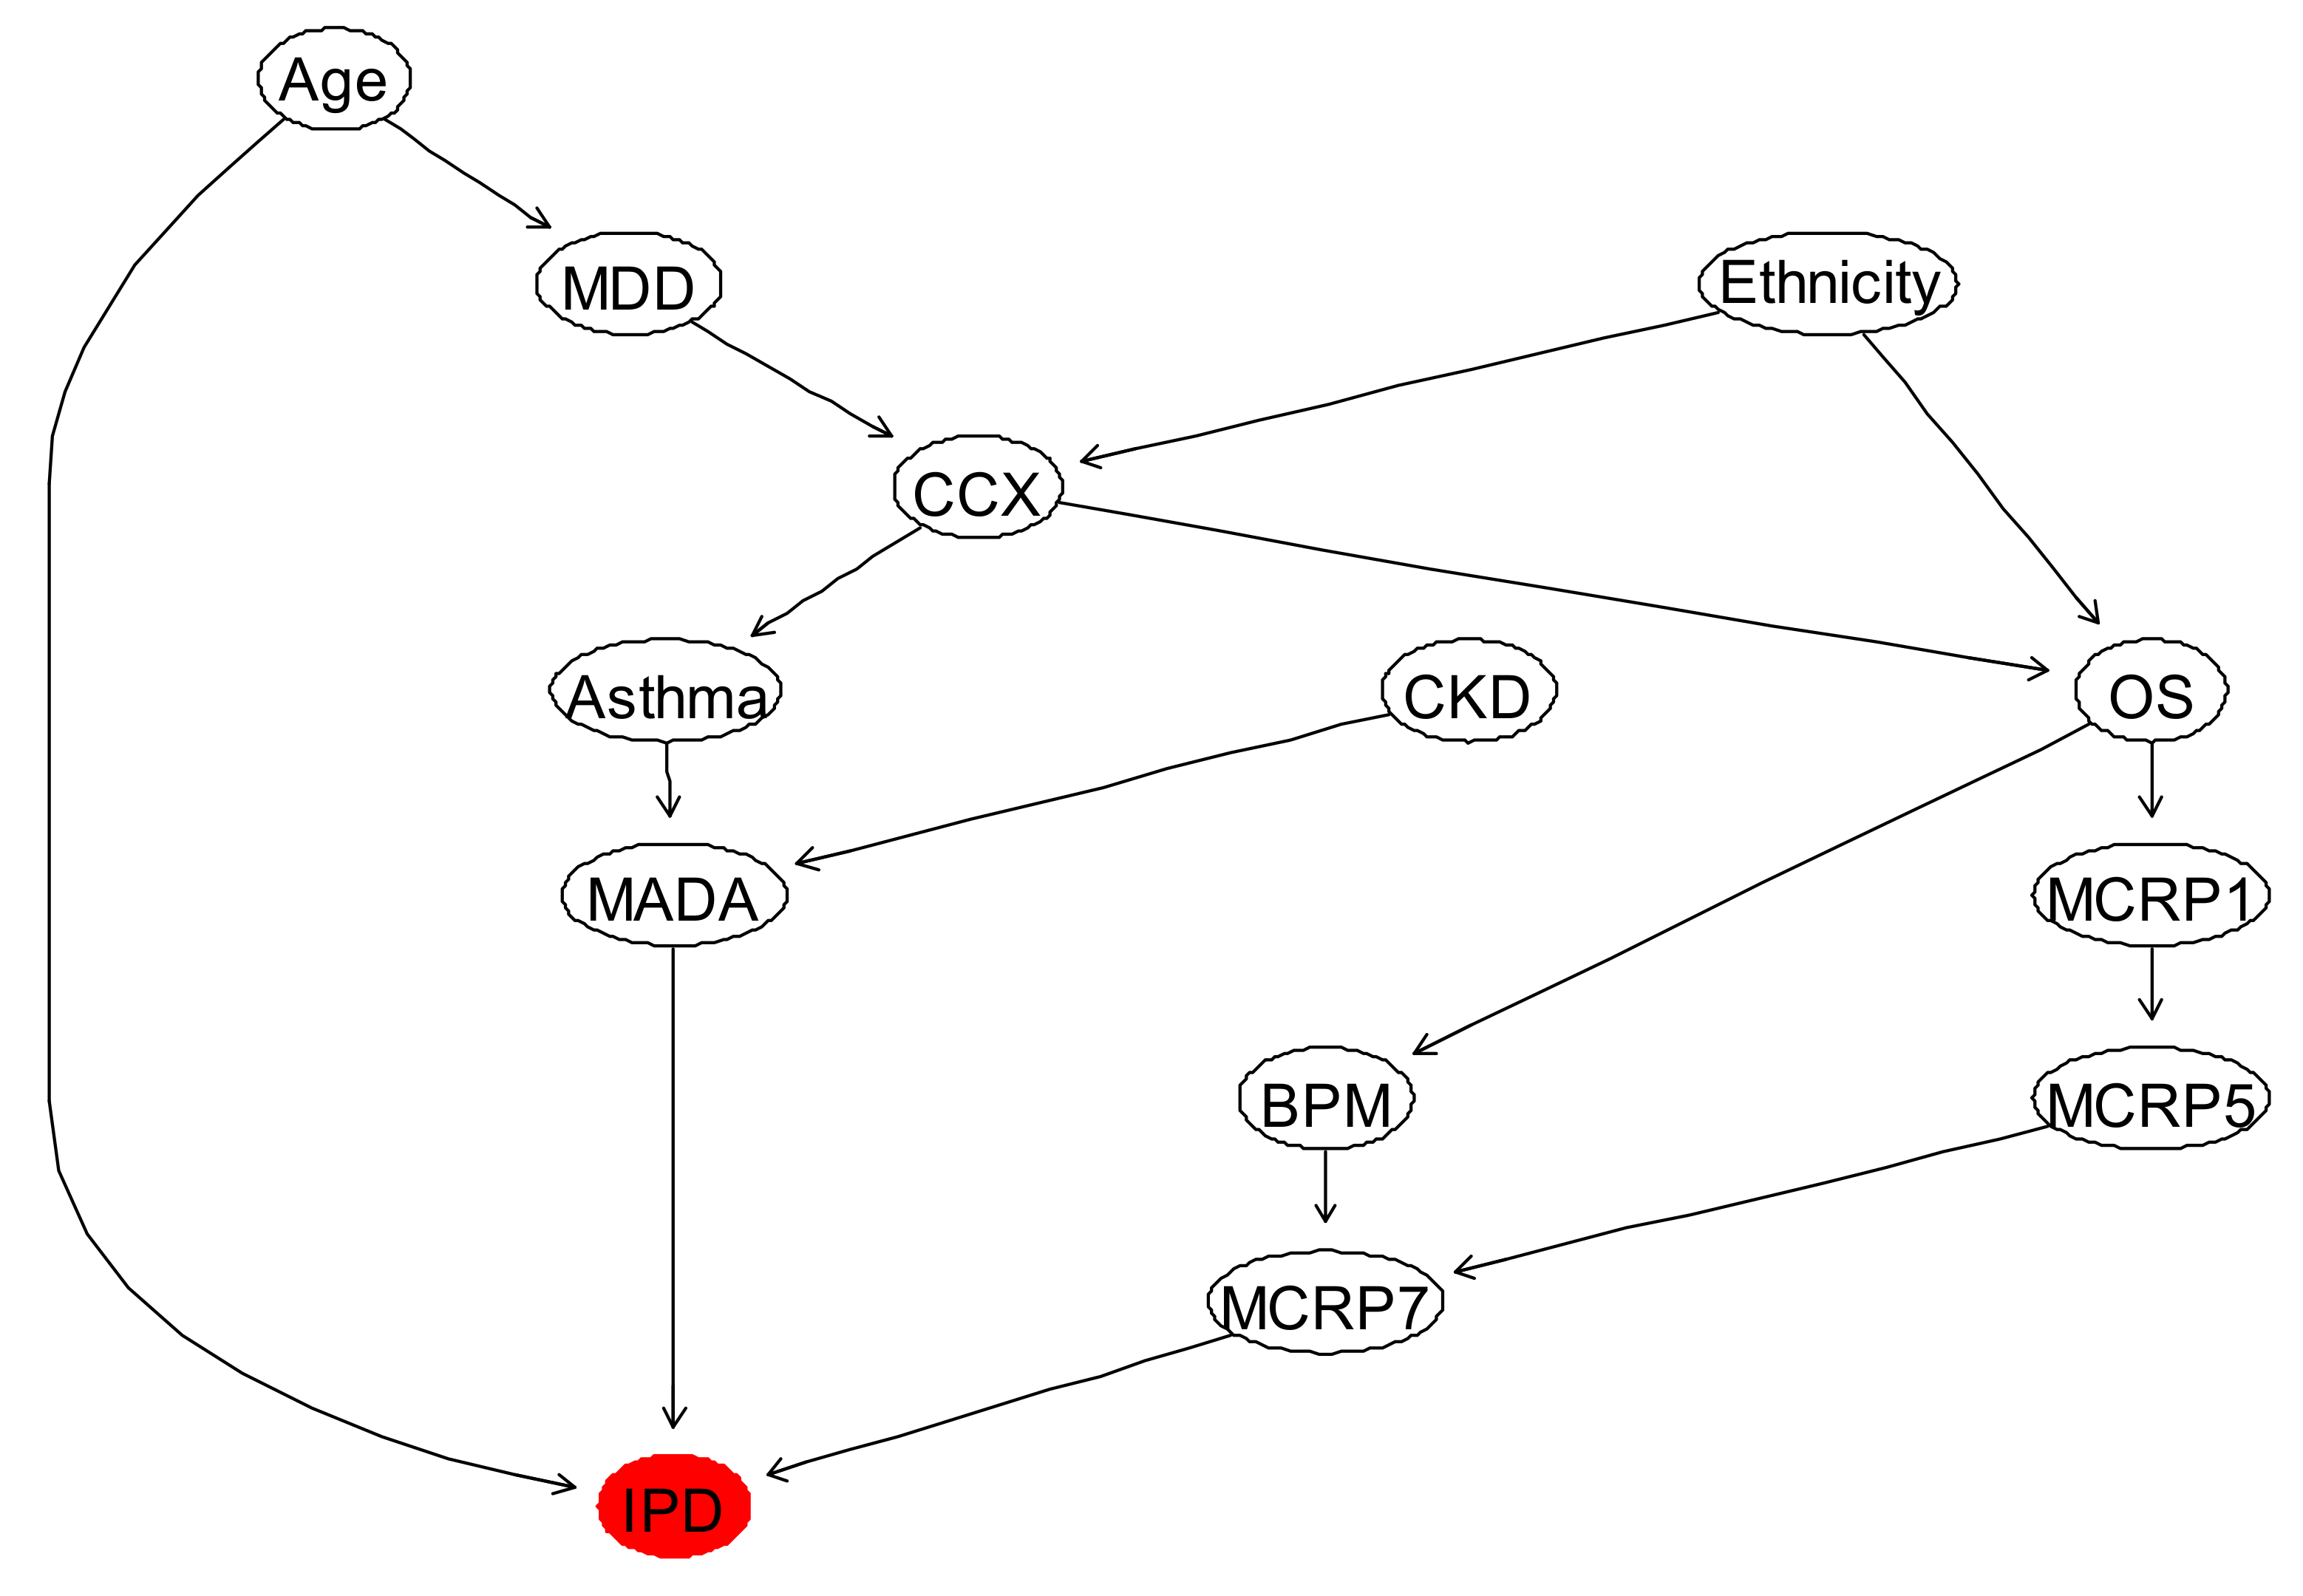
3.1. Inpatient Mortality (IPD)
3.2. Duration of Inpatient Treatment for COVID-19 (ADT)
3.3. Max Oxygen or Ventilatory Support (MOoVS)
3.4. New Confirmed Pulmonary Embolism during Admission (NCPE)
4. Discussion
5. Conclusions
Supplementary Materials
Author Contributions
Funding
Institutional Review Board Statement
Informed Consent Statement
Data Availability Statement
Acknowledgments
Conflicts of Interest
References
- The Independent Coronavirus: A Timeline of How Britain Went from ‘Low Risk’ to an Unprecedented National Shutdown. 2020. Available online: https://www.independent.co.uk/news/uk/home-news/coronavirus-uk-timeline-deaths-cases-covid-19-nhs-social-distancing-a9416331.html (accessed on 23 January 2021).
- NHS COVID-19 Daily Deaths, England. Available online: https://www.england.nhs.uk/statistics/statistical-work-areas/covid-19-daily-deaths/ (accessed on 23 January 2021).
- Razaq, A.; Harrison, D.; Karunanithi, S.; Barr, B.; Asaria, M.; Routen, A.; Khunti, K. BAME COVID-19 DEATHS—What Do We Know? Rapid Data & Evidence Review. Available online: https://www.cebm.net/covid-19/bame-covid-19-deaths-what-do-we-know-rapid-data-evidence-review/ (accessed on 23 January 2021).
- Office for National Statistics Coronavirus (COVID-19) Related Deaths by Ethnic Group, England and Wales: 2 March 2020 to 10 April 2020. Available online: https://www.ons.gov.uk/peoplepopulationandcommunity/birthsdeathsandmarriages/deaths/articles/coronavirusrelateddeathsbyethnicgroupenglandandwales/2march2020to10april2020#ethnic-breakdown-of-deaths-by-age-and-sex (accessed on 23 January 2021).
- Office for National Statistics Deaths Involving COVID-19 by Local Area and Socioeconomic Deprivation: Deaths Occurring between 1 March and 17 April 2020. Available online: https://www.ons.gov.uk/peoplepopulationandcommunity/birthsdeathsandmarriages/deaths/bulletins/deathsinvolvingcovid19bylocalareasanddeprivation/deathsoccurringbetween1marchand17april (accessed on 23 January 2021).
- Zhou, F.; Yu, T.; Du, R.; Fan, G.; Liu, Y.; Liu, Z.; Xiang, J.; Wang, Y.; Song, B.; Gu, X.; et al. Clinical course and risk factors for mortality of adult inpatients with COVID-19 in Wuhan, China: A retrospective cohort study. Lancet 2020, 395, 1054–1062. [Google Scholar] [CrossRef]
- Guan, W.-J.; Liang, W.-H.; Zhao, Y.; Liang, H.-R.; Chen, Z.-S.; Li, Y.-M.; Liu, X.-Q.; Chen, R.-C.; Tang, C.-L.; Wang, T.; et al. Comorbidity and its impact on 1,590 patients with Covid-19 in China: A nationwide analysis. Eur. Respir. J. 2020, 55. [Google Scholar] [CrossRef]
- Richardson, S.; Hirsch, J.S.; Narasimhan, M.; Crawford, J.M.; McGinn, T.; Davidson, K.W.; Barnaby, D.P.; Becker, L.B.; Chelico, J.D.; Cohen, S.L.; et al. Presenting Characteristics, Comorbidities, and Outcomes among 5700 Patients Hospitalized with COVID-19 in the New York City Area. JAMA J. Am. Med. Assoc. 2020, 323, 2052–2059. [Google Scholar] [CrossRef] [PubMed]
- Williamson, E.; Walker, A.J.; Bhaskaran, K.; Bacon, S.; Bates, C.; Morton, C.E.; Curtis, H.J.; Mehrkar, A.; Evans, D.; Inglesby, P.; et al. OpenSAFELY: Factors associated with COVID-19-related hospital death in the linked electronic health records of 17 million adult NHS patients. medRxiv 2020. [Google Scholar] [CrossRef]
- Vincent, J.-L.; Creteur, J. Ethical aspects of the COVID-19 crisis: How to deal with an overwhelming shortage of acute beds. Eur. Heart J. Acute Cardiovasc. Care 2020, 9, 248–252. [Google Scholar] [CrossRef]
- Salari, N.; Khazaie, H.; Hosseinian-Far, A.; Ghasemi, H.; Mohammadi, M.; Shohaimi, S.; Daneshkhah, A.; Khaledi-Paveh, B.; Hosseinian-Far, M. The prevalence of sleep disturbances among physicians and nurses facing the COVID-19 patients: A systematic review and meta-analysis. Glob. Health 2020, 16, 1–14. [Google Scholar] [CrossRef]
- Salari, N.; Khazaie, H.; Hosseinian-Far, A.; Khaledi-Paveh, B.; Kazeminia, M.; Mohammadi, M.; Shohaimi, S.; Daneshkhah, A.; Eskandari, S. The prevalence of stress, anxiety and depression within front-line healthcare workers caring for COVID-19 patients: A systematic review and meta-regression. Hum. Resour. Health 2020, 18, 1–14. [Google Scholar] [CrossRef] [PubMed]
- Knight, S.R.; Ho, A.; Pius, R.; Buchan, I.; Carson, G.; Drake, T.M.; Dunning, J.; Fairfield, C.J.; Gamble, C.; Green, C.A.; et al. Risk stratification of patients admitted to hospital with covid-19 using the ISARIC WHO Clinical Characterisation Protocol: Development and validation of the 4C Mortality Score. BMJ 2020, 370. [Google Scholar] [CrossRef]
- Wynants, L.; Van Calster, B.; Collins, G.S.; Riley, R.D.; Heinze, G.; Schuit, E.; Bonten, M.M.J.; Damen, J.A.A.; Debray, T.P.A.; De Vos, M.; et al. Prediction models for diagnosis and prognosis of covid-19: Systematic review and critical appraisal. BMJ 2020, 369. [Google Scholar] [CrossRef] [PubMed]
- Gupta, R.K.; Marks, M.; Samuels, T.H.A.; Luintel, A.; Rampling, T.; Chowdhury, H.; Quartagno, M.; Nair, A.; Lipman, M.; Abubakar, I.; et al. Systematic evaluation and external validation of 22 prognostic models among hospitalised adults with COVID-19: An observational cohort study. Eur. Respir. J. 2020, 56. [Google Scholar] [CrossRef]
- McLachlan, S.; Dube, K.; Hitman, G.A.; Fenton, N.E.; Kyrimi, E. Bayesian networks in healthcare: Distribution by medical condition. Artif. Intell. Med. 2020, 107, 101912. [Google Scholar] [CrossRef] [PubMed]
- Kyrimi, E.; McLachlan, S.; Dube, K.; Fenton, N. Bayesian Networks in Healthcare: The chasm between research enthusiasm and clinical adoption. medRxiv 2020. [Google Scholar] [CrossRef]
- Constantinou, A.C.; Fenton, N. Things to know about Bayesian networks: Decisions under uncertainty, part 2. Significance 2018, 15, 19–23. [Google Scholar] [CrossRef]
- Libbrecht, M.W.; Noble, W.S. Machine learning applications in genetics and genomics. Nat. Rev. Genet. 2015, 16, 321–332. [Google Scholar] [CrossRef]
- Chatrabgoun, O.; Hosseinian-Far, A.; Chang, V.; Stocks, N.G.; Daneshkhah, A. Approximating non-Gaussian Bayesian networks using minimum information vine model with applications in financial modelling. J. Comput. Sci. 2018, 24, 266–276. [Google Scholar] [CrossRef]
- Chatrabgoun, O.; Hosseinian-Far, A.; Daneshkhah, A. Constructing gene regulatory networks from microarray data using non-Gaussian pair-copula Bayesian networks. J. Bioinform. Comput. Biol. 2020, 18, 2050023. [Google Scholar] [CrossRef]
- Parmar, C.; Grossmann, P.; Rietveld, D.; Rietbergen, M.M.; Lambin, P.; Aerts, H.J.W.L. Radiomic machine-learning classifiers for prognostic biomarkers of head and neck cancer. Front. Oncol. 2015, 5, 272. [Google Scholar] [CrossRef] [PubMed]
- O’Hagan, A.; Buck, C.E.; Daneshkhah, A.; Eiser, J.R.; Garthwaite, P.H.; Jenkinson, D.J.; Oakley, J.E.; Rakow, T. Uncertain Judgements: Eliciting Experts’ Probabilities; John Wiley & Sons: Hoboken, NJ, USA, 2006. [Google Scholar]
- Daneshkhah, A.; Oakley, J.E. Eliciting Multivariate Probability Distributions. Rethink. Risk Meas. Rep. 2010, 1, 23. [Google Scholar]
- Daneshkhah, A.; Hosseinian-Far, A.; Sedighi, T.; Farsi, M. Prior elicitation and evaluation of imprecise judgements for Bayesian analysis of system reliability. In Strategic Engineering for Cloud Computing and Big Data Analytics; Springer: Cham, Switzerland, 2017; pp. 63–79. [Google Scholar]
- Smith, J.Q.; Daneshkhah, A. On the robustness of Bayesian networks to learning from non-conjugate sampling. Int. J. Approx. Reason. 2010, 51, 558–572. [Google Scholar] [CrossRef]
- Collins, G.S.; Reitsma, J.B.; Altman, D.G.; Moons, K.G.M. Transparent reporting of a multivariable prediction model for individual prognosis or diagnosis (TRIPOD): The TRIPOD Statement. Eur. Urol. 2015, 67, 1142–1151. [Google Scholar] [CrossRef]
- British Society of Thoracic Imaging **UPDATED**Version 2 BSTI COVID-19 Guidance for the Reporting Radiologist. Available online: https://www.bsti.org.uk/standards-clinical-guidelines/clinical-guidelines/bsti-covid-19-guidance-for-the-reporting-radiologist/ (accessed on 23 January 2021).
- Chen, Y.-C.; Wheeler, T.A.; Kochenderfer, M.J. Learning discrete Bayesian networks from continuous data. J. Artif. Intell. Res. 2017, 59, 103–132. [Google Scholar] [CrossRef]
- Allison, P.D. Missing Data, 1st ed.; Sage Publications, Inc.: New York, NY, USA, 2001; ISBN 9780761916727. [Google Scholar]
- Kang, H. The prevention and handling of the missing data. Korean J. Anesthesiol. 2013, 64, 402–406. [Google Scholar] [CrossRef] [PubMed]
- Torgo, L. Data Mining with R: Learning with Case Studies, 2nd ed.; Kumar, V., Ed.; Taylor & Francis: Boca Raton, FL, USA; Chapman & Hall/CRC: Boca Raton, FL, USA, 2016. [Google Scholar]
- Ding, C.; Peng, H. Minimum Redundancy Feature Selection from Microarray Gene Expression Data. J. Bioinform. Comput. Biol. 2005, 3, 185–205. [Google Scholar] [CrossRef]
- Urbanowicz, R.J.; Meeker, M.; La Cava, W.; Olson, R.S.; Moore, J.H. Relief-based feature selection: Introduction and review. J. Biomed. Inform. 2018, 85, 189–203. [Google Scholar] [CrossRef] [PubMed]
- James, G.; Witten, D.; Hastie, T.; Tibshirani, R. An Introduction to Statistical Learning: With Applications in R; Springer: Berlin/Heidelberg, Germany, 2017. [Google Scholar]
- Guyon, I.; Gunn, S.; Nikravesh, M.; Zadeh, L.A. (Eds.) Feature Extraction Foundations and Applications, 1st ed.; Springer: Berlin/Heidelberg, Germany, 2006; ISBN 3-540-35487-5. [Google Scholar]
- Saeys, Y.; Inza, I.; Larrañaga, P. A review of feature selection techniques in bioinformatics. Bioinformatics 2007, 23, 2507–2517. [Google Scholar] [CrossRef] [PubMed]
- McGill, W.J. Multivariate information transmission. Psychometrika 1954, 19, 97–116. [Google Scholar] [CrossRef]
- Iguyon, I.; Elisseeff, A. An introduction to variable and feature selection. J. Mach. Learn. Res. 2003, 3, 1157–1182. [Google Scholar]
- Kuhn, M.; Johnson, K. Feature Engineering and Selection: A Practical Approach for Predictive Models, 1st ed.; Chapman and Hall/CRC: New York, NY, USA, 2020; ISBN 9781315108230. [Google Scholar]
- R Core Team. R: A Language and Environment for Statistical Computing. R Foundation for Statistical Computing, Vienna, Austria. 2018. Available online: https://www.r-project.org/ (accessed on 6 June 2021).
- Kuhn, M. Building predictive models in R using the caret package. J. Stat. Softw. 2008, 28, 1–26. [Google Scholar] [CrossRef]
- Jensen, K.L.; Toftum, J.; Friis-Hansen, P. A Bayesian Network approach to the evaluation of building design and its consequences for employee performance and operational costs. Build. Environ. 2009, 44, 456–462. [Google Scholar] [CrossRef]
- Sedighi, T.; Varga, L. CECAN Evaluation and Policy Practice Note (EPPN) for Policy Analysts and Evaluators—A Bayesian Network for Policy Evaluation; The Centre for the Evaluation of Complexity across the Nexus (CECAN): Guildford, UK, 2019. [Google Scholar]
- Zhou, Y.; Fenton, N.; Neil, M. Bayesian network approach to multinomial parameter learning using data and expert judgments. Int. J. Approx. Reason. 2014, 55, 1252–1268. [Google Scholar] [CrossRef]
- Lee, C.; Van Beek, P. Metaheuristics for score-and-search Bayesian network structure learning. In Canadian Conference on Artificial Intelligence; Springer: Berlin/Heidelberg, Germany, 2017; pp. 129–141. [Google Scholar]
- Fenton, N.; Neil, M. Risk Assessment and Decision Analysis with Bayesian Networks, 2nd ed.; CRC Press: Boca Raton, FL, USA; Taylor & Francis Group: Boca Raton, FL, USA, 2019; ISBN 9781315269405. [Google Scholar]
- Han, J.; Shi, L.-X.; Xie, Y.; Zhang, Y.-J.; Huang, S.-P.; Li, J.-G.; Wang, H.-R.; Shao, S.-F. Analysis of factors affecting the prognosis of COVID-19 patients and viral shedding duration. Epidemiol. Infect. 2020, 148. [Google Scholar] [CrossRef] [PubMed]
- Heneghan, C.; Howdon, D.; Oke, J.; Jefferson, T. The Ongoing Problem of UK Hospital Acquired Infections. Available online: https://www.cebm.net/covid-19/the-ongoing-problem-of-hospital-acquired-infections-across-the-uk/ (accessed on 23 January 2021).
- Mahbubani, K.; Georgiades, F.; Goh, E.L.; Chidambaram, S.; Sivakumaran, P.; Rawson, T.; Ray, S.; Hudovsky, A.; Gill, D. Clinician-directed improvement in the accuracy of hospital clinical coding. Future Healthc. J. 2018, 5, 47–51. [Google Scholar] [CrossRef] [PubMed]
- Saunders, C.L.; Abel, G.A.; El Turabi, A.; Ahmed, F.; Lyratzopoulos, G. Accuracy of routinely recorded ethnic group information compared with self-reported ethnicity: Evidence from the English Cancer Patient Experience survey. BMJ Open 2013, 3. [Google Scholar] [CrossRef]
- Feng, H.; Liu, Y.; Lv, M.; Zhong, J. A case report of COVID-19 with false negative RT-PCR test: Necessity of chest CT. Jpn. J. Radiol. 2020, 38, 409–410. [Google Scholar] [CrossRef]
- He, J.-L.; Luo, L.; Luo, Z.-D.; Lyu, J.-X.; Ng, M.-Y.; Shen, X.-P.; Wen, Z. Diagnostic performance between CT and initial real-time RT-PCR for clinically suspected 2019 coronavirus disease (COVID-19) patients outside Wuhan, China. Respir. Med. 2020, 168, 105980. [Google Scholar] [CrossRef]
- Mawaddah, A.; Gendeh, H.S.; Lum, S.G.; Marina, M.B. Upper respiratory tract sampling in COVID-19. Malays. J. Pathol. 2020, 42, 23–35. [Google Scholar]
- Vinh, D.B.; Zhao, X.; Kiong, K.L.; Guo, T.; Jozaghi, Y.; Yao, C.; Kelley, J.M.; Hanna, E.Y. Overview of COVID-19 testing and implications for otolaryngologists. Head Neck 2020, 42, 1629–1633. [Google Scholar] [CrossRef] [PubMed]
- Zitek, T. The appropriate use of testing for Covid-19. West. J. Emerg. Med. 2020, 21, 470–472. [Google Scholar] [CrossRef]
- Al-Tawfiq, J.A. Asymptomatic coronavirus infection: MERS-CoV and SARS-CoV-2 (COVID-19). Travel Med. Infect. Dis. 2020, 35, 101608. [Google Scholar] [CrossRef]
- Day, M. Covid-19: Four fifths of cases are asymptomatic, China figures indicate. BMJ 2020, 369, m1375. [Google Scholar] [CrossRef]
- Hu, Z.; Song, C.; Xu, C.; Jin, G.; Chen, Y.; Xu, X.; Ma, H.; Chen, W.; Lin, Y.; Zheng, Y.; et al. Clinical characteristics of 24 asymptomatic infections with COVID-19 screened among close contacts in Nanjing, China. Sci. China Life Sci. 2020, 63, 706–711. [Google Scholar] [CrossRef]
- Nishiura, H.; Kobayashi, T.; Miyama, T.; Suzuki, A.; Jung, S.-M.; Hayashi, K.; Kinoshita, R.; Yang, Y.; Yuan, B.; Akhmetzhanov, A.R.; et al. Estimation of the asymptomatic ratio of novel coronavirus infections (COVID-19). Int. J. Infect. Dis. 2020, 94, 154–155. [Google Scholar] [CrossRef] [PubMed]
- Yu, X.; Yang, R. COVID-19 transmission through asymptomatic carriers is a challenge to containment. Influenza Other Respi. Viruses 2020, 14, 474–475. [Google Scholar] [CrossRef] [PubMed]
- Agrawal, K.; Baweja, Y.; Dwivedi, D.; Saha, R.; Prasad, P.; Agrawal, S.; Kapoor, S.; Chaturvedi, P.; Mali, N.; Kala, V.U.; et al. A Comparison of Class Imbalance Techniques for Real-World Landslide Predictions. In Proceedings of the 2017 International Conference on Machine Learning and Data Science (MLDS), Noida, India, 14–15 December 2017. [Google Scholar]
- Naseriparsa, M.; Kashani, M.M.R. Combination of PCA with SMOTE resampling to boost the prediction rate in lung cancer dataset. Int. J. Comput. Appl. 2013, 77, 33–38. [Google Scholar] [CrossRef]
- Taft, L.M.; Evans, R.S.; Shyu, C.R.; Egger, M.J.; Chawla, N.; Mitchell, J.A.; Thornton, S.N.; Bray, B.; Varner, M. Countering imbalanced datasets to improve adverse drug event predictive models in labor and delivery. J. Biomed. Inform. 2009, 42, 356–364. [Google Scholar] [CrossRef]
- Al-Bahrani, R.; Agrawal, A.; Choudhary, A. Colon Cancer Survival Prediction Using Ensemble Data Mining on SEER data. In Proceedings of the 2013 IEEE International Conference on Big Data, Silicon Valley, CA, USA, 6–9 October 2013. [Google Scholar]


| Sample Population | |
|---|---|
| Patients diagnosed with COVID-19 between 01/03/2020 and 22/04/2020, at Milton Keynes University Hospital (n = 424) | |
| Inclusion Criteria | Exclusion Criteria |
|
|
| Final Study Participant Number (n = 355) | |
| Predictor | RFE (NCPE) | RFE (MOoVS) | RFE (ADT) | RFE (IPD) |
|---|---|---|---|---|
| Age | 2 | 1 | 7 | 1 |
| Gender (Ge) | 7 | 17 | 17 | 33 |
| Ethnicity | 17 | 5 | 24 | 4 |
| Oxygen Saturations (OS) | 16 | 2 | 9 | 2 |
| Respiratory Rate (BPM) | 19 | 12 | 26 | 9 |
| Temperature | 6 | 10 | 19 | 35 |
| Obesity | 11 | 8 | 11 | 28 |
| Previous Venous Thromboembolism (PVTE) | Rejected | 33 | 33 | 36 |
| Chronic Obstructive Pulmonary Disease (COPD) | Rejected | 37 | 37 | 37 |
| Bronchiectasis | Rejected | 41 | 31 | |
| Asthma | 21 | 27 | 34 | 10 |
| Interstitial Lung Disease (ILD) | Rejected | 21 | 40 | 38 |
| Lung Cancer (LC) | Rejected | 41 | 38 | 39 |
| Diabetes Mellitus (DM) | 29 | 16 | 27 | 21 |
| Hypertension (HTN) | 14 | 26 | 8 | 25 |
| Ischaemic Heart Disease (IHD) | 31 | 28 | 28 | 16 |
| Chronic Kidney Disease (CKD) | 32 | 31 | 31 | 8 |
| Non-steroidal anti-inflammatory drugs (ANNC) | 33 | 38 | 25 | 15 |
| Anticoagulant | 23 | 35 | 29 | 17 |
| Long-Term Antibiotic (LTA) | Rejected | 34 | 36 | 30 |
| Long Term Oral Steroid (LTO) | Rejected | 39 | 42 | 42 |
| Immunosuppressants (ISES) | Rejected | 32 | 39 | 32 |
| Oral NSAIDs (ONS) | Rejected | 40 | 32 | 41 |
| Angiotensin Converting Enzyme Inhibitors (ACEI) | 28 | 36 | 30 | 40 |
| Angiotensin Receptor Blockers (ARBB) | 27 | 29 | 35 | 27 |
| CT imaging severity of COVID-19 related changes (UoB) | 1 | 4 | 2 | 23 |
| COVID-19 related Chest X-ray changes (CCX) | 30 | 7 | 10 | 11 |
| Lactate (LDP) | 12 | 25 | 21 | 20 |
| Lymphocytes (LyDP) | 4 | 23 | 16 | 18 |
| Neutrophils (NDP) | 5 | 18 | 15 | 26 |
| Albumin (MADA) | 3 | 6 | 1 | 6 |
| Ferritin | 24 | 20 | 23 | 24 |
| D-Dimer (MDD) | 8 | 11 | 6 | 7 |
| C-Reactive Protein (CRP) Day 0 | 18 | 13 | 3 | 19 |
| CRP Day 1–2 (MCRP1) | 13 | 22 | 4 | 12 |
| CRP Day 3–4 (MCRP3) | 20 | 19 | 14 | 22 |
| CRP Day 5–6 (MCRP5) | 10 | 15 | 12 | 5 |
| CRP Day 7–8 (MCRP7) | 9 | 3 | 5 | 3 |
| CRP Day 9–10 (MCRP9) | 22 | 14 | 13 | 14 |
| CRP Day 11–12 (MCRP11) | 26 | 9 | 18 | 29 |
| CRP Day 13–14 (MCRP13) | 15 | 24 | 20 | 34 |
| CRP Day 15–20 (MCRP15) | 25 | 30 | 22 | 13 |
| Risk Factor (MADA, MCRP7, Age) | Probability of Inpatient Mortality |
|---|---|
| (3, 1, 1) | 0 |
| (2, 1, 2) | 0 |
| (3, 3, 1) | 0 |
| (2, 2, 2) | 0.20 |
| (1, 1, 1) | 0.33 |
| (1, 3, 1) | 0.397 |
| (3, 1, 3) | 0.417 |
| (1, 1, 3) | 0.513 |
| (1, 2, 2) | 0.594 |
| (3, 3, 3) | 0.813 |
| (1, 3, 3) | 0.866 |
| Risk Factor (OS, CCX, Ethnicity, Age) | Probability of Inpatient Mortality |
|---|---|
| Age < 40 | |
| (1, 2, 2, 1) | 0.1375 |
| (1, 2, 1, 1) | 0.1376 |
| (2, 1, 1, 1) | 0.1387 |
| (1, 1, 1, 1) | 0.1391 |
| (2, 2, 1, 1) | 0.1395 |
| (1, 1, 2, 1) | 0.1401 |
| (2, 1, 2, 1) | 0.1407 |
| (2, 2, 2, 1) | 0.1417 |
| Age < 70 | |
| (1, 2, 2, 3) | 0.6755 |
| (1, 2, 1, 3) | 0.6756 |
| (1, 1, 1, 3) | 0.6761 |
| (1, 1, 2, 3) | 0.6764 |
| (2, 1, 2, 3) | 0.6927 |
| (2, 1, 1, 3) | 0.6944 |
| (2, 2, 1, 3) | 0.6944 |
| (2, 2, 2, 3) | 0.6946 |
| Risk Factor (MADA, Age, MCRP1, MCRP7) | Probability of Inpatient Mortality |
|---|---|
| MADA > 35 and Age < 40 years | |
| (3, 1, 2, 1)—Small CRP Decrease | 0 |
| (3, 1, 3, 1)—Large CRP Decrease | 0 |
| (3, 1, 1, 2)—Small CRP Increase | 0 |
| (3, 1, 1, 3)—Large CRP Increase | 0 |
| MADA > 35 and Age < 70 years | |
| (3, 3, 2, 1)—Small CRP Decrease | 0.418 |
| (3, 3, 3, 1)—Large CRP Decrease | 0.416 |
| (3, 3, 1, 2)—Small CRP Increase | 0.496 |
| (3, 3, 1, 3)—Large CRP Increase | 0.812 |
| MADA < 30 and Age < 70 years | |
| (1, 3, 2, 1)—Small CRP Decrease | 0.515 |
| (1, 3, 3, 1)—Large CRP Decrease | 0.513 |
| (1, 3, 1, 2)—Small CRP Increase | 0.734 |
| (1, 3, 1, 3)—Large CRP Increase | 0.865 |
| Predictive Performance Metric | PPV | NPV | Specificity | Sensitivity | Overall Accuracy | F1-Score |
|---|---|---|---|---|---|---|
| BN for IPD | 82% | 67.86% | 82.6% | 85.7% | 84.1% | 83.7% |
| Probability of ADT Given Obesity, MADA and MCRP7 | MADA (3) and MCRP1 (1) | MADA (3) and MCRP1 (3) | MADA (1) and MCRP1 (1) | MADA (1) and MCRP1 (3) |
|---|---|---|---|---|
| BMI < 30 (Non-Obese patients) | ||||
| <1 day | 71.2% | 68.7% | 10.5% | 10.5% |
| >2 days but <3 days | 23.7% | 25% | 32.7% | 30.3% |
| >3 days | 5.1% | 6.3% | 56.8% | 59.2% |
| BMI > 30 (Obese patients) | ||||
| <1 day | 54.4% | 49.4% | 13.2% | 11% |
| >2 days but <3 days | 40.7% | 45.2% | 34.6% | 32.5% |
| >3 days | 4.8% | 5.4% | 52.2% | 56.5% |
| Predictive Performance Metrics of ADT Category | Balanced Accuracy | Sensitivity (Recall) | Specificity | Precision | Overall Accuracy | F1-Score |
|---|---|---|---|---|---|---|
| <1 day | 74.8% | 66.2% | 83.5% | 73.7% | 61.5% | 69.8% |
| >2 days but <3 days | 60.6% | 41.4% | 79.8% | 53.5% | 61.5% | 46.7% |
| >3 days | 71.3% | 76.9% | 65.7% | 57.9% | 61.5% | 66.1% |
| Probability of MOoVS Given Category of OS, MADA and MCRP11 | OS (1), MADA (3) and MCRP11 (1) | OS (1), MADA (1) and MCRP11 (2) | OS (1), MADA (1) and MCRP11 (1) | OS (2), MADA (3) and MCRP11 (1) | OS (2), MADA (1) and MCRP11 (1) | OS (2), MADA (1) and MCRP11 (2) |
|---|---|---|---|---|---|---|
| NHF | 72.80% | 39.30% | 34.80% | 20.10% | 9.80% | 1.80% |
| HF | 12.50% | 10.10% | 38.90% | 45.90% | 25.40% | 12.40% |
| CPN | 14.70% | 26.90% | 18.60% | 34% | 39.30% | 36.90% |
| ITU | 0% | 23.70% | 7.70% | 0% | 25.50% | 48.90% |
| Probability of MOoVS Given OS, MADA, MCRP11 and Age | OS (1), MADA (3), MCRP11 (1) and Age (1) | OS (1), MADA (1), MCRP11 (1) and Age (1) | OS (1), MADA (3), MCRP11 (1) and Age (3) | OS (1), MADA (1), MCRP11 (1) and Age (3) | OS (2), MADA (1), MCRP11 (2) and Age (1) | OS (2), MADA (1), MCRP11 (2), and Age (3) |
|---|---|---|---|---|---|---|
| NHF | 92.60% | 79.80% | 61% | 39.90% | 0% | 2.10% |
| HF | 7.40% | 20.20% | 33.60% | 53.90% | 0% | 22% |
| CPN | 0% | 0% | 5.40% | 3.10% | 36.50% | 75.90% |
| ITU | 0% | 0% | 0% | 3.10% | 63.50% | 0% |
| Predictive Performance Metrics | Balanced Accuracy | Recall (Sensitivity) | Specificity | Precision | Overall Accuracy | F1-Score |
|---|---|---|---|---|---|---|
| NHF | 72.3% | 56% | 88.7% | 70.8% | 60.25 % | 62.5% |
| HF | 68.5% | 61.2% | 75.8% | 51.3% | 60.25 % | 55.8% |
| CPN | 63.6% | 36.2% | 91.1% | 64.8% | 60.25% | 66.4% |
| ITU | 80.7% | 88.84% | 72.7% | 59.9% | 60.25 % | 71.5% |
| Probability of NCPE Given UoB and MDD | Bilateral CT Changes and MDD < 400 | Bilateral CT Changes and MDD > 400 | Unilateral CT Changes and MDD < 400 | Unilateral CT Changes and MDD > 400 |
| No NCPE | 27.20% | 27.80% | 86.50% | 85.90% |
| NCPE | 72.80% | 72.20% | 13.50% | 14.10% |
| Probability of NCPE Given Categories of UoB and MADA | Bilateral CT Changes and MADA < 30 | Bilateral CT Changes and MADA > 35 | Unilateral CT Changes and MADA < 30 | Unilateral CT Changes and MADA > 35 |
| No NCPE | 27% | 51% | 85.30% | 98.60% |
| NCP | 73% | 49% | 14.70% | 1.40% |
| Probability of NCPE Given Categories of MADA, MCRP7 and Obesity | MADA (1) and MCRP7 (1) | MADA (1) and MCRP7 (3) | MADA (3) and MCRP7 (1) | MADA (3) and MCRP7 (3) |
|---|---|---|---|---|
| BMI < 30 (Non-Obese Patients) | ||||
| No NCPE | 44.20% | 30.90% | 63% | 44.70% |
| NCPE | 55.80% | 69.10% | 37% | 55.30% |
| BMI > 30 (Obese Patients) | ||||
| No NCPE | 68.20% | 51.50% | 94.30% | 87.80% |
| NCPE | 31.80% | 48.50% | 5.70% | 12.20% |
| Predictive Performance Metric | PPV | NPV | Specificity | Sensitivity | Overall Accuracy | F1-Score |
|---|---|---|---|---|---|---|
| BN for IPD | 83.7% | 80.9% | 75% | 87.9% | 82.7% | 85.8% |
Publisher’s Note: MDPI stays neutral with regard to jurisdictional claims in published maps and institutional affiliations. |
© 2021 by the authors. Licensee MDPI, Basel, Switzerland. This article is an open access article distributed under the terms and conditions of the Creative Commons Attribution (CC BY) license (https://creativecommons.org/licenses/by/4.0/).
Share and Cite
Vepa, A.; Saleem, A.; Rakhshan, K.; Daneshkhah, A.; Sedighi, T.; Shohaimi, S.; Omar, A.; Salari, N.; Chatrabgoun, O.; Dharmaraj, D.; et al. Using Machine Learning Algorithms to Develop a Clinical Decision-Making Tool for COVID-19 Inpatients. Int. J. Environ. Res. Public Health 2021, 18, 6228. https://doi.org/10.3390/ijerph18126228
Vepa A, Saleem A, Rakhshan K, Daneshkhah A, Sedighi T, Shohaimi S, Omar A, Salari N, Chatrabgoun O, Dharmaraj D, et al. Using Machine Learning Algorithms to Develop a Clinical Decision-Making Tool for COVID-19 Inpatients. International Journal of Environmental Research and Public Health. 2021; 18(12):6228. https://doi.org/10.3390/ijerph18126228
Chicago/Turabian StyleVepa, Abhinav, Amer Saleem, Kambiz Rakhshan, Alireza Daneshkhah, Tabassom Sedighi, Shamarina Shohaimi, Amr Omar, Nader Salari, Omid Chatrabgoun, Diana Dharmaraj, and et al. 2021. "Using Machine Learning Algorithms to Develop a Clinical Decision-Making Tool for COVID-19 Inpatients" International Journal of Environmental Research and Public Health 18, no. 12: 6228. https://doi.org/10.3390/ijerph18126228
APA StyleVepa, A., Saleem, A., Rakhshan, K., Daneshkhah, A., Sedighi, T., Shohaimi, S., Omar, A., Salari, N., Chatrabgoun, O., Dharmaraj, D., Sami, J., Parekh, S., Ibrahim, M., Raza, M., Kapila, P., & Chakrabarti, P. (2021). Using Machine Learning Algorithms to Develop a Clinical Decision-Making Tool for COVID-19 Inpatients. International Journal of Environmental Research and Public Health, 18(12), 6228. https://doi.org/10.3390/ijerph18126228