
Evaluation and Future Projection of Extreme Climate Events in the Yellow River Basin and Yangtze River Basin in China Using Ensembled CMIP5 Models Data

Abstract
1. Introduction
2. Materials and Methods
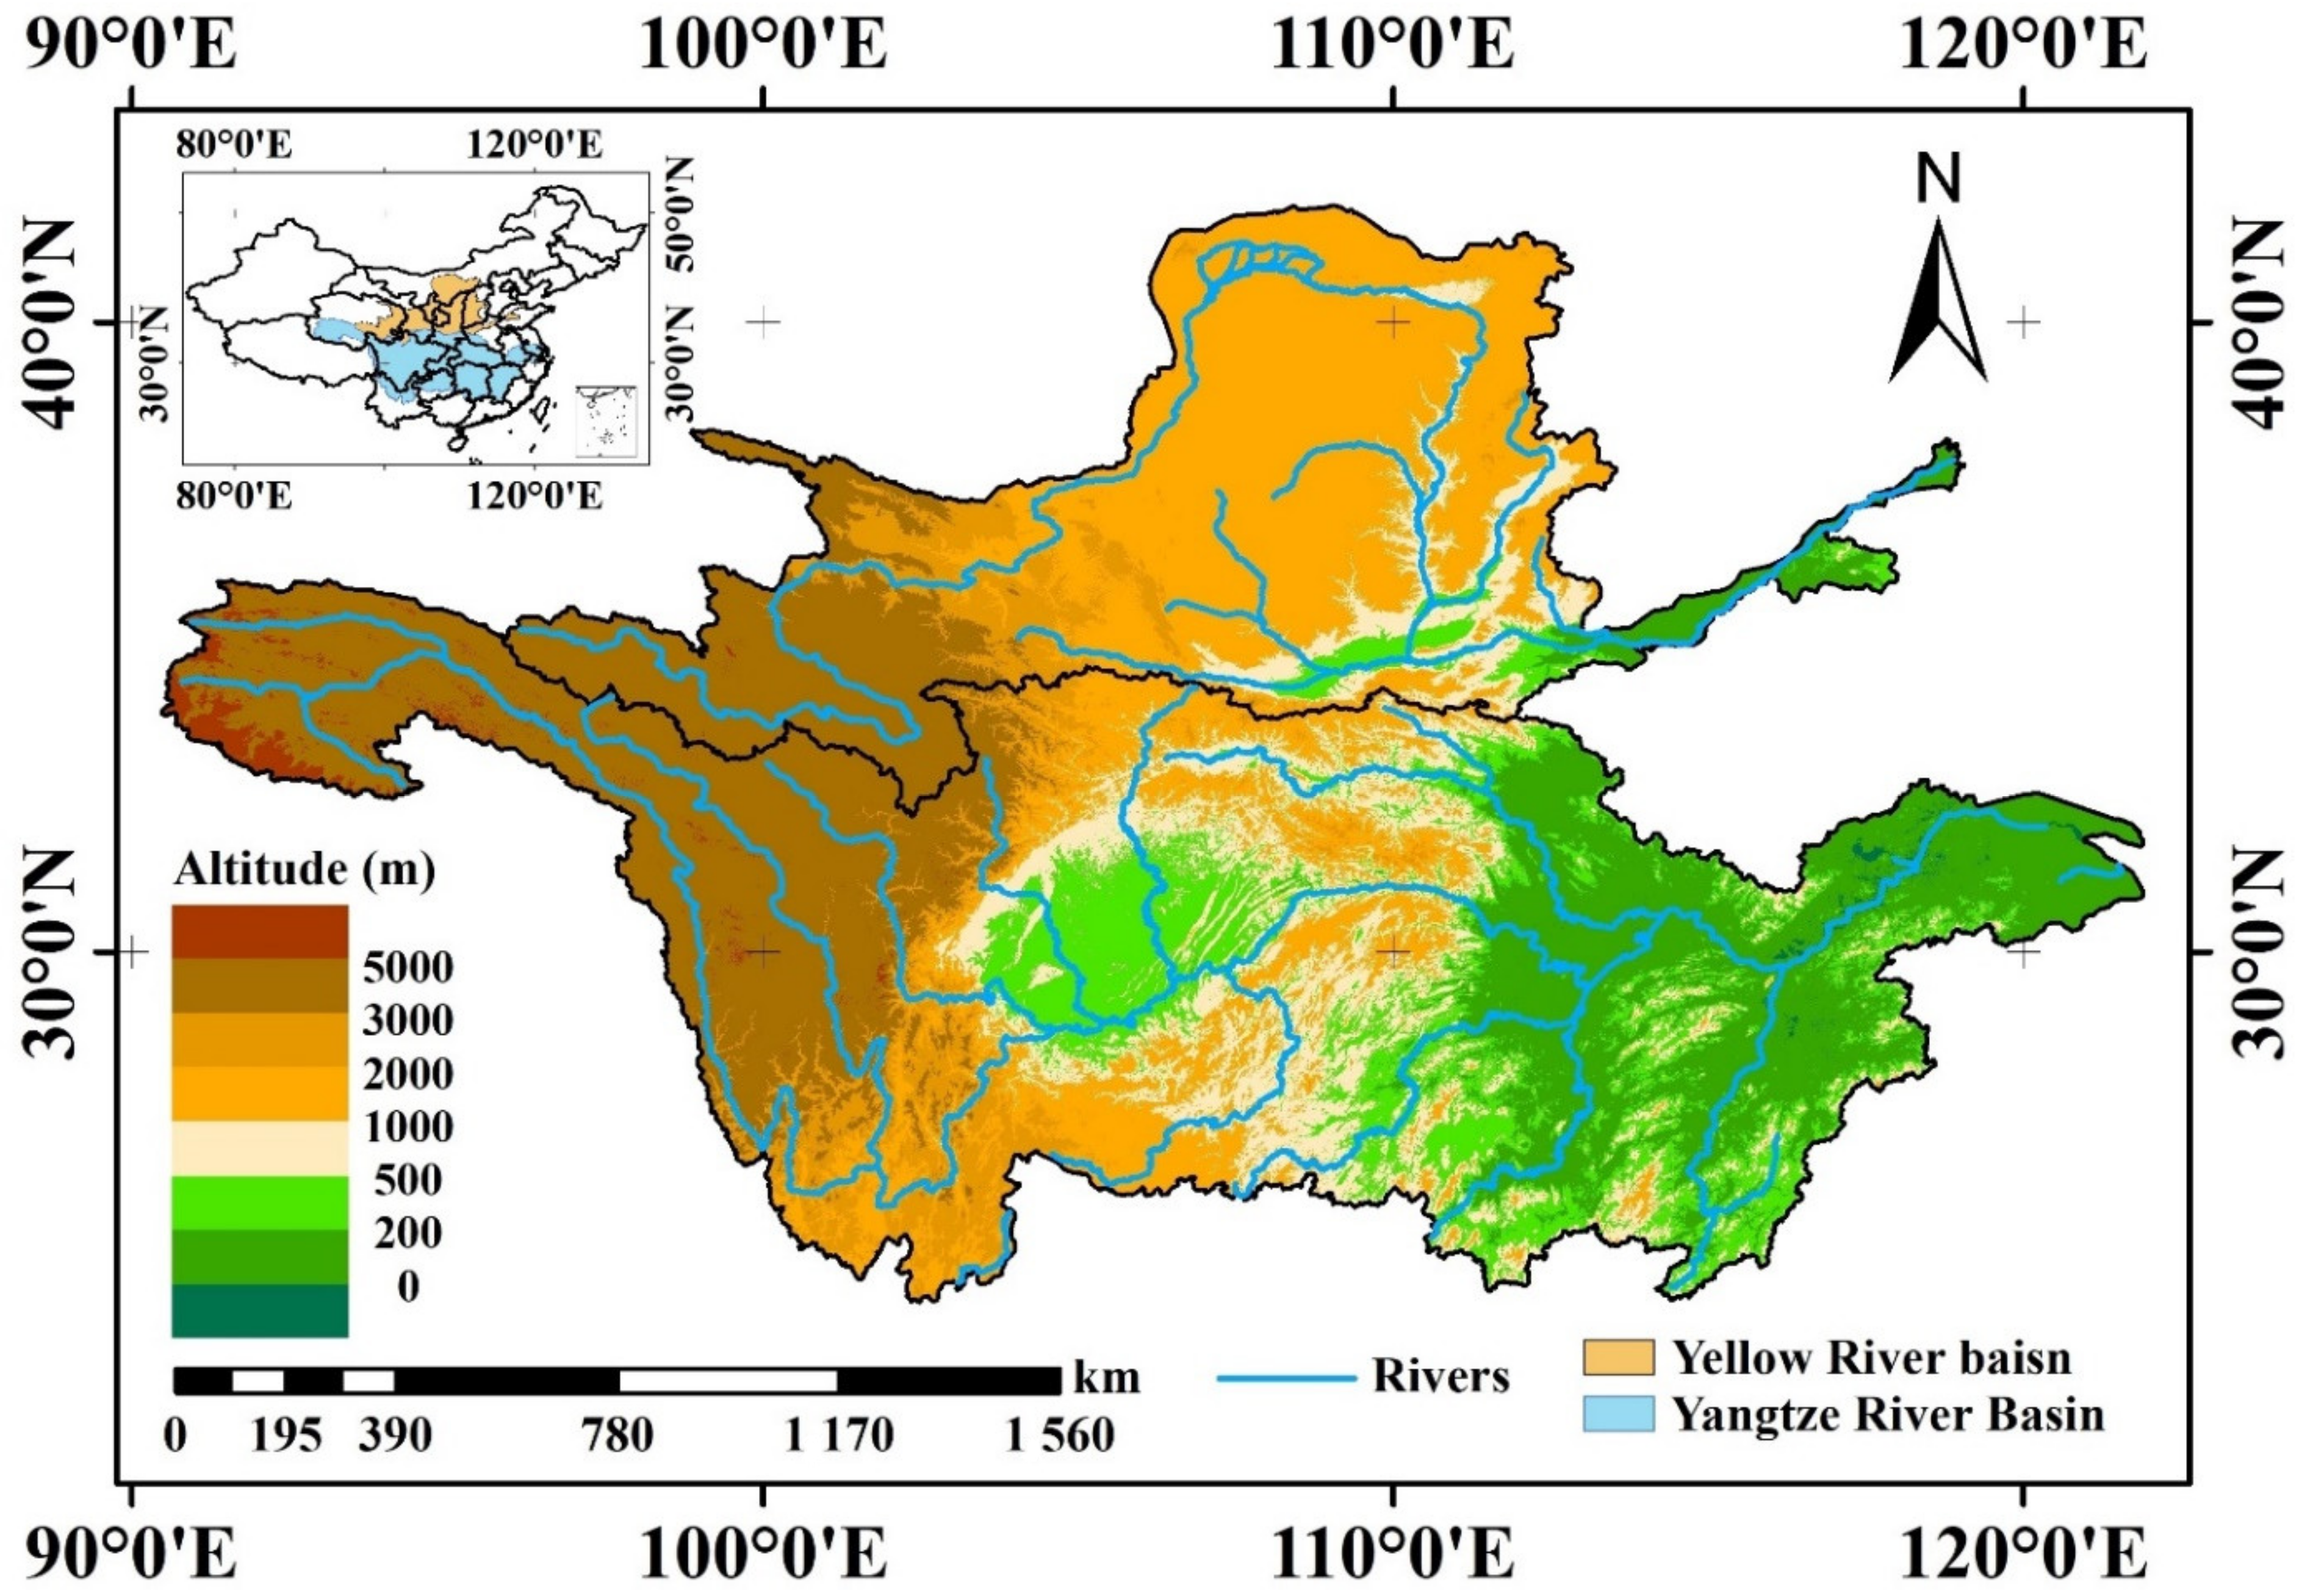
2.1. Study Area and Observed Data
2.2. CMIP5 Model Simulations
2.3. Climate Extreme Indices
2.4. CMIP5 Data Processing
2.4.1. Delta Change Method
2.4.2. Reliability Ensemble Averaging Method
3. Results
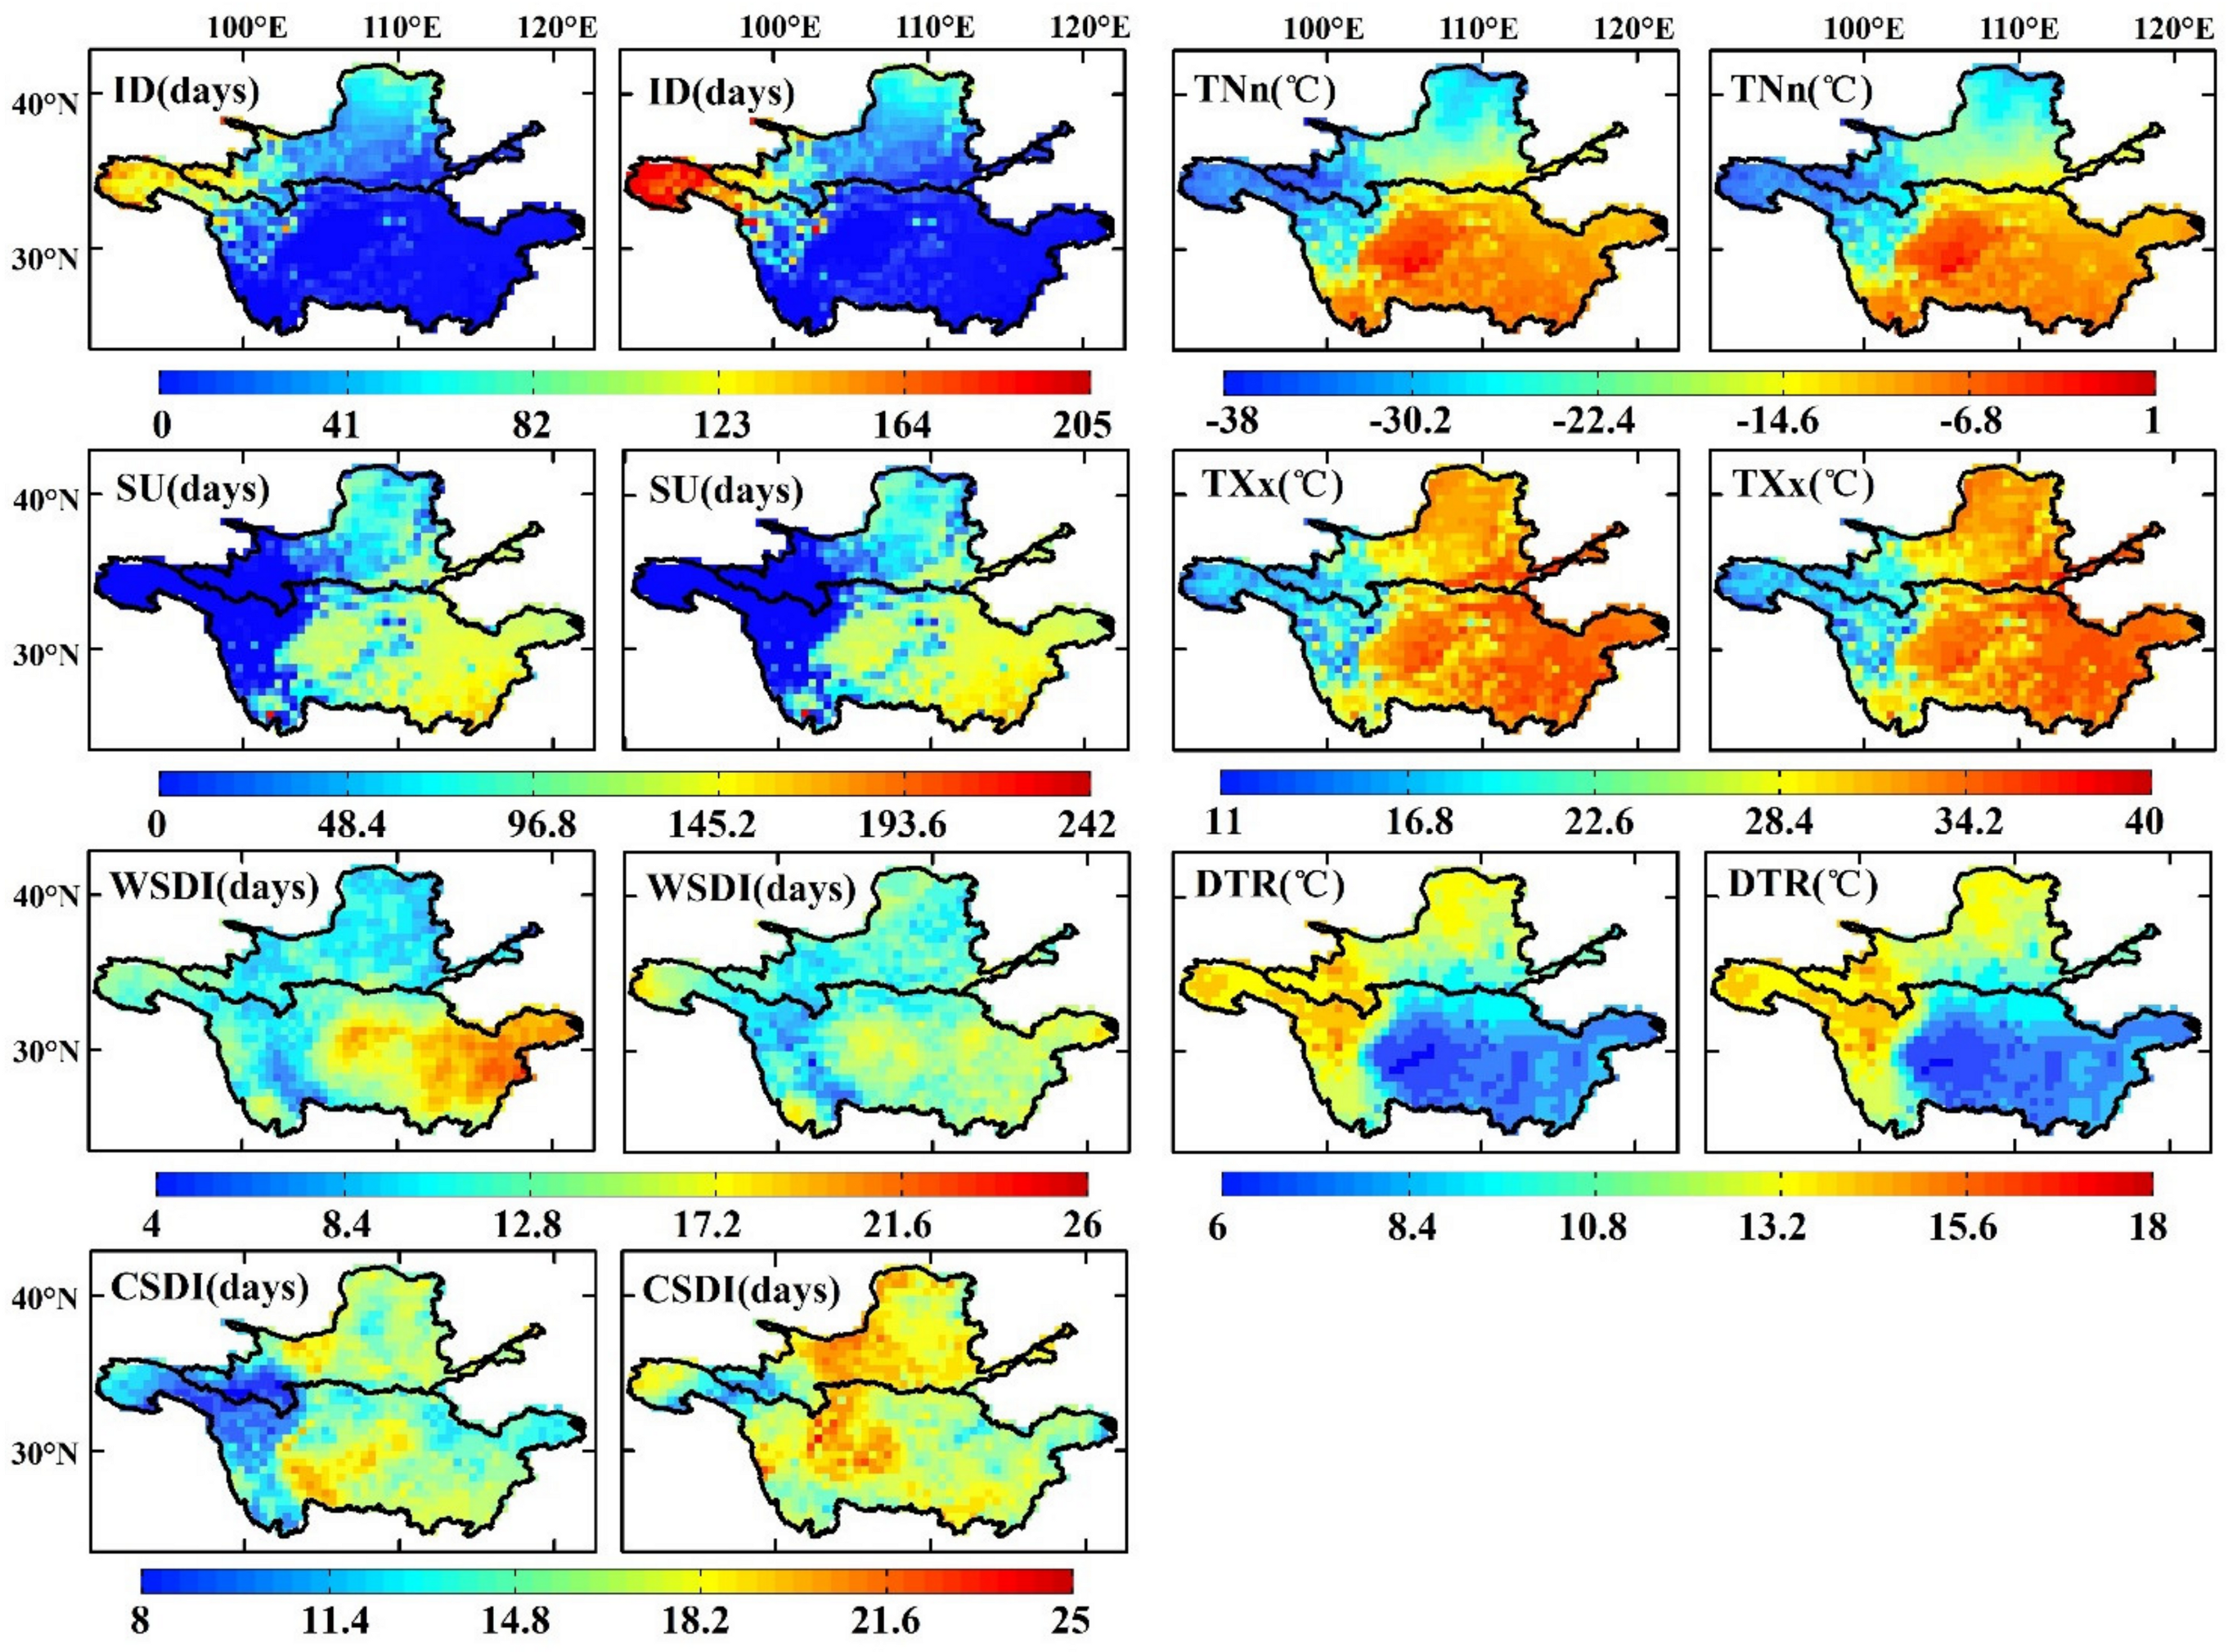
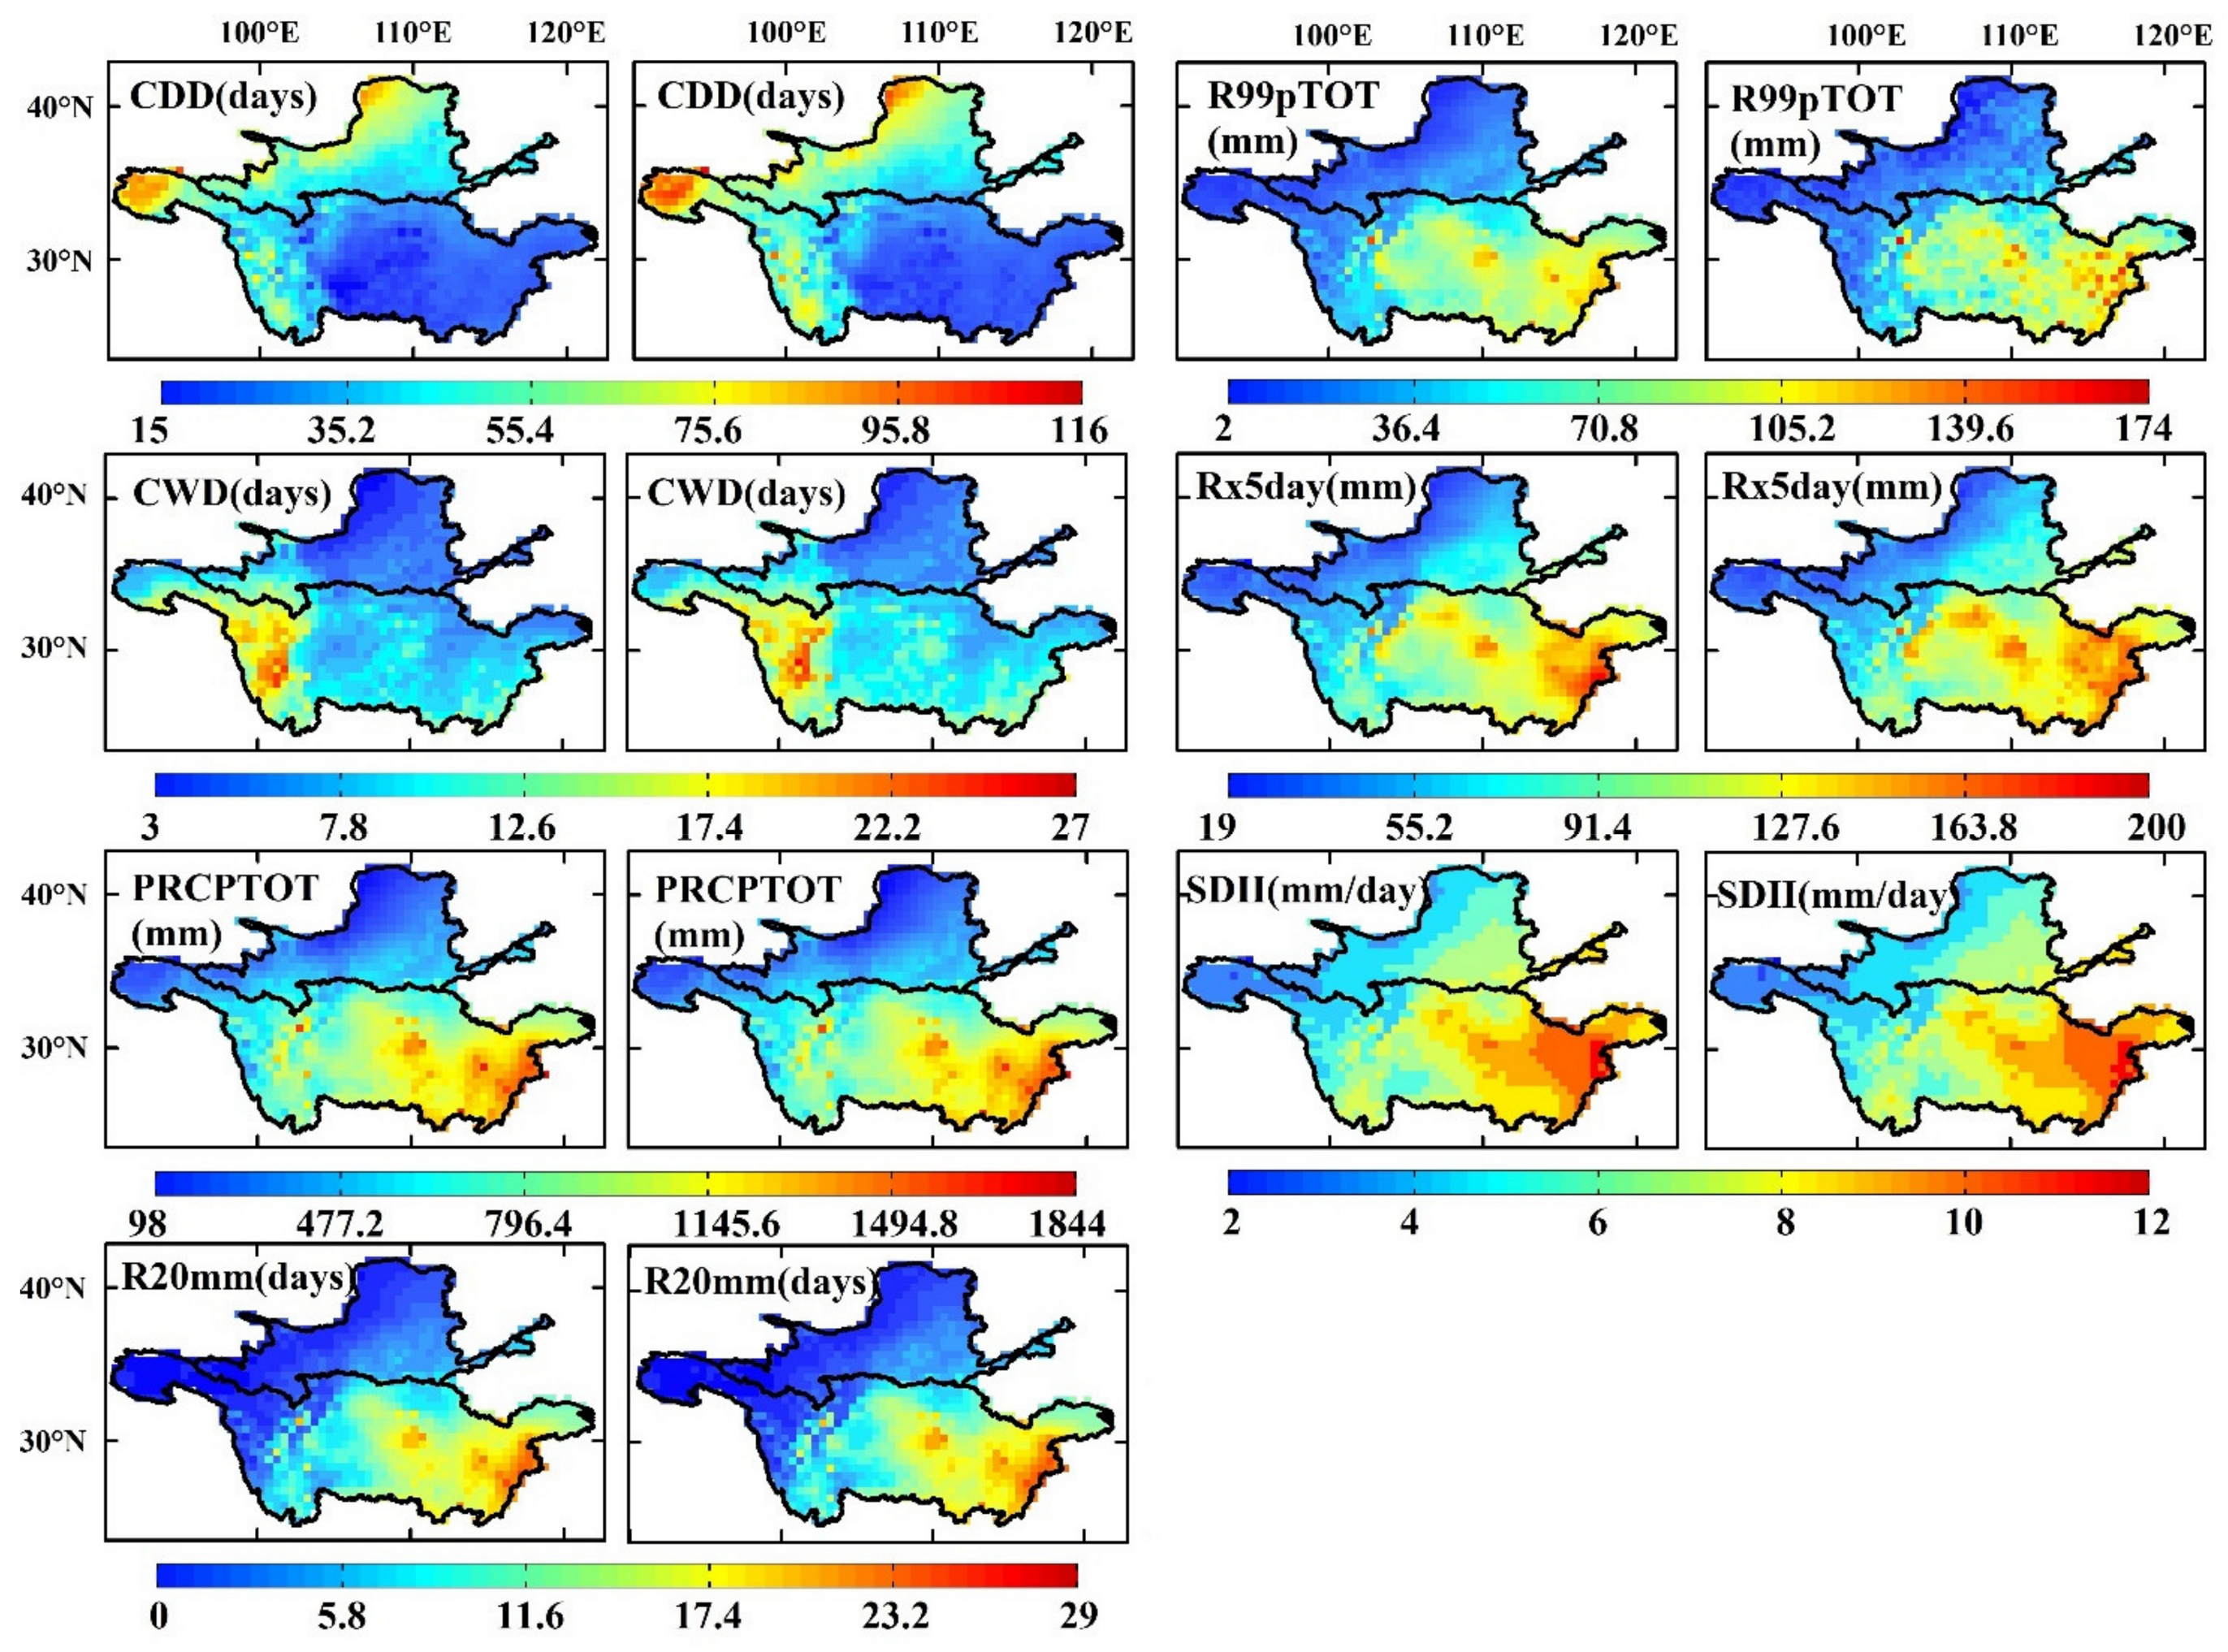
3.1. Spatial Distribution of the Multiyear Mean Extreme Climate Indices Based on the Observed Data
3.1.1. Extreme Temperature Indices
3.1.2. Extreme Precipitation Indices
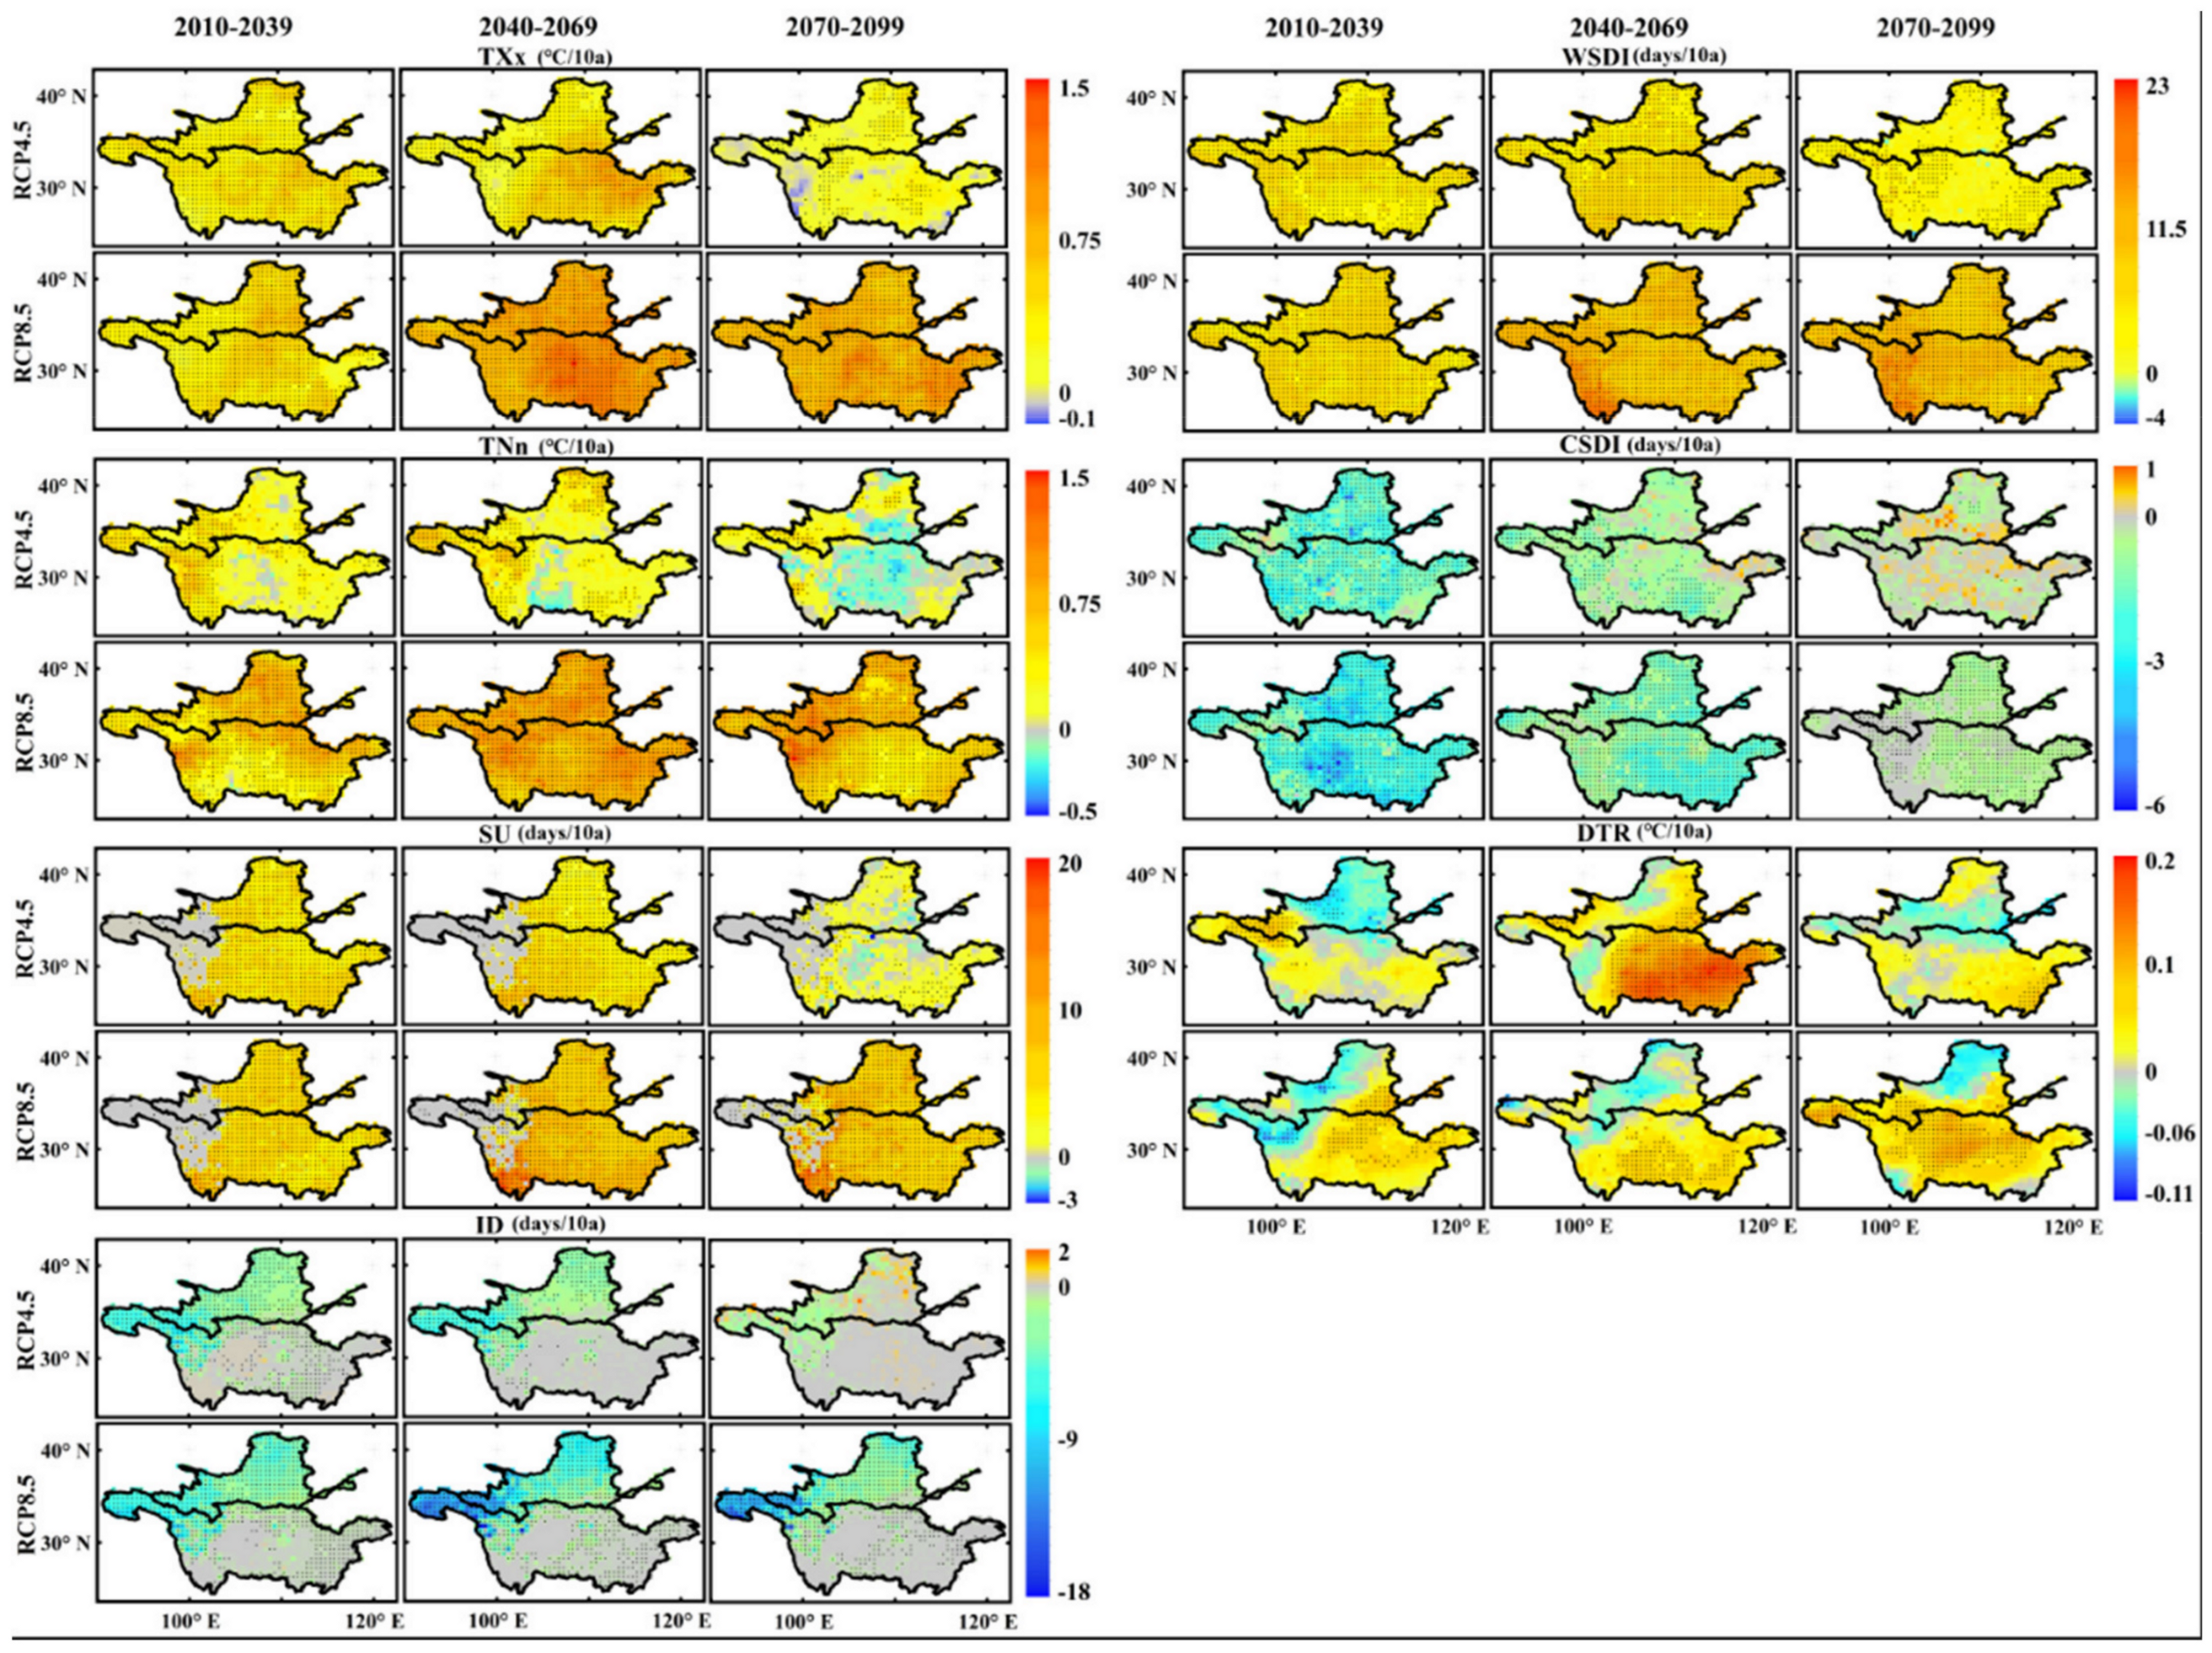
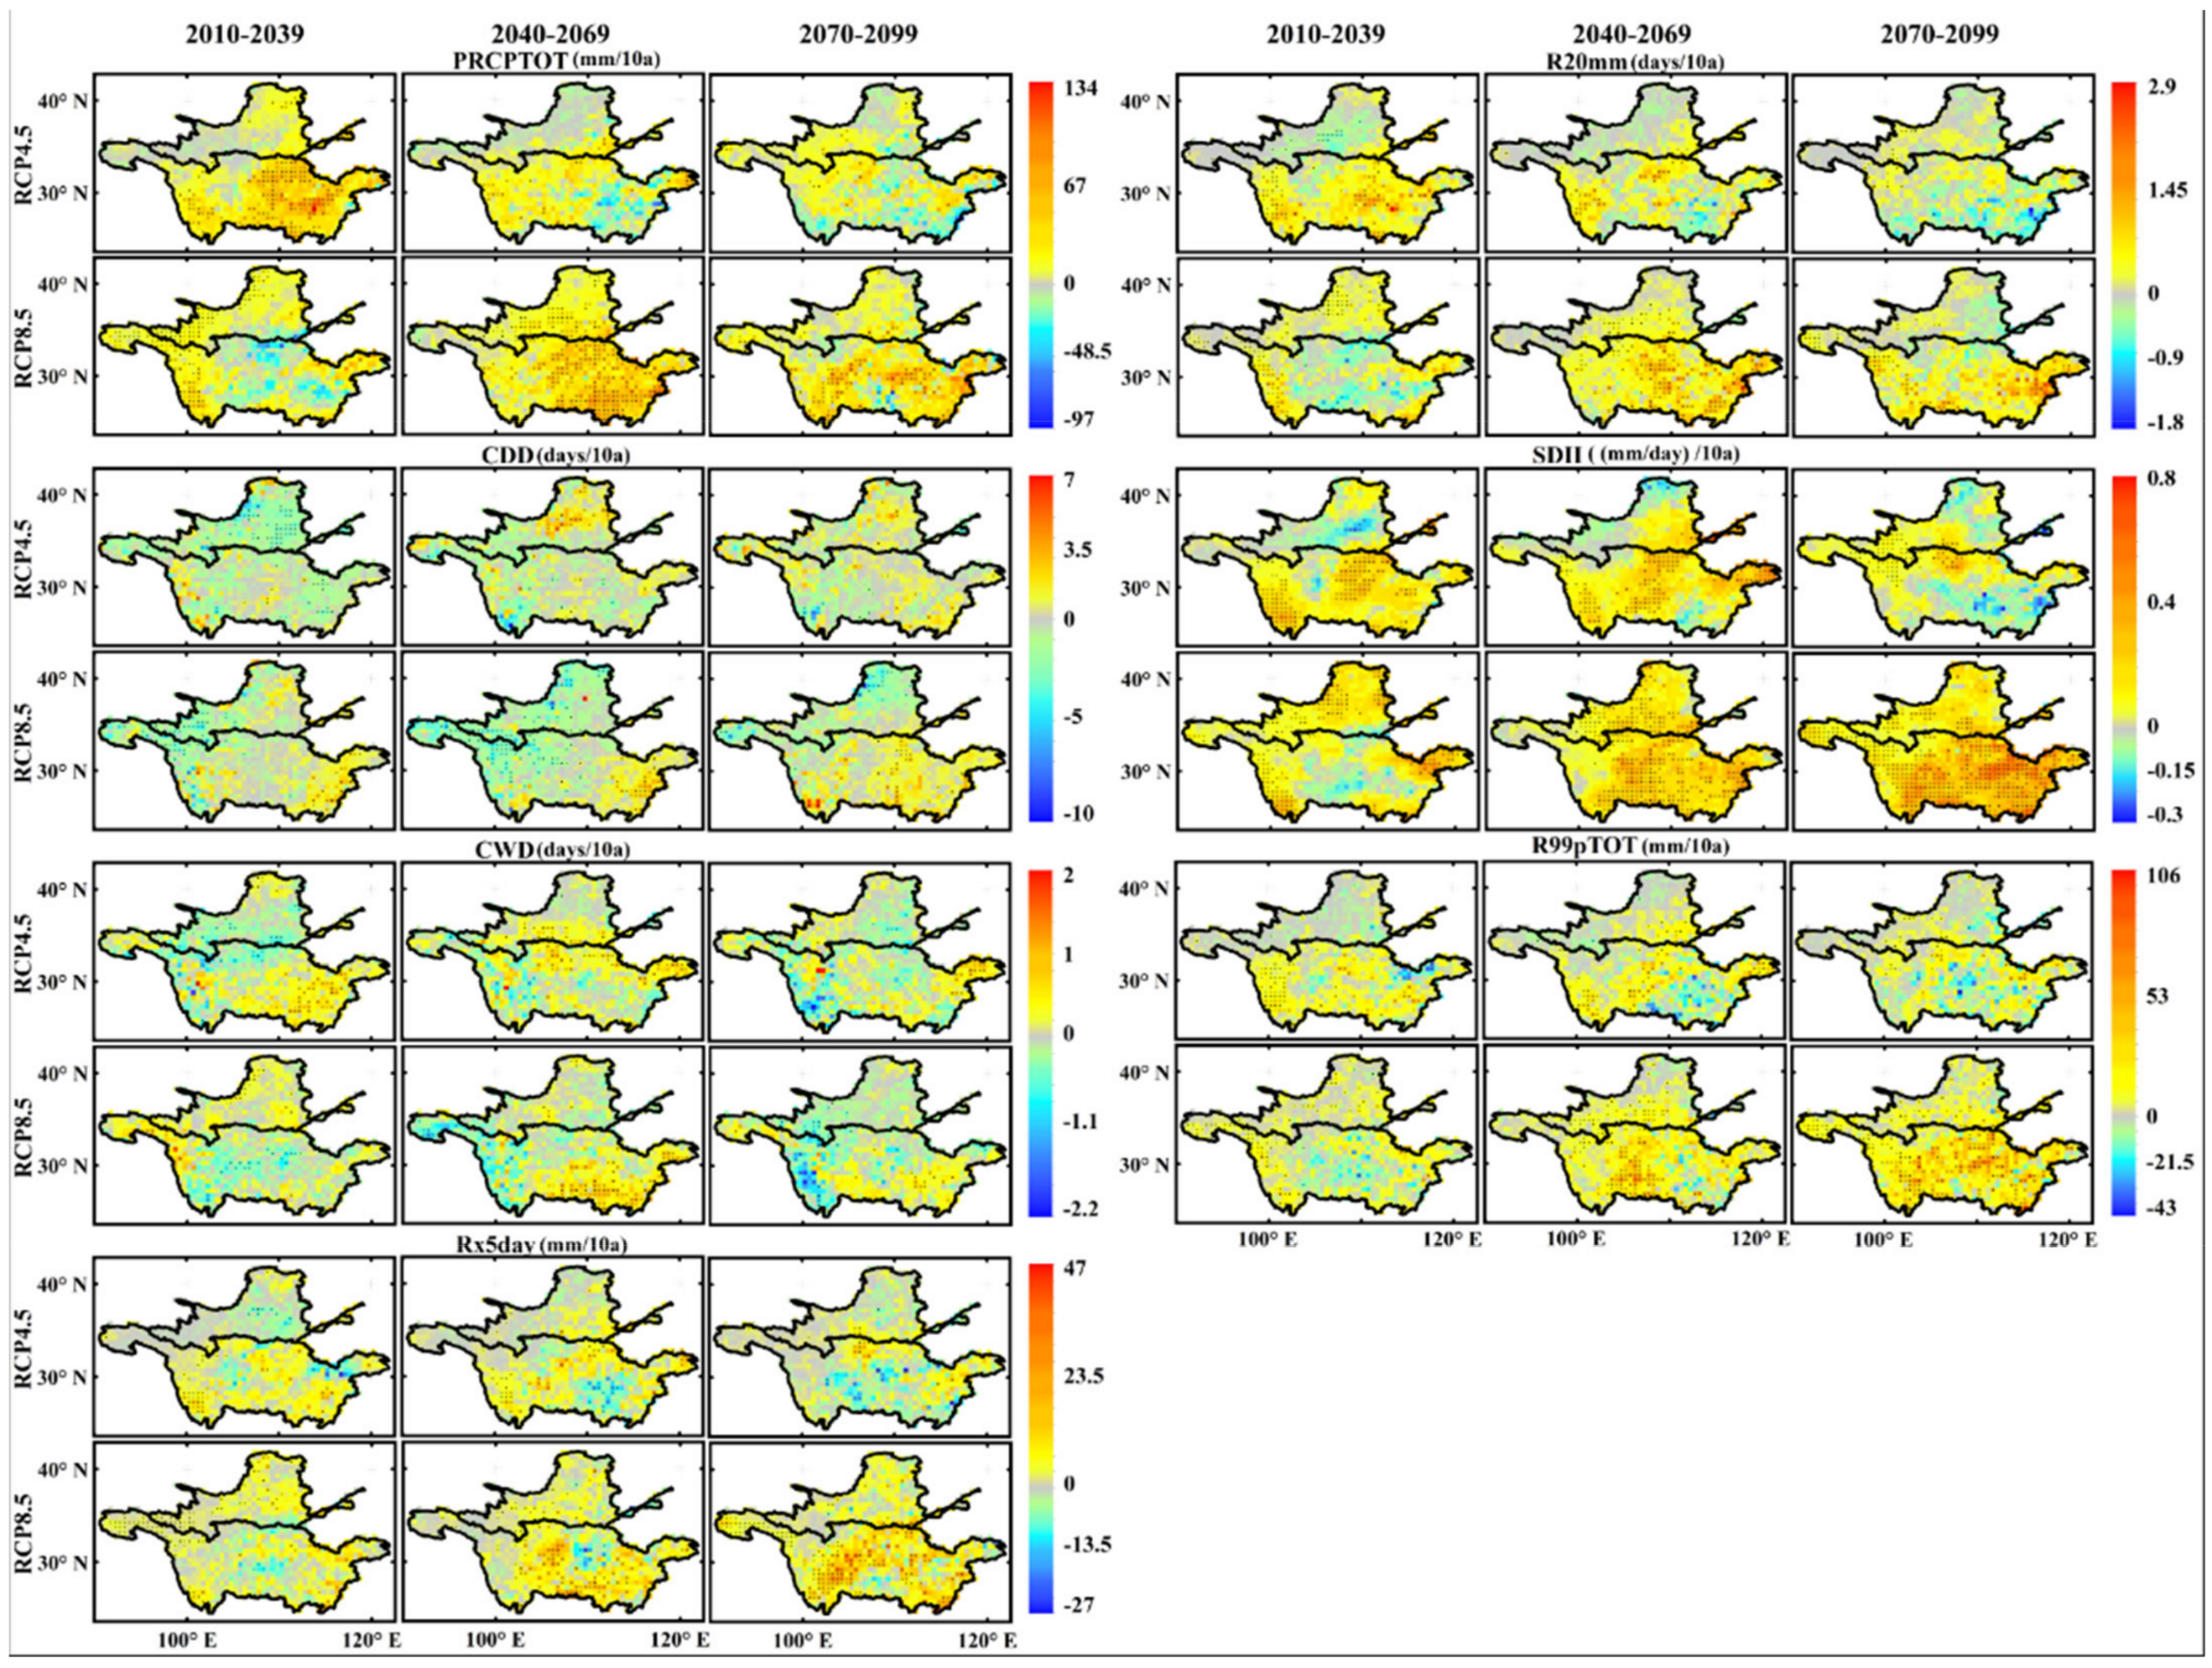
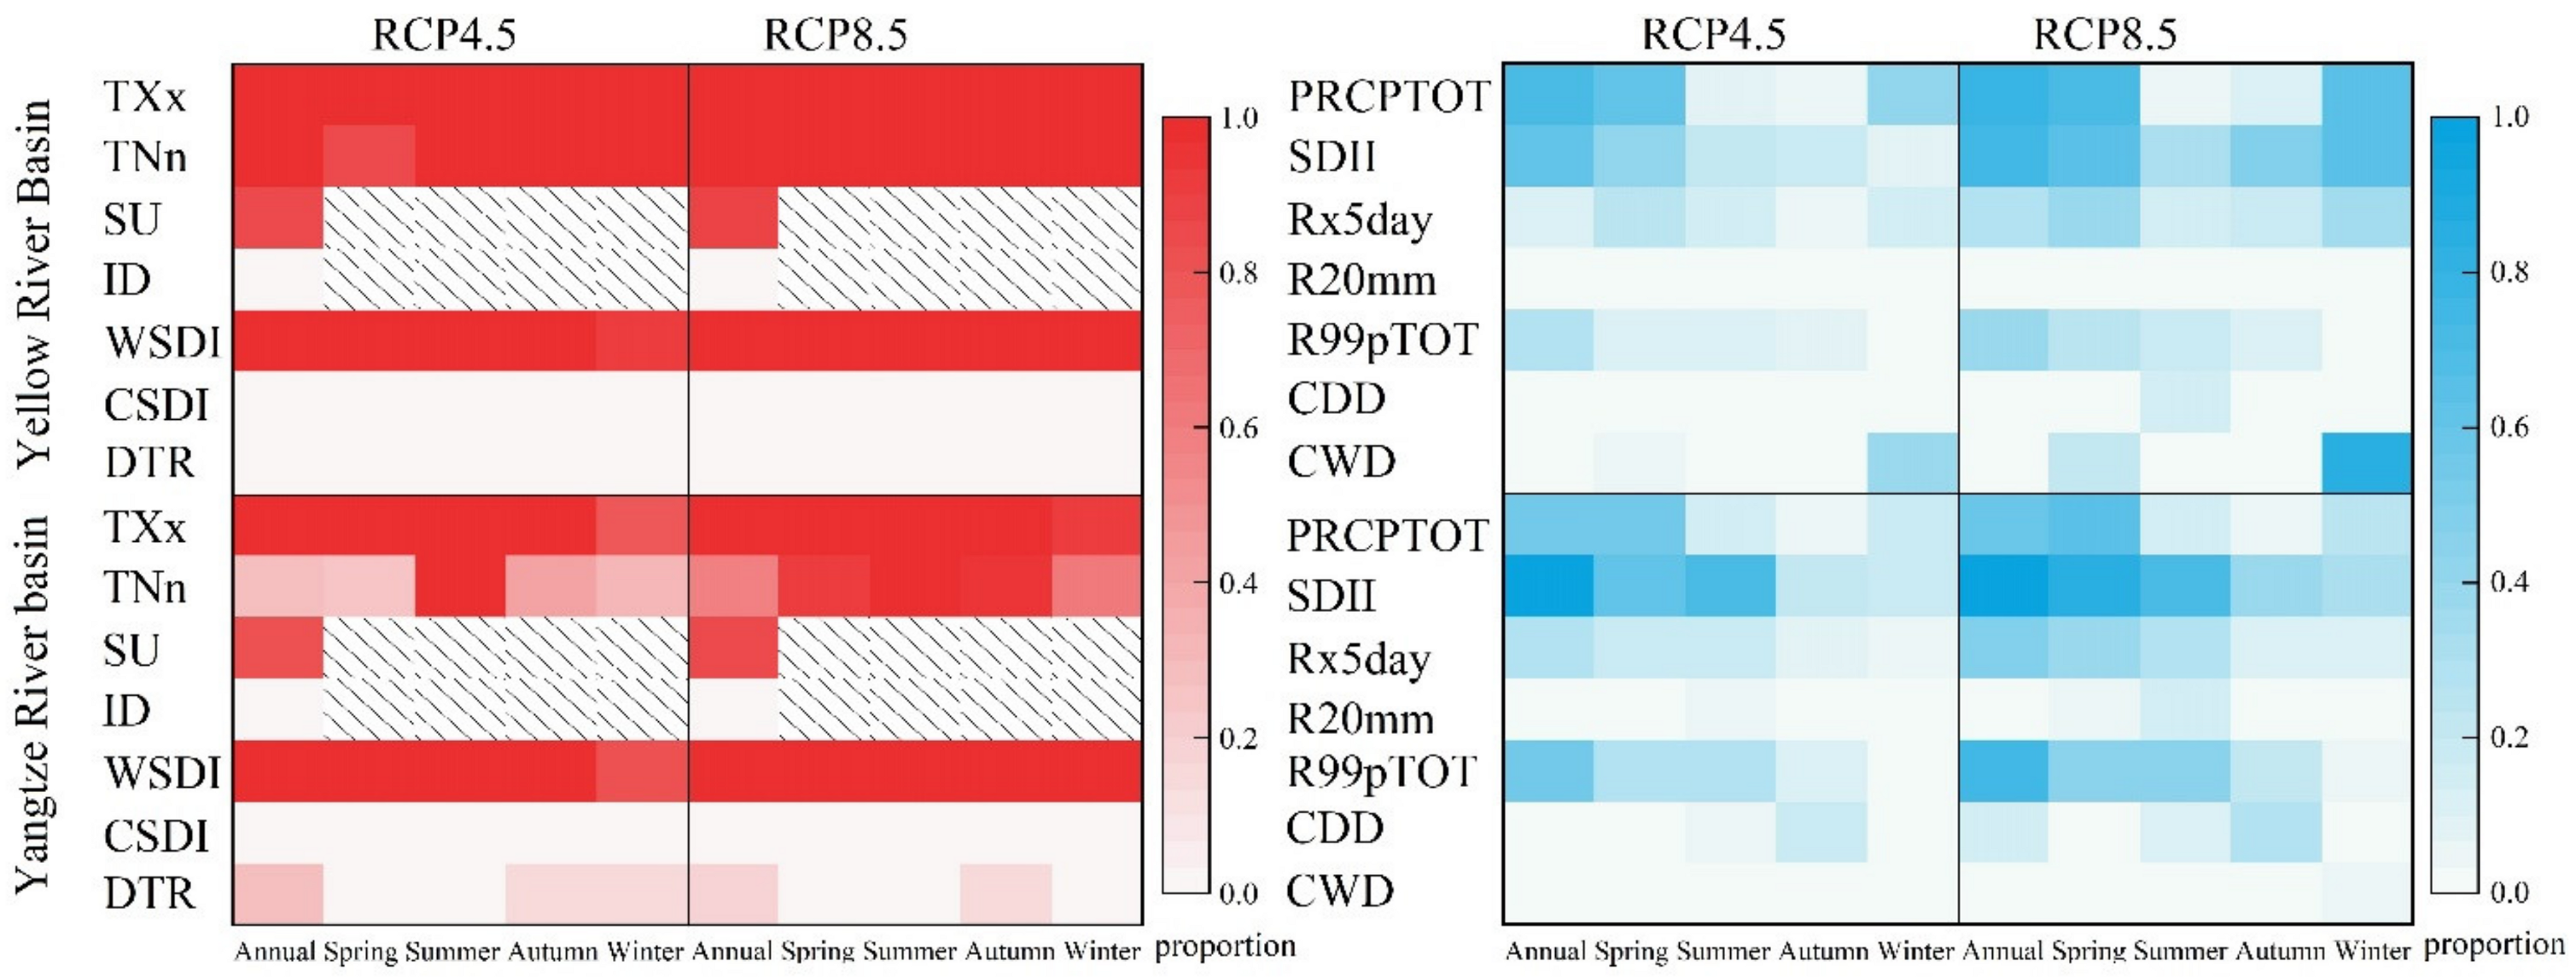
3.2. Future Changes in the Extreme Climate Indices under the RCP4.5 and RCP8.5 Scenarios
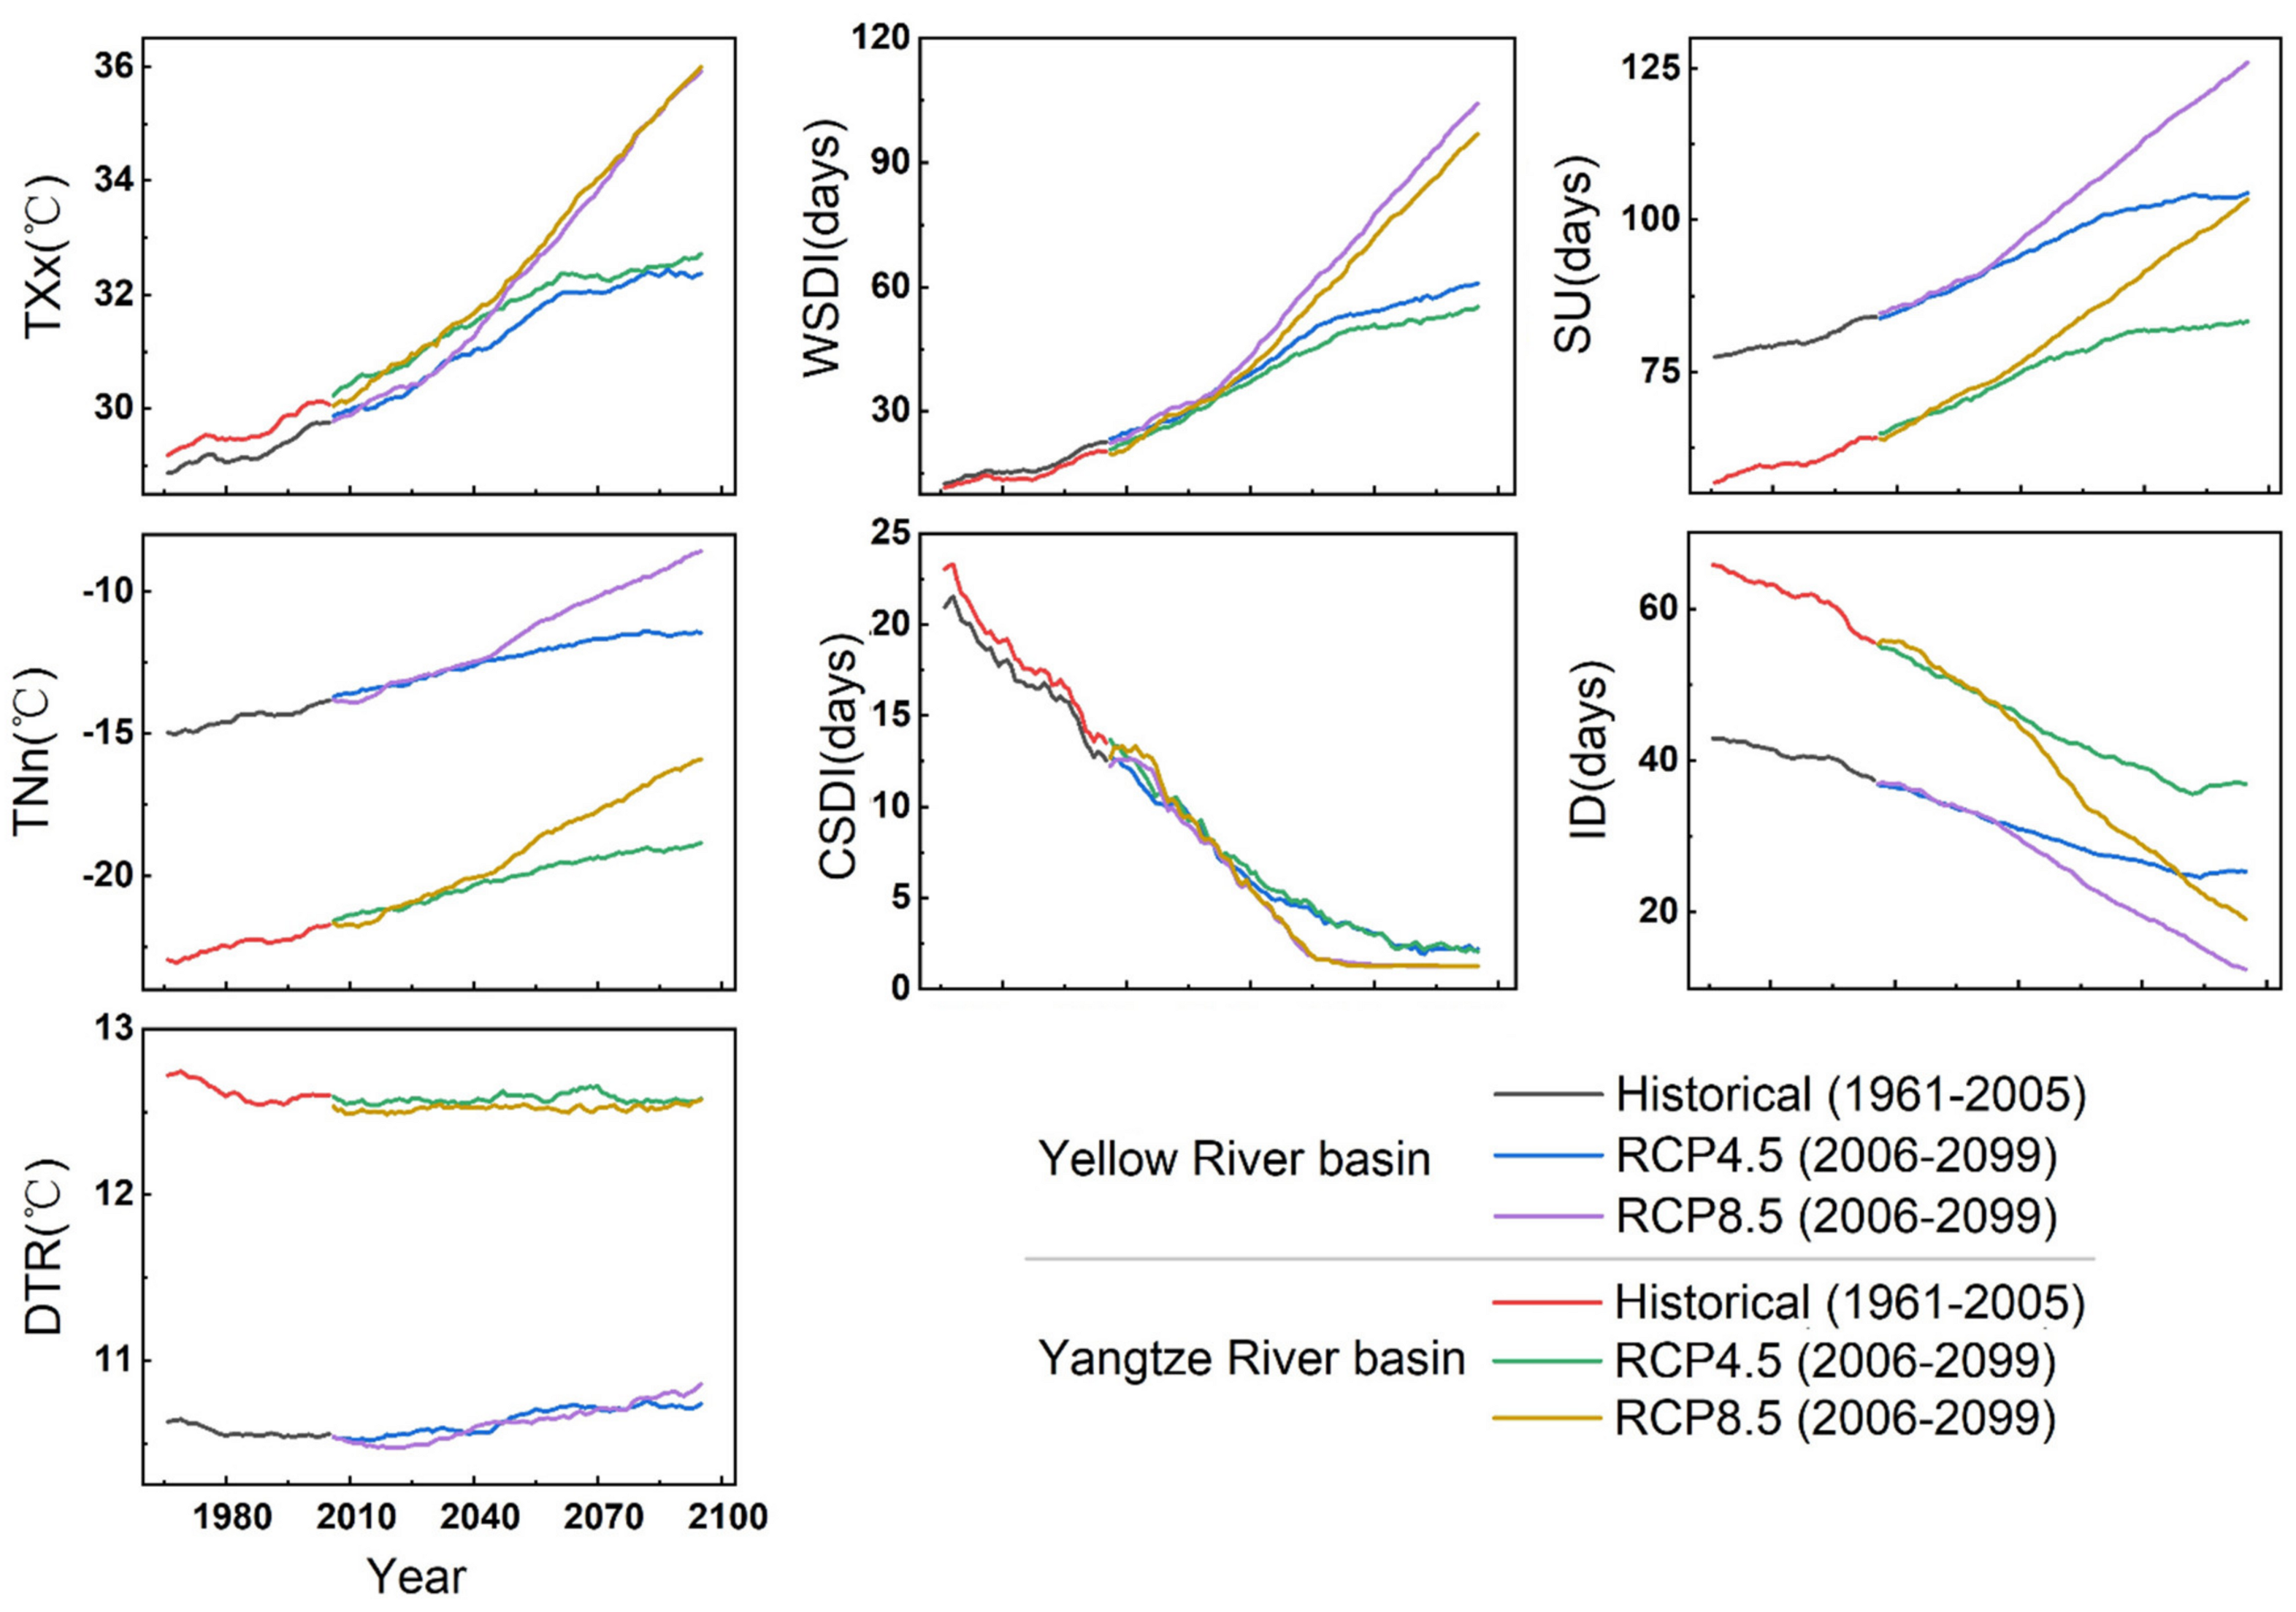
3.2.1. Extreme-Temperature Events
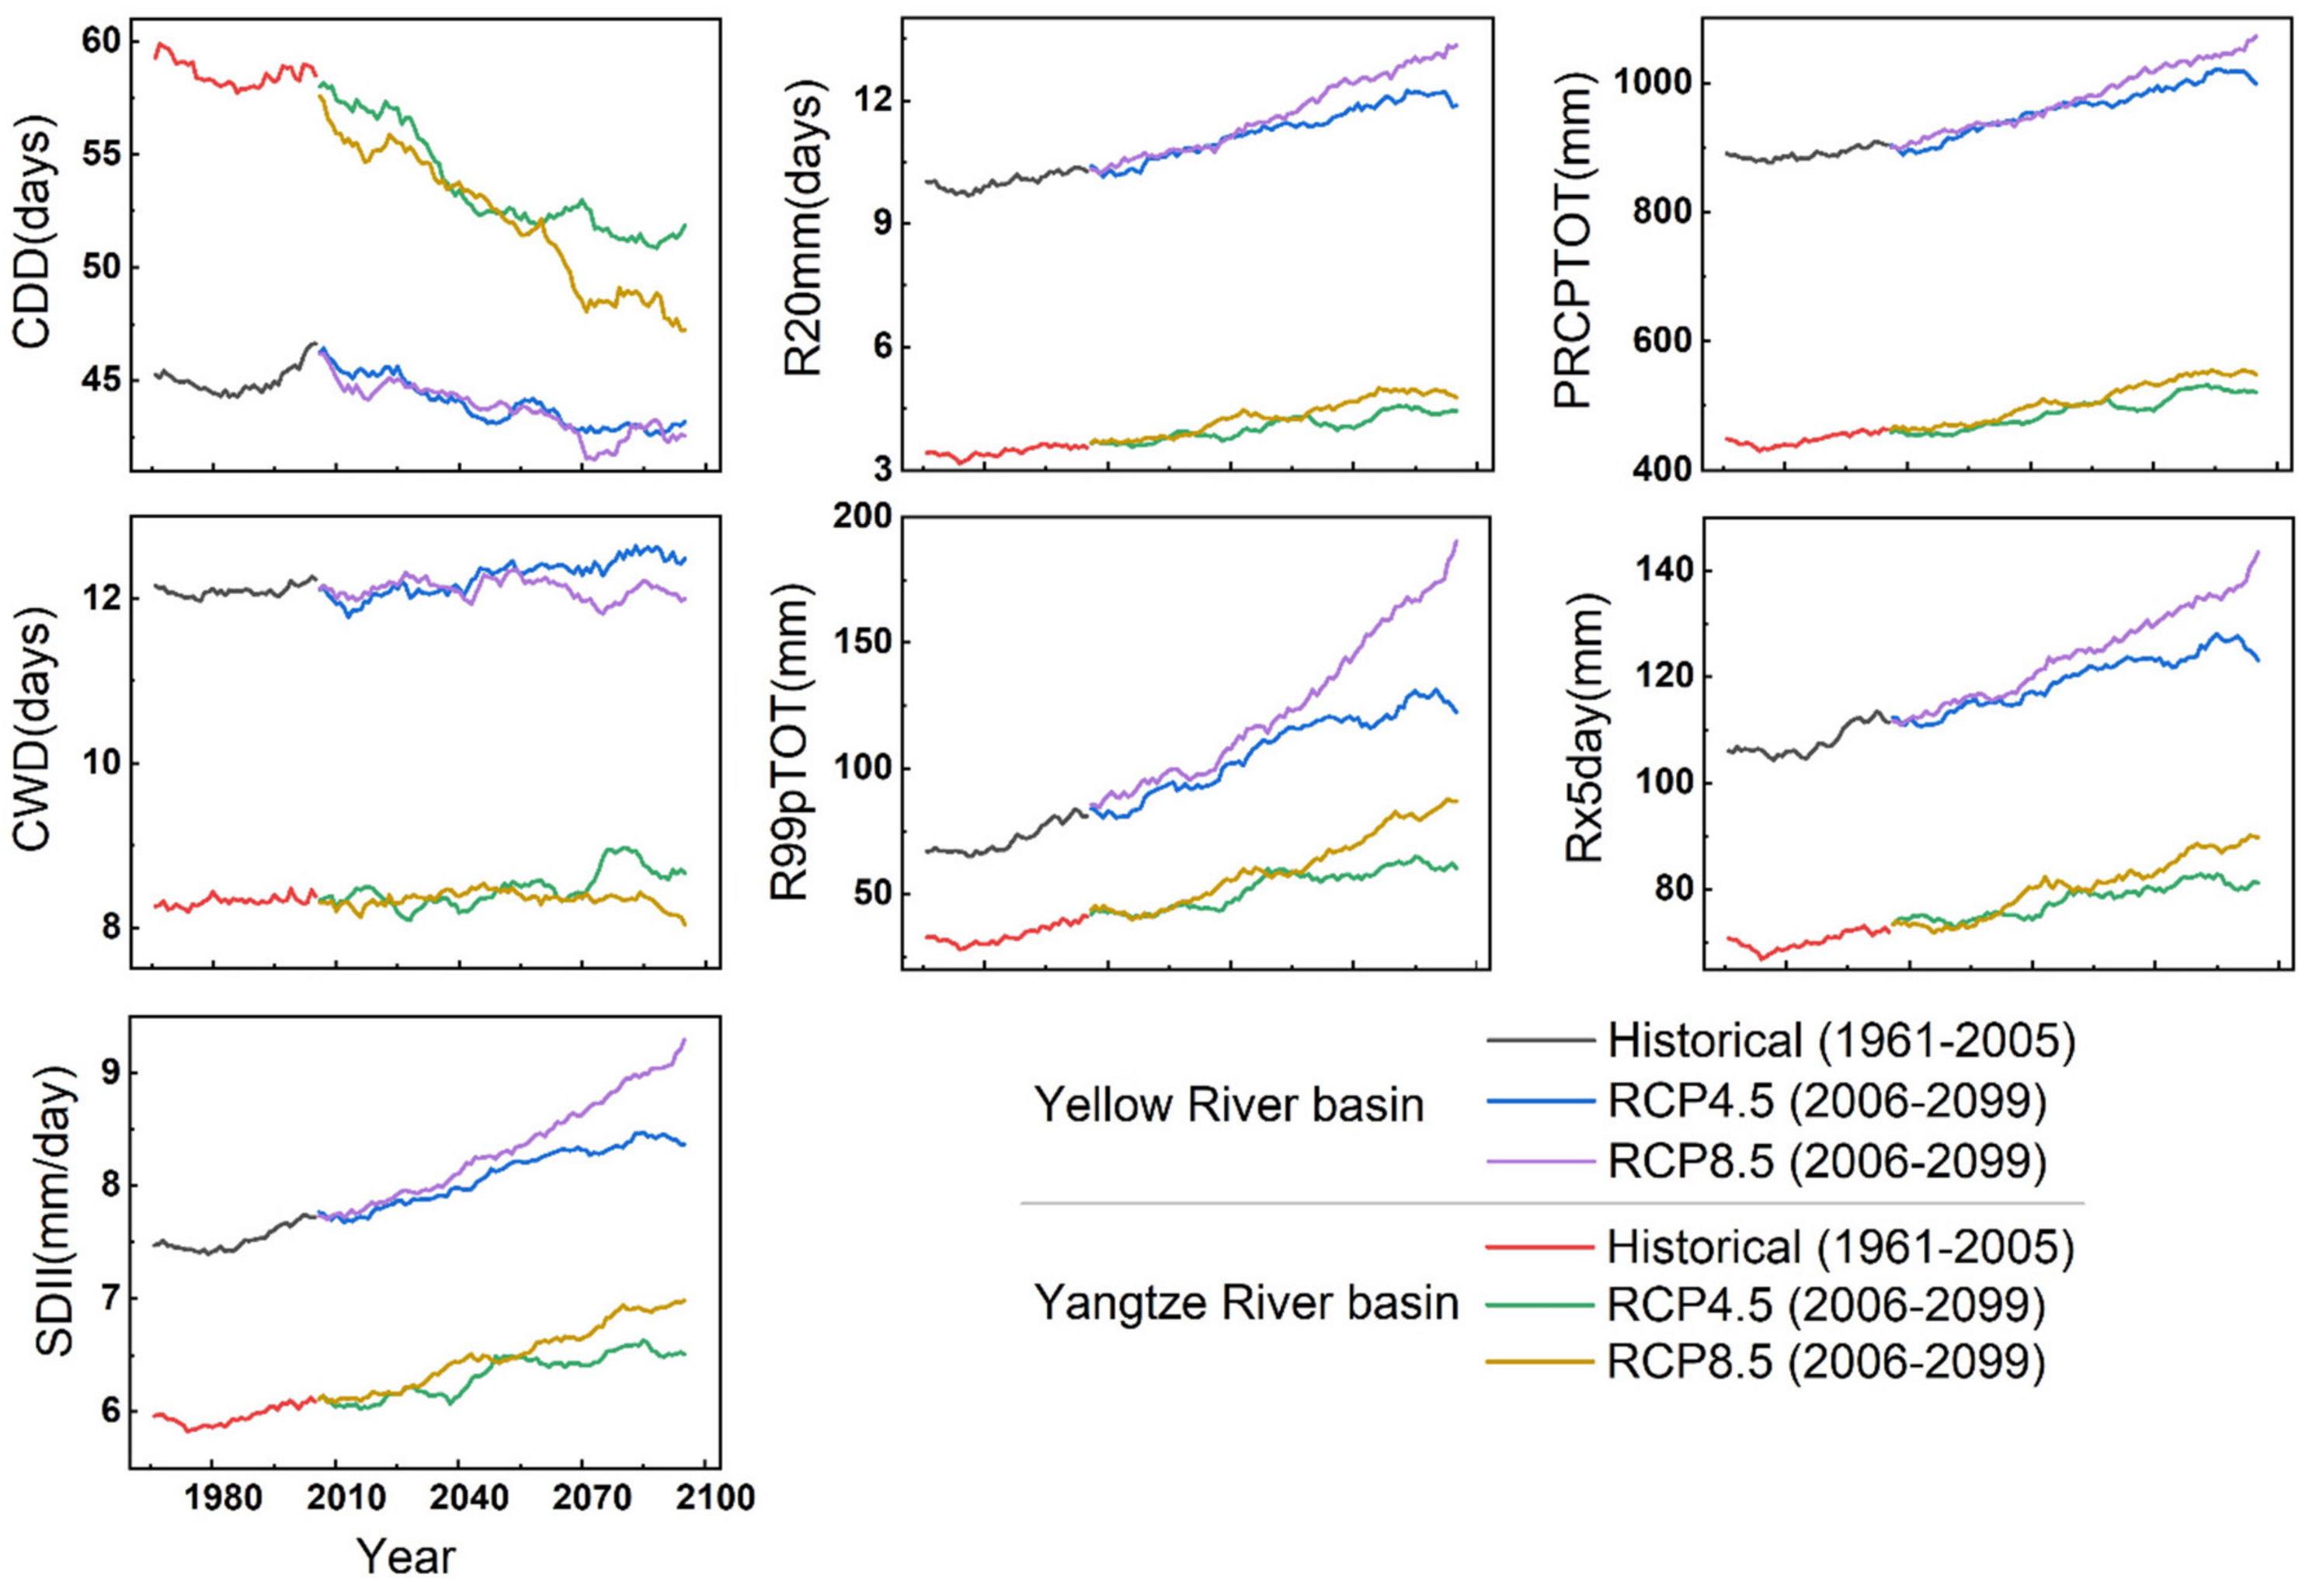
3.2.2. Extreme Precipitation Events
3.3. Long-Term Variations in the Extreme Climate Events in the YLRB and YZRB
4. Discussion
5. Conclusions
Author Contributions
Funding
Institutional Review Board Statement
Informed Consent Statement
Data Availability Statement
Acknowledgments
Conflicts of Interest
References
- Fischer, E.M.; Knutti, R. Anthropogenic contribution to global occurrence of heavy-precipitation and high-temperature ex-tremes. Nat. Clim. Change 2015, 5, 560–564. [Google Scholar] [CrossRef]
- Rusticucci, M.; Barrucand, M.; Collazo, S. Temperature extremes in the Argentina central region and their monthly relationship with the mean circulation and ENSO phases. Int. J. Clim. 2016, 37, 3003–3017. [Google Scholar] [CrossRef]
- Babalola, O.; Razzaque, A.; Bishai, D. Temperature extremes and infant mortality in Bangladesh: Hotter months, lower mortality. PLoS ONE 2018, 13, e0189252. [Google Scholar] [CrossRef] [PubMed]
- Aguilar, E.; Peterson, T.C.; Obando, P.R.; Frutos, R.; Retana, J.A.; Solera, M.; Soley, J.; García, I.G.; Araujo, R.M.; Santos, A.R.; et al. Changes in precipitation and temperature extremes in Central America and northern South America, 1961–2003. J. Geophys. Res. Space Phys. 2005, 110. [Google Scholar] [CrossRef]
- Field, C.B.; Barros, V.; Stocker, T.F.; Dahe, Q. Managing the Risks of Extreme Events and Disasters to Advance Climate Change Adaptation: Special Report of the Intergovernmental Panel on Climate Change; Cambridge University Press: Cambridge, UK, 2012; p. 109. [Google Scholar]
- Maxwell, S.L.; Butt, N.; Maron, M.; McAlpine, C.; Chapman, S.; Ullmann, A.; Segan, D.B.; Watson, J.E.M. Conservation implications of ecological responses to extreme weather and climate events. Divers. Distrib. 2018, 25, 613–625. [Google Scholar] [CrossRef]
- Rosenberg, E.A.; Keys, P.W.; Booth, D.; Hartley, D.; Burkey, J.; Steinemann, A.; Lettenmaier, D.P. Precipitation extremes and the impacts of climate change on stormwater infrastructure in Washington State. Clim. Chang. 2010, 102, 319–349. [Google Scholar] [CrossRef]
- Arnbjerg-Nielsen, K. Quantification of climate change effects on extreme precipitation used for high resolution hydrologic design. Urban Water J. 2012, 9, 57–65. [Google Scholar] [CrossRef]
- Xie, W.; Xiong, W.; Pan, J.; Ali, T.; Cui, Q.; Guan, D.; Meng, J.; Mueller, N.D.; Lin, E.; Davis, S.J. Decreases in global beer supply due to extreme drought and heat. Nat. Plants 2018, 4, 964–973. [Google Scholar] [CrossRef] [PubMed]
- Sun, Q.; Miao, C.; Duan, Q. Extreme climate events and agricultural climate indices in China: CMIP5 model evaluation and projections. Int. J. Clim. 2015, 36, 43–61. [Google Scholar] [CrossRef]
- Wang, Z.; Lin, L.; Zhang, X.; Zhang, H.; Liu, L.; Xu, Y. Scenario dependence of future changes in climate extremes under 1.5 °C and 2 °C global warming. Sci. Rep. 2017, 9, 46432. [Google Scholar] [CrossRef]
- Meng, C.; Xu, Y.; Li, Q.; Ma, Y.; Feng, Q.; Ma, W.; Pan, J.; Li, K. Analyses of observed features and future trend of extreme temperature events in Inner Mongolia of China. Theor. Appl. Clim. 2019, 139, 577–597. [Google Scholar] [CrossRef]
- Ying, H.; Zhang, H.; Zhao, J.; Shan, Y.; Zhang, Z.; Guo, X.; Rihan, W.; Deng, G. Effects of spring and summer extreme climate events on the autumn phenology of different vegetation types of Inner Mongolia, China, from 1982 to 2015. Ecol. Indic. 2020, 111, 105974. [Google Scholar] [CrossRef]
- Pendergrass, A.G. What precipitation is extreme? Science 2018, 360, 1072–1073. [Google Scholar] [CrossRef]
- Dong, S.; Sun, Y.; Aguilar, E.; Zhang, X.; Peterson, T.C.; Song, L.; Zhang, Y. Observed changes in temperature extremes over Asia and their attribution. Clim. Dyn. 2018, 51, 339–353. [Google Scholar] [CrossRef]
- Guo, J.; Huang, G.; Wang, X.; Li, Y.; Lin, Q. Dynamically-downscaled projections of changes in temperature extremes over China. Clim. Dyn. 2017, 50, 1045–1066. [Google Scholar] [CrossRef]
- Taylor, K.E.; Stouffer, R.J.; Meehl, G.A. An Overview of CMIP5 and the Experiment Design. Bull. Am. Meteorol. Soc. 2012, 93, 485–498. [Google Scholar] [CrossRef]
- Nastos, P.; Kapsomenakis, J. Regional climate model simulations of extreme air temperature in Greece. Abnormal or common records in the future climate? Atmos. Res. 2015, 152, 43–60. [Google Scholar] [CrossRef]
- Panda, D.K.; Panigrahi, P.; Mohanty, S.; Mohanty, R.; Sethi, R. The 20th century transitions in basic and extreme monsoon rainfall indices in India: Comparison of the ETCCDI indices. Atmos. Res. 2016, 181, 220–235. [Google Scholar] [CrossRef]
- Sillmann, J.; Kharin, V.V.; Zhang, X.; Zwiers, F.W.; Bronaugh, D. Climate extremes indices in the CMIP5 multimodel en-semble: Part 1. Model evaluation in the present climate. J. Geophys. Res. Atmos. 2013, 118, 1716–1733. [Google Scholar] [CrossRef]
- Sillmann, J.; Kharin, V.V.; Zwiers, F.W.; Zhang, X.; Bronaugh, D. Climate extremes indices in the CMIP5 multimodel en-semble: Part 2. Future climate projections. J. Geophys. Res. Atmos. 2013, 118, 2473–2493. [Google Scholar] [CrossRef]
- Kharel, G.; Kirilenko, A. Comparing CMIP-3 and CMIP-5 climate projections on flooding estimation of Devils Lake of North Dakota, USA. PeerJ 2018, 6, e4711. [Google Scholar] [CrossRef]
- IPCC, W. Working Group I Contribution to the IPCC Fifth Assessment Report. Climate Change 2013: The Physical Science Basis, Summary for Policymakers; IPCC: Geneva, Switzerland, 2013. [Google Scholar]
- Keggenhoff, I.; Elizbarashvili, M.; Amiri-Farahani, A.; King, L. Trends in daily temperature and precipitation extremes over Georgia, 1971–2010. Weather. Clim. Extrem. 2014, 4, 75–85. [Google Scholar] [CrossRef]
- Popov, T.; Gnjato, S.; Trbić, G.; Ivanišević, M. Recent Trends in Extreme Temperature Indices in Bosnia and Herzegovina. Carpathian J. Earth Environ. Sci. 2017, 13, 211–224. [Google Scholar] [CrossRef]
- Donat, M.G.; Lowry, A.L.; Alexander, L.V.; O’Gorman, P.A.; Maher, N. More extreme precipitation in the world’s dry and wet regions. Nat. Clim. Chang. 2016, 6, 508–513. [Google Scholar] [CrossRef]
- Pfahl, S.; O’Gorman, P.A.; Fischer, E.M. Understanding the regional pattern of projected future changes in extreme precipi-tation. Nat. Clim. Change 2017, 7, 423–427. [Google Scholar] [CrossRef]
- Huang, H.; Winter, J.M.; Osterberg, E.C.; Horton, R.M.; Beckage, B. Total and Extreme Precipitation Changes over the Northeastern United States. J. Hydrometeorol. 2017, 18, 1783–1798. [Google Scholar] [CrossRef]
- Raghavendra, A.; Dai, A.; Milrad, S.M.; Cloutier-Bisbee, S.R. Floridian heatwaves and extreme precipitation: Future climate projections. Clim. Dyn. 2018, 52, 495–508. [Google Scholar] [CrossRef]
- Limsakul, A.; Singhruck, P. Long-term trends and variability of total and extreme precipitation in Thailand. Atmos. Res. 2016, 169, 301–317. [Google Scholar] [CrossRef]
- Mukherjee, S.; Aadhar, S.; Stone, D.; Mishra, V. Increase in extreme precipitation events under anthropogenic warming in India. Weather. Clim. Extrem. 2018, 20, 45–53. [Google Scholar] [CrossRef]
- Gao, M.; Zheng, H. Nonstationary extreme value analysis of temperature extremes in China. Stoch. Environ. Res. Risk Assess. 2017, 32, 1299–1315. [Google Scholar] [CrossRef]
- Zhang, Q.; Zheng, Y.; Singh, V.P.; Luo, M.; Xie, Z. Summer extreme precipitation in eastern China: Mechanisms and impacts. J. Geophys. Res. Atmos. 2017, 122, 2766–2778. [Google Scholar] [CrossRef]
- Liu, S.; Huang, S.; Huang, Q.; Xie, Y.; Leng, G.; Luan, J.; Song, X.; Wei, X.; Li, X. Identification of the non-stationarity of extreme precipitation events and correlations with large-scale ocean-atmospheric circulation patterns: A case study in the Wei River Basin, China. J. Hydrol. 2017, 548, 184–195. [Google Scholar] [CrossRef]
- Gao, Y.; Xiao, L.; Chen, D.; Xu, J.; Zhang, H. Comparison between past and future extreme precipitations simulated by global and regional climate models over the Tibetan Plateau. Int. J. Clim. 2018, 38, 1285–1297. [Google Scholar] [CrossRef]
- Zhang, Q.; Gu, X.; Li, J.; Shi, P.; Singh, V.P. The Impact of Tropical Cyclones on Extreme Precipitation over Coastal and Inland Areas of China and Its Association to ENSO. J. Clim. 2018, 31, 1865–1880. [Google Scholar] [CrossRef]
- Shi, J.; Cui, L.; Wen, K.; Tian, Z.; Wei, P.; Zhang, B. Trends in the consecutive days of temperature and precipitation extremes in China during 1961–2015. Environ. Res. 2018, 161, 381–391. [Google Scholar] [CrossRef]
- Wu, X.; Hao, Z.; Hao, F.; Zhang, X. Variations of compound precipitation and temperature extremes in China during 1961–2014. Sci. Total. Environ. 2019, 663, 731–737. [Google Scholar] [CrossRef]
- Sun, S.; Chen, H.; Li, J.; Wei, J.; Wang, G.; Sun, G.; Hua, W.; Zhou, S.; Deng, P. Dependence of 3-month Standardized Precipitation-Evapotranspiration Index dryness/wetness sensitivity on climatological precipitation over southwest China. Int. J. Clim. 2018, 38, 4568–4578. [Google Scholar] [CrossRef]
- Xu, M.; Kang, S.; Wu, H.; Yuan, X. Detection of spatio-temporal variability of air temperature and precipitation based on long-term meteorological station observations over Tianshan Mountains, Central Asia. Atmos. Res. 2018, 203, 141–163. [Google Scholar] [CrossRef]
- Gao, T.; Wang, H.J.; Zhou, T. Changes of extreme precipitation and nonlinear influence of climate variables over monsoon region in China. Atmos. Res. 2017, 197, 379–389. [Google Scholar] [CrossRef]
- Xiao, M.; Zhang, Q.; Singh, V.P. Spatiotemporal variations of extreme precipitation regimes during 1961–2010 and possible teleconnections with climate indices across China. Int. J. Clim. 2016, 37, 468–479. [Google Scholar] [CrossRef]
- Wu, X.; Guo, S.; Yin, J.; Yang, G.; Zhong, Y.; Liu, D. On the event-based extreme precipitation across China: Time distribution patterns, trends, and return levels. J. Hydrol. 2018, 562, 305–317. [Google Scholar] [CrossRef]
- Li, L.; Yao, N.; Li, Y.; Liu, D.L.; Wang, B.; Ayantobo, O.O. Future projections of extreme temperature events in different sub-regions of China. Atmos. Res. 2019, 217, 150–164. [Google Scholar] [CrossRef]
- Wang, G.; Wang, D.; Trenberth, K.E.; Erfanian, A.; Yu, M.; Bosilovich, M.G.; Parr, D.T. The peak structure and future changes of the relationships between extreme precipitation and temperature. Nat. Clim. Chang. 2017, 7, 268–274. [Google Scholar] [CrossRef]
- Zhu, J.; Huang, G.; Wang, X.; Cheng, G.; Wu, Y. High-resolution projections of mean and extreme precipitations over China through PRECIS under RCPs. Clim. Dyn. 2017, 50, 4037–4060. [Google Scholar] [CrossRef]
- Li, J.; Zhang, L.; Shi, X.; Chen, Y.D. Response of long-term water availability to more extreme climate in the Pearl River Basin, China. Int. J. Clim. 2017, 37, 3223–3237. [Google Scholar] [CrossRef]
- Li, R.-X.; Sun, J.-Q. Interdecadal variability of the large-scale extreme hot event frequency over the middle and lower reaches of the Yangtze River basin and its related atmospheric patterns. Atmos. Ocean. Sci. Lett. 2018, 11, 63–70. [Google Scholar] [CrossRef]
- Wei, L.; Xin, X.; Xiao, C.; Li, Y.; Wu, Y.; Tang, H. Performance of BCC-CSM Models with Different Horizontal Resolutions in Simulating Extreme Climate Events in China. J. Meteorol. Res. 2019, 33, 720–733. [Google Scholar] [CrossRef]
- Zhang, Q.; Xu, C.-Y.; Becker, S.; Jiang, T. Sediment and runoff changes in the Yangtze River basin during past 50 years. J. Hydrol. 2006, 331, 511–523. [Google Scholar] [CrossRef]
- Wang, Q.; Zhang, M.; Wang, S.; Ma, Q.; Sun, M. Changes in temperature extremes in the Yangtze River Basin, 1962–2011. J. Geogr. Sci. 2013, 24, 59–75. [Google Scholar] [CrossRef]
- Fang, Q.X.; Ma, L.; Green, T.R.; Yu, Q.; Wang, T.D.; Ahuja, L.R. Water resources and water use efficiency in the North China Plain: Current status and agronomic management options. Agric. Water Manag. 2010, 97, 1102–1116. [Google Scholar] [CrossRef]
- Wang, J.; Yang, B.; Ljungqvist, F.C.; Zhao, Y. The relationship between the Atlantic Multidecadal Oscillation and temperature variability in China during the last millennium. J. Quat. Sci. 2013, 28, 653–658. [Google Scholar] [CrossRef]
- Liang, K.; Bai, P.; Li, J.; Liu, C. Variability of temperature extremes in the Yellow River basin during 1961–2011. Quat. Int. 2014, 336, 52–64. [Google Scholar] [CrossRef]
- Guan, Y.; Zhang, X.; Zheng, F.; Wang, B. Trends and variability of daily temperature extremes during 1960–2012 in the Yangtze River Basin, China. Glob. Planet. Chang. 2015, 124, 79–94. [Google Scholar] [CrossRef]
- Guan, Y.; Zheng, F.; Zhang, X.; Wang, B. Trends and variability of daily precipitation and extremes during 1960–2012 in the Yangtze River Basin, China. Int. J. Clim. 2016, 37, 1282–1298. [Google Scholar] [CrossRef]
- Tang, X.; Miao, C.; Xi, Y.; Duan, Q.; Lei, X.; Li, H. Analysis of precipitation characteristics on the loess plateau between 1965 and 2014, based on high-density gauge observations. Atmos. Res. 2018, 213, 264–274. [Google Scholar] [CrossRef]
- Niu, Z.; Wang, L.; Fang, L.; Li, J.; Yao, R. Analysis of spatiotemporal variability in temperature extremes in the Yellow and Yangtze River basins during 1961–2014 based on high-density gauge observations. Int. J. Clim. 2020, 40, 1–21. [Google Scholar] [CrossRef]
- Yuan, Q.; Li, W.; Zhou, S.; Yang, L.; Chi, J.; Sui, X.; Wang, W. Integrated evaluation of aerosols during haze-fog episodes at one regional background site in North China Plain. Atmos. Res. 2015, 156, 102–110. [Google Scholar] [CrossRef]
- WMO. Guide to Meteorological Instruments and Methods of Observation; Secretariat of the World Meteorological Organization: Geneva, Switzerland, 2008; p. 681. [Google Scholar]
- Li, L.; Zha, Y. Estimating monthly average temperature by remote sensing in China. Adv. Space Res. 2019, 63, 2345–2357. [Google Scholar] [CrossRef]
- Li, L.; Zha, Y. Satellite-based regional warming hiatus in China and its implication. Sci. Total. Environ. 2019, 648, 1394–1402. [Google Scholar] [CrossRef]
- Riahi, K.; Rao, S.; Krey, V.; Cho, C.; Chirkov, V.; Fischer, G.; Kindermann, G.E.; Nakicenovic, N.; Rafaj, P. RCP 8.5—A scenario of comparatively high greenhouse gas emissions. Clim. Chang. 2011, 109, 33–57. [Google Scholar] [CrossRef]
- Thomson, A.M.; Calvin, K.; Smith, S.J.; Kyle, P.; Volke, A.; Patel, P.; Delgado-Arias, S.; Bond-Lamberty, B.; Wise, M.A.; Clarke, L.E.; et al. RCP4.5: A pathway for stabilization of radiative forcing by 2100. Clim. Chang. 2011, 109, 77–94. [Google Scholar] [CrossRef]
- Taylor, K.E. Summarizing multiple aspects of model performance in a single diagram. J. Geophys. Res. Atmos. 2001, 106, 7183–7192. [Google Scholar] [CrossRef]
- Stocker, T.F.; Qin, D.; Plattner, G.-K.; Tignor, M.; Allen, S.K.; Boschung, J.; Nauels, A.; Xia, Y.; Bex, V.; Midgley, P.M. Climate Change 2013: The physical Science Basis; Working Group I Contribution to the Fifth Assessment Report of the Intergovernmental Panel on Climate Change; Cambridge University Press: Cambridge, UK; New York, NY, USA, 2013. [Google Scholar] [CrossRef]
- Zhou, B.; Wen, Q.H.; Xu, Y.; Song, L.; Zhang, X. Projected Changes in Temperature and Precipitation Extremes in China by the CMIP5 Multimodel Ensembles. J. Clim. 2014, 27, 6591–6611. [Google Scholar] [CrossRef]
- Zhou, T.; Yu, R. Twentieth-Century Surface Air Temperature over China and the Globe Simulated by Coupled Climate Models. J. Clim. 2006, 19, 5843–5858. [Google Scholar] [CrossRef]
- Guo, X.; Wu, Z.; He, H.; Du, H.; Wang, L.; Yang, Y.; Zhao, W. Variations in the start, end, and length of extreme precipitation period across China. Int. J. Clim. 2018, 38, 2423–2434. [Google Scholar] [CrossRef]
- Xu, K.; Xu, B.; Ju, J.; Wu, C.; Dai, H.; Hu, B.X. Projection and uncertainty of precipitation extremes in the CMIP5 multimodel ensembles over nine major basins in China. Atmos. Res. 2019, 226, 122–137. [Google Scholar] [CrossRef]
- Wang, X.; Jiang, D.; Lang, X. Future extreme climate changes linked to global warming intensity. Sci. Bull. 2017, 62, 1673–1680. [Google Scholar] [CrossRef]
- Feng, R.; Yu, R.; Zheng, H.; Gan, M. Spatial and temporal variations in extreme temperature in Central Asia. Int. J. Clim. 2018, 38, e388–e400. [Google Scholar] [CrossRef]
- Mann, H.B. Nonparametric tests against trend. Econometrica 1945, 13, 245–259. [Google Scholar] [CrossRef]
- Wilby, R.; Wigley, T. Downscaling general circulation model output: A review of methods and limitations. Prog. Phys. Geogr. Earth Environ. 1997, 21, 530–548. [Google Scholar] [CrossRef]
- Wang, L.; Chen, W. A CMIP5 multimodel projection of future temperature, precipitation, and climatological drought in China. Int. J. Clim. 2013, 34, 2059–2078. [Google Scholar] [CrossRef]
- Yue, T.; Zhao, N.; Fan, Z.; Li, J.; Chen, C.; Lu, Y.; Wang, C.; Xu, B.; Wilson, J. CMIP5 downscaling and its uncertainty in China. Glob. Planet. Chang. 2016, 146, 30–37. [Google Scholar] [CrossRef]
- Giorgi, F.; Mearns, L.O. Approaches to the simulation of regional climate change: A review. Rev. Geophys. 1991, 29, 191–216. [Google Scholar] [CrossRef]
- Pereira, S.C.; Marta-Almeida, M.; Carvalho, A.C.; Rocha, A. Extreme precipitation events under climate change in the Iberian Peninsula. Int. J. Clim. 2020, 40, 1255–1278. [Google Scholar] [CrossRef]
- Hay, L.E.; Wilby, R.L.; Leavesley, G.H. A Comparison of Delta Change and Downscaled gcm Scenarios for Three Mountainous Basins in the United States1. JAWRA J. Am. Water Resour. Assoc. 2000, 36, 387–397. [Google Scholar] [CrossRef]
- Xu, K.; Wu, C.; Hu, B.X. Projected changes of temperature extremes over nine major basins in China based on the CMIP5 multimodel ensembles. Stoch. Environ. Res. Risk Assess. 2018, 33, 321–339. [Google Scholar] [CrossRef]
- Jiang, Z.; Li, W.; Xu, J.; Li, L. Extreme Precipitation Indices over China in CMIP5 Models. Part I: Model Evaluation. J. Clim. 2015, 28, 8603–8619. [Google Scholar] [CrossRef]
- Grotjahn, R.; Black, R.E.; Leung, R.; Wehner, M.; Barlow, M.; Bosilovich, M.G.; Gershunov, A.; Gutowski, W.J.; Gyakum, J.R.; Katz, R.W.; et al. North American extreme temperature events and related large scale meteorological patterns: A review of statistical methods, dynamics, modeling, and trends. Clim. Dyn. 2016, 46, 1151–1184. [Google Scholar] [CrossRef]
- Sui, Y.; Lang, X.; Jiang, D. Projected signals in climate extremes over China associated with a 2 °C global warming under two RCP scenarios. Int. J. Clim. 2018, 38, e678–e697. [Google Scholar] [CrossRef]
- Sun, Q.; Miao, C.; Duan, Q. Projected changes in temperature and precipitation in ten river basins over China in 21st century. Int. J. Clim. 2015, 35, 1125–1141. [Google Scholar] [CrossRef]
- Giorgi, F.; Mearns, L.O. Calculation of Average, Uncertainty Range, and Reliability of Regional Climate Changes from AOGCM Simulations via the “Reliability Ensemble Averaging” (REA) Method. J. Clim. 2002, 15, 1141–1158. [Google Scholar] [CrossRef]
- Gleckler, P.J.; Taylor, K.E.; Doutriaux, C. Performance metrics for climate models. J. Geophys. Res. Space Phys. 2008, 113, 104–123. [Google Scholar] [CrossRef]
- Li, B.; Zhou, T.J. Projected climate change over China under SRES A1B scenario: Multimodel ensemble and uncertainties. Adv. Clim. Chang. Res. 2010, 6, 270–276. (In Chinese) [Google Scholar]
- Kay, A.L.; Davies, H.N.; Bell, V.A.; Jones, R. Comparison of uncertainty sources for climate change impacts: Flood frequency in England. Clim. Chang. 2009, 92, 41–63. [Google Scholar] [CrossRef]
- Wu, C.H.; Huang, G.R.; Yu, H. Prediction of extreme floods based on CMIP5 climate models: A case study in the Beijiang River basin, South China. Hydrol. Earth Syst. Sci. 2015, 19, 1385–1399. [Google Scholar] [CrossRef]
- Li, W.; Jiang, Z.; Zhang, X.; Li, L.; Sun, Y. Additional risk in extreme precipitation in China from 1.5 °C to 2.0 °C global warming levels. Sci. Bull. 2018, 63, 228–234. [Google Scholar] [CrossRef]
- Hu, W.; Zhang, G.; Zeng, G.; Li, Z. Changes in Extreme Low Temperature Events over Northern China under 1.5 °C and 2.0 °C Warmer Future Scenarios. Atmosphere 2018, 10, 1. [Google Scholar] [CrossRef]
- Yuan, Z.; Xu, J.; Wang, Y. Projection of Future Extreme Precipitation and Flood Changes of the Jinsha River Basin in China Based on CMIP5 Climate Models. Int. J. Environ. Res. Public Health 2018, 15, 2491. [Google Scholar] [CrossRef]
- Wu, J.; Han, Z.; Xu, Y.; Zhou, B.; Gao, X. Changes in Extreme Climate Events in China Under 1.5 °C–4 °C Global Warming Targets: Projections Using an Ensemble of Regional Climate Model Simulations. J. Geophys. Res. Atmos. 2020, 125, e2019JD031057. [Google Scholar] [CrossRef]
- Rai, P.; Singh, G.P.; Dash, S.K. Projected changes in extreme precipitation events over various subdivisions of India using RegCM4. Clim. Dyn. 2019, 54, 247–272. [Google Scholar] [CrossRef]
- Zhou, T.; Song, F.; Lin, R.; Chen, X.; Chen, X. The 2012 North China floods: Explaining an extreme rainfall event in the context of a long-term drying tendency [in “Explaining Extreme Events of 2012 from a Climate Perspective”]. B. Am. Meteorol. Soc. 2013, 94, 49–51. [Google Scholar]


| No. | Model | Institute ID (Modeling Center or Group) | Resolution (Lon × Lat) | Tm, Tx, Tn | Pre |
|---|---|---|---|---|---|
| 1 | ACCESS1.0 | CSIRO-BOM (Commonwealth Scientific and Industrial Research Organization (CSIRO) and Bureau of Meteorology (BOM), Australia) | 192 × 145 | √ | |
| 2 | ACCESS1.3 | √ | |||
| 3 | CCSM4 | NCAR (National Center for Atmospheric Research) | 288 × 192 | √ | √ |
| 4 | CMCC-CM | CMCC (Centro Euro-Mediterraneo per I Cambiamenti Climatici) | 480 × 240 | √ | |
| 5 | CMCC-CMS | 192 × 96 | √ | √ | |
| 6 | CSIRO-Mk3.6.0 | CSIRO-QCCCE (Commonwealth Scientific and Industrial Research Organization in collaboration with Queensland Climate Change Centre of Excellence) | 192 × 96 | √ | √ |
| 7 | CanESM2 | CCCMA (Canadian Centre for Climate Modelling and Analysis) | 128 × 64 | √ | |
| 8 | HadGEM2-AO | NIMR/KMA (National Institute of Meteorological Research/Korea Meteorological Administration) | 192 × 144 | √ | √ |
| 9 | HadGEM2-CC | MOHC (Met Office Hadley Centre) | 192 × 144 | √ | |
| 10 | HadGEM2-ES | 192 × 96 | √ | ||
| 11 | IPSL-CM5B-LR | IPSL (Institute Pierre-Simon Laplace) | 96 × 96 | √ | √ |
| 12 | IPSL-CM5A-MR | 144 × 143 | √ | ||
| 13 | MPI-ESM-LR | MPI-M (Max Planck Institute for Meteorology) | 192 × 96 | √ | √ |
| 14 | MPI-ESM-MR | √ | √ | ||
| 15 | NorESMl-M | NCC (Norwegian Climate Centre) | 144 × 96 | √ | |
| 16 | INMCM4 | INM (Institute for Numerical Mathematics) | 180 × 120 | √ | √ |
| The Yellow River Basin | ||||||||
|---|---|---|---|---|---|---|---|---|
| Average | Trend (Unit/Decade) | |||||||
| Pre (mm) | Tm (°C) | Tn (°C) | Tx (°C) | Pre | Tm | Tn | Tx | |
| OBS | 449.18 | 8.49 | 2.22 | 14.75 | −12.38 | 0.34 ** | 0.33 ** | 0.36 * |
| ACCESS1.0 | 6.06 | 1.22 | 10.79 | 0.26 ** | 0.19 | 0.33 ** | ||
| ACCESS1.3 | 6.44 | 2.18 | 10.67 | 0.23 * | 0.32 ** | 0.15 ** | ||
| CCSM4 | 722.75 | 5.31 | −0.34 | 10.98 | −5.01 | 0.04 | 0.04 | 0.03 |
| CMCC-CM | 5.26 | −1.09 | 11.23 | 0.36 ** | 0.33 * | 0.39 ** | ||
| CMCC-CMS | 515.1 | 5.94 | −0.33 | 11.9 | 0.94 | 0.10 | 0.12 | 0.08 |
| CSIRO-Mk3-6-0 | 614.84 | 5.98 | 0.42 | 11.77 | 15.24 | 0.13 | 0.14 | 0.13 |
| CanESM2 | 1124.85 | −32.51 | ||||||
| HadGEM2-AO | 581.13 | 5.28 | −0.23 | 10.47 | −17.00 | 0.29 * | 0.41 ** | 0.19 |
| HadGEM2-CC | 583.54 | −26.45 | ||||||
| HadGEM2-ES | 5.66 | 0 | 11.07 | 0.11 | 0.18 | 0.05 | ||
| INMCM4 | 602.78 | 2.76 | −3.04 | 8.55 | −33.07 | 0.32 ** | 0.24 | 0.39 ** |
| IPSL-CM5A-MR | 7.65 | 2.21 | 13.31 | 0.08 | 0.09 | 0.06 | ||
| IPSL-CM5B-LR | 1059.59 | 7.19 | 1.5 | 13.11 | −30.61 | 0.24 | 0.22 | 0.25 * |
| MPI-ESM-LR | 617.75 | 7.71 | 2.55 | 12.91 | 8.21 | 0.12 | 0.18 | 0.06 |
| MPI-ESM-MR | 809.74 | 7.13 | 2.26 | 12.03 | −13.64 | 0.35 ** | 0.36 ** | 0.36 ** |
| NorESM1-M | 6.6 | 5.56 | 7.65 | 0.08 | 0.09 | 0.06 | ||
| The Yangtze River Basin | ||||||||
| OBS | 1192.65 | 15.47 | 11.06 | 19.88 | 26.14 | 0.19 * | 0.23 ** | 0.14 |
| ACCESS1.0 | 11.82 | 8.04 | 15.59 | 0.16 | 0.15 | 0.17 | ||
| ACCESS1.3 | 12.46 | 9.55 | 15.37 | 0.27 ** | 0.3 | 0.24 * | ||
| CCSM4 | 1108.59 | 12.41 | 7.41 | 17.4 | −9.93 | 0.02 | 0.08 | −0.04 |
| CMCC-CM | −25.38 | 0.25 ** | 0.26 ** | 0.25 ** | ||||
| CMCC-CMS | 1320.1 | 12.4 | 7.95 | 16.77 | −2.41 | 0.03 | 0.09 | −0.04 |
| CSIRO-Mk3-6-0 | 954.07 | 14.18 | 8.22 | 20.22 | −9.32 | 0.15 | 0.19 | 0.1 |
| CanESM2 | 1643.8 | −18.55 | ||||||
| HadGEM2-AO | 1341.86 | 11.48 | 6.94 | 15.98 | −37.78 | 0.09 | 0.16 | 0.03 |
| HadGEM2-CC | 1321.37 | −62.86 ** | ||||||
| HadGEM2-ES | 11.15 | 7.01 | 15.25 | 0.03 | 0.07 | 0 | ||
| INMCM4 | 1164.5 | 11.37 | 6.98 | 15.75 | 25.96 | 0.09 | 0.13 | 0.05 |
| IPSL-CM5A-MR | 14.13 | 10.49 | 17.79 | 0.04 | 0.04 | 0.05 | ||
| IPSL-CM5B-LR | 1916.59 | 13.78 | 9.74 | 17.82 | 8.39 | 0.15 | 0.14 | 0.14 |
| MPI-ESM-LR | 1375.5 | 12.98 | 9.13 | 16.85 | −26.15 | 0.14 | 0.16 | 0.12 |
| MPI-ESM-MR | 1418.86 | 12.43 | 8.96 | 15.92 | −35.53 | 0.27* | 0.25 | 0.29 * |
| NorESM1-M | 12.11 | 11.39 | 12.83 | 0.09 | 0.10 | 0.08 | ||
| Index | Descriptive Name | Definitions | Units |
|---|---|---|---|
| Extreme temperature indices | |||
| DTR | Diurnal temperature range | Mean difference between TX and TN | °C |
| TXx | Max Tm | Maximum value of daily maximum temp | °C |
| TNn | Min Tn | Minimum value of daily minimum temp | °C |
| SU | Summer days | Count when TX (daily maximum) > 25 °C | Days |
| ID | Ice days | Count when TX (daily maximum) < 0 °C | Days |
| WSDI | Warm spell duration index | Count of days with at least 6 consecutive days when TX > 90th percentile | Days |
| CSDI | Cold spell duration index | Count of days with at least 6 consecutive days when TN < 10th percentile | Days |
| Extreme precipitation indices | |||
| Rx5day | Highest 5-day precipitation | Maximum consecutive 5-day precipitation | mm |
| R99pTOT | Extremely wet day precipitation | Precipitation due to very wet days when the PR > 99th percentile of 1971–2000 daily rainfall | mm |
| R20mm | Heavy precipitation days | Count of days when PR ≥ 20 mm | Days |
| PRCPTOT | Total wet-day precipitation | Total precipitation in wet days (PR ≥ 1 mm) | mm |
| SDII | Precipitation intensity | Total precipitation in wet days divided by the count of the wet days | mm/day |
| CDD | Consecutive dry days | Maximum number of consecutive dry days with PR < 1 mm | Days |
| CWD | Consecutive wet days | Maximum number of consecutive wet days with PR ≥ 1 mm | Days |
| Index | The Yellow River Basin | The Yangtze River Basin | ||
|---|---|---|---|---|
| Regional Mean OBS | Regional Mean REA | Regional Mean OBS | Regional Mean REA | |
| TXx (°C) | 29.84 | 30.3 | 30.63 | 30.78 |
| TNn (°C) | −23.28 | −22.59 | −11.62 | −11.77 |
| SU (days) | 58.28 | 59.43 | 85.46 | 88.02 |
| ID (days) | 60.01 | 60.49 | 24.41 | 24.51 |
| WSDI (days) | 11.3 | 12.63 | 15.69 | 13.93 |
| CSDI (days) | 15.42 | 18.62 | 15.02 | 17.5 |
| DTR (°C) | 12.71 | 12.71 | 10.06 | 10.08 |
| PRCPTOT (mm) | 441.24 | 438.41 | 963.14 | 959.81 |
| Rx5day (mm) | 62.36 | 68.01 | 104.35 | 112.78 |
| R20mm (days) | 3.37 | 3.46 | 10.99 | 11.4 |
| R99pTOT (mm) | 30.05 | 31.58 | 70.14 | 71.91 |
| CDD (days) | 55.76 | 59.15 | 36.92 | 39.92 |
| CWD (days) | 7.51 | 8.14 | 11.52 | 12.35 |
| SDII (mm/days) | 5.85 | 5.9 | 7.78 | 7.85 |
| Index | The Yellow River Basin | The Yangtze River Basin | ||||
|---|---|---|---|---|---|---|
| Historical | RCP4.5 | RCP8.5 | Historical | RCP4.5 | RCP8.5 | |
| TXx | 0.23 ** | 0.28 ** | 0.69 ** | 0.21 ** | 0.33 ** | 0.74 ** |
| TNn | 0.30 ** | 0.32 ** | 0.71 ** | 0.28 ** | 0.28 ** | 0.64 ** |
| SU | 1.73 ** | 2.22 ** | 4.52 ** | 1.68 ** | 2.53 ** | 4.95 ** |
| ID | −2.41 ** | −2.32 ** | −4.59 ** | −1.29 ** | −1.47 ** | −3.02 ** |
| WSDI | 2.08 ** | 4.12 ** | 9.04 ** | 2.33 ** | 4.66 ** | 9.75 ** |
| CSDI | −2.32 ** | −1.31 ** | −1.55 ** | −2.1 ** | −1.24 ** | −1.47 ** |
| DTR | −0.04 ** | 0.003 ** | 0.004 ** | −0.02 ** | 0.03 ** | 0.04 ** |
| PRCPTOT | 6.75 ** | 9.23 ** | 11.98 ** | 6.04 ** | 14.61 ** | 18.99 ** |
| Rx5day | 1.07 ** | 1.07 ** | 2.08 ** | 1.99 ** | 1.91 ** | 3.3 ** |
| R20mm | 0.08 ** | 0.11 ** | 0.17 ** | 0.14 ** | 0.24 ** | 0.36 ** |
| R99pTOT | 2.72 ** | 2.79 ** | 5.48 ** | 4.66 ** | 5.91 ** | 11.28 ** |
| CDD | −0.20 * | −0.83 ** | −1.11 ** | 0.23 | −0.37 ** | −0.37 ** |
| CWD | 0.03 ** | 0.06 ** | −0.003 | 0.03 ** | 0.07 ** | −0.01 |
| SDII | 0.06 ** | 0.07 ** | 0.11 ** | 0.08 ** | 0.1 ** | 0.17 ** |
Publisher’s Note: MDPI stays neutral with regard to jurisdictional claims in published maps and institutional affiliations. |
© 2021 by the authors. Licensee MDPI, Basel, Switzerland. This article is an open access article distributed under the terms and conditions of the Creative Commons Attribution (CC BY) license (https://creativecommons.org/licenses/by/4.0/).
Share and Cite
Niu, Z.; Feng, L.; Chen, X.; Yi, X. Evaluation and Future Projection of Extreme Climate Events in the Yellow River Basin and Yangtze River Basin in China Using Ensembled CMIP5 Models Data. Int. J. Environ. Res. Public Health 2021, 18, 6029. https://doi.org/10.3390/ijerph18116029
Niu Z, Feng L, Chen X, Yi X. Evaluation and Future Projection of Extreme Climate Events in the Yellow River Basin and Yangtze River Basin in China Using Ensembled CMIP5 Models Data. International Journal of Environmental Research and Public Health. 2021; 18(11):6029. https://doi.org/10.3390/ijerph18116029
Chicago/Turabian StyleNiu, Zigeng, Lan Feng, Xinxin Chen, and Xiuping Yi. 2021. "Evaluation and Future Projection of Extreme Climate Events in the Yellow River Basin and Yangtze River Basin in China Using Ensembled CMIP5 Models Data" International Journal of Environmental Research and Public Health 18, no. 11: 6029. https://doi.org/10.3390/ijerph18116029
APA StyleNiu, Z., Feng, L., Chen, X., & Yi, X. (2021). Evaluation and Future Projection of Extreme Climate Events in the Yellow River Basin and Yangtze River Basin in China Using Ensembled CMIP5 Models Data. International Journal of Environmental Research and Public Health, 18(11), 6029. https://doi.org/10.3390/ijerph18116029