
GIS-Based Multi-Criteria Analysis Method for Assessment of Lake Ecosystems Degradation—Case Study in Romania

 ,
,  , , , , and
Abstract
1. Introduction
2. Materials and Methods
2.1. Type and Source of Primary Data Used
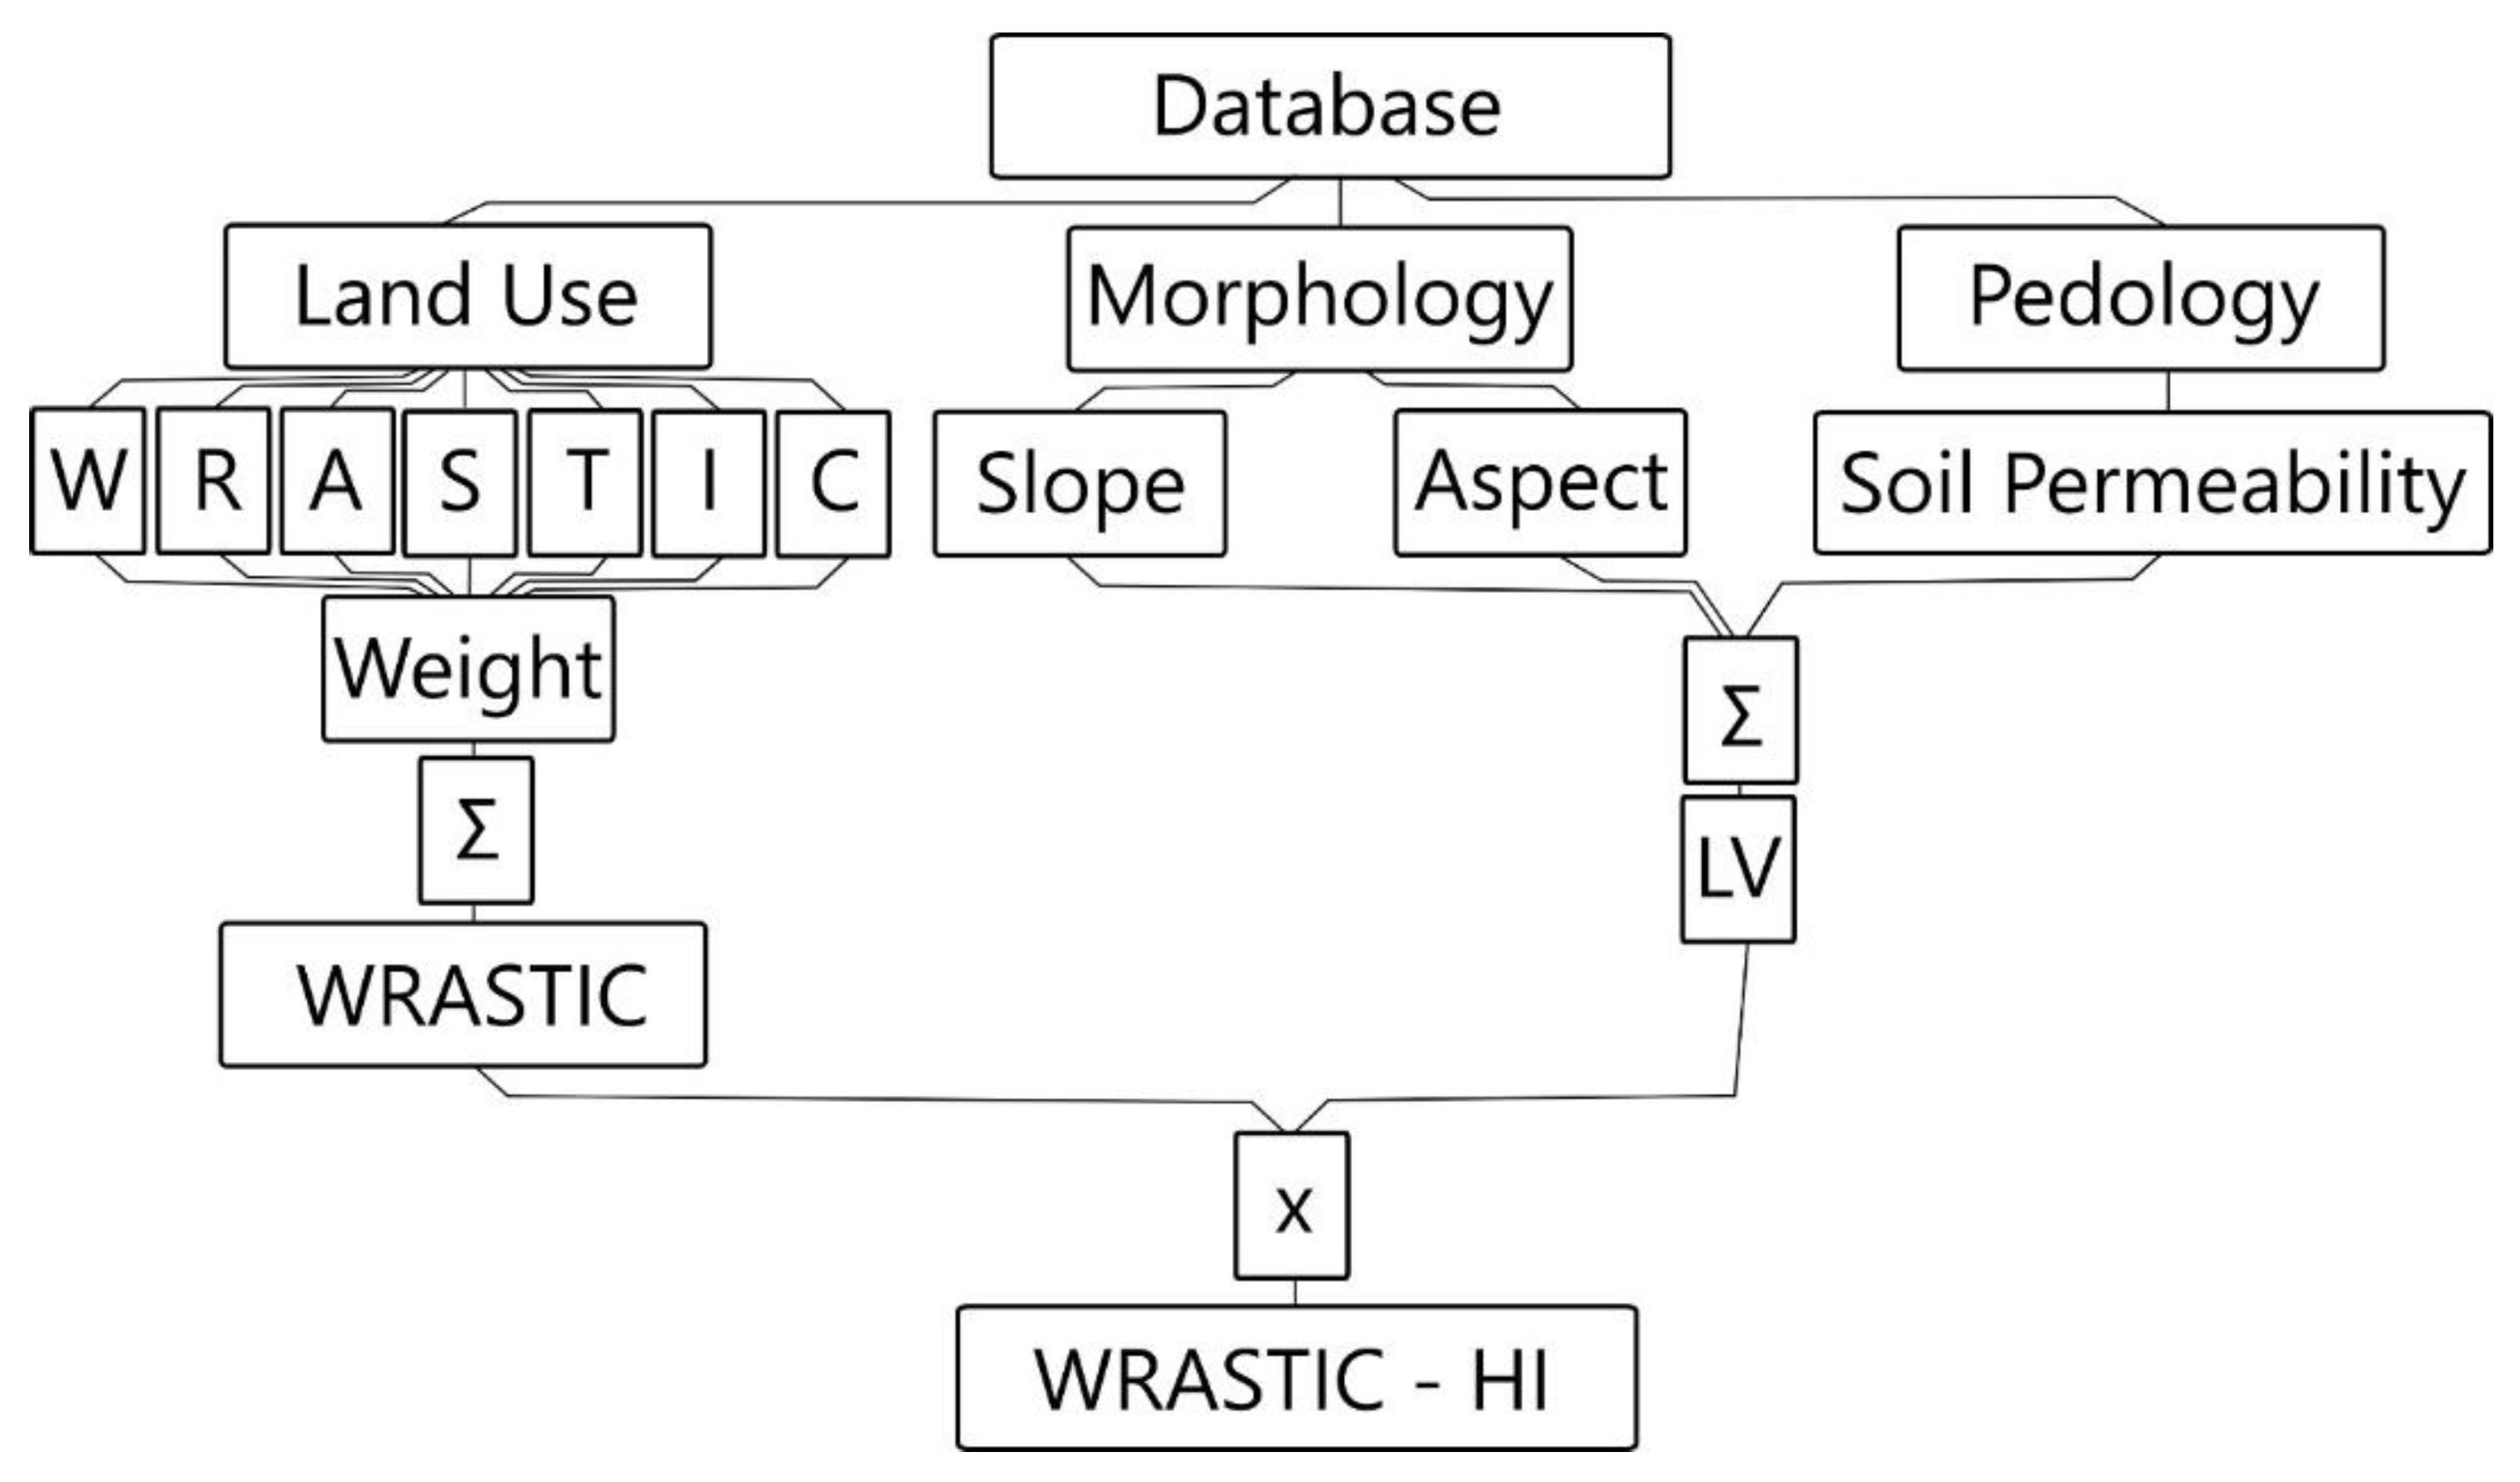
2.2. Indicators Used to Assess the Level of Degradation for Lake Ecosystems
2.3. Calculation of the Indicators to Assess the Degradation State of Lake Ecosystems
- Wastewater discharge (W) or discharge of wastewaters resulted from anthropic activity on the territory delineated by the watersheds;
- Recreational land use impacts (R) or impact of recreational activities;
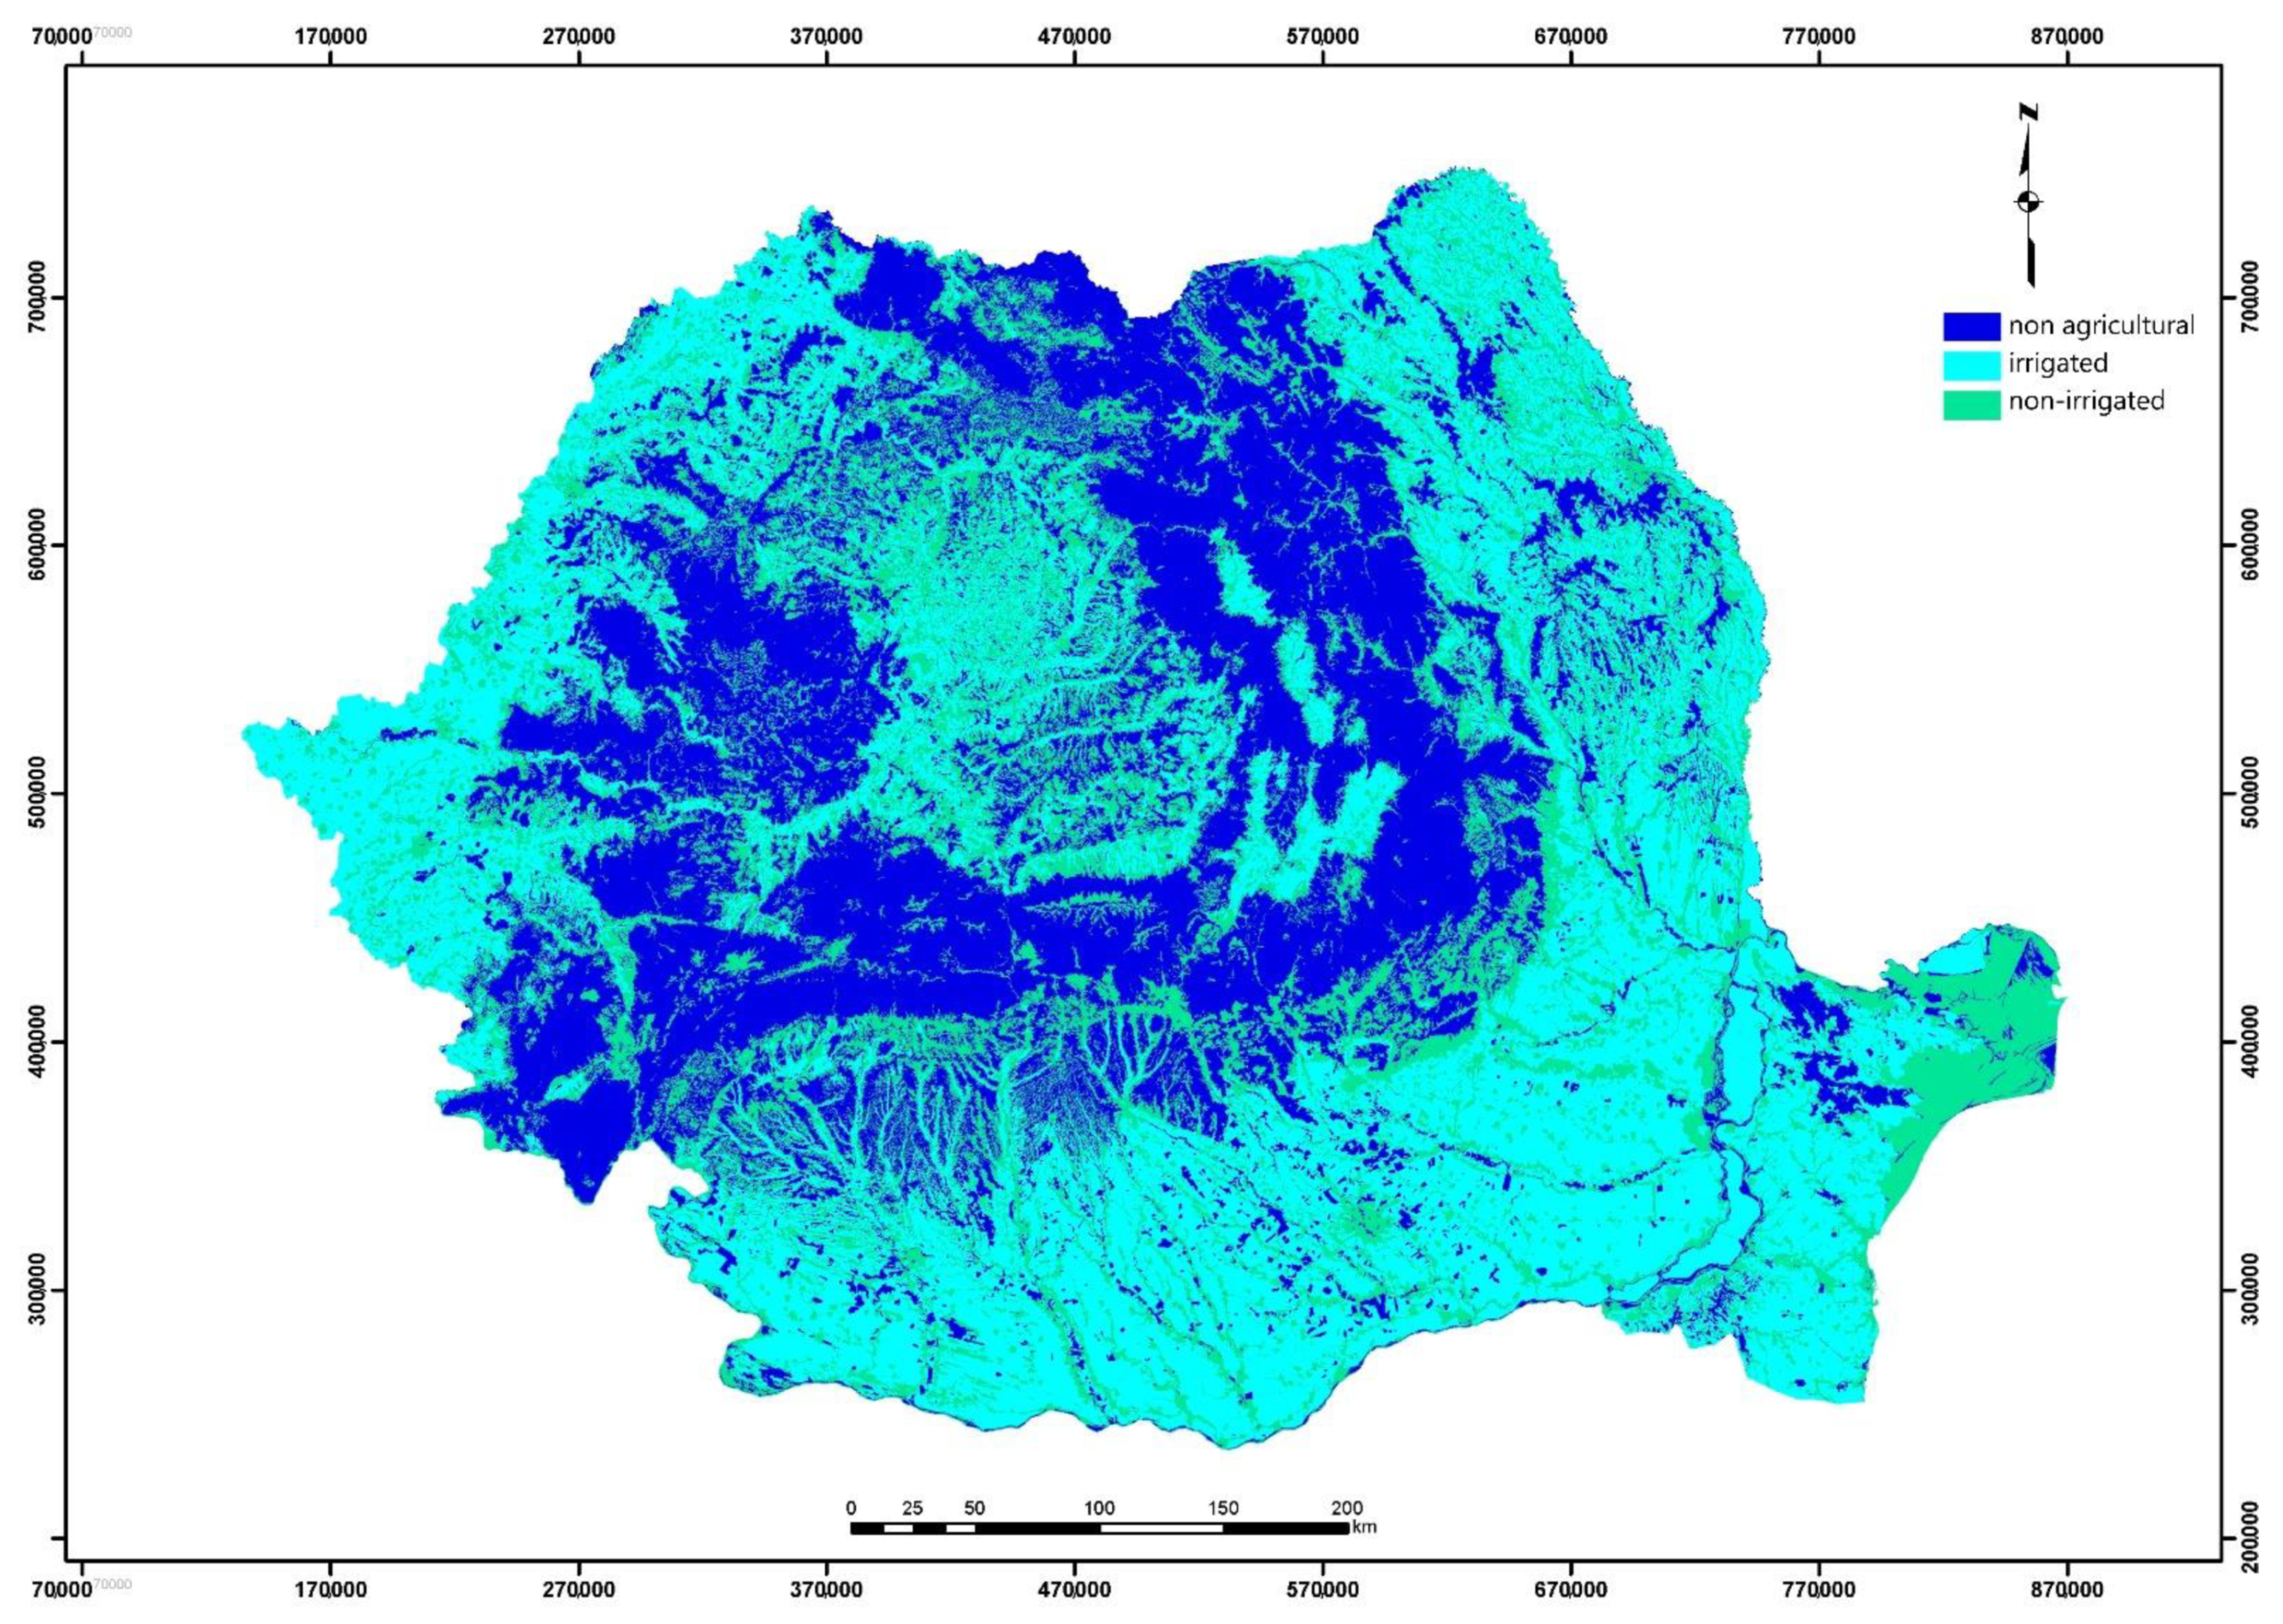
- Agricultural land use impacts (A) or impact of agricultural activities;
- Size of watershed (S) or size of watersheds feeding the lake;
- Transportation avenues (T) or influence of the means of transport;
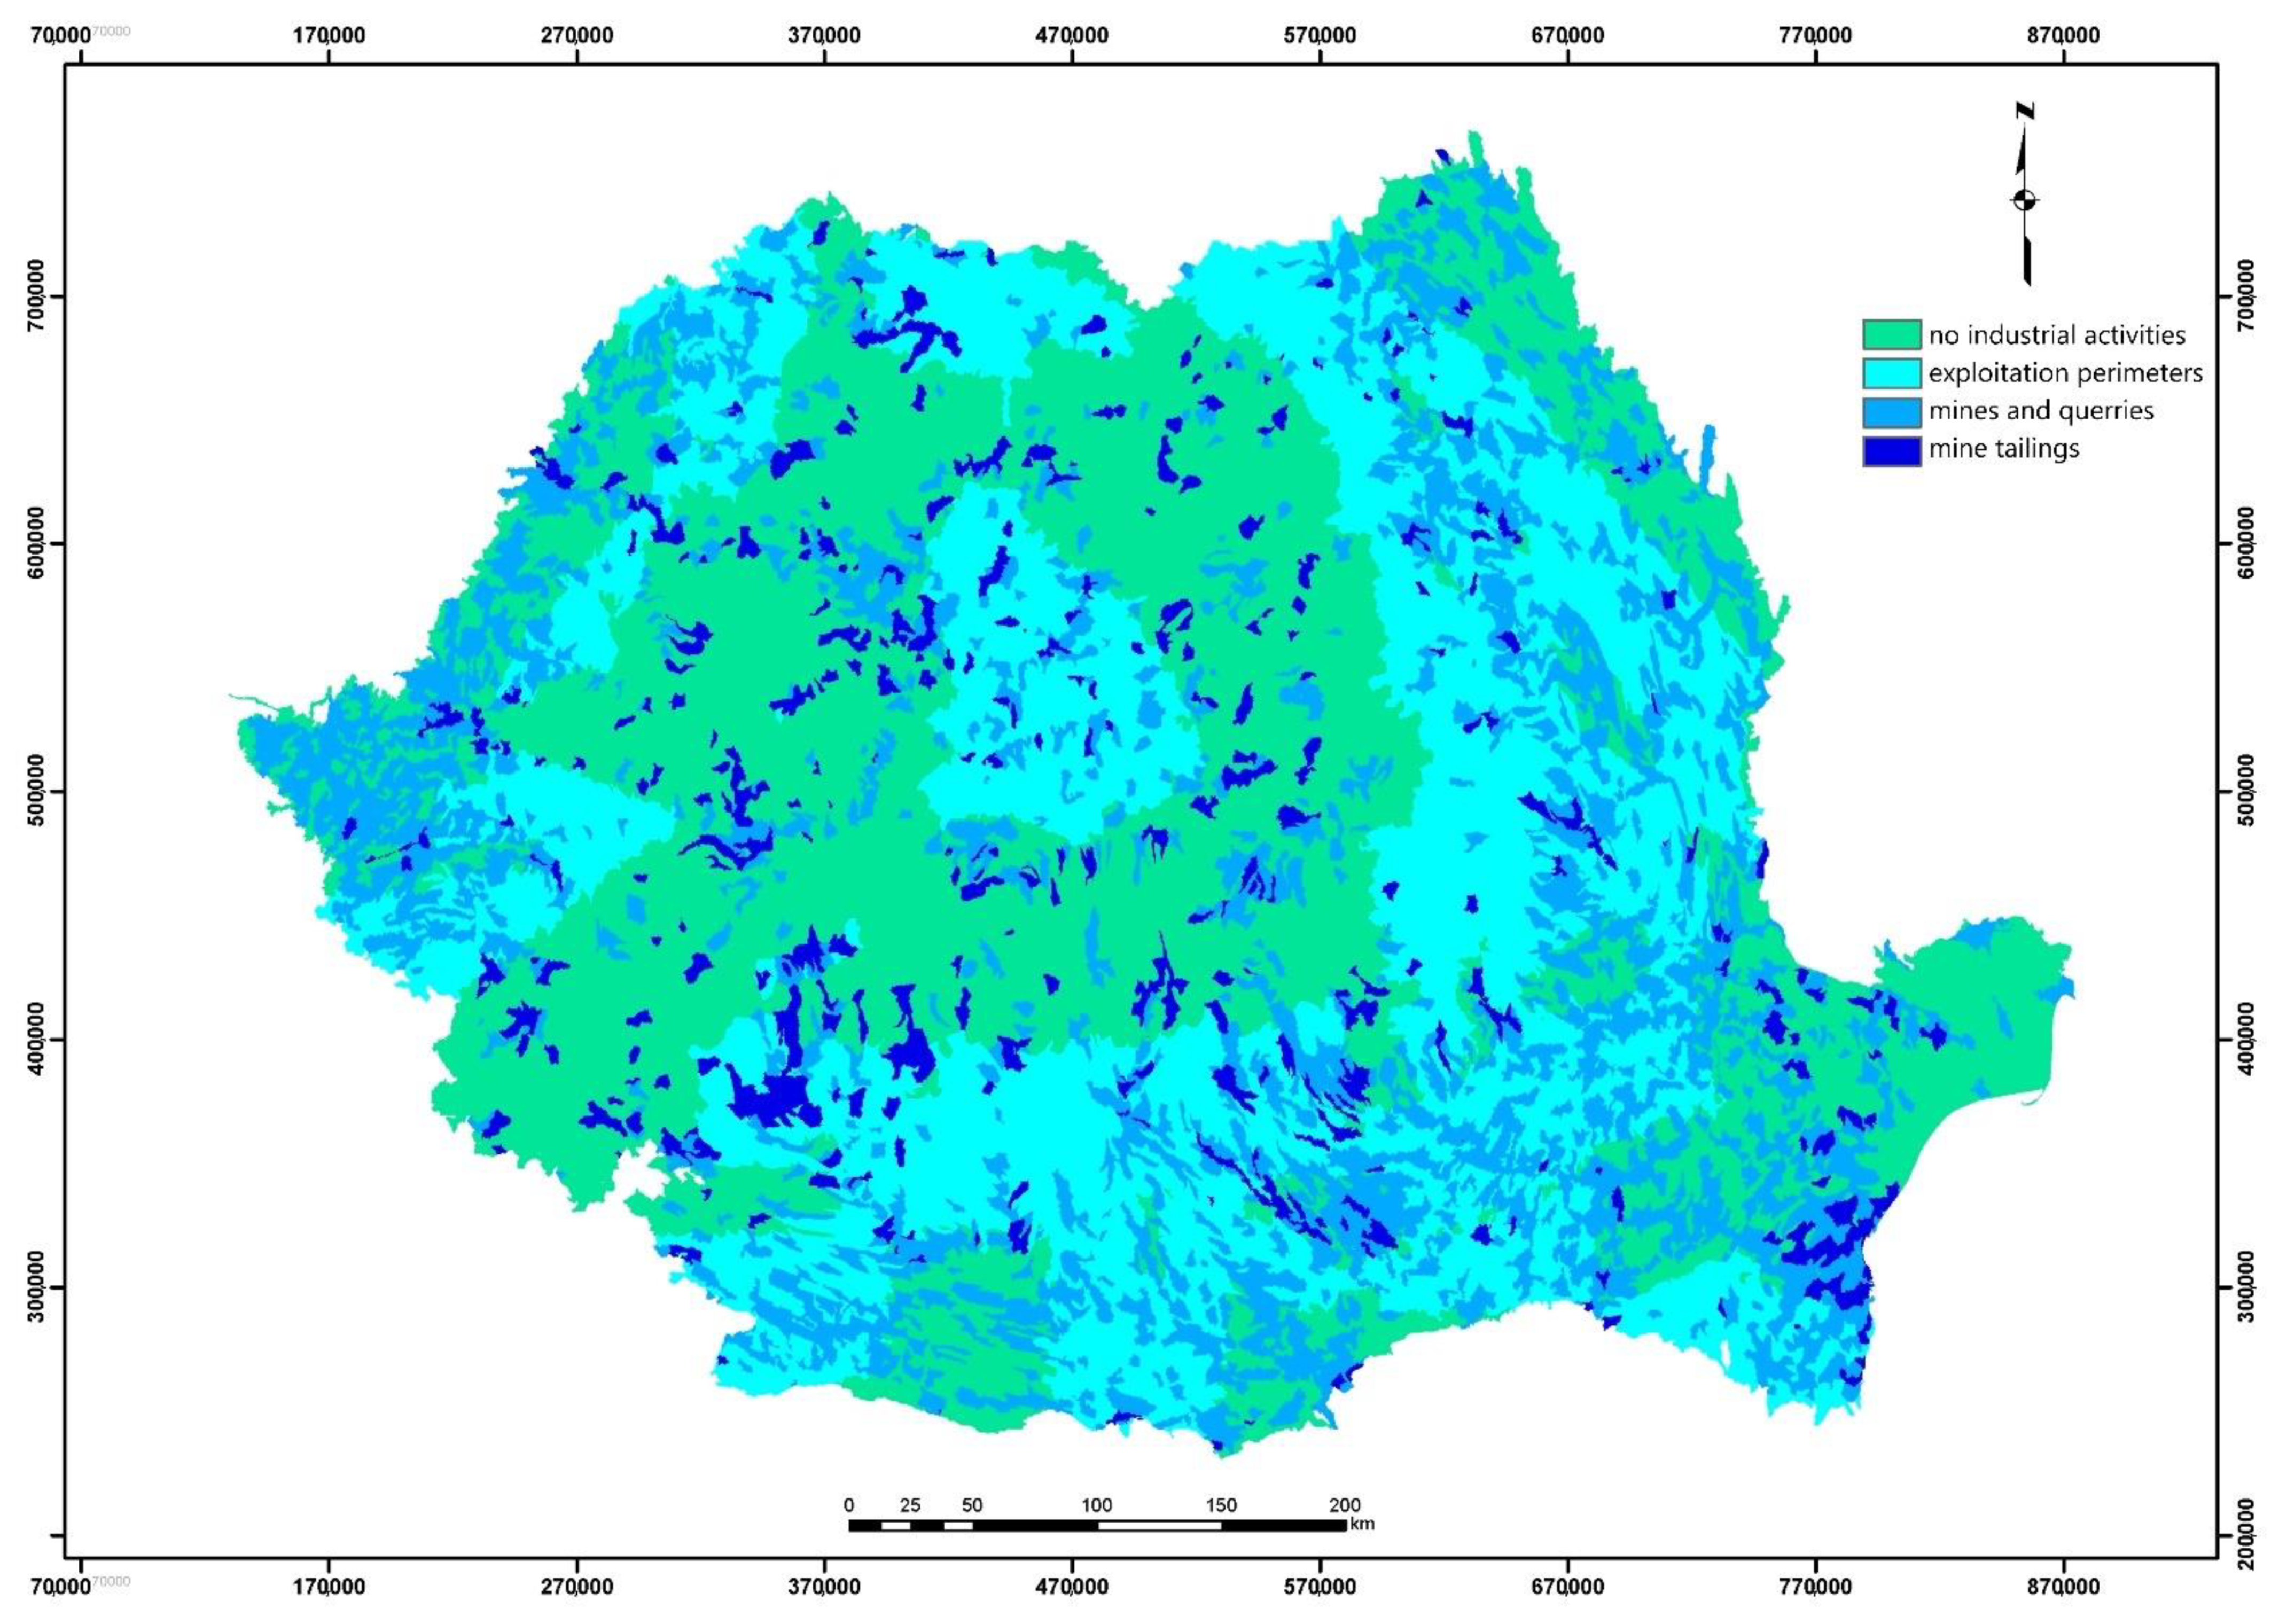
- Industrial land use impacts (I) or impact of industrial activities;
- The amount of vegetative ground Cover (C) or percentage of coverage with vegetation;
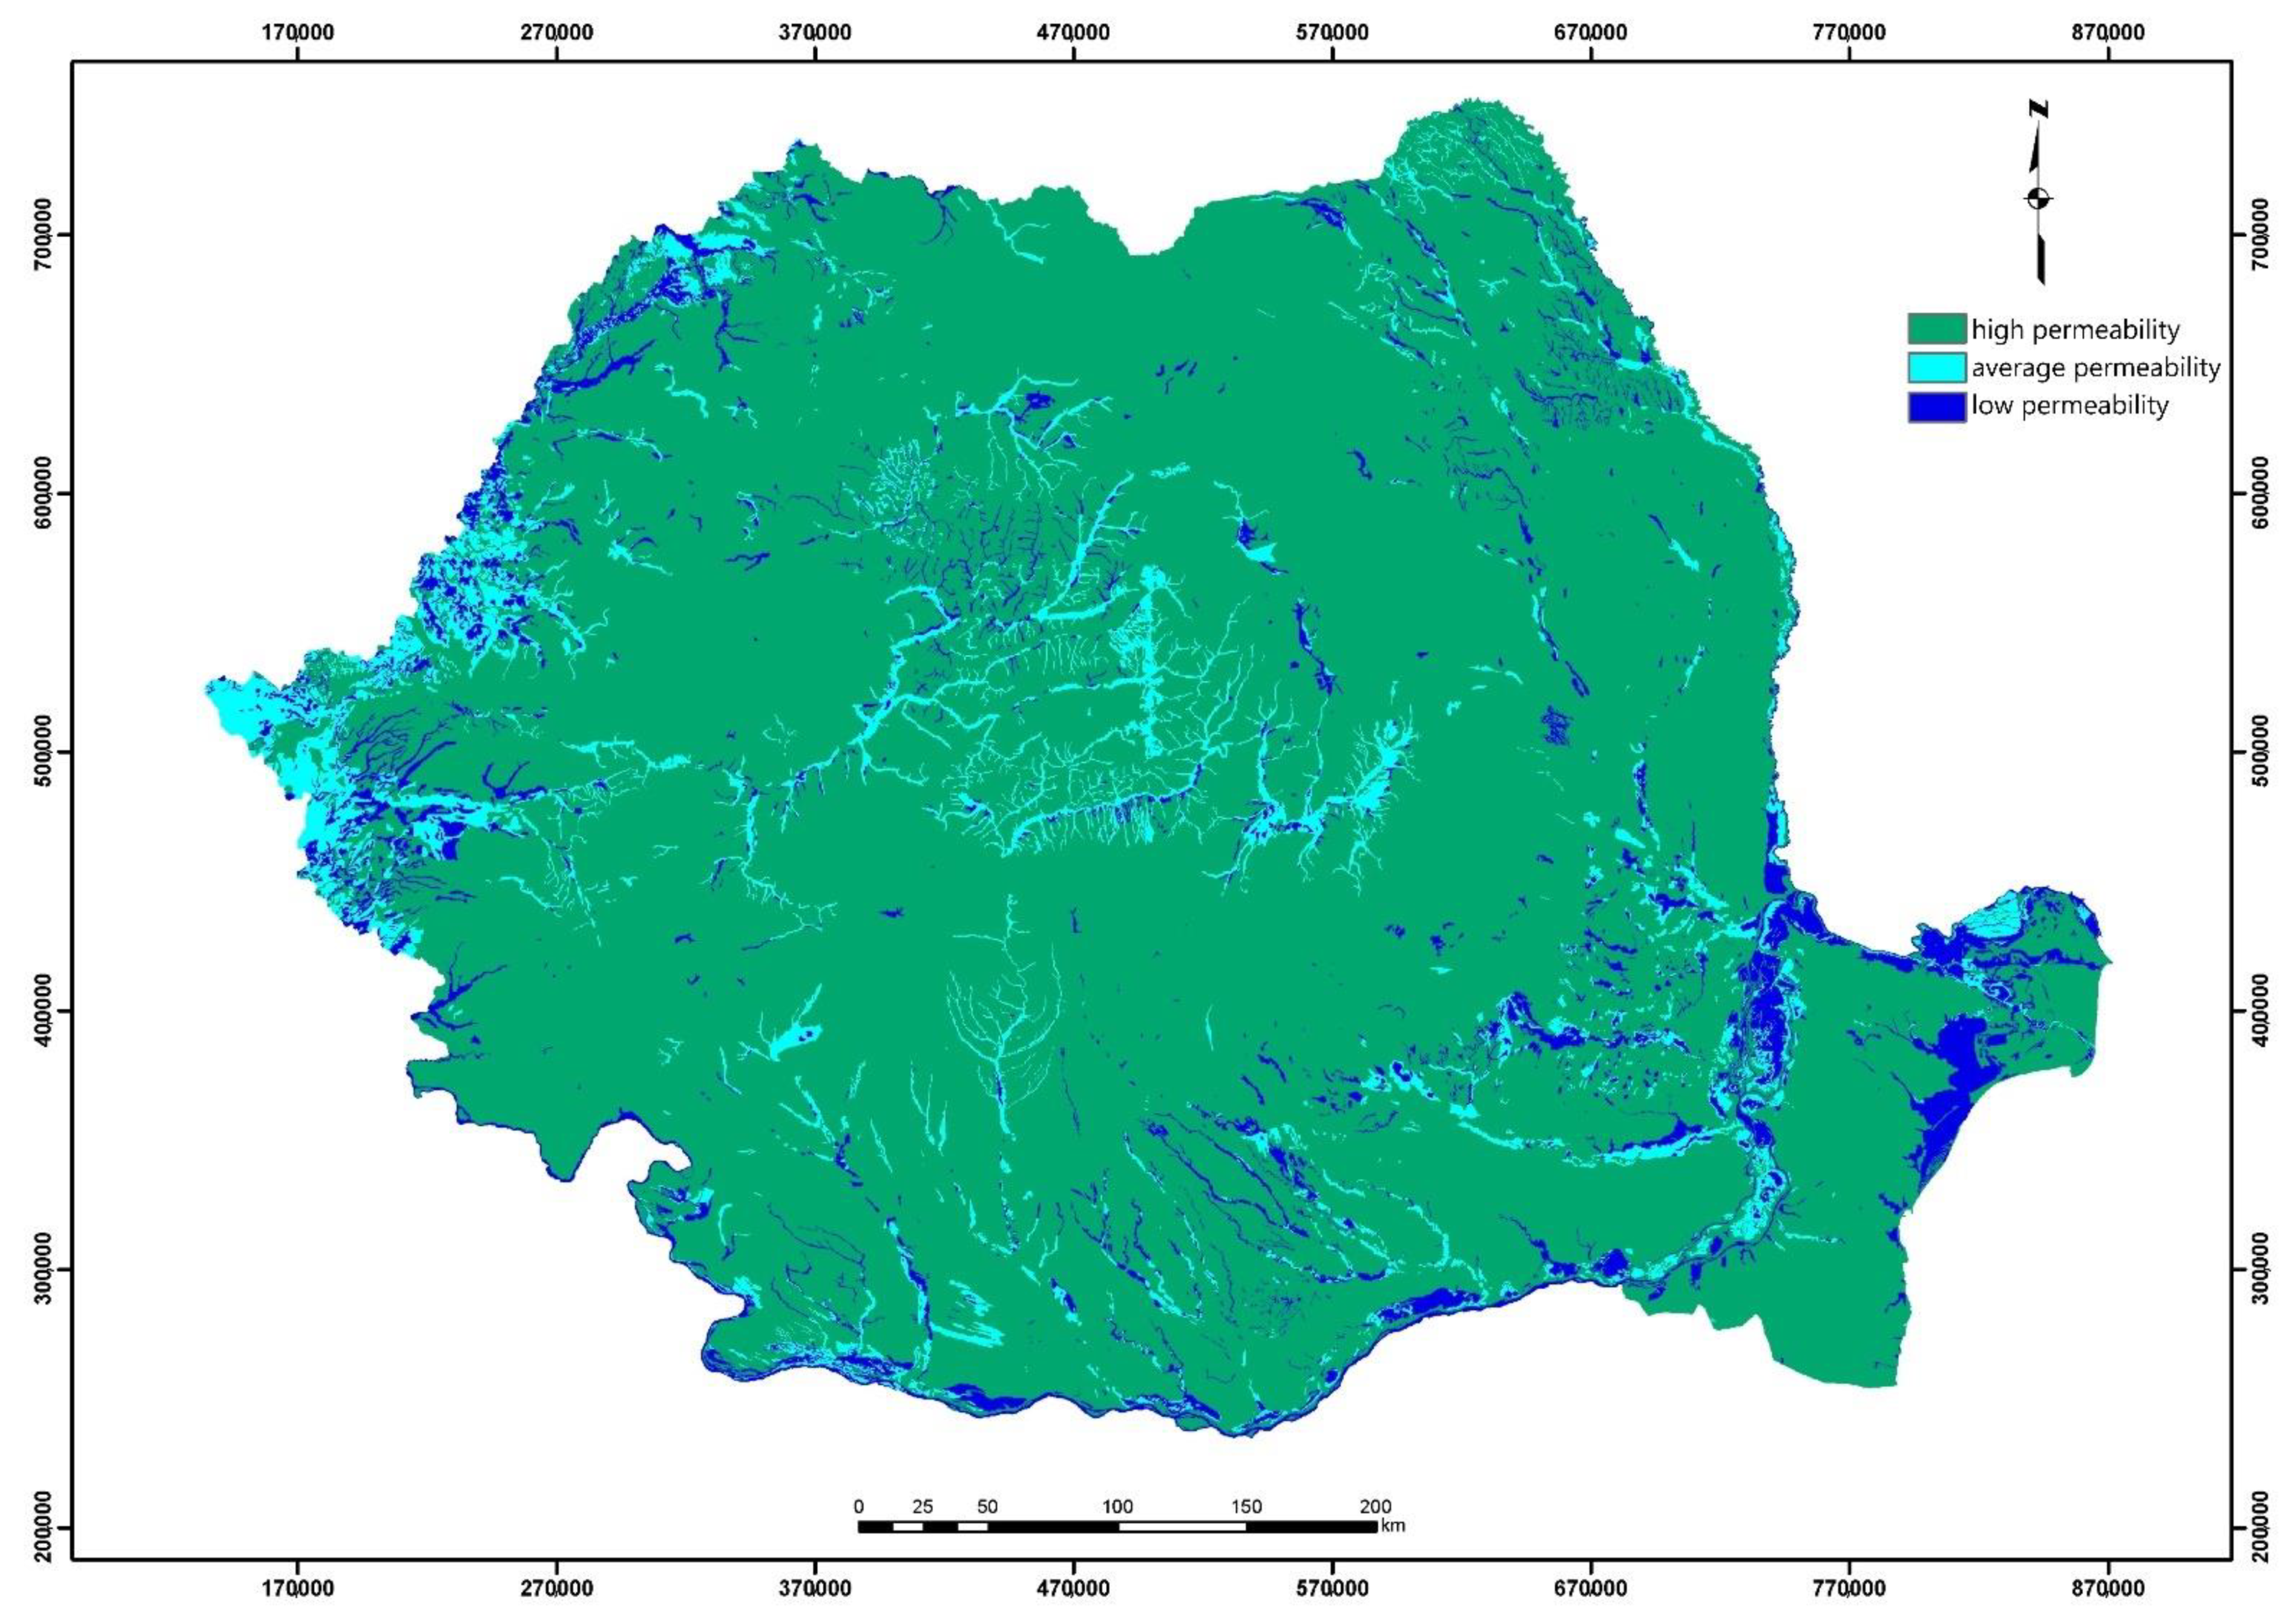
- Hazard Index (HI) or risk Index; this includes Permeability (P) or soil permeability, Aspect (E) or aspect of the slopes and Slope (S) or degree of inclination.
- type 1—lake ecosystems inclined to a small degree towards the accumulation of pollutants (lower slope values, permeable soil, slopes not directly exposed to the lake);
- type 2—lake ecosystems inclined to an average degree to the accumulation of pollutants (average slope, soil with average permeability, intermediate aspect with regard to the lake);
- type 3—lake ecosystems inclined to a large degree towards the accumulation of pollutants (high slope values, impermeable soil, slopes directly exposed to the lake).
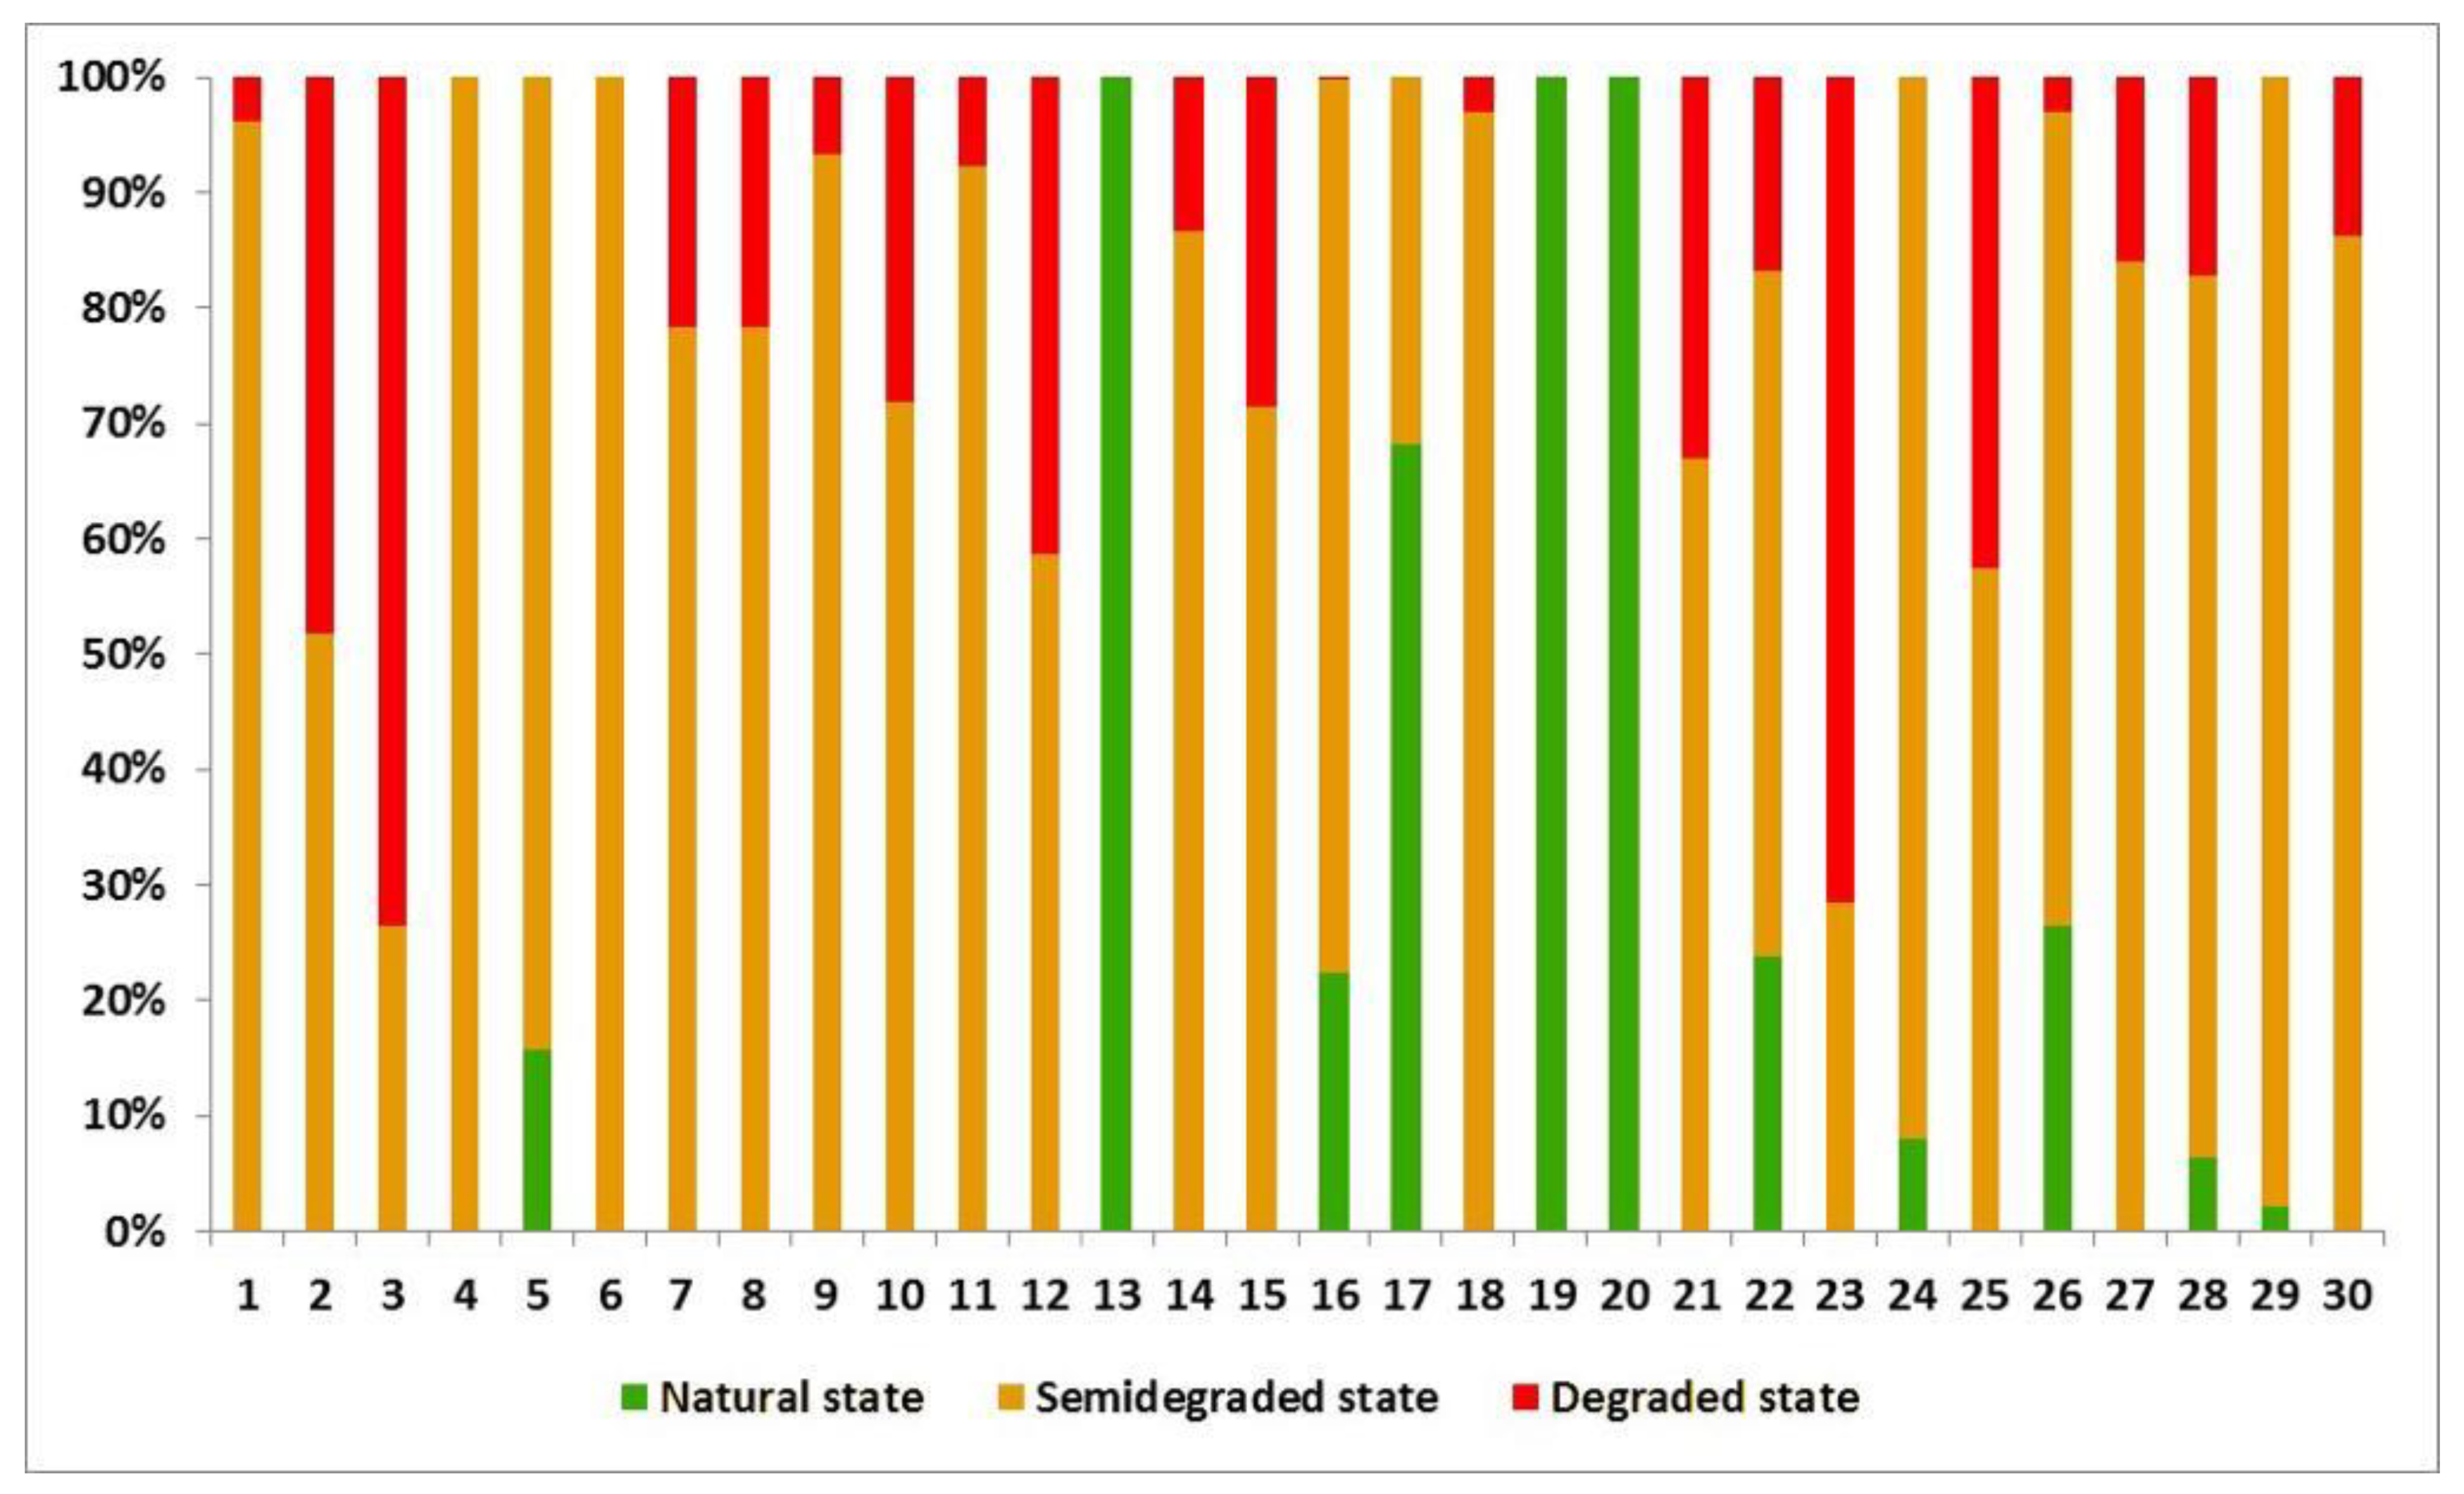
- Ecosystems in natural state: WRASTIC values between 0–30;
- Ecosystems in semi-degraded state: WRASTIC values between 31–63;
- Ecosystems in degraded state: WRASTIC values between 64–100.
- Ecosystems in natural state: WRASTIC values between 0–27;
- Ecosystems in semi-degraded state: WRASTIC values between 28–58;
- Ecosystems in degraded state: WRASTIC values between 59–100.
- Ecosystems in natural state: WRASTIC values between 0–21;
- Ecosystems in semi-degraded state: WRASTIC values between 22–44;
- Ecosystems in degraded state: WRASTIC values between 45–100.
2.4. Validation of the Proposed Methodology
3. Results and Discussion
4. Conclusions
Supplementary Materials
Author Contributions
Funding
Conflicts of Interest
References
- Zhang, P.; Liang, R.-F.; Zhao, P.-X.; Liu, Q.-Y.; Li, Y.; Wang, K.-L.; Li, K.-F.; Liu, Y.; Wang, P. The Hydraulic Driving Mechanisms of Cyanobacteria Accumulation and the Effects of Flow Pattern on Ecological Restoration in Lake Dianchi Caohai. Int. J. Environ. Res. Public Health 2019, 16, 361. [Google Scholar] [CrossRef] [PubMed]
- MEA. Ecosystems and Human Well-Being: Wetland and Water, Synthesis; World Resources Institute: Washington, DC, USA, 2005. [Google Scholar]
- Pecl, G.T.; Araujo, M.B.; Bell, J.; Blanchard, J.; Bonebrake, T.C.; Chen, I.; Clark, T.D.; Colwell, R.K.; Danielsen, F.; Evengard, B.; et al. Biodiversity redistribution under climate change: Impacts on ecosystems and human well-being. Science 2017, 335, 6332. [Google Scholar] [CrossRef] [PubMed]
- Santos, A.; Silva, R.; Assis, L.; Mauad, F. Defining environmental conservation levels considering anthropic activity in the Uberaba River Basin protected area. Ambiente Agua 2019, 14, 1–13. [Google Scholar] [CrossRef]
- WRI. World Resources 2000–2001. People and Ecosystems: The Fraying Web of Life. 2001. Available online: http://www.wri.org/publication/world-resources-2000-2001 (accessed on 15 September 2020).
- MEA. Ecosystems and Human Well-Being; Island Press: Washington, DC, USA, 2005. [Google Scholar]
- Morrice, J.A.; Danz, N.P.; Regal, R.R.; Kelly, J.R.; Niemi, G.J.; Reavie, E.D.; Hollenhorst, T.; Axler, R.P.; Trebitz, A.S.; Cotter, A.M.; et al. Human Influence on Water Quality in Great Lakes Coastal Wetlands. J. Environ. Manag. 2008, 41, 347–357. [Google Scholar] [CrossRef]
- Alvarez, X.; Valero, E.; Santos, R.M.B.; Varandas, S.G.P.; Sanches Fernandes, L.F.; Pacheco, F.A.L. Anthropogenic nutrients eutrophication in multiple land use watershed: Best management practices and policies for the protection of water resources. Land Use Policy 2017, 69, 1–11. [Google Scholar] [CrossRef]
- Havel, J.E.; Kovalenko, K.E.; Thomaz, S.M.; Amalfitano, S.; Kats, L.B. Aquatic invasive species: Challenges for the future. Hydrobiologia 2015, 750, 147–170. [Google Scholar] [CrossRef]
- Brönmark, C.; Hansson, L.A. The Biology of Lakes and Ponds; Oxford University Press: New York, NY, USA, 2005. [Google Scholar]
- Posthuma, L.; Zijp, M.C.; De Zwart, D.; de Meent, D.V.; Globevnik, L.; Koprivsek, M.; Focks, A.; Van Gils, J.; Birk, S. Chemical pollution imposes limitations to the ecological status of European surface waters. Sci. Rep. 2020, 10, 14825. [Google Scholar] [CrossRef]
- Backhaus, T.; Brack, W.; Van den Brink, P.J.; Deutschmann, B.; Hollert, H.; Posthuma, L.; Segner, H.; Seiler, T.-B.; Teodorovic, I.; Focks, A. Assessing the ecological impact of chemical pollution on aquatic ecosystems requires the systematic exploration and evaluation of four lines of evidence. Environ. Sci. Eur. 2019, 31, 98. [Google Scholar] [CrossRef]
- Woodward, G.; Perkins, D.M.; Brown, L.E. Climate change and freshwater ecosystems: Impacts across multiple levels of organization. Philos. Trans. R Soc. Lond. B Biol. Sci. 2010, 365, 2093–2106. [Google Scholar] [CrossRef] [PubMed]
- Edlund, M.B.; Almendinger, J.E.; Fang, X.; Hobbs, J.M.R.; VanderMeulen, D.D.; Key, R.L.; Engstrom, D.R. Effects of Climate Change on Lake Thermal Structure and Biotic Response in Northern Wilderness Lakes. Water 2017, 9, 678. [Google Scholar] [CrossRef]
- Wang, T.; Yan, J.; Ma, J.; Li, F.; Liu, C.; Cai, Y.; Chen, S.; Zeng, J.; Qi, Y. A Fuzzy Comprehensive Assessment and Hierarchical Management System for Urban Lake Health: A Case Study on the Lakes in Wuhan City, Hubei Province, China. Int. J. Environ. Res. Public Health 2018, 15, 2617. [Google Scholar] [CrossRef]
- EU. Directive 2000/60/EC of the European Parliament and of the Council establishing a framework for the Community action in the field of water policy. Off. J. L 2000, 327, 1–73. [Google Scholar]
- EEA. 10 Messages for 2010 Freshwater Ecosystems; Office for Official Publication of the European Union: Luxembourg, 2010. [Google Scholar]
- Parliament of Romania. Law no. 196/2015 for the Amendment and Completion of Law no. 107/1996; Official Gazette of Romania: Bucharest, Romania, 2015; Volume 522. [Google Scholar]
- EC. Decision No 1386/2013/EU of the European Parliament and of the Council of 20 November 2013 on a General Union Environment Action Program to 2020 ‘Living well, within the limits of our planet’. Off. J. Eur. Union L 2013, 354, 171–200. [Google Scholar]
- EU. Natura 2000 and Forests; Part I–II; Official Publications of the EC: Luxembourg, 2015. [Google Scholar]
- Santini, L.; Saura, S.; Rondinini, C. Connectivity of the global network of protected areas. Divers. Distrib. 2016, 22, 199–211. [Google Scholar]
- UN. Convention on Biological Diversity, Ch_XXVII_8, Vol 2. Chapter XXVII, Environment. 1992. Available online: https://treaties.un.org/doc/Treaties/1992/06/19920605%2008-44%20PM/Ch_XXVII_08p.pdf (accessed on 7 February 2021).
- EU. Communication: EU Biodiversity Strategy for 2030 Bringing Nature back into Our Lives; European Commission, Directorate-General for Environment: Brussels, Belgium, 2020. [Google Scholar]
- Krupa, E.G.; Barinova, S.S.; Romanova, S.M. Ecological Mapping in Assessing the Impact of Environmental Factors on the Aquatic Ecosystem of the Arys River Basin, South Kazakhstan. Diversity 2019, 11, 239. [Google Scholar] [CrossRef]
- EC. Mapping and Assessment of Ecosystems and their Services. Mapping and Assessing the Condition of Europe’s Ecosystems: Progress and Challenges, Technical Report. 2016. Available online: http://ec.europa.eu/environment/nature/knowledge/ecosystem_assessment/pdf/3rdMAESReport_Condition.pdf (accessed on 7 February 2020).
- Osborne, L.L.; Kovacic, D.A. Riparian vegetated buffer strips in water- quality restoration and stream management. Freshw. Biol. 1993, 29, 243–258. [Google Scholar] [CrossRef]
- Swanson, F.J.; Gregory, S.V.; Sedell, J.R.; Campbell, A.G. Land-water interactions: The riparian zone. In Analysis of Coniferous Forest Ecosystems in the Western United States; Hutchinson Ross: Stroudsburg, PA, USA, 1982. [Google Scholar]
- Romanelli, A.; Esquius, K.S.; Massone, H.E.; Escalante, A.H. GIS-based pollution hazard mapping and assessment framework of shallow lakes: Southeastern Pampean lakes (Argentina) as a case study. Environ. Monit. Assess. 2013, 185, 6943–6961. [Google Scholar] [CrossRef]
- Mirzaei, M.; Solgi, E.; Abdollrasoul, S.M. Evaluation of surface water quality by NDFWQI Index and pollution risk assessment, using WRASTIC index in 2015. Arch. Hyg. Sci. 2016, 5, 264–277. [Google Scholar]
- ESRI. ArcGIS Desktop: Release 10; Environmental Systems Research Institute: Redlands, CA, USA, 2011. [Google Scholar]
- Zionts, S. MCDM: If Not a Roman Numeral, then What? Interfaces 1979, 9, 94–101. [Google Scholar] [CrossRef]
- Kylili, A.; Christoforou, E.; Fokaides, P.; Polycarpou, P. Multicriteria analysis for the selection of the most appropriate energy crops: The case of Cyprus. Int. J. Sustain. Energy 2016, 35, 47–58. [Google Scholar] [CrossRef]
- Pastorino, P.; Prearo, M. High-Mountain Lakes, Indicators of Global Change: Ecological Characterization and Environmental Pressures. Diversity 2020, 12, 260. [Google Scholar] [CrossRef]
- Coldea, G.; Ursu, T.M. A syntaxonomic revision of floodplain forest communities in Romania. Tuexenia 2016, 36, 9–22. [Google Scholar]
- Roman, A.; Ursu, T.M.; Lăzărescu, V.A.; Opreanu, C.H.; Fărcaş, S. Visualization techniques for ALS-derived DTM in forested steep terrain: Detecting archaeological remains in the subsurface. Geoarchaeology Int. J. 2017, 32, 549–562. [Google Scholar] [CrossRef]
- Sevianu, E.; Stermin, A.N.; Malos, C.; Reti, K.; Munteanu, D.; David, A. GIS modeling for the ecological restoration of a nature reserve: Legii lake and valley (NW Romania) A case study. Carpathian J. Earth Environ. Sci. 2015, 10, 173–180. [Google Scholar]
- Roşca, S.; Bilaşco, Ş.; Petrea, D.; Fodorean, I.; Vescan, I.; Filip, S. Application of landslide hazard scenarios at annual scale in the Niraj River basin (Transylvania Depression, Romania). Nat. Hazards 2015, 77, 1573–1592. [Google Scholar] [CrossRef]
- Jorgensen, S.; Costanza, R.; Xu, F.L. Handbook of Ecological Indexes for Assessment of Ecosystem Health; Taylor & Francis: London, UK, 2005. [Google Scholar]
- Nygaard, G. Talverne Fra Danst. Phytoplankton; Gyldendal: Copenhagen, Denmark, 1976; p. 22. [Google Scholar]
- Smith, R.W.; Bergen, M.; Weisberg, S.B.; Cadien, D.; Dalkey, A.; Montagne, D.; Stull, J.K.; Velarde, R.G. Benthic response index for assessing infaunal communities on the Mainland shelf of Southern California. Ecol. Appl. 2001, 11, 1073–1087. [Google Scholar] [CrossRef]
- Moreno, D.; Aguilera, P.A.; Castro, H. Assessment of the conservation status of seagrass (Posidonia oceanica) meadows: Implications for monitoring strategy and the decision-making process. Biol. Conserv. 2001, 102, 325–332. [Google Scholar] [CrossRef]
- Stirn, J.; Avcin, A.J.; Kerzan, I.; Marcotte, B.M.; Meith-Avcin, N.; Vriser, B.; Vukovic, S. Selected biological methods for assessment of pollution. In Marine Pollution and Waste Disposal; Pearson, E.A., Defraja, E., Eds.; Pergamon Press: Oxford, UK, 1971; pp. 307–328. [Google Scholar]
- Vollenweider, R.A.; Giovanardi, F.; Montanari, G.; Rinaldi, A. Characterization of the trophic conditions of marine coastal waters with special reference to the NW Adriatic Sea: Proposal for a trophic scale, turbidity and generalized water quality index. Environmetrics 1998, 9, 329–357. [Google Scholar] [CrossRef]
- Simboura, N.; Zenetos, A. Benthic indicators to use in Ecological Quality classification of Mediterranean soft bottom marine ecosystems, including a new Biotic Index. Mediterr. Mar. Sci. 2002, 3, 77–111. [Google Scholar] [CrossRef]
- Engle, V.; Summers, J.K.; Gaston, G.R. A benthic index of environmental condition of Gulf of Mexico. Estuaries 1994, 17, 372–384. [Google Scholar] [CrossRef]
- Aazami, J.; Esmaili-Sari, A.; Abdoli, A.; Sohrabi, H.; Van den Brink, P.J. Monitoring and assessment of water health quality in the Tajan River, Iran using physicochemical, fish and macroinvertebrates indices. J. Environ. Health Sci. Eng. 2015, 13, 29. [Google Scholar] [CrossRef] [PubMed]
- Huang, J.; Pang, Y.; Zhang, X.; Tong, Y. Water Environmental Capacity Calculation and Allocation of the Taihu Lake Basin in Jiangsu Province Based on Control Unit. Int. J. Environ. Res. Public Health 2019, 16, 3774. [Google Scholar] [CrossRef] [PubMed]
- Loucks, D.P.; van Beek, E. Water Quality Modeling and Prediction. In Water Resource Systems Planning and Management; Springer: Cham, Switzerlands, 2017. [Google Scholar] [CrossRef]
- Onose, D.A.; Niţă, M.R.; Ciocănea, C.I.; Patroescu, M.; Vânău, G.O.; Bodescu, F. Identifying critical areas of exposure to environmental conflicts using expert opinion and multi-criteria analysis. Carpathian J. Earth Environ. Sci. 2015, 10, 15–28. [Google Scholar]


| Source | Data (Type) | Description | Use |
|---|---|---|---|
| Copernicus Land Monitoring Service | Corine Land Cover v.2012 (Polygon) | Double coverage of satellite images was used. The mapping was done by computer-assisted photo-interpretation technology. | Calculation of Wastewater–Recreation–Agriculture–Size–Transportation–Industry–Cover (WRASTIC) Index |
| Copernicus Pan European High-Resolution Data | Permanent Water Bodies v.2012 (Polygon) | Information on the various land use categories, in high resolution. The delimitation of water bodies was done as a binary product (presence/absence). Includes the permanent water bodies delimited with a spatial resolution of 20 m. | Identification of lakes |
| European Environmental Agency | Digital Elevation Model over Europe (EU-DEM) | EU-DEM with a 25 m resolution and vertical accuracy of +/− 7 m Root Mean Square Error (RMSE), based on Shuttle Radar Topography Mission (SRTM) and Advanced Spaceborne Thermal Emission and Reflection Radiometer (ASTER) Global Digital Elevation Model (GDEM). The original reference system is The European Terrestrial Reference System 1989 (ETRS89). The tiles being aggregated 100 × 100 km tiles re-projected in TRS-LAEA reference system. | Calculation of Hazard Index (HI) |
| European Environmental Agency | Major sources of pollution (Point) | The major sources of pollution were extracted from the European Pollutant Release and Transfer Register (E-PRTR), which contains reports of over 30,000 facilities with high polluting potential with a coverage of 65 economic activities from EU countries. | Calculation of WRASTIC Index |
| Open Street Map (OSM) | OSM dataset (Polygon) | The data are obtained by systematic analyses of the land any changes being introduced in the OSM database via a supervised review. The availability of satellite data and photogrammetric images led to an important increase of the automation level. | Calculation of WRASTIC Index |
| National Agency for Mineral Resources | Exploitation perimeters (Raster) | The map was done following the conclusion of the exploitation agreements and development plans of all-natural resources. | Calculation of WRASTIC Index |
| Ministry of Environment | Special Areas of Conservation (SAC), Sites of Community Importance (SCI) and Special Protection Areas (SPA) Limits (Polygon) | Delimitation of SAC, SCI and SPA, part of Natura 2000 network. | Calculation of WRASTIC Index |
| European Soil Data Centre | Two-Sided Geometric Distribution (TSGD) Eurasia (Polygon) | The data was developed for the use of Land Resource Management agencies, of the Joint Research Centre of EC, in collaboration with the European Soil Bureau Network. | HI Index |
| European Environmental Agency | Urban Waste Water Treatment, Agglomeration—overall compliance (Point) | Information on the implementation of Directive UE 27—Urban Waste Water Treatment: localization of treatment plants, the processing stages of the wastewater and the processing degree compared to scale of production. | WRASTIC Index |
| National Agency of Cadaster and Land Registration | Administrative Boundary stOrder (Polygon) | Data regarding the structure of the Romanian territory in Local Administrative Units (LAU) units | Mapping of lakes |
| United States Geological Survey | Landsat 8 (Raster) | Satellite imagery with a spatial resolution from 15 to 100 m, global scale. Landsat 8 operates in visible infrared spectrum, close infrared and thermal infrared spectrum. | Validation of results and control |
| No | Indicator | Sub-Indicator |
|---|---|---|
| 1 | Wastewaters (W) | Aggregation nuclei |
| Treatment plants | ||
| 2 | Recreational activities (R) | Aquatic sports |
| Access | ||
| Tourist infrastructure | ||
| 3 | Agricultural activities (A) | Permanent irrigation |
| Land used in agricultural activities in the reception basin | ||
| 4 | Size of watershed (S) | N/A |
| 5 | Transportation infrastructure (T) | Railways |
| Roads | ||
| 6 | Industrial activities (I) | Industrial activities |
| Exploitation activities | ||
| 7 | Coverance with natural vegetation (C) | N/A |
| No | Indicator |
|---|---|
| 1 | Land slope |
| 2 | Slope Aspect |
| 3 | Soil permeability |
| Category of Use | Subcategory | Interval | Score | Weight |
|---|---|---|---|---|
| Wastewaters (W) | Aggregation nuclei | Natural Breaks (ArcGIS) | 1–4 | 3 |
| Treatment plants | Primary processing | 3 | ||
| Secondary processing | 2 | |||
| Tertiary processing | 1 | |||
| Recreational activities (R) | Aquatic sports | Motor-driven | 5 | 3 |
| Non-motor-driven | 4 | |||
| Access | By car | 3 | ||
| Pedestrian | 2 | |||
| Prohibited | 1 | |||
| Tourist infrastructure | Present within 50 m | 4 | ||
| Absent within 50 m | 0 | |||
| Agricultural activities (A) | Permanent irrigation | <10% | 1 | 3 |
| 10–25% | 2 | |||
| 25–50% | 3 | |||
| 50–75% | 4 | |||
| 75–100% | 5 | |||
| Land used in agricultural activities in the reception basin | <20% | 1 | 5 | |
| 20–40% | 2 | |||
| >30% | 3 | |||
| Size of watershed (S) | N/A | <38.85 km2 | 1 | 1 |
| 38.85 km2–155.39 km2 | 2 | |||
| 155.39 km2–388.47 km2 | 3 | |||
| 388.47 km2–1942.35 km2 | 4 | |||
| >1942.35 km2 | 5 | |||
| Ways of transport (T) | Railways | Main railway line | 4 | 1 |
| Tourist railway with narrow gauge | 1 | |||
| Roads | Highways or ring roads | 5 | ||
| National roads | 4 | |||
| County or local roads | 3 | |||
| Unpaved roads | 1 | |||
| No way of transport | 0 | |||
| Industrial activities (I) | Industrial activities | Present | 3 | 4 |
| Absent | 0 | |||
| Exploitation activities | Mines, quarries or landfills | 5 | ||
| Exploitation perimeters | 1 | |||
| No exploitation activity | 0 | |||
| Coverage with natural vegetation (C) | N/A | <5% | 5 | 1 |
| 5–20% | 4 | |||
| 20–35% | 3 | |||
| 35–50% | 2 | |||
| >50% | 1 |
| Parameter | Interval | Score |
|---|---|---|
| Land slope | <the 25th percentile | 1 |
| >the 25th, <the 50th percentile | 3 | |
| >the 50th, <the 75th percentile | 4 | |
| >the 75th percentile | 5 | |
| Slope Aspect | Exposition privileges the accumulation of pollutants | 5 |
| The exposition does not significantly affect the accumulation of pollutants | 3 | |
| The exposition does not privilege the accumulation of pollutants | 1 | |
| Soil permeability | Clayish soil (smooth texture, low permeability) | 5 |
| Sandy soil (sandy texture, average permeability) | 3 | |
| Gravel (rough texture, high permeability) | 1 |
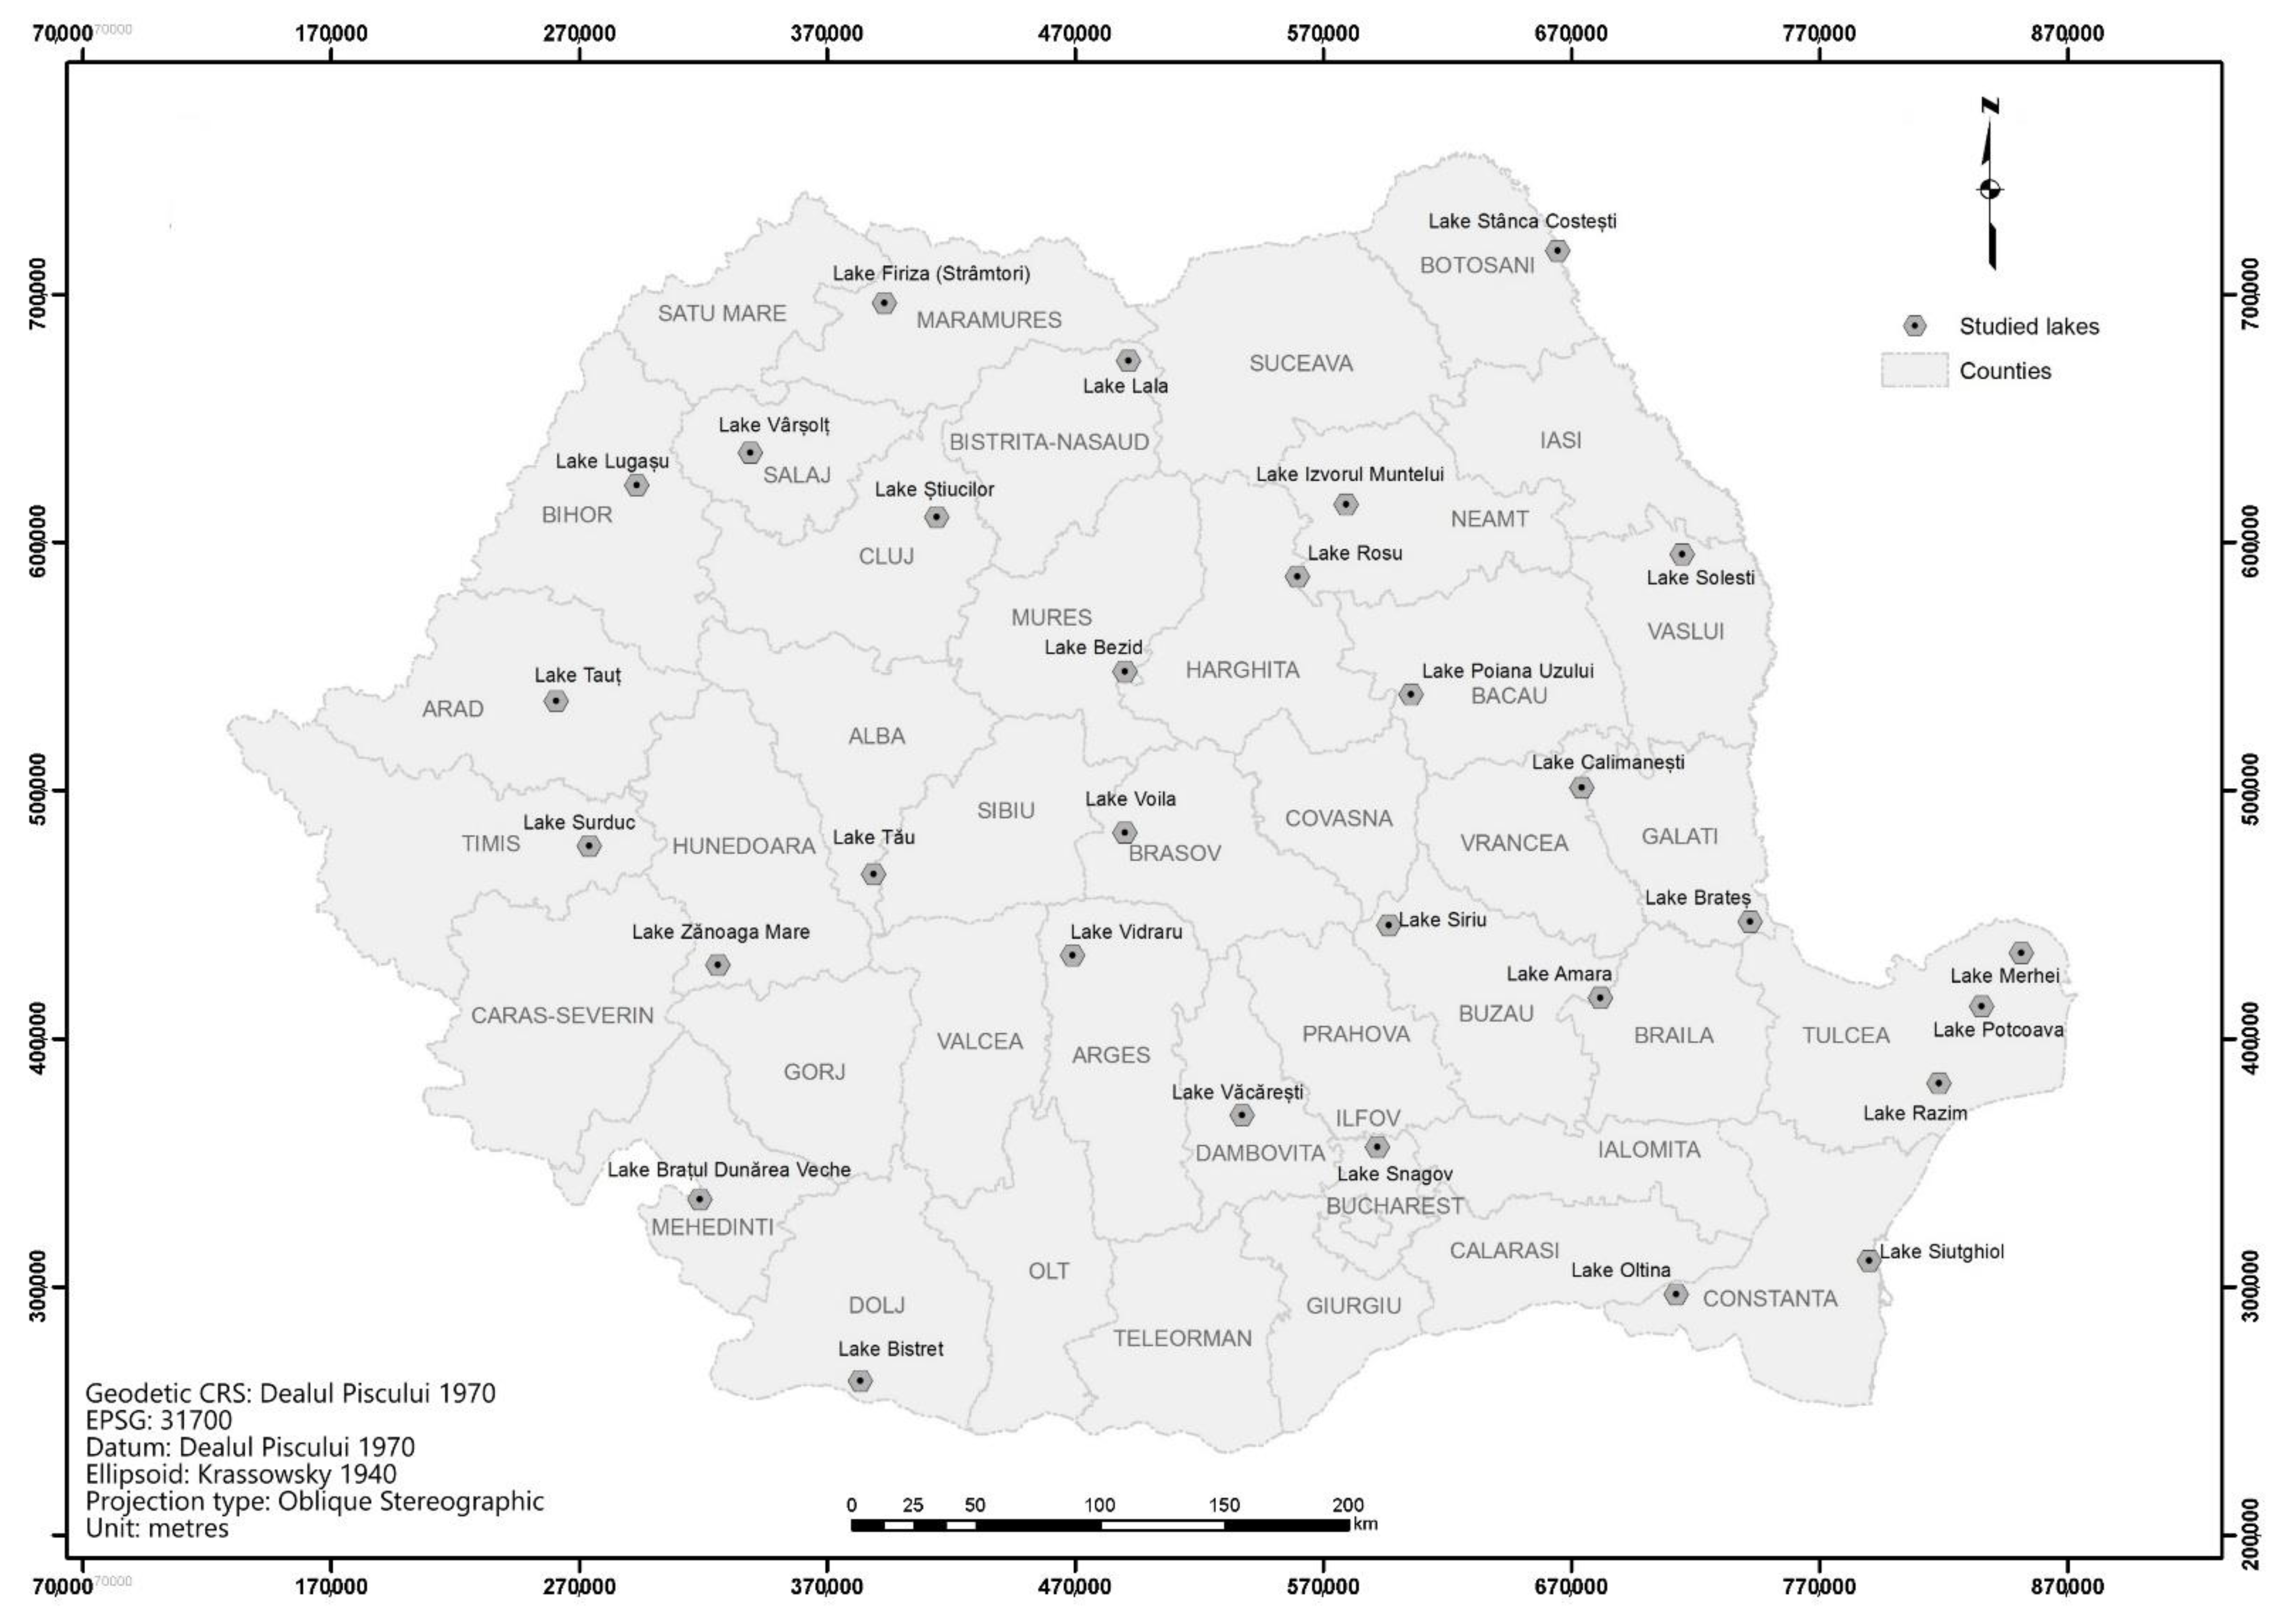
| No | Lake Name | Area (ha) | County | Origin | Included in Protected Areas | Morphologic Unit |
|---|---|---|---|---|---|---|
| 1 | Lake Voila | 217 | Brasov | Man made | Yes | Fagaras Depression |
| 2 | Lake Snagov | 422 | Ilfov | Natural | Yes | Snagov Plain |
| 3 | Lake Vacaresti | 126 | Dambovita | Man made | No | Targoviste Plain |
| 4 | Lake Vidraru | 803 | Arges | Man made | Yes | Lovistei Mountains |
| 5 | Lake Tau | 78 | Sibiu | Man made | Yes | Cindrel Mountains |
| 6 | Lake Firiza (Stramtori) | 104 | Maramures | Man made | No | Ignis Mountains |
| 7 | Lake Surduc | 352 | Timis | Man made | Yes | Lugojului Hills |
| 8 | Lake Taut | 176 | Arad | Man made | Yes | Tauti Depression |
| 9 | Lake Bezid | 162 | Mures | Man made | Yes | Tarnavelor Sub-Carpathian Region |
| 10 | Lake Lugasu | 325 | Bihor | Man made | Yes | Vad-Oradea Depression |
| 11 | Lake Stiucilor | 31 | Cluj | Natural | Yes | Sicului Hills |
| 12 | Lake Varsolt | 324 | Salaj | Man made | No | Simleu Depression |
| 13 | Lake Zanoaga Mare | 6 | Hunedoara | Natural | Yes | Retezat Mountains |
| 14 | Lake Oltina | 1958 | Constanta | Natural | Yes | Oltina Plateau |
| 15 | Lake Siutghiol | 1756 | Constanta | Natural | Yes | Istria Plateau |
| 16 | Lake Rosu | 165 | Harghita | Natural | Yes | Hasmas Mountains |
| 17 | Lake Lala | 44 | Bistrita-Nasaud | Natural | Yes | Rodna Mountains |
| 18 | Lake Bistret | 409 | Dolj | Natural | Yes | Bistretului Alluvial Plain |
| 19 | Lake Potcoava | 90 | Tulcea | Natural | Yes | Danube Delta |
| 20 | Lake Merhei | 1385 | Tulcea | Natural | Yes | Danube Delta |
| 21 | Lake Calimanesti | 801 | Galati | Man made | Yes | Siretului Plain |
| 22 | Lake Siriu | 195 | Buzau | Man made | Yes | Podu Calului Mountains |
| 23 | Lake Brates | 2199 | Galati | Man made | Yes | Brates Alluvial Plain |
| 24 | Lake Poiana Uzului | 265 | Bacau | Man made | No | Slanicului Hills |
| 25 | Lake Amara | 700 | Braila | Natural | Yes | Buzaului Alluvial Plain |
| 26 | Lake Razim | 39,569 | Tulcea | Natural | Yes | Danube Delta |
| 27 | Lake Solesti | 374 | Vaslui | Man made | No | Repedea-Zapodeni Plateau |
| 28 | Lake Bratul Dunarea Veche | 186 | Mehedinti | Natural | Yes | Drobeta-Bala Corridor |
| 29 | Lake Izvorul Muntelui | 2843 | Neamt | Man made | Yes | Ceahlau Mountains |
| 30 | Lake Stanca Costesti | 4954 | Botosani | Man made | Yes | Prut Corridor |
| No | Lake Name | Results of the WRASTIC Index | |||||||
|---|---|---|---|---|---|---|---|---|---|
| (W) | (R) | (A) | (a) | (S) | (T) | (I) | (C) | ||
| 1 | Voila | 0 | 5 | 3 | 2 | 1 | 1 | 0 | 2 |
| 2 | Snagov | 3 | 5 | 3 | 1 | 2 | 4 | 1 | 2 |
| 3 | Vacaresti | 3 | 5 | 5 | 2 | 1 | 3 | 3 | 4 |
| 4 | Vidraru | 2 | 5 | 1 | 1 | 2 | 4 | 0 | 1 |
| 5 | Tau | 2 | 5 | 1 | 1 | 1 | 4 | 0 | 1 |
| 6 | Firiza | 2 | 5 | 1 | 1 | 2 | 4 | 1 | 1 |
| 7 | Surduc | 3 | 5 | 3 | 2 | 2 | 3 | 0 | 1 |
| 8 | Taut | 3 | 5 | 3 | 2 | 2 | 3 | 0 | 1 |
| 9 | Bezid | 0 | 5 | 1 | 4 | 1 | 3 | 1 | 1 |
| 10 | Lugasu | 3 | 5 | 3 | 2 | 1 | 5 | 0 | 4 |
| 11 | Stiucilor | 2 | 5 | 5 | 3 | 1 | 4 | 0 | 3 |
| 12 | Varsolt | 3 | 5 | 5 | 1 | 1 | 4 | 1 | 2 |
| 13 | Zanoaga Mare | 0 | 2 | 1 | 1 | 1 | 1 | 0 | 2 |
| 14 | Oltina | 3 | 5 | 5 | 1 | 2 | 3 | 1 | 4 |
| 15 | Siutghiol | 2 | 5 | 3 | 1 | 2 | 5 | 3 | 4 |
| 16 | Rosu | 2 | 5 | 1 | 1 | 1 | 1 | 0 | 1 |
| 17 | Lala | 3 | 2 | 1 | 1 | 1 | 1 | 0 | 1 |
| 18 | Bistret | 3 | 2 | 1 | 1 | 1 | 4 | 1 | 5 |
| 19 | Lake Potcoava | 2 | 1 | 1 | 1 | 2 | 0 | 0 | 1 |
| 20 | Lake Merhei | 0 | 1 | 1 | 1 | 2 | 0 | 0 | 1 |
| 21 | Calimanesti | 2 | 5 | 5 | 1 | 2 | 3 | 3 | 2 |
| 22 | Siriu | 0 | 5 | 1 | 1 | 1 | 4 | 3 | 1 |
| 23 | Brates | 3 | 5 | 5 | 1 | 2 | 5 | 3 | 5 |
| 24 | Poiana Uzului | 2 | 5 | 1 | 1 | 2 | 3 | 1 | 1 |
| 25 | Amara | 3 | 5 | 5 | 1 | 2 | 4 | 0 | 4 |
| 26 | Razim | 0 | 5 | 1 | 1 | 4 | 4 | 0 | 4 |
| 27 | Solesti | 3 | 5 | 5 | 2 | 1 | 4 | 0 | 3 |
| 28 | Bratul Dunarea Veche | 1 | 1 | 1 | 2 | 1 | 4 | 5 | 1 |
| 29 | Izvorul Muntelui | 2 | 5 | 1 | 1 | 2 | 4 | 0 | 1 |
| 30 | Stanca Costesti | 0 | 5 | 3 | 1 | 1 | 0 | 0 | 4 |
| No | Lake Name | Scores Obtained for HI | Degradation State | ||
|---|---|---|---|---|---|
| Slope | Aspect | Permeability | |||
| 1 | Voila | 1 | 5 | 3 | Semidegraded |
| 2 | Snagov | 1 | 3 | 1 | Semidegraded |
| 3 | Vacaresti | 1 | 3 | 1 | Degraded |
| 4 | Vidraru | 4 | 5 | 1 | Semidegraded |
| 5 | Tau | 4 | 5 | 1 | Semidegraded |
| 6 | Firiza | 3 | 5 | 1 | Semidegraded |
| 7 | Surduc | 3 | 3 | 1 | Semidegraded |
| 8 | Taut | 3 | 3 | 1 | Semidegraded |
| 9 | Bezid | 3 | 5 | 1 | Semidegraded |
| 10 | Lugasu | 1 | 5 | 1 | Semidegraded |
| 11 | Stiucilor | 3 | 3 | 1 | Semidegraded |
| 12 | Varsolt | 1 | 5 | 1 | Semidegraded |
| 13 | Zanoaga Mare | 3 | 3 | 1 | Natural |
| 14 | Oltina | 3 | 5 | 1 | Semidegraded |
| 15 | Siutghiol | 2 | 3 | 1 | Semidegraded |
| 16 | Rosu | 4 | 5 | 1 | Semidegraded |
| 17 | Lala | 4 | 3 | 1 | Natural |
| 18 | Bistret | 1 | 3 | 5 | Semidegraded |
| 19 | Lake Potcoava | 1 | 3 | 1 | Natural |
| 20 | Lake Merhei | 1 | 3 | 1 | Natural |
| 21 | Calimanesti | 1 | 5 | 1 | Semidegraded |
| 22 | Siriu | 4 | 5 | 1 | Semidegraded |
| 23 | Brates | 1 | 5 | 5 | Degraded |
| 24 | Poiana Uzului | 3 | 5 | 5 | Semidegraded |
| 25 | Amara | 1 | 5 | 1 | Semidegraded |
| 26 | Razim | 1 | 3 | 1 | Semidegraded |
| 27 | Solesti | 3 | 5 | 1 | Semidegraded |
| 28 | Bratul Dunarea Veche | 1 | 5 | 1 | Semidegraded |
| 29 | Izvorul Muntelui | 3 | 3 | 1 | Semidegraded |
| 30 | Stanca Costesti | 1 | 3 | 1 | Semidegraded |
Publisher’s Note: MDPI stays neutral with regard to jurisdictional claims in published maps and institutional affiliations. |
© 2021 by the authors. Licensee MDPI, Basel, Switzerland. This article is an open access article distributed under the terms and conditions of the Creative Commons Attribution (CC BY) license (https://creativecommons.org/licenses/by/4.0/).
Share and Cite
Avram, S.; Cipu, C.; Corpade, A.-M.; Gheorghe, C.A.; Manta, N.; Niculae, M.-I.; Pascu, I.S.; Szép, R.E.; Rodino, S. GIS-Based Multi-Criteria Analysis Method for Assessment of Lake Ecosystems Degradation—Case Study in Romania. Int. J. Environ. Res. Public Health 2021, 18, 5915. https://doi.org/10.3390/ijerph18115915
Avram S, Cipu C, Corpade A-M, Gheorghe CA, Manta N, Niculae M-I, Pascu IS, Szép RE, Rodino S. GIS-Based Multi-Criteria Analysis Method for Assessment of Lake Ecosystems Degradation—Case Study in Romania. International Journal of Environmental Research and Public Health. 2021; 18(11):5915. https://doi.org/10.3390/ijerph18115915
Chicago/Turabian StyleAvram, Sorin, Corina Cipu, Ana-Maria Corpade, Carmen Adriana Gheorghe, Nicolae Manta, Mihaita-Iulian Niculae, Ionuţ Silviu Pascu, Róbert Eugen Szép, and Steliana Rodino. 2021. "GIS-Based Multi-Criteria Analysis Method for Assessment of Lake Ecosystems Degradation—Case Study in Romania" International Journal of Environmental Research and Public Health 18, no. 11: 5915. https://doi.org/10.3390/ijerph18115915
APA StyleAvram, S., Cipu, C., Corpade, A.-M., Gheorghe, C. A., Manta, N., Niculae, M.-I., Pascu, I. S., Szép, R. E., & Rodino, S. (2021). GIS-Based Multi-Criteria Analysis Method for Assessment of Lake Ecosystems Degradation—Case Study in Romania. International Journal of Environmental Research and Public Health, 18(11), 5915. https://doi.org/10.3390/ijerph18115915